



Abstract
Interaural differences in stimulus intensity and timing are major cues for sound localization. In mammals, these cues are first processed in the lateral and medial superior olive by interaction of excitatory and inhibitory synaptic inputs from ipsi- and contralateral cochlear nucleus neurons. To preserve sound localization acuity following changes in the acoustic environment, the processing of these binaural cues needs neuronal adaptation. Recent studies have shown that binaural sensitivity adapts to stimulation history within milliseconds, but the actual extent of binaural adaptation is unknown. In the current study, we investigated long-term effects on binaural sensitivity using extracellular in vivo recordings from single neurons in the dorsal nucleus of the lateral lemniscus that inherit their binaural properties directly from the lateral and medial superior olives. In contrast to most previous studies, we used a noninvasive approach to influence this processing. Adult gerbils were exposed for 2 weeks to moderate noise with no stable binaural cue. We found monaural response properties to be unaffected by this measure. However, neuronal sensitivity to binaural cues was reversibly altered for a few days. Computational models of sensitivity to interaural time and level differences suggest that upregulation of inhibition in the superior olivary complex can explain the electrophysiological data.
Introduction
Our ability to pinpoint a sound source is remarkably good. The dominant acoustic cues used to localize sound sources in the horizontal plane are the disparities in time of arrival and level of sound between the two ears, which vary with the direction of the sound source. We are able to detect interaural level differences (ILDs) of a few decibels and interaural time differences (ITDs) of a few microseconds (Blauert, 1997). Initial binaural processing takes place in the superior olivary complex (SOC), where binaural excitatory and inhibitory inputs converge (for review, see Grothe et al., 2010) (see Fig. 1A). ILDs of high-frequency sounds are processed in the lateral superior olive (LSO), while ITDs of low-frequency sounds are processed in both the lateral and the medial superior olive (MSO) (Irvine, 1992; Yin, 2002; Tollin and Yin, 2005). Our extraordinary binaural sensitivity requires temporally precise neuronal processing, which needs to operate under quite diverse, often rapidly changing circumstances. Adaptation of the underlying neuronal mechanisms at different time scales would help guarantee high spatial acuity during changes in the stimulus statistics of the sound environment, such as increased loudness or background noise. Neurons in the LSO have been shown to adapt their binaural sensitivity depending on sounds that precede the test stimulus by a few milliseconds (Finlayson and Adam, 1997; Park et al., 2008). One mechanism for short-term adaptation of binaural sensitivity is a differential shift in the synaptic weights of excitatory and inhibitory inputs to MSO and LSO via presynaptic GABAB receptor activation (Magnusson et al., 2008; Hassfurth et al., 2010). Most investigations of long-term adaptation of binaural sensitivity in the brainstem and midbrain have used invasive approaches, such as cochlear ablations or acoustic traumata (McAlpine et al., 1997; Suneja et al., 1998a,b, 2000; Illing et al., 2000; Kaltenbach et al., 2000; Mossop et al., 2000; Potashner et al., 2000; Michler and Illing, 2002; Alvarado et al., 2004; Muly et al., 2004; Zhang et al., 2004). Studies investigating reversible long-term adaptation at early stages of the mammalian binaural system, however, are lacking.
Figure 1.

Experimental conditions. A, Schematic drawing of the first stages of the binaural auditory pathway, including the SOC and the DNLL where the in vivo extracellular recordings were made. Inputs and outputs of the MSO are illustrated for the left hemisphere, whereas inputs and outputs of the LSO are shown in the right hemisphere. Triangles indicate excitatory inputs. Bars indicate inhibitory inputs. VCN indicates ventral cochlear nucleus. B, Schematic diagram of the experimental design. The light gray boxes indicate how long the animals spent in a normal acoustic environment (nae), the white boxes indicate the times spent in the noisebox. The dark gray boxes mark the periods during which electrophysiological recordings (er) were made.
In the present study, we investigated long-term adaptation of binaural processing in the adult brainstem after continuous exposure to moderate omnidirectional noise. We made extracellular, single-unit recordings in vivo in the dorsal nucleus of the lateral lemniscus (DNLL) of adult gerbils, where both ITD- and ILD-sensitive neurons are found (see Fig. 1A). Their binaural properties are largely inherited from direct projections of the MSO and the LSO (Glendenning et al., 1981; Shneiderman et al., 1988; Oliver, 2000; Siveke et al., 2006). We found that ITD and ILD sensitivity is reversibly altered for a few days after noise exposure. Employing computational models of ITD and ILD sensitivity, we show that the observed long-term adaptation to noise exposure can be accounted for by changing the balance of input strength to the binaural neurons of the SOC.
Materials and Methods
Animals.
We investigated three groups of adult (3–4 months old) Mongolian gerbils (Meriones unguiculatus) of either sex. All animals were raised in a normal acoustic environment. The control group (N = 24) was never exposed to noise. A second group, called the noisebox group (N = 17), was exposed to omnidirectional white noise for 14 d and tested within the following 7 d. A third group, referred to as the recovery group (N = 15), was treated like the second, but was allowed to recover from noise exposure in a normal acoustic environment for at least 14 d before testing (see Fig. 1B).
Groups of five individuals were placed in a noisebox for 14 d, as described previously (Kapfer et al., 2002; Magnusson et al., 2005; Seidl and Grothe, 2005). Omnidirectional white noise (50 Hz–20 kHz) with an average rms of 75 dB SPL was continuously generated by two independent noise generators (Rhode & Schwarz, or Noise Generator Type 1405, Bruel & Kjaer) and presented via two sets of six pairs of high- and low-frequency speakers. On each of the six sides of the noisebox, the two different noise signals were presented by two independent pairs of speakers. Before and after the experiment, the acoustic noise was checked using a 0.5 inch microphone (Type 4192, Bruel & Kjaer), a measuring amplifier (Type 2636, Bruel & Kjaer), and an FFT spectrum analyzer (SR770 FFT, Stanford Research Systems).
All experiments were approved in accordance with the stipulations of German law on the protection of animals (Tierschutzgesetz; AZ 2112531-40/01, AZ 55.2-1-54-2531-57-05).
In vivo extracellular recordings.
Surgical, electrophysiological, and stimulation procedures have been described previously (Siveke et al., 2006). Briefly, animals were initially anesthetized with an intraperitoneal injection (0.5 ml per 100 g of body weight) of a mixture of ketamine (20%) and xylazine (2%) diluted in 0.9% NaCl solution. Supplemental doses of 0.05 ml of the same mixture were given subcutaneously every 30 min or when needed. To gain access to the DNLL, a craniotomy was performed 1500–2200 μm lateral to the midline and 500–900 μm caudal to lambda (caudal intersection of the skull fissures). Single-unit responses were recorded extracellularly using tungsten electrodes (1 or 5 MΩ; World Precision Instruments) or glass electrodes filled with 1 m NaCl (∼10 MΩ). The amplified and filtered (0.3–3 kHz) action potentials (APs) were fed into a computer via an analog-to-digital converter (RP2-1, Tucker Davis Technologies). Clear isolation of action potentials from a single neuron (signal-to-noise ratio >5) was guaranteed by visual inspection (stable size and shape) on a spike-triggered oscilloscope and by off-line spike-cluster analysis (Jan Schnupp's Brainware, Tucker-Davis Technologies). Stimuli were generated at a sampling rate of 50 kHz by System III (Tucker-Davis Technologies). Digitally generated stimuli were converted to analog signals (RP2-1, Tucker-Davis Technologies) and attenuated (PA5, Tucker-Davis Technologies). Special headphone drivers and speakers were used to present either low-frequency stimuli (<2 kHz) to investigate ITD sensitivity (HB7, Tucker-Davis Technologies; Stereo Dynamic Earphones, MDR-EX70LP, Sony) or high-frequency sounds (>2 kHz) to investigate ILD sensitivity (ED1, Tucker-Davis Technologies; electrostatic speakers, Tucker-Davis Technologies).
In all cases, stimuli were presented in randomized order. In the standard setting, the stimulus duration was 200 ms plus 5 ms cosine rise/fall times. Stimuli were presented at a rate of 2 Hz. To search for ILD-sensitive neurons, which in the DNLL are most often inhibited by the ipsilateral ear, we presented noise monaurally to the contralateral ear. To search for ITD-sensitive neurons, uncorrelated noise was presented binaurally. In those neurons inhibited by ipsilateral stimulation, the characteristic frequency (CF) and absolute threshold (thr) were identified using contralateral pure-tone stimulation. In all other stimulations, we used binaural (ITD/ILD = 0) pure tones. The frequency that elicited responses at the lowest sound intensity was defined as CF. Meanwhile, the lowest sound intensity evoking a noticeable response at CF was defined as thr. Monaural and binaural response properties were determined by stimulating with pure tones at different frequencies (±0.8 * CF; step size, CF/5) and levels (thr −5 dB/+45 dB; step size, 10 dB). Inhibitory response areas of unilaterally inhibited neurons were measured using stimulation of the excitatory ear at CF (20 dB above thr). The monaural thresholds were defined by more stringent criteria: the contralateral (excitatory) threshold was defined as the lowest intensity that evoked 20% of the maximal response; the ipsilateral (inhibitory) threshold was defined as the lowest intensity that reduced the excitatory response to 40% (see Fig. 7). To calculate the sound level at maximal slope of the rate-level function, responses were normalized relative to the maximum and fitted with the sigmoid function: P(t) = 1/[1 + a * exp(−b * t)] (Matlab). The tuning width was analyzed at 10, 20, and 30 dB (Q10, Q20, Q30) above the monaural threshold using the standard equation [CF/(highest minus lowest frequency that elicits 20% of the maximal response at the particular sound level)].
Figure 7.
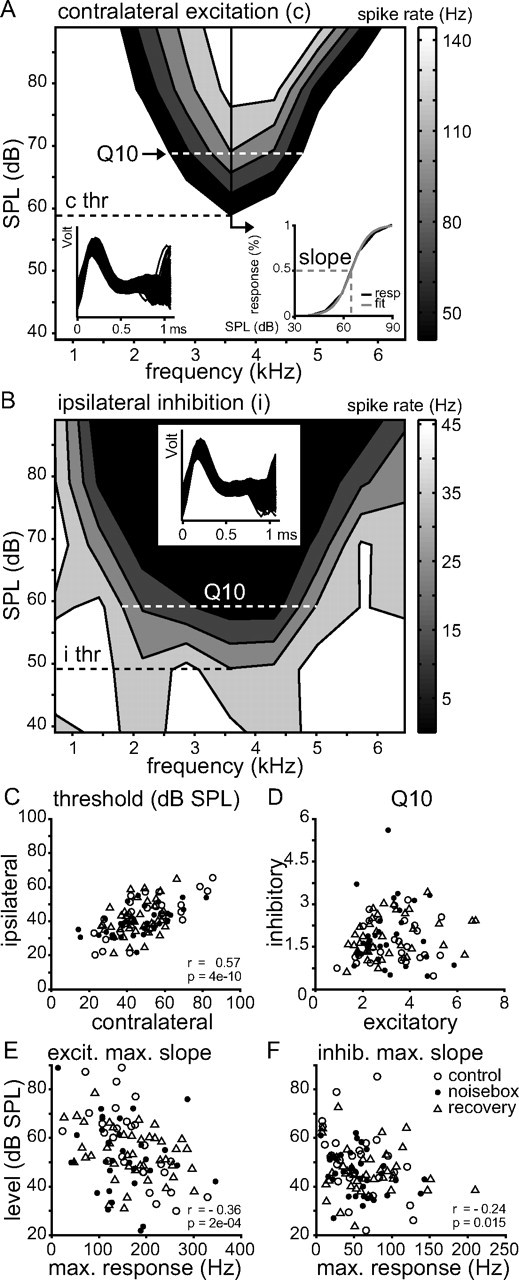
Effects of noise exposure on monaural response properties of high CF neurons. A, B, Response areas for contralateral excitatory (A) and ipsilateral inhibitory (B) inputs to a single DNLL cell (cell_060803_02; in both cases CF = 3.6 kHz). In A, regions with only spontaneous or subthreshold activity are also depicted in white. A, The inhibitory inputs were measured by binaural stimulation, setting the contralateral excitatory input to 20 dB above threshold at CF. The excitatory threshold [contralateral (c)] was defined as the lowest intensity that evoked 20% of the maximal response (c thr = 59 dB SPL; Q10 = 1.6). B, The inhibitory threshold [ipsilateral (i)] was defined as the lowest intensity that inhibited 40% of the response to contralateral stimulation (i thr = 49 dB SPL; Q10 = 1.1). C–F, Correlations between the analyzed parameters for each cell: inhibitory versus excitatory threshold (C), inhibitory Q10 versus excitatory Q10 (D), and maximal responses versus level at the maximum slope of the excitatory (E) and the inhibitory (F) rate-level function.
High-frequency neurons (>2000 Hz CF) that showed contralateral excitation and ipsilateral inhibition were tested for ILD sensitivity. ILDs were presented using the following two different methods: (1) by holding the sound intensity at the excitatory ear constant (20 dB above threshold) while varying the intensity of the inhibitory ear (ILD of ±30 dB; step size, 5 dB); or (2) by holding the absolute binaural sound intensity constant (20 dB above threshold) and varying the intensities at both ears (ILD of ±42 dB; step size, 6 dB) (see Fig. 6B). Negative values indicate higher intensities at the inhibitory ear; positive values indicate higher intensities at the excitatory ear. Neurons were defined as ILD sensitive if ipsilateral (inhibitory) pure-tone stimulation at CF reduced the maximal response elicited by contralateral (excitatory) pure-tone stimulation at CF by >50%. ILD functions (average spike rate vs ILD) were normalized to the maximal response and fitted with the sigmoid function: P(t) = 1/[1 + a * exp(−b * t)] (Matlab). As outlined in previous studies (Siveke et al., 2006), the fit was used to determine the ILD of the contralateral (excitatory) threshold, the ILD at 50% inhibition, and the ILD at the ipsilateral (inhibitory) threshold. The inhibitory and excitatory thresholds were defined at the ILDs at which the response decreased from the maximum or increased from the minimum by 5%, respectively.
Figure 6.

Correlations between parameters used to characterize ITD sensitivity. A, Physiological modulation depth (PMD) and best IPD. B, IPD at maximal slope and best IPD. C, CP and neuronal threshold. Each ITD-sensitive DNLL neuron is represented by a symbol (squares, control; circles, noisebox; triangles, recovery). D, Population average of the CPs. The asterisks indicate that the values for the noisebox group differ significantly (p < 0.05, ANOVA) from those for the control and recovery groups.
Low-frequency neurons (CF < 2000 Hz) were tested for ITD sensitivity (20 dB above thr; step size, 100 μs or dependent on CF [(1/CF) * 0.104]). The range of ITDs tested was equivalent to the duration of at least two cycles of the stimulus. ITD sensitivity was tested with the ILD set to 0 dB. ITDs with the contralateral stimulus leading were defined as positive; ITDs with the ipsilateral stimulus leading were defined as negative. ITD functions and best interaural phase difference (IPD) functions were analyzed using a vector-strength analysis (Kuwada et al., 1987). Neurons were defined as ITD sensitive if the vector strength fulfilled the significance criterion of p < 0.001 (Rayleigh test). ITD sensitivity was tested for three to nine frequencies centered around CF. ITD sensitivity was analyzed further only for cells showing significant sensitivity to at least three frequencies (in most cases more than five). ITD functions (average spike rate vs ITD) were computed, and the frequency that elicited the highest spike rate at best ITD was defined as the best frequency (BF). Note that BF can differ slightly from the CF defined at zero ITD (in most cases it is lower). For analyses of the ITD sensitivity at BF, the responses to ITDs that were longer than one cycle of the stimulus were combined with the responses to the corresponding ITD that were less than one cycle of the stimulus. ITD functions for pure tones are cyclic, and their width therefore depends on the simulation frequency. To normalize ITD sensitivity across neurons with different BFs, we also analyzed the IPD sensitivity as derived from the ITD functions. To quantify the ITD sensitivity, the following four parameters were analyzed: (1) the total modulation depth of the ITD function (difference between the maximal and the minimal average spike rate); (2) the modulation depth within the physiologically relevant range of ITDs (ITDs that are registered when probed with only a single sound source and without echoes), which is ∼±135 ms for gerbils (see Maki and Furukawa, 2005) and is also termed the “physiological” modulation depth; (3) the maximal slope of the IPD function (see Fig. 4B) determined from a Gaussian fit to the IPD function; and (4) the best IPD (representing the IPD that evoked the highest spike rate). These parameters were analyzed for each neuron separately.
Figure 4.

Example of the response characteristics of an ITD-sensitive neuron in the DNLL. A, Raster plots of an onset neuron (left, cell_1504_02; BF = 600 Hz) and a sustained neuron (middle, cell_0704_05; BF = 600 Hz) to a 200 ms pure-tone stimulus at the neuron's BF and best ITD. The AP waveforms of the onset (top) and the sustained (bottom) neurons are displayed on the right. B, Example of an ITD (IPD, gray axis labels) function. The neuronal response rate (sustained neuron in A) is plotted against the ITD (black) and IPD (gray) of the stimulus. The gray area indicates the physiologically relevant range of ITDs for a gerbil (±135 μs). ITD sensitivity is characterized by four parameters: total modulation depth (TMD), physiological modulation depth (PMD), IPD at maximal slope, and best IPD.
ITD sensitivity is generated in the MSO and LSO by two different mechanisms, resulting in two principal types of ITD sensitivity (Goldberg and Brown, 1969; Yin and Chan, 1990; Joris and Yin, 1995; Spitzer and Semple, 1995; Batra et al., 1997; Grothe and Park, 1998; Brand et al., 2002; Tollin and Yin, 2005; Pecka et al., 2008). Therefore, ITD-sensitive neurons are classically separated into two general types on the basis of their characteristic phase (CP): ITD-sensitive LSO-like neurons show a CP of ∼0.5 cycles, and MSO-like neurons show a CP broadly distributed of ∼0 cycles (Yin and Kuwada, 1983; Kuwada et al., 1987; Batra et al., 1997). In the DNLL and the inferior colliculus, where inputs from MSO, LSO, and other nuclei converge, both types are present (Yin and Kuwada, 1983; Cai et al., 1998; McAlpine et al., 1998; Shackleton et al., 2000; Fitzpatrick et al., 2002; Kuwada et al., 2006; Siveke et al., 2006). The CP and characteristic delay (CD) of the ITD-sensitive DNLL neurons were calculated according to Kuwada et al. (1987) (Siveke et al., 2006).
To investigate differences in ITD or ILD sensitivity among the three groups of animals, the parameters analyzed were averaged over the population of neurons. Means are presented ±SEM. First, to ensure that the values analyzed were normally distributed, all datasets were subjected to the Kolmogorov–Smirnov test (Matlab). Second, the level of significance of the mean values of the three groups was determined by balanced one-way ANOVA followed by a multiple-comparison test (Matlab) (p < 0.05 was considered statistically significant).
Some of the data concerning the ITD sensitivity of the control group has been published previously (Siveke et al., 2006).
The computational model of the LSO.
The ILD functions of the DNLL neurons are assumed to be inherited from high-frequency LSO neurons. We therefore used a simple circuit model to explain LSO responses (Reed and Blum, 1999). Firing rates are modeled by nonlinear gain functions as follows: Output = S + A(Input − T)n/[B + (Input − T)n] for Input > T; and Output = 0 otherwise.
The parameter T acts as a threshold, S measures spontaneous activity, A stands for maximal rate, and B accounts for the slope of the input–output function. The model includes the following six stages: ipsi- and contralateral auditory nerve (T = 0 dB, n = 2, S = 10 Hz, A = 300 Hz, B = 800 Hz2); ipsi- and contralateral anteroventral cochlear nucleus (AVCN) (T = 0 Hz, n = 1, S = 0 Hz, A = 400 Hz, B = 100 Hz); ipsilateral medial nucleus of the trapezoid body (MNTB) (parameters like AVCN); and the ipsilateral LSO (parameters like AVCN except B, which is used as a fit parameter). These stages are connected according to the schematic diagram in Figure 9. The inputs to the auditory nerve are the sound pressure levels at the respective ears (0 dB corresponds to threshold). All other inputs are the weighted linear sums of the outputs of the previous stages. All synaptic weights are set to 1, except for the inhibitory weight from MNTB to LSO, which acts as the second and most interesting fit parameter. Fits are obtained by minimizing the mean square error between the ILD functions of the model and the DNLL neurons.
Figure 9.

Model of ITD sensitivity in the MSO. A, Circuit diagram. Black disks indicate excitatory synapses. White disks indicate inhibitory synapses. Model responses are fitted to phase–frequency curves, i.e., best IPD as a function of stimulus frequency. B, Three examples of phase–frequency curves. Model results are depicted as solid lines. Best IPDs derived from the data are depicted as symbols. C, Mean inhibitory weights (black, ipsilateral; gray, contralateral) from fits to the phase–frequency curves of the three groups of animals. Error bars indicate SEM. *p < 0.05 for an unpaired t test. The asterisks below the graphs indicate significance of the sum of ipsi- and contralateral weights).
Computational model of the MSO.
The phase–frequency curves of ITD-sensitive DNLL neurons with CP < 0.25 cycles are assumed to be directly inherited from MSO cells. We therefore used a model in which the MSO responses to pure tones with various frequencies are described by a linear superposition of the four synaptic inputs (Leibold, 2010) (see Fig. 8): excitatory inputs (econtra/ipsi) from bilateral spherical bushy cells, contralateral inhibition (icontra) from the MNTB, and ipsilateral inhibition (iipsi) from the lateral nucleus of the trapezoid body (LNTB). The model is very simple in that the four signals are taken as sinusoids filtered by excitatory and inhibitory synaptic kinetics (kexc/inh).
Figure 8.

Model of ILD sensitivity in the LSO. A, Circuit diagram. Each large circle is modeled by a nonlinear input–output function (Reed and Blum, 1999). Black disks indicate excitatory synapses (weight 1). The white disk indicates the inhibitory synapse from MNTB to LSO. AN indicates auditory nerve. B, Three examples of ILD response functions from the model (lines) and data points (symbols) to which the model is fitted. C, Mean inhibitory weights calculated from fits to response functions for the three groups of animals. Error bars indicate SEM. *p < 0.05 for an unpaired t test.
The summed input v = kexc * (econtra + eipsi) + kinh * (icontra + iipsi) is a sinusoidal oscillation at stimulus frequency. The amplitude of v depends on the ITD and is assumed to be directly proportional to the neuronal firing rate.
The filter kernels kexc/inh are modeled as follows: k(t) = N(t1, t2) [exp(−t/t1)−exp(−t/t2)], where t1 > t2 are the time constants of rise and decay (t1 = 0.2 ms, t2 = 0.1 ms for EPSCs; t1 = 1.5 ms, t2 = 0.25 ms for IPSCs) (Magnusson et al., 2005; Scott et al., 2005) and N(t1, t2) is a normalization factor such that the maximum of k equals 1. The model includes the following four fit parameters: the (amplitude) strength of the ipsi- and contralateral inhibitory inputs relative to the excitatory ones, and the relative delays of the two inhibitory pathways with respect to the two excitatory ones. The excitatory pathways are considered symmetric both in amplitude and delay. It was previously shown (Leibold, 2010) that the four parameters suffice to fit the phase–frequency curve of the model to any preselected pair of CP and best IPD, for CP < 0.25. The fitting procedure (Leibold, 2010) satisfies the following two objectives: (1) it results in a small mean square error between phase–frequency curves of model and data; and (2) it produces a large coding range (i.e., amplitude difference between best and worst ITD). Because ipsi- and contralateral excitation are considered symmetrical, the model shows that inhibitory asymmetries are sufficient to explain experimentally measured phase–frequency curves in the MSO. Moreover, a reduction of the model to only contralateral inhibition was shown to be insufficient to explain the observed broad distribution of CPs.
Results
Extracellular recordings of DNLL neurons in anesthetized gerbils were used to investigate long-term changes in neuronal sensitivity to the sound localization cues ILD and ITD after exposure to omnidirectional background noise. Three groups of animals with different noise experience were investigated (Fig. 1B). The control group had no noise experience. The other two groups were exposed to noise for 14 d. One of the latter (the noisebox group) was investigated directly (1–3 d) after exposure, while the other (the recovery group) was allowed to recover in a normal acoustic environment before testing was initiated.
Effects of noise exposure on ILD sensitivity
We recorded from 93 high-frequency (CF > 2000 Hz; mean ± SEM 5985 ± 611 Hz), ILD-sensitive single neurons (Fig. 2A, right, AP waveform) in the DNLL. These ILD-sensitive neurons exclusively showed sustained firing with a clear onset component to contralateral and binaural stimulations (Fig. 2A). ILD sensitivity was measured in two ways. Either the excitatory monaural intensity (EMI) or the absolute binaural intensity (ABI) was kept constant (Fig. 3A,E). Figure 2B shows the neuronal response of an ILD-sensitive neuron to different ILDs presented using the EMI method. ILD-sensitive neurons are excited by positive ILDs (i.e., when the contralateral sound is louder) and inhibited by negative ILDs (when the ipsilateral sound is louder). All of the neurons tested showed maximal responses when the sound presented to the contralateral ear was more intense. Almost all neurons (89/93; 96%) showed monotonic ILD sensitivity, as shown in Figure 2B. In only four neurons was ILD sensitivity nonmonotonic, and showed a decrease in the response rate at higher ILDs. As illustrated in Figure 2B, ILD sensitivity was characterized by determining the ILDs that evoked (1) maximal inhibition, (2) 50% inhibition, and (3) minimal inhibition. These parameters were analyzed for each neuron separately; the averaged data are shown in Figure 3 and Table 1. Directly after noise exposure (noisebox group; white bars), both the average ILD for maximal inhibition (Fig. 3B,F) and the mean ILD for 50% inhibition show a significant shift to more positive values (Fig. 3C,G). The average ILD for minimal inhibition shows a slight shift that is not significant (Fig. 3D,H). The animals allowed to recover in a normal acoustic environment for at least 2 weeks after noise exposure (recovery group; gray bars) showed no changes compared with the control group (black bars). These effects of noise exposure on ILD sensitivity were independent of the method (EMI or ABI) used to characterize the ILD sensitivity of the neurons.
Figure 2.

Example of the response characteristics of an ILD-sensitive neuron in the DNLL. A, Raster plots show sustained responses (cell_230207_05; BF = 2500 Hz) to a 200 ms pure-tone stimulus at BF presented with ILDs of 0 and 20 dB. The shapes of the APs are displayed on the right. B, ILD function of the neuron shown in A. Negative ILDs indicate that the ipsilateral stimulus is louder than the contralateral stimulus. The parameters used to characterize the ILD sensitivity of the neurons are illustrated in gray.
Figure 3.

Effects of noise exposure on ILD sensitivity. A, E, Schematics depicting the two methods used to construct ILD stimuli: keeping EMI (20 dB above threshold) or ABI (20 dB above threshold) constant. B–D, F–H, Population averages of the ILD of maximal inhibition (B, F), ILD of 50% inhibition (C, G), and the ILD of minimal inhibition (D, H) are shown for the three study groups. Data in B–D correspond to EMI stimuli. Data in F–H correspond to ABI stimuli. Error bars indicate SEM. The asterisks indicate that the values for the noisebox group differ significantly (p < 0.05, ANOVA) from those for the control and recovery groups.
Table 1.
Effect of noise exposure on ILD sensitivity
| Control | Noisebox | Recovery | |
|---|---|---|---|
| Excitatory intensity constant | |||
| Maximal inhibition (dB SPL) | −19.0 ± 1.59 | −12.6 ± 1.31* | −18 ± 1.92 |
| 50% Inhibition (dB SPL) | 0.2 ± 1.27 | 5.8 ± 1.31* | 0.7 ± 1.41 |
| Minimal inhibition (dB SPL) | 19.5 ± 2.25 | 24.0 ± 2.0 | 18.7 ± 1.6 |
| Absolute binaural intensity constant | |||
| Maximal inhibition (dB SPL) | −12.7 ± 2.19 | −4.8 ± 1.7* | −14 ± 1.9 |
| 50% Inhibition (dB SPL) | 9.8 ± 1.58 | 14.5 ± 1.61* | 9.2 ± 1.26 |
| Minimal inhibition (dB SPL) | 32.3 ± 2.15 | 34.0 ± 2.28 | 32.5 ± 2.10 |
Asterisks indicate significantly different values (p > 0.05, ANOVA) for the noisebox group compared to control and recovery groups.
Effects of noise exposure on ITD sensitivity
We recorded from 123 low-frequency (BF < 2000 Hz; mean 755 ± 27 Hz) ITD-sensitive single neurons in the DNLL (Fig. 4A, right, AP waveform). The discharge patterns of these ITD-sensitive neurons when tested at BF and best ITD (Fig. 4A, middle) ranged from onset-type responses, which showed only one to three spikes at the beginning of the stimulus (Fig. 4A, left), to sustained responses, with spikes distributed throughout the 200 ms tonal stimulation. A detailed analysis of the response pattern in the DNLL of control animals has been reported in a previous publication. This analysis included most of the data obtained for the control group (Siveke et al., 2006). Importantly, the distribution of types of discharge patterns did not differ among the three groups of animals.
ITD-sensitive neurons show a cyclic ITD function in response to binaural tonal stimulation. A tone delay function of a typical neuron at BF is shown in Figure 4B. Most of the ITD-sensitive neurons in the DNLL exhibited positive best IPDs. A small number of neurons, however, showed negative best IPDs, corresponding to maximal response rates for stimuli in the ipsilateral hemisphere. These two subpopulations may arise from bilateral projections to the DNLL (Siveke et al., 2006). To average across these two subpopulations, we flipped the ITD functions of neurons with negative best IPD resulting in positive best IPD and a sign change of the IPD at the steepest slope.
The average data for the four different parameters of the ITD sensitivity analyzed (total modulation depth, “physiological” modulation depth, IPD at maximal slope, best IPD) are shown in Figure 5 and Table 2. We observed no differences in the total modulation depths among the three groups of animals (Fig. 5A). However, we did find a significantly increased physiological modulation depth in the noisebox group compared with the control group (Fig. 5B). The recovery group did not differ from the control group. The fact that the increased physiological modulation depth is not correlated with an increase in the total modulation depth indicates a shift in ITD sensitivity in the noisebox group.
Figure 5.

Effects of noise exposure on ITD sensitivity. A, Population averages of total modulation depth (TMD). B, Population averages of physiological modulation depth (PMD). C, IPD at maximal slope. D, Best IPD. Error bars indicate SEM. The asterisks indicate that the values for the noisebox group differ significantly (p < 0.05, ANOVA) from those for the control and recovery groups.
Table 2.
Effect of noise exposure on ITD sensitivity (tone delay function at BF)
| Control | Noisebox | Recovery | |
|---|---|---|---|
| Total modulation depth (%) | 91.8 ± 1.7 | 91.5 ± 1.7 | 94.6 ± 1.2 |
| Physiol. modulation depth (%) | 48.3 ± 4.2 | 59.5 ± 3.9* | 44.3 ± 5.2 |
| IPD at maximum slope (cycles) | −0.01 ± 0.018 | 0.05 ± 0.018 | 0.01 ± 0.027 |
| Best IPD (cycles) | 0.14 ± 0.016 | 0.21 ± 0.016* | 0.14 ± 0.022 |
Asterisks indicate significantly different values (p > 0.05, ANOVA) for the noisebox group compared to control and recovery groups.
Previous studies showed that the best ITD varies systematically with BF (McAlpine et al., 2001; Brand et al., 2002; Siveke et al., 2006; Agapiou and McAlpine, 2008). Therefore, to quantify the shift in ITD sensitivity, we analyzed the frequency-independent parameters “best IPD” and IPD at maximal slope. The averaged population data show that the IPDs at the steepest slopes were slightly but not significantly larger in the noisebox group compared with the control and recovery groups (Fig. 5C). Indeed, the best IPD of the neurons of the noisebox group was significantly increased compared with those of the control and recovery groups (Fig. 5D). The recovery group, which was returned to a normal acoustic environment after noise exposure, showed no significant differences in best IPDs of the neurons compared with the control group.
To further analyze how the ITD sensitivity of single neurons changed during noise exposure, we examined the correlation between the two parameters that showed significant differences among the different groups of animals, the physiological modulation depths, and best IPDs (Fig. 6A). These two parameters exhibited a strong nonmonotonic relation. The maximum of the physiological modulation depth (∼100%) was found at a best IPD of ∼0.25 cycles. Consequently, an increase in the average best IPD from 0.12 to 0.2 cycles after noise exposure directly results in an increase in the average physiological modulation depth. In contrast to the physiological modulation depth, the IPD at the steepest slope increases linearly with best IPD (Fig. 6B). The data in Figures 5 and 6, A and B, are in accordance with the view that the differences in the tuning curves are mainly due to shifts along the IPD axes rather than to shape changes.
ITD sensitivity of neurons depends on the frequency of the stimulus, and is classically quantified by a CP and a CD (Yin and Kuwada, 1983; see Materials and Methods). Most of the neurons showed CPs between 0 and 0.25 cycles (Fig. 6C) and were defined as MSO-like or peak-type neurons (89/123; 71.2%). The average CP for the noisebox group was significantly larger than the average CP for the control and recovery groups (Fig. 6D, control, 0.18 ± 0.020 cycles; noisebox, 0.24 ± 0.023 cycles; recovery, 0.11 ± 0.018 cycles). To exclude the possibility that the observed changes in ITD sensitivity shown in Figure 5 result from pooling different populations of ITD-sensitive neurons (with different CPs), we analyzed the effects of noise exposure again, this time using only neurons with MSO-like ITD sensitivity (0 < CP < 0.25; Fig. 6C, gray shadowed area). Once again, the average best IPD for the MSO-like neurons of the noisebox group was significantly higher than those of the control and the recovery groups (control, 0.13 ± 0.018 cycles; noisebox, 0.19 ± 0.020 cycles; recovery, 0.13 ± 0.020 cycles; p = 0.015, ANOVA). No differences were found in terms of characteristic delays for the total population of neurons or the subpopulation of MSO-like neurons. To exclude possible effects of the stimulation paradigm using pure tones at BF, we also analyzed composite delay functions, which were constructed as linear superpositions of ITD functions for at least five different stimulus frequencies. These composite delay functions showed the same significant reversible changes after noise exposure as ITD functions at BF (Table 3). Hence, there is clear evidence for a reversible shift in ITD sensitivity induced by exposure to noise.
Table 3.
Effect of noise exposure on ITD sensitivity (composite delay function)
| Control | Noisebox | Recovery | |
|---|---|---|---|
| Total modulation depth (%) | 84.6 ± 1.9 | 86.0 ± 2.0 | 89.1 ± 1.9 |
| Physiol. modulation depth (%) | 41.8 ± 3.7 | 53.4 ± 3.9* | 39.1 ± 4.9 |
| IPD of maximum slope (cycles) | −0.00 ± 0.018 | 0.05 ± 0.025 | −0.02 ± 0.026 |
| Best IPD (cycles) | 0.15 ± 0.017 | 0.21 ± 0.021* | 0.14 ± 0.022 |
Asterisks indicate significantly different values (ANOVA; physiological modulation depth, F(3,120) = 3.4, p = 0.036; best IPD, F(3,120) = 3.5, p = 0.034) for the noisebox group compared to control and recovery groups.
To investigate whether altered neuronal excitability is related to the observed noise-induced changes in ITD sensitivity, we compared the neuronal thresholds (Fig. 6C), the spontaneous activities, and the minimal and maximal response rates for the three groups, but found no differences.
Effects of noise exposure on ipsi- and contralateral response properties
To separately estimate the potential excitatory and inhibitory inputs to the binaural neurons in the SOC, we analyzed the response properties of high-CF DNLL neurons to pure-tone stimulation at different frequencies and different sound levels. Characteristic tunings of the same neuron are shown in Figure 7AB,. Four parameters were investigated and compared among the three groups: (1) ipsi- and contralateral thresholds, (2) the maximal firing rate, (3) the sound level at the steepest slope of the rate-level function at CF, and (4) the tuning width measured 10, 20, and 30 dB above the neuronal threshold (Q10, Q20, Q30) (Fig. 7A). The inhibitory “rate-level functions” were measured by binaural two-tone stimulation, setting the contralateral excitatory input to CF (20 dB above thr) while increasing the sound level of the inhibitory input. None of the parameters analyzed showed significant differences between the three different groups of animals (ANOVA, p > 0.05) (Fig. 7C–F). This indicates that, on average, the excitatory and the inhibitory inputs are not affected by noise exposure, either with respect to sound level (unchanged thresholds, firing rates, and steepest slopes) or frequency (Q10, Q20, Q30).
However, significant correlations were found between the contralateral excitatory and ipsilateral inhibitory thresholds (Fig. 7C) and between the levels at the steepest slopes of the rate-level functions. Furthermore, we found significant negative correlations between the sound level at the steepest slope and the maximal responses of the (excitatory and inhibitory) rate-level functions (Fig. 7E,F). This similarity and covariation of excitatory and inhibitory rate-level function properties suggests that fine-tuning of the ratio of excitatory to inhibitory input strengths already occurs at the level of the LSO.
We conclude that noise exposure has no influence on the monaural input activity to the SOC. Thus, if adaptation occurs at the level of the SOC, the earliest stage at which this is possible is at the level of the synaptic conductances of SOC inputs. To evaluate whether this is a feasible hypothesis, we next fitted synaptic parameters of simple models of binaural ILD and ITD processing to our data.
Models for noise-induced adaptation
To explain the noise-induced effects on the ILD sensitivity of high-frequency neurons in the DNLL, we used a circuit model of LSO responses (Reed and Blum, 1999). The model is based solely on the mean response rates of the auditory structures upstream of the LSO (see Materials and Methods). As fit parameters, we use the inhibitory synaptic weight of MNTB inputs to the LSO and the slope of the input–output function of LSO neurons. Significant differences among the three groups are only found for the inhibitory weights, which are ∼40% larger in the noisebox fits (Fig. 8; control, 0.55 ± 0.05; noisebox, 0.73 ± 0.05; recovery, 0.55 ± 0.06; p < 0.02, ANOVA).
To test whether an increase in inhibitory synaptic strength would also suffice to explain the noise-induced effects on the ITD sensitivity of low-frequency neurons in the DNLL, we also used a circuit model of MSO responses. ITD sensitivity is evaluated by fitting the phase–frequency curves of the ITD-sensitive DNLL neurons to an MSO model. Because we assume that only peak-type neurons (CP < 0.25 cycles) directly reflect MSO activity, we restricted the fits to this population. Our model (Leibold, 2010) includes four input pathways to the MSO neuron (Fig. 9), which are linearly summed to provide an estimate for the response rate of the neuron. The model has four fit parameters: the relative delays and the relative strengths (weights) of the two inhibitory pathways with respect to the excitatory ones. After fitting, we find no significant differences in the delay parameters among the three groups of animals (control, noisebox, recovery). However, the inhibitory synaptic strengths do show significant differences. The sum of relative ipsi- and contralateral inhibitory weight is increased in the noisebox fits, again by ∼40% (control, 1.6 ± 0.3; noisebox, 2.2 ± 0.3; recovery, 1.2 ± 0.2; p < 0.005, ANOVA). This difference is, however, only supported by the ipsilateral inhibitory weights (control, 0.7 ± 0.2; noisebox, 1.5 ± 0.3; recovery, 0.5 ± 0.2; p < 0.0005, ANOVA), which are increased by approximately a factor of two, whereas the contralateral weights are not significantly different. Hence, both our experimental data and the modeling data indicate that noise exposure primarily increases CP. This result is consistent with an earlier modeling study (Leibold, 2010), which showed that strong ipsilateral inhibition is particularly important in explaining the large CP (∼0.2) in peak-type neurons.
Both modeling results suggest that a pathway-specific upregulation of the inhibitory weights offers a possible mechanism for calibrating binaural processing to persistent exposure to background noise. For the MSO, the model predicts a strong upregulation of the ipsilateral LNTB inputs, but no change in the MNTB-mediated contralateral inhibition. In contrast, for the LSO, the model predicts an upregulation of the contralateral inhibition from the high-frequency MNTB.
Discussion
The present study reveals long-term adaptations of the binaural system to changes in the acoustic environment. Adult gerbils were exposed to omnidirectional noise, which provides almost no stable binaural cue for localizing sounds. After 2 weeks of moderate noise exposure, we found that neuronal sensitivity to binaural cues, both ILDs and ITDs, were reversibly altered. However, neuronal excitability and monaural response properties were unchanged. Our computational models suggest that upregulation of inhibition at the first stages of binaural processing could account for these effects.
Rationale for recording in the DNLL of anesthetized gerbils
The DNLL receives direct inputs from LSO and MSO, and therefore inherits sensitivity to ILDs and ITDs. The basic properties of ILD and ITD sensitivity in the DNLL have been reported to be similar to those described for the SOC, and are strikingly different from those at the next synaptic level, the inferior colliculus, where significantly altered and even new binaural properties are created (McAlpine et al., 1998; Pollak et al., 2003; Kuwada et al., 2006; Siveke et al., 2006; Pecka et al., 2010). However, we cannot fully exclude the possibility that some of the observed adaptation occurs in the DNLL.
For technical reasons, the recordings were performed in anesthetized gerbils. Anesthesia affects the neuronal response rate, response latency, and spontaneous activity, at least in the inferior colliculus (Kuwada et al., 1989; Ter-Mikaelian et al., 2007). However, all the animals in our study were anesthetized using the same protocol, so the differences observed cannot be attributed to the anesthesia.
Comparison with previous studies
Behavioral studies have shown that sound localization is context dependent and is affected by preceding sounds (Kashino and Nishida, 1998; Carlile et al., 2001; Getzmann, 2004). Furthermore, electrophysiological studies showed that the binaural response properties in the brainstem (Finlayson and Adam, 1997; Park et al., 2008) and midbrain (Spitzer and Semple, 1993, 1998; Sanes et al., 1998; McAlpine et al., 2000; Ingham and McAlpine, 2004; Furukawa et al., 2005; Dahmen et al., 2010; Siveke et al., 2010) depend on preceding sounds. Therefore, adaptation occurs within a few milliseconds (Finlayson and Adam, 1997; Ingham and McAlpine, 2004). Short-term adaptation in the range of 100 ms has been reported at the monaural level depending on the level and the statistics of (background) noise (Dean et al., 2005, 2008; Lesica and Grothe, 2008).
Studies investigating reversible long-term adaptation in the adult brainstem are rare. Moreover, most have used invasive techniques, such as cochlear ablation or acoustic traumata, to induce physiological and molecular changes in the brainstem of adult mammals (McAlpine et al., 1997; Suneja et al., 1998a,b, 2000; Mossop et al., 2000; Potashner et al., 2000; Michler and Illing, 2002; Alvarado et al., 2004; Zhang et al., 2004) (for review, see Illing et al., 2000). Interestingly, studies in the auditory brainstem and midbrain indicate that deafening especially affects the inhibitory inputs (Suneja et al., 1998a,b; Vale and Sanes, 2002; Vale et al., 2003, 2004), although it is not clear whether these changes are due to neuronal cell death or reflect adaptation of the adult auditory brainstem to different auditory inputs in a potentially reversible manner.
One way of reversibly changing binaural inputs is to plug one ear, and electrophysiological studies showed that sensitivity to ILD in the inferior colliculus could be adaptively shifted by monaural deprivation (Silverman and Clopton, 1977; Mogdans and Knudsen, 1993; Popescu and Polley, 2010). However, these studies focused on adaptation during development. Behavioral studies in adult ferrets showed that unilateral earplugs produced long-term but reversible effects on binaural unmasking (Moore et al., 1999). Follow-up studies investigated the process of relearning to localize sounds after reversible occlusion of one ear, and showed that ferrets and humans improved their localization ability after a training period of only 1 week (Kacelnik et al., 2006; Kumpik et al., 2010).
In our study, we used continuous but moderate noise exposure. Exposure to high-level noise elevates auditory thresholds and results in partial hair-cell deafferentation, which can be reversed within 1–2 weeks (Kujawa and Liberman, 2009). In contrast, previous studies showed that exposure to moderate noise, identical to that used in the present study, does not alter neuronal thresholds (Seidl and Grothe, 2005). Here we showed that neuronal excitability of monaural DNLL responses is also unchanged after noise exposure. Together, these findings indicate that monaural peripheral processing is neither changed nor damaged by the noise exposure used in this study.
Possible mechanisms of adaptation
The possible mechanisms for short-term adaptation within the binaural circuitry are manifold (Kuba et al., 2002; Cook et al., 2003; Song et al., 2005; Magnusson et al., 2008). However, there is evidence that delicate interactions between excitatory and inhibitory synaptic inputs to LSO and MSO are a major factor in initial binaural processing (Park et al., 1997; Brand et al., 2002; Grothe, 2003; Leibold and van Hemmen, 2005; Zhou et al., 2005; Pecka et al., 2008; Jercog et al., 2010; Leibold, 2010). Moreover, these normally exquisitely balanced inputs (Couchman et al., 2010) can be differentially modulated (Magnusson et al., 2008; Hassfurth et al., 2010). In short, increased inhibition shifts the maximal response in the LSO and MSO to more positive ILD and ITD values. These shifts are in line with our hypothesis that the altered ILD and ITD sensitivities are caused by increased inhibition, or at least an increase in inhibitory strength relative to excitation. Our model of ITD processing is certainly simplistic. However, with the exception of stereausis-based approaches (Joris et al., 2006), none of the MSO models yet available has been shown to be able to generate arbitrary combinations of characteristic phase and delay. The former rely on bilateral disparities of cochlear input sites, which are obviously not a good substrate for adaptive processes. Hence, factors other than cochlear phase disparities must contribute to characteristic phase. Readjustment of inhibitory input strength may be one.
Some of the mechanisms responsible for fast adaptation of synaptic strengths in binaural processing are beginning to emerge, e.g., retrograde GABA release in the LSO (Magnusson et al., 2008). Although changes in synaptic strength may be a general strategy, we can only speculate about the mechanisms underlying the longer-lasting effects observed in this study. Reversible changes on a time scale of several days are more likely to be due to homeostatic adaptations, e.g., altered receptor trafficking that changes postsynaptic receptor densities.
A further means of modulating binaural processing is provided by descending projections. Several anatomical studies have described descending projections from the auditory cortex to the SOC, as well as from the SOC to the cochlea (Guinan, 1996; Doucet et al., 2002; Coomes and Schofield, 2004). Recent studies by Bajo et al. (2010) and Irving et al. (2011) showed that, when these descending projections are disrupted, the ability to relearn to localize sound is lost, indicating that the descending pathways influence sound localization already at early stages. However, how and where exactly the descending system interacts with binaural processing is unclear. The action of feedback may therefore be indirect, via changes in the monaural inputs to the binaural system. In our study, no noise-induced changes in monaural excitability were detected, indicating that the impact of the descending system is likely to be small or nonexistent.
Possible behavioral relevance of the electrophysiologically observed changes
The behavioral impact of the adaptation observed in this study is unclear. However, the dynamics of the initial binaural system have only recently come into focus (Grothe and Koch, 2011). Behavioral studies on noise-exposed animals and humans are mostly related to monaural measurements, such as auditory sensation thresholds, which are shifted by exposure to extreme acoustic situations (Moore et al., 1999; Chen and Fechter, 2003). Long-term effects of environmental noise on binaural hearing have not been investigated. Behavioral studies in humans have shown that the ability to discriminate tones from background noise decreases with increasing noise level (Stern et al., 1983; Good and Gilkey, 1996). These findings are consistent with electrophysiological studies in gerbils, which showed that sensitivity to ITDs of pure tones is decreased in the presence of noise (Siveke et al., 2007). Recent studies support the idea that the mammalian brain represents physiologically relevant ITDs in terms of the overall activity of a population of neurons within each hemisphere (Lesica et al., 2010; Lüling et al., 2011). This indicates that a high modulation depth within the physiologically relevant range of ITDs facilitates sound localization. Thus, if the modulation depth within the physiologically relevant range of ITDs is increased after noise exposure, this may indicate increased localization ability of the noise-exposed animals. In terms of ILD sensitivity, the adaptive advantage gained by shifting the ILD functions is less obvious. Our data show that noise adaptively shifts the ILD function to more positive ILDs. The response rate of ∼0 ILD may thus be moved to a low firing regime, in which the rate code is most reliable.
Footnotes
The study was funded by the Deutsche Forschungsgemeinschaft (Sonderforschungsbereichen 870; B2). We thank F. Felmy, A. Stange, and P. Anthony for critical comments and careful reading of the manuscript.
References
- Agapiou JP, McAlpine D. Low-frequency envelope sensitivity produces asymmetric binaural tuning curves. J Neurophysiol. 2008;100:2381–2396. doi: 10.1152/jn.90393.2008. [DOI] [PMC free article] [PubMed] [Google Scholar]
- Alvarado JC, Fuentes-Santamaria V, Henkel CK, Brunso-Bechtold JK. Alterations in calretinin immunostaining in the ferret superior olivary complex after cochlear ablation. J Comp Neurol. 2004;470:63–79. doi: 10.1002/cne.11038. [DOI] [PubMed] [Google Scholar]
- Bajo VM, Nodal FR, Moore DR, King AJ. The descending corticocollicular pathway mediates learning-induced auditory plasticity. Nat Neurosci. 2010;13:253–260. doi: 10.1038/nn.2466. [DOI] [PMC free article] [PubMed] [Google Scholar]
- Batra R, Kuwada S, Fitzpatrick DC. Sensitivity to interaural temporal disparities of low- and high-frequency neurons in the superior olivary complex. I. Heterogeneity of responses. J Neurophysiol. 1997;78:1222–1236. doi: 10.1152/jn.1997.78.3.1222. [DOI] [PubMed] [Google Scholar]
- Blauert J. Spatial hearing: the psychophysics of human sound localization. Cambridge, MA: MIT; 1997. [Google Scholar]
- Brand A, Behrend O, Marquardt T, McAlpine D, Grothe B. Precise inhibition is essential for microsecond interaural time difference coding. Nature. 2002;417:543–547. doi: 10.1038/417543a. [DOI] [PubMed] [Google Scholar]
- Cai H, Carney LH, Colburn HS. A model for binaural response properties of inferior colliculus neurons. I. A model with interaural time difference-sensitive excitatory and inhibitory inputs. J Acoust Soc Am. 1998;103:475–493. doi: 10.1121/1.421100. [DOI] [PubMed] [Google Scholar]
- Carlile S, Hyams S, Delaney S. Systematic distortions of auditory space perception following prolonged exposure to broadband noise. J Acoust Soc Am. 2001;110:416–424. doi: 10.1121/1.1375843. [DOI] [PubMed] [Google Scholar]
- Chen GD, Fechter LD. The relationship between noise-induced hearing loss and hair cell loss in rats. Hear Res. 2003;177:81–90. doi: 10.1016/s0378-5955(02)00802-x. [DOI] [PubMed] [Google Scholar]
- Cook DL, Schwindt PC, Grande LA, Spain WJ. Synaptic depression in the localization of sound. Nature. 2003;421:66–70. doi: 10.1038/nature01248. [DOI] [PubMed] [Google Scholar]
- Coomes DL, Schofield BR. Projections from the auditory cortex to the superior olivary complex in guinea pigs. Eur J Neurosci. 2004;19:2188–2200. doi: 10.1111/j.0953-816X.2004.03317.x. [DOI] [PubMed] [Google Scholar]
- Couchman K, Grothe B, Felmy F. Medial superior olivary neurons receive surprisingly few excitatory and inhibitory inputs with balanced strength and short-term dynamics. J Neurosci. 2010;30:17111–17121. doi: 10.1523/JNEUROSCI.1760-10.2010. [DOI] [PMC free article] [PubMed] [Google Scholar]
- Dahmen JC, Keating P, Nodal FR, Schulz AL, King AJ. Adaptation to stimulus statistics in the perception and neural representation of auditory space. Neuron. 2010;66:937–948. doi: 10.1016/j.neuron.2010.05.018. [DOI] [PMC free article] [PubMed] [Google Scholar]
- Dean I, Harper NS, McAlpine D. Neural population coding of sound level adapts to stimulus statistics. Nat Neurosci. 2005;8:1684–1689. doi: 10.1038/nn1541. [DOI] [PubMed] [Google Scholar]
- Dean I, Robinson BL, Harper NS, McAlpine D. Rapid neural adaptation to sound level statistics. J Neurosci. 2008;28:6430–6438. doi: 10.1523/JNEUROSCI.0470-08.2008. [DOI] [PMC free article] [PubMed] [Google Scholar]
- Doucet JR, Rose L, Ryugo DK. The cellular origin of corticofugal projections to the superior olivary complex in the rat. Brain Res. 2002;925:28–41. doi: 10.1016/s0006-8993(01)03248-6. [DOI] [PubMed] [Google Scholar]
- Finlayson PG, Adam TJ. Excitatory and inhibitory response adaptation in the superior olive complex affects binaural acoustic processing. Hear Res. 1997;103:1–18. doi: 10.1016/s0378-5955(96)00158-x. [DOI] [PubMed] [Google Scholar]
- Fitzpatrick DC, Kuwada S, Batra R. Transformations in processing interaural time differences between the superior olivary complex and inferior colliculus: beyond the Jeffress model. Hear Res. 2002;168:79–89. doi: 10.1016/s0378-5955(02)00359-3. [DOI] [PubMed] [Google Scholar]
- Furukawa S, Maki K, Kashino M, Riquimaroux H. Dependency of the interaural phase difference sensitivities of inferior collicular neurons on a preceding tone and its implications in neural population coding. J Neurophysiol. 2005;93:3313–3326. doi: 10.1152/jn.01219.2004. [DOI] [PubMed] [Google Scholar]
- Getzmann S. Spatial discrimination of sound sources in the horizontal plane following an adapter sound. Hear Res. 2004;191:14–20. doi: 10.1016/j.heares.2003.12.020. [DOI] [PubMed] [Google Scholar]
- Glendenning KK, Brunso-Bechtold JK, Thompson GC, Masterton RB. Ascending auditory afferents to the nuclei of the lateral lemniscus. J Comp Neurol. 1981;197:673–703. doi: 10.1002/cne.901970409. [DOI] [PubMed] [Google Scholar]
- Goldberg JM, Brown PB. Response of binaural neurons of dog superior olivary complex to dichotic tonal stimuli: some physiological mechanisms of sound localization. J Neurophysiol. 1969;32:613–636. doi: 10.1152/jn.1969.32.4.613. [DOI] [PubMed] [Google Scholar]
- Good MD, Gilkey RH. Sound localization in noise: the effect of signal-to-noise ratio. J Acoust Soc Am. 1996;99:1108–1117. doi: 10.1121/1.415233. [DOI] [PubMed] [Google Scholar]
- Grothe B. New roles for synaptic inhibition in sound localization. Nat Rev Neurosci. 2003;4:540–550. doi: 10.1038/nrn1136. [DOI] [PubMed] [Google Scholar]
- Grothe B, Koch U. Dynamics of binaural processing in the mammalian sound localization pathway—the role of GABA(B) receptors. Hear Res. 2011;279:43–50. doi: 10.1016/j.heares.2011.03.013. [DOI] [PubMed] [Google Scholar]
- Grothe B, Park TJ. Sensitivity to interaural time differences in the medial superior olive of a small mammal, the Mexican free-tailed bat. J Neurosci. 1998;18:6608–6622. doi: 10.1523/JNEUROSCI.18-16-06608.1998. [DOI] [PMC free article] [PubMed] [Google Scholar]
- Grothe B, Pecka M, McAlpine D. Mechanisms of sound localization in mammals. Physiol Rev. 2010;90:983–1012. doi: 10.1152/physrev.00026.2009. [DOI] [PubMed] [Google Scholar]
- Guinan JJ., Jr . The physiology of olivocochlear efferents. In: Dallos PJ, Popper AN, Fay RR, editors. The cochlea. New York: Springer; 1996. pp. 435–502. [Google Scholar]
- Hassfurth B, Grothe B, Koch U. The mammalian interaural time difference detection circuit is differentially controlled by GABAB receptors during development. J Neurosci. 2010;30:9715–9727. doi: 10.1523/JNEUROSCI.1552-10.2010. [DOI] [PMC free article] [PubMed] [Google Scholar]
- Illing RB, Kraus KS, Michler SA. Plasticity of the superior olivary complex. Microsc Res Tech. 2000;51:364–381. doi: 10.1002/1097-0029(20001115)51:4<364::AID-JEMT6>3.0.CO;2-E. [DOI] [PubMed] [Google Scholar]
- Ingham NJ, McAlpine D. Spike-frequency adaptation in the inferior colliculus. J Neurophysiol. 2004;91:632–645. doi: 10.1152/jn.00779.2003. [DOI] [PubMed] [Google Scholar]
- Irvine D. Physiology of the auditory brainstem. In: Popper AN, Fay RR, editors. The mammalian auditory pathway: neurophysiology. New York: Springer; 1992. pp. 153–231. [Google Scholar]
- Irving S, Moore DR, Liberman MC, Sumner CJ. Olivocochlear efferent control in sound localization and experience-dependent learning. J Neurosci. 2011;31:2493–2501. doi: 10.1523/JNEUROSCI.2679-10.2011. [DOI] [PMC free article] [PubMed] [Google Scholar]
- Jercog PE, Svirskis G, Kotak VC, Sanes DH, Rinzel J. Asymmetric excitatory synaptic dynamics underlie interaural time difference processing in the auditory system. PLoS Biol. 2010;8:e1000406. doi: 10.1371/journal.pbio.1000406. [DOI] [PMC free article] [PubMed] [Google Scholar]
- Joris PX, Yin TC. Envelope coding in the lateral superior olive. I. Sensitivity to interaural time differences. J Neurophysiol. 1995;73:1043–1062. doi: 10.1152/jn.1995.73.3.1043. [DOI] [PubMed] [Google Scholar]
- Joris PX, Van de Sande B, Louage DH, van der Heijden M. Binaural and cochlear disparities. Proc Natl Acad Sci U S A. 2006;103:12917–12922. doi: 10.1073/pnas.0601396103. [DOI] [PMC free article] [PubMed] [Google Scholar]
- Kacelnik O, Nodal FR, Parsons CH, King AJ. Training-induced plasticity of auditory localization in adult mammals. PLoS Biol. 2006;4:e71. doi: 10.1371/journal.pbio.0040071. [DOI] [PMC free article] [PubMed] [Google Scholar]
- Kaltenbach JA, Zhang J, Afman CE. Plasticity of spontaneous neural activity in the dorsal cochlear nucleus after intense sound exposure. Hear Res. 2000;147:282–292. doi: 10.1016/s0378-5955(00)00138-6. [DOI] [PubMed] [Google Scholar]
- Kapfer C, Seidl AH, Schweizer H, Grothe B. Experience-dependent refinement of inhibitory inputs to auditory coincidence-detector neurons. Nat Neurosci. 2002;5:247–253. doi: 10.1038/nn810. [DOI] [PubMed] [Google Scholar]
- Kashino M, Nishida S. Adaptation in the processing of interaural time differences revealed by the auditory localization aftereffect. J Acoust Soc Am. 1998;103:3597–3604. doi: 10.1121/1.423064. [DOI] [PubMed] [Google Scholar]
- Kuba H, Koyano K, Ohmori H. Synaptic depression improves coincidence detection in the nucleus laminaris in brainstem slices of the chick embryo. Eur J Neurosci. 2002;15:984–990. doi: 10.1046/j.1460-9568.2002.01933.x. [DOI] [PubMed] [Google Scholar]
- Kujawa SG, Liberman MC. Adding insult to injury: cochlear nerve degeneration after “temporary” noise-induced hearing loss. J Neurosci. 2009;29:14077–14085. doi: 10.1523/JNEUROSCI.2845-09.2009. [DOI] [PMC free article] [PubMed] [Google Scholar]
- Kumpik DP, Kacelnik O, King AJ. Adaptive reweighting of auditory localization cues in response to chronic unilateral earplugging in humans. J Neurosci. 2010;30:4883–4894. doi: 10.1523/JNEUROSCI.5488-09.2010. [DOI] [PMC free article] [PubMed] [Google Scholar]
- Kuwada S, Stanford TR, Batra R. Interaural phase-sensitive units in the inferior colliculus of the unanesthetized rabbit: effects of changing frequency. J Neurophysiol. 1987;57:1338–1360. doi: 10.1152/jn.1987.57.5.1338. [DOI] [PubMed] [Google Scholar]
- Kuwada S, Batra R, Stanford TR. Monaural and binaural response properties of neurons in the inferior colliculus of the rabbit: effects of sodium pentobarbital. J Neurophysiol. 1989;61:269–282. doi: 10.1152/jn.1989.61.2.269. [DOI] [PubMed] [Google Scholar]
- Kuwada S, Fitzpatrick DC, Batra R, Ostapoff EM. Sensitivity to interaural time differences in the dorsal nucleus of the lateral lemniscus of the unanesthetized rabbit: comparison with other structures. J Neurophysiol. 2006;95:1309–1322. doi: 10.1152/jn.00901.2005. [DOI] [PubMed] [Google Scholar]
- Leibold C. Influence of inhibitory synaptic kinetics on the interaural time difference sensitivity in a linear model of binaural coincidence detection. J Acoust Soc Am. 2010;127:931–942. doi: 10.1121/1.3282997. [DOI] [PubMed] [Google Scholar]
- Leibold C, van Hemmen JL. Spiking neurons learning phase delays: how mammals may develop auditory time-difference sensitivity. Phys Rev Lett. 2005;94:168102. doi: 10.1103/PhysRevLett.94.168102. [DOI] [PubMed] [Google Scholar]
- Lesica NA, Grothe B. Efficient temporal processing of naturalistic sounds. PLoS One. 2008;3:e1655. doi: 10.1371/journal.pone.0001655. [DOI] [PMC free article] [PubMed] [Google Scholar]
- Lesica NA, Lingner A, Grothe B. Population coding of interaural time differences in gerbils and barn owls. J Neurosci. 2010;30:11696–11702. doi: 10.1523/JNEUROSCI.0846-10.2010. [DOI] [PMC free article] [PubMed] [Google Scholar]
- Lüling H, Siveke I, Grothe B, Leibold C. Frequency-invariant representation of interaural time differences in mammals. PLoS Comput Biol. 2011;7:e1002013. doi: 10.1371/journal.pcbi.1002013. [DOI] [PMC free article] [PubMed] [Google Scholar]
- Magnusson AK, Kapfer C, Grothe B, Koch U. Maturation of glycinergic inhibition in the gerbil medial superior olive after hearing onset. J Physiol. 2005;568:497–512. doi: 10.1113/jphysiol.2005.094763. [DOI] [PMC free article] [PubMed] [Google Scholar]
- Magnusson AK, Park TJ, Pecka M, Grothe B, Koch U. Retrograde GABA signaling adjusts sound localization by balancing excitation and inhibition in the brainstem. Neuron. 2008;59:125–137. doi: 10.1016/j.neuron.2008.05.011. [DOI] [PubMed] [Google Scholar]
- Maki K, Furukawa S. Acoustical cues for sound localization by the Mongolian gerbil, Meriones unguiculatus. J Acoust Soc Am. 2005;118:872–886. doi: 10.1121/1.1944647. [DOI] [PubMed] [Google Scholar]
- McAlpine D, Martin RL, Mossop JE, Moore DR. Response properties of neurons in the inferior colliculus of the monaurally deafened ferret to acoustic stimulation of the intact ear. J Neurophysiol. 1997;78:767–779. doi: 10.1152/jn.1997.78.2.767. [DOI] [PubMed] [Google Scholar]
- McAlpine D, Jiang D, Shackleton TM, Palmer AR. Convergent input from brainstem coincidence detectors onto delay-sensitive neurons in the inferior colliculus. J Neurosci. 1998;18:6026–6039. doi: 10.1523/JNEUROSCI.18-15-06026.1998. [DOI] [PMC free article] [PubMed] [Google Scholar]
- McAlpine D, Jiang D, Shackleton TM, Palmer AR. Responses of neurons in the inferior colliculus to dynamic interaural phase cues: evidence for a mechanism of binaural adaptation. J Neurophysiol. 2000;83:1356–1365. doi: 10.1152/jn.2000.83.3.1356. [DOI] [PubMed] [Google Scholar]
- McAlpine D, Jiang D, Palmer AR. A neural code for low-frequency sound localization in mammals. Nat Neurosci. 2001;4:396–401. doi: 10.1038/86049. [DOI] [PubMed] [Google Scholar]
- Michler SA, Illing RB. Acoustic trauma induces reemergence of the growth- and plasticity-associated protein GAP-43 in the rat auditory brainstem. J Comp Neurol. 2002;451:250–266. doi: 10.1002/cne.10348. [DOI] [PubMed] [Google Scholar]
- Mogdans J, Knudsen EI. Early monaural occlusion alters the neural map of interaural level differences in the inferior colliculus of the barn owl. Brain Res. 1993;619:29–38. doi: 10.1016/0006-8993(93)91593-h. [DOI] [PubMed] [Google Scholar]
- Moore DR, Hine JE, Jiang ZD, Matsuda H, Parsons CH, King AJ. Conductive hearing loss produces a reversible binaural hearing impairment. J Neurosci. 1999;19:8704–8711. doi: 10.1523/JNEUROSCI.19-19-08704.1999. [DOI] [PMC free article] [PubMed] [Google Scholar]
- Mossop JE, Wilson MJ, Caspary DM, Moore DR. Down-regulation of inhibition following unilateral deafening. Hear Res. 2000;147:183–187. doi: 10.1016/s0378-5955(00)00054-x. [DOI] [PubMed] [Google Scholar]
- Muly SM, Gross JS, Potashner SJ. Noise trauma alters D-[3H]aspartate release and AMPA binding in chinchilla cochlear nucleus. J Neurosci Res. 2004;75:585–596. doi: 10.1002/jnr.20011. [DOI] [PubMed] [Google Scholar]
- Oliver DL. Ascending efferent projections of the superior olivary complex. Microsc Res Tech. 2000;51:355–363. doi: 10.1002/1097-0029(20001115)51:4<355::AID-JEMT5>3.0.CO;2-J. [DOI] [PubMed] [Google Scholar]
- Park TJ, Monsivais P, Pollak GD. Processing of interaural intensity differences in the LSO: role of interaural threshold differences. J Neurophysiol. 1997;77:2863–2878. doi: 10.1152/jn.1997.77.6.2863. [DOI] [PubMed] [Google Scholar]
- Park TJ, Brand A, Koch U, Ikebuchi M, Grothe B. Dynamic changes in level influence spatial coding in the lateral superior olive Hear Res. 2008;238:58–67. doi: 10.1016/j.heares.2007.10.009. [DOI] [PMC free article] [PubMed] [Google Scholar]
- Pecka M, Brand A, Behrend O, Grothe B. Interaural time difference processing in the mammalian medial superior olive: the role of glycinergic inhibition. J Neurosci. 2008;28:6914–6925. doi: 10.1523/JNEUROSCI.1660-08.2008. [DOI] [PMC free article] [PubMed] [Google Scholar]
- Pecka M, Siveke I, Grothe B, Lesica NA. Enhancement of ITD coding within the initial stages of the auditory pathway. J Neurophysiol. 2010;103:38–46. doi: 10.1152/jn.00628.2009. [DOI] [PubMed] [Google Scholar]
- Pollak GD, Burger RM, Klug A. Dissecting the circuitry of the auditory system. Trends Neurosci. 2003;26:33–39. doi: 10.1016/s0166-2236(02)00009-7. [DOI] [PubMed] [Google Scholar]
- Popescu MV, Polley DB. Monaural deprivation disrupts development of binaural selectivity in auditory midbrain and cortex. Neuron. 2010;65:718–731. doi: 10.1016/j.neuron.2010.02.019. [DOI] [PMC free article] [PubMed] [Google Scholar]
- Potashner SJ, Suneja SK, Benson CG. Altered glycinergic synaptic activities in guinea pig brain stem auditory nuclei after unilateral cochlear ablation. Hear Res. 2000;147:125–136. doi: 10.1016/s0378-5955(00)00126-x. [DOI] [PubMed] [Google Scholar]
- Reed MC, Blum JJ. Model calculations of steady-state responses to binaural stimuli in the dorsal nucleus of the lateral lemniscus. Hear Res. 1999;136:13–28. doi: 10.1016/s0378-5955(99)00096-9. [DOI] [PubMed] [Google Scholar]
- Sanes DH, Malone BJ, Semple MN. Role of synaptic inhibition in processing of dynamic binaural level stimuli. J Neurosci. 1998;18:794–803. doi: 10.1523/JNEUROSCI.18-02-00794.1998. [DOI] [PMC free article] [PubMed] [Google Scholar]
- Scott LL, Mathews PJ, Golding NL. Posthearing developmental refinement of temporal processing in principal neurons of the medial superior olive. J Neurosci. 2005;25:7887–7895. doi: 10.1523/JNEUROSCI.1016-05.2005. [DOI] [PMC free article] [PubMed] [Google Scholar]
- Seidl AH, Grothe B. Development of sound localization mechanisms in the Mongolian gerbil is shaped by early acoustic experience. J Neurophysiol. 2005;94:1028–1036. doi: 10.1152/jn.01143.2004. [DOI] [PubMed] [Google Scholar]
- Shackleton TM, McAlpine D, Palmer AR. Modelling convergent input onto interaural-delay-sensitive inferior colliculus neurones. Hear Res. 2000;149:199–215. doi: 10.1016/s0378-5955(00)00187-8. [DOI] [PubMed] [Google Scholar]
- Shneiderman A, Oliver DL, Henkel CK. Connections of the dorsal nucleus of the lateral lemniscus: an inhibitory parallel pathway in the ascending auditory system? J Comp Neurol. 1988;276:188–208. doi: 10.1002/cne.902760204. [DOI] [PubMed] [Google Scholar]
- Silverman MS, Clopton BM. Plasticity of binaural interaction. I. Effect of early auditory deprivation. J Neurophysiol. 1977;40:1266–1274. doi: 10.1152/jn.1977.40.6.1266. [DOI] [PubMed] [Google Scholar]
- Siveke I, Pecka M, Seidl AH, Baudoux S, Grothe B. Binaural response properties of low-frequency neurons in the gerbil dorsal nucleus of the lateral lemniscus. J Neurophysiol. 2006;96:1425–1440. doi: 10.1152/jn.00713.2005. [DOI] [PubMed] [Google Scholar]
- Siveke I, Leibold C, Grothe B. Spectral composition of concurrent noise affects neuronal sensitivity to interaural time differences of tones in the dorsal nucleus of the lateral lemniscus. J Neurophysiol. 2007;98:2705–2715. doi: 10.1152/jn.00275.2007. [DOI] [PubMed] [Google Scholar]
- Siveke I, Leibold C, Kaiser K, Grothe B, Wiegrebe L. Level dependent latency shifts quantified through binaural processing. J Neurophysiol. 2010;104:2224–2235. doi: 10.1152/jn.00392.2010. [DOI] [PubMed] [Google Scholar]
- Song P, Yang Y, Barnes-Davies M, Bhattacharjee A, Hamann M, Forsythe ID, Oliver DL, Kaczmarek LK. Acoustic environment determines phosphorylation state of the Kv3.1 potassium channel in auditory neurons. Nat Neurosci. 2005;8:1335–1342. doi: 10.1038/nn1533. [DOI] [PubMed] [Google Scholar]
- Spitzer MW, Semple MN. Responses of inferior colliculus neurons to time-varying interaural phase disparity: effects of shifting the locus of virtual motion. J Neurophysiol. 1993;69:1245–1263. doi: 10.1152/jn.1993.69.4.1245. [DOI] [PubMed] [Google Scholar]
- Spitzer MW, Semple MN. Neurons sensitive to interaural phase disparity in gerbil superior olive: diverse monaural and temporal response properties. J Neurophysiol. 1995;73:1668–1690. doi: 10.1152/jn.1995.73.4.1668. [DOI] [PubMed] [Google Scholar]
- Spitzer MW, Semple MN. Transformation of binaural response properties in the ascending auditory pathway: influence of time-varying interaural phase disparity. J Neurophysiol. 1998;80:3062–3076. doi: 10.1152/jn.1998.80.6.3062. [DOI] [PubMed] [Google Scholar]
- Stern RM, Jr, Slocum JE, Phillips MS. Interaural time and amplitude discrimination in noise. J Acoust Soc Am. 1983;73:1714–1722. doi: 10.1121/1.389395. [DOI] [PubMed] [Google Scholar]
- Suneja SK, Potashner SJ, Benson CG. Plastic changes in glycine and GABA release and uptake in adult brain stem auditory nuclei after unilateral middle ear ossicle removal and cochlear ablation. Exp Neurol. 1998a;151:273–288. doi: 10.1006/exnr.1998.6812. [DOI] [PubMed] [Google Scholar]
- Suneja SK, Benson CG, Potashner SJ. Glycine receptors in adult guinea pig brain stem auditory nuclei: regulation after unilateral cochlear ablation. Exp Neurol. 1998b;154:473–488. doi: 10.1006/exnr.1998.6946. [DOI] [PubMed] [Google Scholar]
- Suneja SK, Potashner SJ, Benson CG. AMPA receptor binding in adult guinea pig brain stem auditory nuclei after unilateral cochlear ablation. Exp Neurol. 2000;165:355–369. doi: 10.1006/exnr.2000.7471. [DOI] [PubMed] [Google Scholar]
- Ter-Mikaelian M, Sanes DH, Semple MN. Transformation of temporal properties between auditory midbrain and cortex in the awake Mongolian gerbil. J Neurosci. 2007;27:6091–6102. doi: 10.1523/JNEUROSCI.4848-06.2007. [DOI] [PMC free article] [PubMed] [Google Scholar]
- Tollin DJ, Yin TC. Interaural phase and level difference sensitivity in low-frequency neurons in the lateral superior olive. J Neurosci. 2005;25:10648–10657. doi: 10.1523/JNEUROSCI.1609-05.2005. [DOI] [PMC free article] [PubMed] [Google Scholar]
- Vale C, Sanes DH. The effect of bilateral deafness on excitatory and inhibitory synaptic strength in the inferior colliculus. Eur J Neurosci. 2002;16:2394–2404. doi: 10.1046/j.1460-9568.2002.02302.x. [DOI] [PubMed] [Google Scholar]
- Vale C, Schoorlemmer J, Sanes DH. Deafness disrupts chloride transporter function and inhibitory synaptic transmission. J Neurosci. 2003;23:7516–7524. doi: 10.1523/JNEUROSCI.23-20-07516.2003. [DOI] [PMC free article] [PubMed] [Google Scholar]
- Vale C, Juíz JM, Moore DR, Sanes DH. Unilateral cochlear ablation produces greater loss of inhibition in the contralateral inferior colliculus. Eur J Neurosci. 2004;20:2133–2140. doi: 10.1111/j.1460-9568.2004.03679.x. [DOI] [PubMed] [Google Scholar]
- Yin TC. Neural mechanisms of encoding binaural localization cues. In: Oertel D, Fay RR, Popper AN, editors. Integrative functions in the mammalian auditory pathway. New York: Springer; 2002. pp. 99–159. [Google Scholar]
- Yin TC, Chan JC. Interaural time sensitivity in medial superior olive of cat. J Neurophysiol. 1990;64:465–488. doi: 10.1152/jn.1990.64.2.465. [DOI] [PubMed] [Google Scholar]
- Yin TC, Kuwada S. Binaural interaction in low-frequency neurons in inferior colliculus of the cat. III. Effects of changing frequency. J Neurophysiol. 1983;50:1020–1042. doi: 10.1152/jn.1983.50.4.1020. [DOI] [PubMed] [Google Scholar]
- Zhang J, Suneja SK, Potashner SJ. Protein kinase A and calcium/calmodulin-dependent protein kinase II regulate glycine and GABA release in auditory brain stem nuclei. J Neurosci Res. 2004;75:361–370. doi: 10.1002/jnr.10850. [DOI] [PubMed] [Google Scholar]
- Zhou Y, Carney LH, Colburn HS. A model for interaural time difference sensitivity in the medial superior olive: interaction of excitatory and inhibitory synaptic inputs, channel dynamics, and cellular morphology. J Neurosci. 2005;25:3046–3058. doi: 10.1523/JNEUROSCI.3064-04.2005. [DOI] [PMC free article] [PubMed] [Google Scholar]