

Abstract
Switching flexibly between behavioral goals is a hallmark of executive control and requires integration of external and internal information. We recorded single-neuron correlates of different numerical representations (sensory-, working memory-, and rule-related activity) in the dorsal premotor area (PMd), the cingulate motor areas (CMA), and the ventral intraparietal sulcus (VIP) and compared them to previous recordings in the lateral prefrontal cortex (PFC). Two monkeys were trained to encode and memorize numerosities and flexibly switch between two abstract quantitative rules based on rule cues. Almost 20% of randomly selected PFC and PMd neurons significantly represented the numerical rule in a behaviorally relevant manner, approximately twice as many as in the CMA and VIP. Rule selectivity was significantly better for PMd neurons than for PFC cells. Seemingly at the expense of rule selectivity, however, sensory- and memory-related numerosity activity was greatly diminished compared with previous delayed match-to-numerosity studies. These findings suggest the involvement of the frontal premotor areas in strategic planning such as rule following. Moreover, the results emphasize that the coding capacities of neurons in association cortical areas are far more dynamic depending on task demands than previously thought.
Introduction
Flexible rule following is essential for goal-directed behavior and thus a key feature of executive control functions (Miller and Cohen, 2001; Stoet and Snyder, 2009). Rule following based on numerical information, such as basic “greater than/less than” judgments, is an omnipresent aspect of goal-directed behavior and constitutes a survival advantage. Apes, for example, decide whether to attack or retreat based on the number of hostile opponents relative to the number of individuals in their own group (Wilson et al., 2002). In human societies, rules applied to numerical quantities are inevitable in economy (trading) and sciences (mathematics).
Brain areas responsible for abstract rule-guided behavior based on numerical information need to be able to integrate both external information about quantities as well as internal states and goals. Among the classical cortical association areas that process abstract numerical contents, the frontal and parietal association areas are the most important (Nieder and Dehaene, 2009). Neurons in the prefrontal cortex (PFC) and the intraparietal sulcus (IPS) of macaques represent sensory numerosities and maintain this information over temporal delays (Nieder et al., 2002, 2006; Sawamura et al., 2002; Nieder and Merten, 2007; Roitman et al., 2007; Nieder, 2009). In humans, both nonsymbolic and symbolic number information activates these sites of the frontoparietal cortical network as shown in functional imaging studies (Piazza et al., 2004, 2007).
The prime candidate region to implement abstract response strategies based on numerical quantity is the PFC. Lesions of human PFC cause deficits in rule-guided behavioral planning (Milner, 1963; Nelson, 1976; Stuss et al., 2000; Badre et al., 2009). In addition, several elegant electrophysiological studies in nonhuman primates have shown that PFC neurons can flexibly group information into behaviorally meaningful categories according to task demands (White and Wise, 1999; Hoshi et al., 2000; Wallis et al., 2001; Genovesio et al., 2005; Mansouri et al., 2007) Most recently, we have reported that PFC neurons also encode abstract greater than/less than rules (Bongard and Nieder, 2010).
It is becoming increasingly evident, however, that the PFC is not processing rule-related information in isolation; rather, strategic behavior seems to require a larger network of cortical and even subcortical areas. Parts of the premotor cortex, in particular, seem to reflect abstract rules even more strongly and earlier than the PFC (Wallis and Miller, 2003). In addition, neurons in other parts of the frontal lobe, such as the anterior cingulate cortex (Johnston et al., 2007; Womelsdorf et al., 2010) or the posterior parietal cortex (Stoet and Snyder, 2004), have also become engaged during rule-guided tasks.
A better understanding of the respective contributions of different brain structures in encoding numerosity and quantitative rules requires direct comparisons of activity patterns in candidate regions, which has not been done before. To address this issue, we recorded single-cell activity from the same two monkeys in the dorsal premotor area (PMd), the cingulate motor areas (CMA) and the ventral intraparietal area (VIP) in addition to the previously reported PFC data (Bongard and Nieder, 2010). We compared the roles of these four associative cortical areas from the frontal and parietal lobes in processing numerical information and rules. With the current study, we also aimed at elucidating the potential role of premotor areas in higher order cognitive tasks requiring rule-guided response selection.
Materials and Methods
Behavioral protocol.
We trained two male rhesus monkeys (Macaca mulatta) to perform greater than/less than judgments in a computerized procedure. To start a trial, the monkey had to grasp a lever and maintain fixation. The monkeys used both arms to grab the lever. A sample numerosity was shown that the monkey had to memorize during a delay phase (delay 1). Next, a rule cue indicated whether the monkey was required to follow the greater than or less than rule. After the subsequent rule delay (delay 2), the monkey saw a test display showing a number of dots. If the greater than rule was in effect, the monkey needed to release the lever whenever the test display showed more items than the sample display, and vice versa if the less than rule was cued. The monkey had to continue holding the lever until the second test appeared (which was always a match) if the sample and test display showed a different amount of dots from the quantity rule-based number (probability of match/non-match condition = 0.5). We used two different sensory stimuli (or modalities, respectively) to cue the monkey (rule cue 1 and rule cue 2). If the cue was a visual presented red circle (rule cue 1) or a white circle presented together with a tactile drop of water (rule cue 2) then the rule to follow was to respond when the test consisted of more dots than the sample stimulus. If the cue was a blue circle (rule cue 1) or a white circle without delivering a drop of water (rule cue 2) then the rule was less than. To test a broad range of numerosities we tested monkey B with 2, 3, 5, 8, 13 as sample stimuli and monkey O with 3, 5, 8, 16 and 32. Stimuli were presented on a 15 inch monitor with a resolution of 1024 × 768 pixels.
To prevent the monkeys from using pattern recognition strategies, we generated new stimuli for every recording session and controlled for possible confounds using Matlab (MathWorks). In every session, an equal amount of standard and control stimuli was used. In the standard stimulus condition, position, size and density of the dots changed pseudo-randomly. In the control stimulus condition, the total black area of all dots (equal total area) and dot density in all displays of a given trial was constant. We presented the different numerosities and rules in a balanced and pseudo-randomized fashion. The monkeys had to keep fixation within 1.75° of the fixation point (monitored with an infrared eye-tracking system; ISCAN) from the beginning of the fixation period until the end of the delay 2 period.
Surgery and neuronal recordings.
All surgeries were performed under sterile conditions while the animals were under general anesthesia. Before the recording sessions, they were implanted with a head bolt to immobilize the head during the sessions to allow for eye movement measurement. To access the respective cortex structures, recording chambers were implanted according to stereotaxic coordinates. The animals received postoperative antibiotics and analgesics. Recordings were made from the two behaving monkeys. Arrays of up to eight tungsten microelectrodes (1 MΩ impedance) were inserted using a grid with 1 mm spacing.
Recording sites were localized using stereotaxic reconstructions from the individuals' magnetic resonance images. Recordings were made from the lateral PFC centered around the principal sulcus. In addition, single-unit activity was monitored from the PMd. Recordings in the cingulate sulcus were made from the dorsal bank [dorsal bank of parts of rostral cingulate motor area (CMAr), dorsal cingulate motor area (CMAd)] just below the PMd recording sites at a depth ranging from 7 to 10 mm below the cortical surface. We did not test whether recordings were from the forelimb or hindlimb representation part of the premotor cortex or cingulated motor areas. Consistent with this anatomical location, no neurons were encountered from 4 to 7 mm below the cortical surface, i.e., between the upper 4 mm of cortical tissue (PMd) and the dorsal bank of the cingulated sulcus below (7–10 mm below the cortical surface).
Recordings from the fundus of the IPS were exclusively done at depths ranging from 9 to 14 mm below the cortical surface (VIP). Electrodes were advanced roughly perpendicular to the cortical surface passing through the lateral or medial banks. The Horsley-Clark coordinates of the IPS recordings ranged from 3 mm posterior to 3 mm anterior. Neurons were selected at random; no attempt was made to search for any task-related activity. Separation of single-unit waveforms was performed off-line applying mainly principal component analysis (Plexon Systems). Data amplification, filtering, and acquisition were done with a Multi-channel Acquisition Processor (Plexon). All procedures were in accordance with the guidelines for animal experimentation approved by the Regierungspräsidium Tübingen, Germany.
Data analysis.
We analyzed the data in different time periods depending on the protocol. The sample phase was analyzed in a 500 ms window starting from the sample onset shifted by the individual response latency of the cell. To measure neuronal response latency, we generated average spike density histograms (at 1 ms resolution, smoothed by a sliding window; kernel bin width 10 ms) for a neuron's response to all sample stimuli. Response latency was defined by the first time bin that reached a value higher than any value before sample onset. A default latency of 100 ms was used if no measure based on these criteria could be derived. For the delay period, activity was summed in a 500 ms interval starting 200 ms after delay onset. The cue phase was analyzed in a 300 ms window starting from the cue onset shifted by the individual response latency (default 100 ms). Rule-selective activity in the second delay phase was analyzed in two consecutive windows. The first window started 100 ms after cue offset and lasted 500 ms. The following window had a duration of 600 ms. To determine the selectivity of a neuron, a two-way ANOVA (p < 0.01) was calculated for each cell in the sample and delay 1 period with the main factors sample numerosity and numerosity protocol. From the cue period on a four way ANOVA (p < 0.01) with the main factors sample numerosity, numerosity protocol, rule cue modality, and rule was calculated. Only cells showing a significant main effect of rule (p < 0.01), but no other significant main effect or interaction, were classified as being “rule selective.”
Further we analyzed the rule-selective neurons (based on the ANOVA) by comparing the spike counts in the two rule conditions using a receiver operating characteristic (ROC) analysis (Green, 1966). This analysis was performed over the second 600 ms window in the second delay. We calculated a sliding ROC analysis (in 100 ms windows moved in 20 ms steps across the second 600 ms window during the second delay) to describe the temporal evolution of individual neurons' rule selectivity. We defined the latency of the selectivity for each neuron as the time (in milliseconds) after 240 ms after cue offset, but no later than 200 ms after test one onset, for which the ROC values of one window (of 100 ms, slid by 20 ms) exceeded the 95% upper threshold of the null distribution obtained through permutation test on all trials and all conditions for each individual neuron. To derive error ROC values, we compared the activity of a greater than (less than) neuron during correct greater than (less than) trials with the activity of the same neuron when the monkey chose the smaller (larger) numerosity by mistake.
We computed a difference index (DI) for each rule-selective neuron during the second delay (second 600 ms window) by using the formula:
 |
where FR(preferred) stands for the firing rate during the preferred rule trials and FR(anti-preferred) for the firing rate during the anti-preferred trials. This index is an indicator for how well the neurons differentiate between the two rules.
Results
Two monkeys were trained to flexibly switch between two abstract quantitative rules (greater than/less than) based on rule cues (Fig. 1, see Materials and Methods). After reaching a reliable performance level (see Bongard and Nieder, 2010, their Fig. 2, for behavioral performance), we recorded the activity of randomly selected single cells in different cortical areas (right hemisphere) while the monkeys performed the task: First, the PMd in subfields of area 6 on the lateral surface of the hemisphere (Fig. 2A,C,G), predominantly caudal PMd (Wise et al., 1997). Second, parts of the dorsal bank of the cingulate sulcus belonging to the CMAr (area 24c) anterior to the genu of the arcuate sulcus, and the CMAd (area 6c) caudal to the genu of the arcuate sulcus (Fig. 2A,D,H). And third, the ventral area (VIP) in the fundus of the intraparietal sulcus. These new recordings from the PMd, the CMA, and the VIP were compared with (reanalyzed with slightly different time windows) neuronal spiking activity recorded earlier in the lateral PFC around the principal sulcus (Fig. 2A,B,F) of the very same monkeys (Bongard and Nieder, 2010). Recordings in the PMd, the CMA and the VIP were performed simultaneously, several months after the PFC recordings from the same two animals. Over all, we recorded and analyzed a total of 1618 neurons from both monkeys: 484 neurons from the PFC, 433 neurons from the PMd, 359 neurons from the CMA, and 342 neurons from VIP.
Figure 1.

Task protocol and stimuli. A, Quantity rule discrimination task. To start a trial, the monkey had to grasp a lever and maintain fixation. A sample numerosity was shown, followed by a delay 1 period. Next, a rule cue informed the monkey about the appropriate rule to apply. If the rule cue indicated the greater than rule, the monkey was required to release the lever whenever the Test 1 display showed more dots than the sample display, but maintain the lever and wait for Test 2 (which was always a match) if Test 1 depicted fewer items (probability 0.5). The opposite behavior was required whenever the less than rule was cued. B, Rule cue stimuli. We used two pairs of different sensory stimuli to cue the monkey. A red circle or a white circle with a drop of water indicated the greater than rule; a blue circle or a white circle without a drop of water cued the less than rule. C, Numerosity stimuli. Sample and corresponding choice numerosities used for monkey B (top row) and monkey O (bottom row) are shown.
Figure 2.
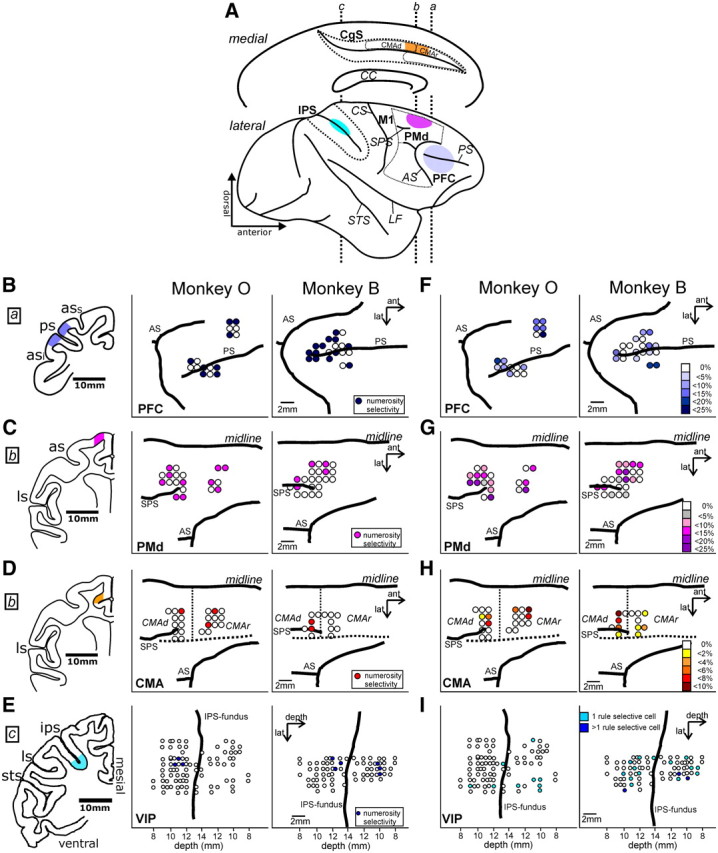
Anatomical locations of recording sites. A, Medial (top) and lateral (bottom) view of a schematic rhesus macaque brain (with IPS unfolded) showing the four recording locations in color. Dotted vertical lines labeled a–c indicate the anterior–posterior coordinates of the frontal sections shown in B–E for the PFC (a), the PMd and CMA (b, genu of the arcuate sulcus), and the VIP (c). B–E, Recording sites and location of numerosity-selective cells (color coded) during the sample period in the PFC (B; lateral view), the PMd (C; dorsal view), the CMA (D; dorsal view), and VIP (E; IPS unfolded) for monkeys O (middle column) and monkey B (right column). Note that the recording sites in the CMA (D) are projected onto the dorsal bank of the cingulated sulcus, below the cortical surface (dotted horizontal line marks fundus of sulcus). The locations of the recording sites are color coded in the corresponding frontal sections (left column). F–I, Recording sites and location of rule-selective cells (color coded) during the delay 2 period in the PFC (F; lateral view), the PMd (G; dorsal view), the CMA (H; dorsal view), and VIP (I; IPS unfolded) for monkeys O (left column) and monkey B (right column). The locations of the recording sites again correspond to the frontal sections shown in the left column of B–E. AS, Arcuate sulcus; CC, corpus callosum; CgS, cingulate sulcus; CS, central sulcus; LS, lateral sulcus; PS, principal sulcus; SPS, superior precentral sulcus; STS, superior temporal sulcus.
Overall selectivity during trial periods
Neuronal selectivity was determined in four task periods: sample, delay 1, cue, and delay 2 (first and second half) (Table 1). Only few neurons were selectively tuned to numerosity in the sample period (tested with a two-way ANOVA, with factors [sample numerosity] × [numerosity protocol], p < 0.01; only significant numerosity-main effect, no other main effects or interactions present). The highest proportion of numerosity-selective neurons during sample period was found in PMd (5.3%), followed by PFC (3.3%), VIP (2.9%) and CMA (1.9%).
Table 1.
Neural selectivity in different task periods
| Sample* | Delay 1* | Cue** | Delay 2** (first half) | Delay 2** (second half) | |
|---|---|---|---|---|---|
| PFC (484 cells) | |||||
| Percentage of cells selective for | |||||
| Only Sample Numerosity | 3.3 | 4.5 | 0.2 | 0.6 | 2.1 |
| Only Numerosity Protocol | 0.4 | 0.6 | 0 | 0.6 | 0 |
| Only Cue Modality | — | — | 11 | 6.6 | 3.9 |
| Only Rule | — | — | 1.9 | 7.4 | 18.6 |
| Interactions between main factors | 2.5 | 0.8 | 12.6 | 12.2 | 10.4 |
| PMd (433 cells) | |||||
| Percentage of cells selective for | |||||
| Only Sample Numerosity | 5.3 | 2.1 | 0.2 | 0.2 | 0.7 |
| Only Numerosity Protocol | 2.3 | 0.8 | 0.5 | 0.7 | 0.7 |
| Only Cue Modality | — | — | 11.3 | 7.6 | 3 |
| Only Rule | — | — | 3.9 | 6.7 | 16.9 |
| Interactions between main factors | 2.5 | 1.6 | 11.8 | 15.7 | 14.1 |
| CMA (356 cells) | |||||
| Percentage of cells selective for | |||||
| Only Sample Numerosity | 1.9 | 1.1 | 0 | 0.3 | 0.6 |
| Only Numerosity Protocol | 2.2 | 0.3 | 0.8 | 0.8 | 0.6 |
| Only Cue Modality | — | — | 7.2 | 7.8 | 4.7 |
| Only Rule | — | — | 1.1 | 5.6 | 7.2 |
| Interactions between main factors | 1.4 | 1.7 | 9.7 | 12.5 | 15.9 |
| VIP (342 cells) | |||||
| Percentage of cells selective for | |||||
| Only Sample Numerosity | 2.9 | 0.6 | 1.2 | 0.3 | 1.2 |
| Only Numerosity Protocol | 0.3 | 0.6 | 0.9 | 0.9 | 2 |
| Only Cue Modality | — | — | 4.1 | 4.1 | 5 |
| Only Rule | — | — | 5.3 | 5.3 | 9.4 |
| Any interaction | 2 | 0.6 | 11.7 | 11.1 | 9.4 |
*Two-factor ANOVA, p < 0.05;
**four-factor ANOVA, p < 0.01.
Based on anatomical landmarks, we recorded approximately half of the neurons anterior to the level of the genu of the arcuate sulcus on the lateral surface of the hemisphere (dorsal wall of CMAr), and the other half posterior to the level of the genu of the arcuate sulcus (CMAd) (Fig. 2D,H). Both the number of numerosity-selective cells and the number of rule-selective cells in these two areas were similar (χ2 test, p > 0.05). We therefore pooled the neurons of the CMA.
During the delay 1 period, the monkeys were required to memorize the sample numerosity, but were not yet informed about the rule to apply. Again, only few cells were tuned to numerosity during this working memory period (tested with a two-way ANOVA, with factors [sample numerosity] × [numerosity protocol], p < 0.01; only significant numerosity-main effect, no other main effects or interactions present). The largest fraction was found in PFC (4.5%), followed by PMd (2.1%), CMA (1.1%), and finally VIP (0.6%).
In the following rule-cue period, the two quantitative rules were indicated by two different rule-cue modalities, and cue modality was the most dominant information encoded by neurons in all areas (tested with a four-way ANOVA, with factors [sample numerosity] × [numerosity protocol] × [cue modality] × [rule], p < 0.01). In both PFC and PMd, 11% of the neurons were responsive to cue modality only, and a similar fraction of neurons showed interactions between the main factors mainly based on cue modality influences. Interactions between main factors involving cue modality were mainly present in CMA and VIP neurons.
The subsequent delay 2 period was the first waiting phase in which the monkeys had been informed about the quantitative rule to apply, but before they could know how to respond to the test display. With time after the rule cue, the neurons in all four areas became progressively more selective to the quantitative rule only. During the first half of the delay 2 period, many neurons in all brain regions encoded both the cued rule as well as the cue modality (resulting in a high proportion of cells exhibiting interaction between main factors) (Table 1). In the second half of the delay 2 phase, however, almost 20% of the neurons in PFC and PMd selectively encoded the less than/greater than rule. Rule selectivity was independent of the sample numerosity, the stimulus protocol or the sensory rule cues (again tested with a four-way ANOVA; only significant rule main effect, no other main effects or interactions present, p < 0.01). Pure rule selectivity was much less prominent in the VIP (9.4%) and CMA (7.2%). Compared to all other factors, however, the quantitative rule was the type of information that was encoded by the largest proportion of neurons in the delay 2 period in the respective areas. We therefore confined all further analyses to the second half of the delay 2 period. All displays and analysis in the following figures are based on purely rule-selective neurons.
Selectivity to quantitative rules
Neurons selective to the quantitative rules responded significantly stronger to either the less than or the greater than rule in the late delay 2 phase. The responses of example purely rule-selective neurons from each of the four cortical areas are shown in detail in the dot-raster and spike-density histograms in Figure 3, A–D. Each cell significantly increased discharge after the monkey was cued with the less than rule (blue colors) compared with the greater than rule (red colors). Only example neurons preferring the less than rule are shown for comparison reasons; approximately half of the rule-selective neurons preferred the alternative greater than rule. Only correct trials are shown. Significantly more rule-selective neurons were present in the delay 2 period in both the PFC (18.6%) and the PMd (16.9%) than in the CMA (7.2%) or the VIP (9.4%) (χ2 test, p < 0.01) (Fig. 4A).
Figure 3.
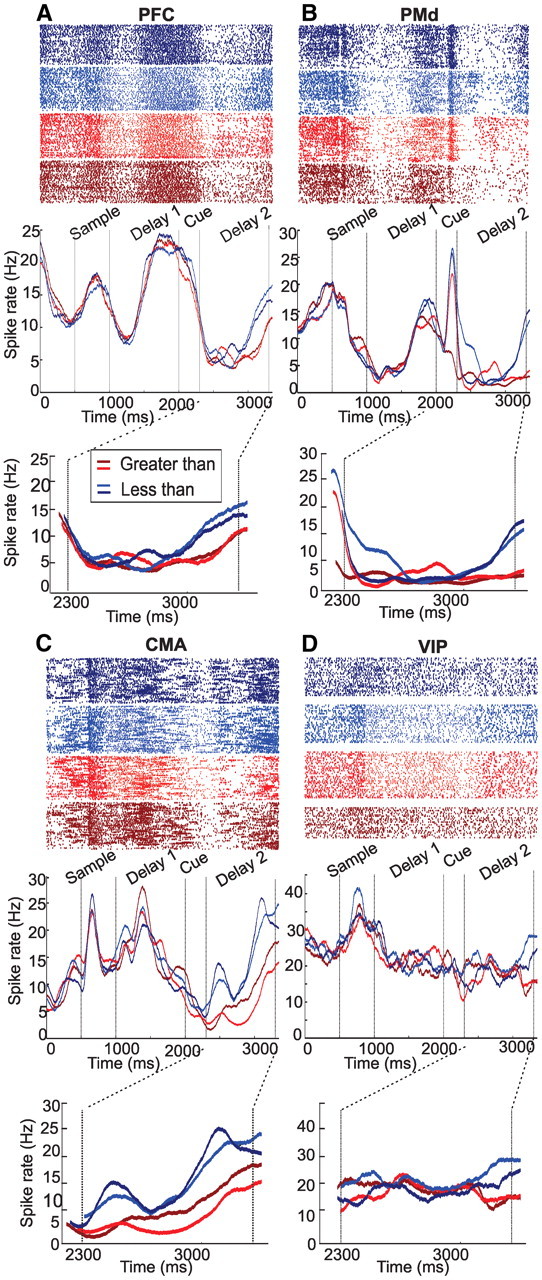
Examples of rule-selective cells from the four areas. A, Example rule-selective PFC neuron. Dot-raster histograms (each dot represents an action potential) and spike density functions (activity averaged over all trials and smoothed by a 150 ms Gaussian kernel) are depicted. This typical rule-selective example neuron increases its firing rate for the less than rule in blue (different blue values indicate the two different rule cues) as opposed to the greater than rule (red) toward the end of the second delay period. Rule selectivity was independent of cue modality. B–D, Example rule-selective neurons recorded in the PMd (B), CMA (C), and VIP (D). All neurons showed prominent discharge rate modulation during the fixation period (0–500 ms), the sample presentation (500–1000 ms), the delay 1 period (1000–2000 ms), and the rule-cue period (2000–2300 ms). This activity modulation, however, was not tuned to numerosity, but rather reflected general sensory and/or memory aspects.
Figure 4.

Quantity and quality of rule-selective neurons. A, Frequency distribution of rule-selective cells in PFC, PMd, CMA and VIP. B, Difference Index. Asterisks indicate significant differences: *p < 0.05), **p < 0.01.
We characterized the quality of rule selectivity using two measures. First, we calculated the selectivity indices of individual rule-selective neurons based on their average firing rates (see Materials and Methods). Higher indices indicate that neurons discriminated well between the greater than and less than rule. Neurons in the PMd discriminated the greater than and the less than rule better compared with neurons in the PFC and CMA (Mann–Whitney U test, p < 0.05) (Fig. 4B).
As a second measure of the quality of rule coding, we applied a ROC analysis performed over the same time window used for the ANOVA during the second half of the second delay. The values of the area under the ROC curves (AUC) could range from 0.5 (no rule information) to 1.0 (perfect discrimination between greater than and less than trials; greater than selective) and 0 (perfect discrimination between greater than and less than trials; less than selective). Compared with the previous ANOVA, the AUC values were not significantly different from 0.5 in four PFC and PMd neurons, five CMA neurons, and three VIP neurons (permutation test, p < 0.05); these neurons were excluded from further analysis.
A comparison of AUROC value distributions resulted in bimodal distributions in the three frontal lobe areas (Fig. 5A–C), indicating that approximately half of the neurons preferred the rule greater than, whereas the other half preferred the rule less than (Binomial test, p > 0.05). In contrast, a prevalence of less than neurons was detected in the VIP (Binomial test, p < 0.05) (Fig. 5D).
Figure 5.

Neuronal discrimination performance. Distribution of Area-under-the-ROC-curve values of PFC (A), PMd (B), CMA (C), and VIP (D) neurons encoding the rule during correct trials in the second half of the second delay period. By convention, AUC values smaller than 0.5 (black) represent neurons that were significantly preferring the less than rule, whereas values larger than 0.5 (gray) indicate neurons preferring the greater than rule.
The coding quality (based on AUROC values) of greater than and less than neurons was similar within the PFC (mean greater than: 0.62; less than: 0.39; Fig. 5A), the PMd (mean greater than: 0.63; less than: 0.33; Fig. 5B) and the CMA (mean greater than: 0.67; less than: 0.35; Fig. 5C) (Mann–Whitney U test, p > 0.05). To compare overall rule selectivity between frontal lobe areas, the AUC values of the less than neurons (ranging from 0.5 to 0, by definition) were subtracted from one (1-AUC of less than neurons) and pooled with the AUROC values of the greater than neurons in the respective recording area. A comparison of overall rule selectivity based on these distributions of the AUC values from the PFC, the PMd and CMA revealed significant differences between the three frontal lobe areas (ANOVA, p = 0.01); on average, neurons in the PMd were significantly more selective than PFC neurons (post hoc Scheffé test, p < 0.05).
Next, we investigated the temporal dynamics of rule selectivity for individual rule-selective neurons in the four cortical areas. To that aim, we performed a sliding window ROC analysis using a 100 ms time window, incremented by 20 ms steps for each of the significant PFC, PMd, CMA, and VIP neurons (Fig. 6). To test these ROC values statistically, we also conducted a shuffling predictor analysis (see Materials and Methods for details). The neurons in Figure 6 were sorted according to the onset of rule selectivity as indicated by a white curve in Figure 6, A–D. Latency differences between the respective areas could not be detected (Kruskal–Wallis test, p > 0.05). For most neurons, rule selectivity persisted until the test stimulus was presented. Across the populations of rule-selective neurons, the average ROC values increased over time, indicating that not only more and more neurons became selective, but also that the ability of the neurons to discriminate between the rules increases with time.
Figure 6.
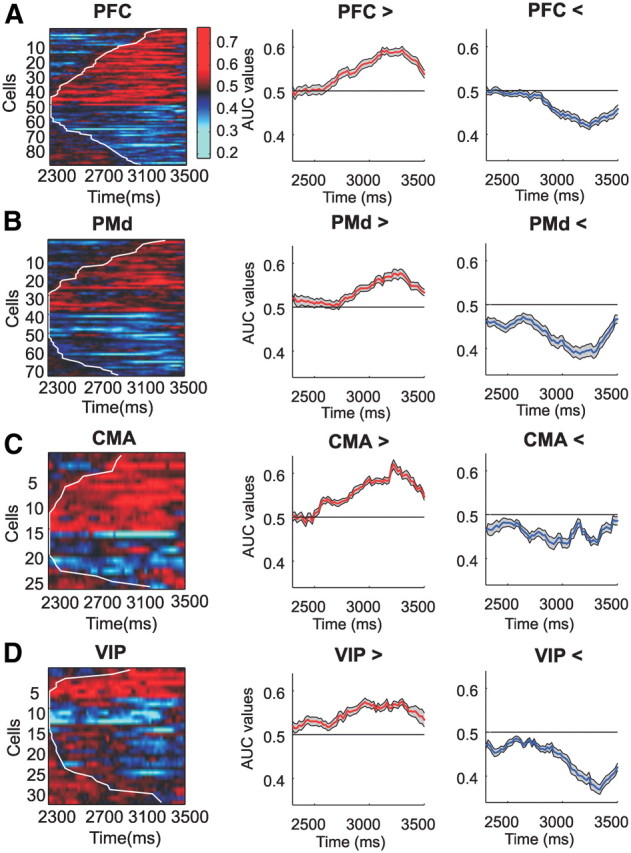
Temporal evolution of AUC values for all individual rule-selective neurons in the four brain areas. A–D, Single-neuron AUC values for the four different areas. Neurons are sorted according to rule preference and latency of rule selectivity (white line in the color maps). Each row in the color map represents the AUC value time course of one rule-selective neuron. Red color indicates AUC values larger than 0.5, thus representing preference for the greater than rule. Blue color represents preference for the smaller than rule. The two panels to the right of the color map show the average AUC values for the populations of neurons preferring the greater than (middle column, red curve) and the less than rule (right column, blue curve).
Correlation between neuronal and behavioral responses
An examination of error trials provides direct evidence that the activity of rule-selective neurons contributed to behavior. We compared the neuronal discharge of individual cells when the monkeys completed a trial correctly with trials in which the monkeys chose the wrong test numerosity. If rule-selective neurons played a role in the subjects' rule-guided behavior, rule selectivity should be weakened whenever the monkeys make an error. In agreement with this assumption, we found that AUC values were significantly decreased in error trials relative to correct trials in all four tested areas (Wilcoxon signed rank test, p < 0.05). Significant differences between areas were absent. As a result, the bimodal distribution of the ROC values of greater than/less than neurons became less clear or approached a normal distribution during error trials (Fig. 7).
Figure 7.

Responses of rule-selective neurons during error trials. Frequency histogram of AUC values of rule-selective neurons recorded in the PFC, PMd, CMA, and VIP calculated for the second half of the second delay during error trials. Same layout as in Figure 5.
Discussion
In this study, we compared single-cell correlates during numerical rule following in three frontal cortex areas (the lateral PFC, the PMd and the cingulate sulcus) and one posterior parietal area (VIP). The coding properties of neurons in these areas mainly differed in degree rather than category: All investigated task parameters (sample numerosity, numerosity working memory, rule cue modality, and greater than/less than rules) were represented in the four areas, albeit with interesting differences that will be discussed in the following.
Premotor cortex connectivity in a frontoparietal network
The prefrontal and posterior parietal association areas have been identified as the most important cortical association areas for the representation of numerosity and numbers (Nieder and Dehaene, 2009). The putative involvement of the premotor cortex in numerical processing so far has not been addressed.
The premotor cortex is operationally defined as regions in the frontal lobe that project directly to primary motor cortex (M1) in primates (Dum and Strick, 2002). Among the six spatially separate premotor areas, we recorded from three of those: the PMd, located just rostral to M1 in dorsal subfields of area 6 on the lateral surface of the hemisphere, the CMAr (area 24c), and the CMAd (area 6c) of the cingulate sulcus. The PMd (primarily the rostral part) receives main inputs form the dorsal PFC (Luppino et al., 2003), but also from the superior parietal lobule, and (to a smaller extent) from VIP, lateral intraparietal sulcus, and area 7a of the inferior parietal lobule (Luppino et al., 1999; Tanné-Gariépy et al., 2002). Neurons of the PMd thus could access numerical information both via the PFC and the IPS. In the cingulate sulcus, the CMAr is also interconnected with the prefrontal cortex (Lu et al., 1994). In contrast, the CMAd lacks direct PFC input (Lu et al., 1994).
Based on the anatomical connectivity, these areas of the premotor cortex are well positioned to support high-level cognition. The premotor cortex is not only involved in motor preparation and execution, but plays an important role in the selection of the appropriate action from the potential options during conversion of sensory information into action (Hoshi and Tanji, 2007), a conclusion supported by our findings.
Lack of sensory- and memory-related numerosity activity
Based on the design of our task-switching protocol, purely sensory-related signals in the sample period and purely memory-related signals in the delay 1 period could be discerned. The stimulus protocol of the first part of the trial (numerosity encoding and first working memory phase) was identical to previous delayed match-to-numerosity tasks (Nieder et al., 2002; Nieder and Merten, 2007). Only after presentation of the rule cue and the subsequent second delay period (delay 2), the trial deviated from a simple delayed match-to-sample task. In contrast to our previous findings, only very few neurons in all four tested areas were tuned to the numerical value of the sample display.
Because we applied the identical statistical tests to the sample and delay 1 period in all studies, a direct comparison of the fraction of only numerosity-selective neurons in the PFC and ventral IPS was possible. The average proportion of numerosity-selective neurons in the PFC (calculated over four different studies) dropped from 29% during the sample period and 31% during the delay 1 period in delayed match to sample tasks (Nieder et al., 2002; Nieder and Merten, 2007; Diester and Nieder, 2008; Tudusciuc and Nieder, 2009) to 3% and 5%, respectively, during the current rule following task. The lack of working memory-related activity is particularly surprising in the PFC, the brain area commonly thought to be most important for working memory storage (Fuster, 2008). Memory-related activity was virtually absent also in the PMd and CMA.
In VIP, the average proportion of numerosity-selective neurons (calculated over four different studies) dropped from 14% during the sample period and 17% during the delay 1 period in delayed match to sample tasks (Nieder and Miller, 2004; Nieder et al., 2006; Diester and Nieder, 2007; Tudusciuc and Nieder, 2007) to 3% and 0.6%, respectively, during the current rule following task. These findings during sample and memory periods are in striking contrast to many studies using delayed response tasks (Romo et al., 1999), including our own studies (Nieder et al., 2002, 2006; Diester and Nieder, 2007, 2008; Vallentin and Nieder, 2008, 2010). Because we recorded from the same PFC and VIP areas as in previous studies, we speculate that these activity differences are related to the flexible recruitment of neurons.
Selectivity to numerical rules
Among the four association cortices we recorded from, the involvement of the PFC and the PMd in rule coding clearly stands out. Compared with the CMA and VIP with <10% of rule-selective neurons, twice as many (almost 20%) of randomly selected PFC neurons (Bongard and Nieder, 2010) and PMd neurons encoded basic numerical rules during the late delay 2 phase. In fact, the most prevalent neuronal activity (among the four task parameters analyzed) in both PFC and PMd reflected the greater than/less than rules. Rule preference was balanced among neurons. Both selectivity measures derived from direct spike counts and ROC analyses, respectively, revealed that PMd neurons were even more rule-selective than PFC neurons. Because the PMd data were recorded after the PFC data, learning effects cannot be excluded.
Wallis and Miller (2003) had also observed stronger and earlier abstract rule coding by PMd neurons (yet from the ventral part of the PMd) relative to PFC neurons for abstract “same/different” rules. Since the PFC, which is typically regarded to operate at the cognitive apex of the cortical hierarchy (Fuster, 2008), sends output to the PMd (Barbas and Pandya, 1987, 1989; Pandya and Yeterian, 1990) it was suggested that highly familiar and well practiced rules might be encoded in more “downstream” motor system structures like the PMd, rather than the PFC which is thought to be primarily involved in learning new rules (Muhammad et al., 2006). This notion is supported by the finding that PFC neurons are more strongly activated during new learning than during familiar cue response associations (Asaad et al., 1998).
An equally important region in cognitive control is the anterior cingulate cortex (ACC), which interacts robustly with dorsolateral prefrontal areas (Barbas and Pandya, 1989). Unlike dorsolateral areas, the anterior cingulate sulcus has strong reciprocal connections with limbic structures and is thought to have a key role in cognitive–emotional interactions (Paus, 2001; Mansouri et al., 2009). ACC lesions impair the guiding of voluntary choices based on the history of actions and outcomes (Kennerley et al., 2006). Electrophysiological studies also demonstrated that ACC neurons encode action-reward combinations (Matsumoto et al., 2007; Buckley et al., 2009). More recently, Womelsdorf al. (2010) reported that local field potential theta-activity in the ACC predicts task rules. We show that CMA neurons are involved in coding greater than/less than rules, but the frequency (7%) of such neurons is far smaller than in the PFC and PMd.
The posterior parietal cortex (PPC), which is functionally interconnected with the PFC (Quintana et al., 1989; Chafee and Goldman-Rakic, 2000; Petrides and Pandya, 2002), is traditionally discussed in the realm of spatial information processing (Andersen et al., 1997). In recent years, however, it is becoming increasingly clear that this is only one role of the PPC (Freedman, 2004; Freedman and Assad, 2009). For instance, Stoet and Snyder (2004) reported that a subset of neurons in the lateral bank of the intraparietal sulcus responded selectively to cues for different task rules. Here we report that a small fraction of neurons in the ventral IPS is also selectively tuned to numerical rules.
Regardless of the differences in cell frequency and rule selectivity, rule coding in all four cortical areas was directly related to the monkeys' task performance. If the animals made wrong decisions, the AUC values in the delay 2 rule period were significantly reduced. Thus, whenever the rule-selective neurons did not properly encode “their” rule by maximum discharges, the monkeys' behavior was error-prone.
Conclusion
Almost 20% of randomly selected PFC and PMd neurons significantly represented the numerical rule, approximately twice as many as in the CMA and VIP. Rule selectivity was significantly better for PMd neurons than for PFC cells. Seemingly at the expense of rule selectivity, however, sensory- and memory-related numerosity activity predominantly observed in previous studies was greatly diminished in a numerical task-switching protocol. We hypothesize that with increasing task demand, coding capacities in a wider frontoparietal network are switched from lower-level representations (of sensory categories and pure working memory) to higher-level executive functioning aspects (such as rule switching). This hypothesis needs to be tested in future investigations. We predict that such adjustment would also occur during complex non-numerical tasks and that the coding capacities of neurons in many association cortical areas are far more dynamic and adjustable than previously thought.
Footnotes
This work was supported by a grant (C11/SFB 550) from the German Research Foundation (Deutsche Forschungsgemeinschaft), and a grant from the VolkswagenStiftung to A.N.
References
- Andersen RA, Snyder LH, Bradley DC, Xing J. Multimodal representation of space in the posterior parietal cortex and its use in planning movements. Annu Rev Neurosci. 1997;20:303–330. doi: 10.1146/annurev.neuro.20.1.303. [DOI] [PubMed] [Google Scholar]
- Asaad WF, Rainer G, Miller EK. Neural activity in the primate prefrontal cortex during associative learning. Neuron. 1998;21:1399–1407. doi: 10.1016/s0896-6273(00)80658-3. [DOI] [PubMed] [Google Scholar]
- Badre D, Hoffman J, Cooney JW, D'Esposito M. Hierarchical cognitive control deficits following damage to the human frontal lobe. Nat Neurosci. 2009;12:515–522. doi: 10.1038/nn.2277. [DOI] [PMC free article] [PubMed] [Google Scholar]
- Barbas H, Pandya DN. Architecture and frontal cortical connections of the premotor cortex (area 6) in the rhesus monkey. J Comp Neurol. 1987;256:211–228. doi: 10.1002/cne.902560203. [DOI] [PubMed] [Google Scholar]
- Barbas H, Pandya DN. Architecture and intrinsic connections of the prefrontal cortex in the rhesus monkey. J Comp Neurol. 1989;286:353–375. doi: 10.1002/cne.902860306. [DOI] [PubMed] [Google Scholar]
- Bongard S, Nieder A. Basic mathematical rules are encoded by primate prefrontal cortex neurons. Proc Natl Acad Sci U S A. 2010;107:2277–2282. doi: 10.1073/pnas.0909180107. [DOI] [PMC free article] [PubMed] [Google Scholar]
- Buckley MJ, Mansouri FA, Hoda H, Mahboubi M, Browning PG, Kwok SC, Phillips A, Tanaka K. Dissociable components of rule-guided behavior depend on distinct medial and prefrontal regions. Science. 2009;325:52–58. doi: 10.1126/science.1172377. [DOI] [PubMed] [Google Scholar]
- Chafee MV, Goldman-Rakic PS. Inactivation of parietal and prefrontal cortex reveals interdependence of neural activity during memory-guided saccades. J Neurophysiol. 2000;83:1550–1566. doi: 10.1152/jn.2000.83.3.1550. [DOI] [PubMed] [Google Scholar]
- Diester I, Nieder A. Semantic associations between signs and numerical categories in the prefrontal cortex. PLoS Biol. 2007;5:e294. doi: 10.1371/journal.pbio.0050294. [DOI] [PMC free article] [PubMed] [Google Scholar]
- Diester I, Nieder A. Complementary contributions of prefrontal neuron classes in abstract numerical categorization. J Neurosci. 2008;28:7737–7747. doi: 10.1523/JNEUROSCI.1347-08.2008. [DOI] [PMC free article] [PubMed] [Google Scholar]
- Dum RP, Strick PL. Motor areas in the frontal lobe of the primate. Physiol Behav. 2002;77:677–682. doi: 10.1016/s0031-9384(02)00929-0. [DOI] [PubMed] [Google Scholar]
- Freedman DJ. Posterior parietal cortex: Space—and beyond. Neuron. 2004;42:881–883. doi: 10.1016/j.neuron.2004.06.010. [DOI] [PubMed] [Google Scholar]
- Freedman DJ, Assad JA. Distinct encoding of spatial and nonspatial visual information in parietal cortex. J Neurosci. 2009;29:5671–5680. doi: 10.1523/JNEUROSCI.2878-08.2009. [DOI] [PMC free article] [PubMed] [Google Scholar]
- Fuster J. The prefrontal cortex. Ed 4. London: Academic; 2008. [Google Scholar]
- Genovesio A, Brasted PJ, Mitz AR, Wise SP. Prefrontal cortex activity related to abstract response strategies. Neuron. 2005;47:307–320. doi: 10.1016/j.neuron.2005.06.006. [DOI] [PMC free article] [PubMed] [Google Scholar]
- Green DM, SJ . Signal detection theory and psychophysics. New York: Wiley; 1966. [Google Scholar]
- Hoshi E, Tanji J. Distinctions between dorsal and ventral premotor areas: anatomical connectivity and functional properties. Curr Opin Neurobiol. 2007;17:234–242. doi: 10.1016/j.conb.2007.02.003. [DOI] [PubMed] [Google Scholar]
- Hoshi E, Shima K, Tanji J. Neuronal activity in the primate prefrontal cortex in the process of motor selection based on two behavioral rules. J Neurophysiol. 2000;83:2355–2373. doi: 10.1152/jn.2000.83.4.2355. [DOI] [PubMed] [Google Scholar]
- Johnston K, Levin HM, Koval MJ, Everling S. Top-down control-signal dynamics in anterior cingulate and prefrontal cortex neurons following task switching. Neuron. 2007;53:453–462. doi: 10.1016/j.neuron.2006.12.023. [DOI] [PubMed] [Google Scholar]
- Kennerley SW, Walton ME, Behrens TE, Buckley MJ, Rushworth MF. Optimal decision making and the anterior cingulate cortex. Nat Neurosci. 2006;9:940–947. doi: 10.1038/nn1724. [DOI] [PubMed] [Google Scholar]
- Lu MT, Preston JB, Strick PL. Interconnections between the prefrontal cortex and the premotor areas in the frontal lobe. J Comp Neurol. 1994;341:375–392. doi: 10.1002/cne.903410308. [DOI] [PubMed] [Google Scholar]
- Luppino G, Murata A, Govoni P, Matelli M. Largely segregated parietofrontal connections linking rostral intraparietal cortex (areas AIP and VIP) and the ventral premotor cortex (areas F5 and F4) Exp Brain Res. 1999;128:181–187. doi: 10.1007/s002210050833. [DOI] [PubMed] [Google Scholar]
- Luppino G, Rozzi S, Calzavara R, Matelli M. Prefrontal and agranular cingulate projections to the dorsal premotor areas F2 and F7 in the macaque monkey. Eur J Neurosci. 2003;17:559–578. doi: 10.1046/j.1460-9568.2003.02476.x. [DOI] [PubMed] [Google Scholar]
- Mansouri FA, Buckley MJ, Tanaka K. Mnemonic function of the dorsolateral prefrontal cortex in conflict-induced behavioral adjustment. Science. 2007;318:987–990. doi: 10.1126/science.1146384. [DOI] [PubMed] [Google Scholar]
- Mansouri FA, Tanaka K, Buckley MJ. Conflict-induced behavioural adjustment: a clue to the executive functions of the prefrontal cortex. Nat Rev Neurosci. 2009;10:141–152. doi: 10.1038/nrn2538. [DOI] [PubMed] [Google Scholar]
- Matsumoto M, Matsumoto K, Tanaka K. Effects of novelty on activity of lateral and medial prefrontal neurons. Neurosci Res. 2007;57:268–276. doi: 10.1016/j.neures.2006.10.017. [DOI] [PubMed] [Google Scholar]
- Miller EK, Cohen JD. An integrative theory of prefrontal cortex function. Annu Rev Neurosci. 2001;24:167–202. doi: 10.1146/annurev.neuro.24.1.167. [DOI] [PubMed] [Google Scholar]
- Milner B. Effects of different brain lesions on card sorting. Arch Neurol. 1963;9:90–100. [Google Scholar]
- Muhammad R, Wallis JD, Miller EK. A comparison of abstract rules in the prefrontal cortex, premotor cortex, inferior temporal cortex, and striatum. J Cogn Neurosci. 2006;18:974–989. doi: 10.1162/jocn.2006.18.6.974. [DOI] [PubMed] [Google Scholar]
- Nelson HE. A modified card sorting test sensitive to frontal lobe defects. Cortex. 1976;12:313–324. doi: 10.1016/s0010-9452(76)80035-4. [DOI] [PubMed] [Google Scholar]
- Nieder A. Prefrontal cortex and the evolution of symbolic reference. Curr Opin Neurobiol. 2009;19:99–108. doi: 10.1016/j.conb.2009.04.008. [DOI] [PubMed] [Google Scholar]
- Nieder A, Dehaene S. Representation of number in the brain. Annu Rev Neurosci. 2009;32:185–208. doi: 10.1146/annurev.neuro.051508.135550. [DOI] [PubMed] [Google Scholar]
- Nieder A, Merten K. A labeled-line code for small and large numerosities in the monkey prefrontal cortex. J Neurosci. 2007;27:5986–5993. doi: 10.1523/JNEUROSCI.1056-07.2007. [DOI] [PMC free article] [PubMed] [Google Scholar]
- Nieder A, Miller EK. Analog numerical representations in rhesus monkeys: evidence for parallel processing. J Cogn Neurosci. 2004;16:889–901. doi: 10.1162/089892904970807. [DOI] [PubMed] [Google Scholar]
- Nieder A, Freedman DJ, Miller EK. Representation of the quantity of visual items in the primate prefrontal cortex. Science. 2002;297:1708–1711. doi: 10.1126/science.1072493. [DOI] [PubMed] [Google Scholar]
- Nieder A, Diester I, Tudusciuc O. Temporal and spatial enumeration processes in the primate parietal cortex. Science. 2006;313:1431–1435. doi: 10.1126/science.1130308. [DOI] [PubMed] [Google Scholar]
- Pandya DN, Yeterian EH. Prefrontal cortex in relation to other cortical areas in rhesus monkey: architecture and connections. Prog Brain Res. 1990;85:63–94. doi: 10.1016/s0079-6123(08)62676-x. [DOI] [PubMed] [Google Scholar]
- Paus T. Primate anterior cingulate cortex: where motor control, drive and cognition interface. Nat Rev Neurosci. 2001;2:417–424. doi: 10.1038/35077500. [DOI] [PubMed] [Google Scholar]
- Petrides M, Pandya DN. Comparative cytoarchitectonic analysis of the human and the macaque ventrolateral prefrontal cortex and corticocortical connection patterns in the monkey. Eur J Neurosci. 2002;16:291–310. doi: 10.1046/j.1460-9568.2001.02090.x. [DOI] [PubMed] [Google Scholar]
- Piazza M, Izard V, Pinel P, Le Bihan D, Dehaene S. Tuning curves for approximate numerosity in the human intraparietal sulcus. Neuron. 2004;44:547–555. doi: 10.1016/j.neuron.2004.10.014. [DOI] [PubMed] [Google Scholar]
- Piazza M, Pinel P, Le Bihan D, Dehaene S. A magnitude code common to numerosities and number symbols in human intraparietal cortex. Neuron. 2007;53:293–305. doi: 10.1016/j.neuron.2006.11.022. [DOI] [PubMed] [Google Scholar]
- Quintana J, Fuster JM, Yajeya J. Effects of cooling parietal cortex on prefrontal units in delay tasks. Brain Res. 1989;503:100–110. doi: 10.1016/0006-8993(89)91709-5. [DOI] [PubMed] [Google Scholar]
- Roitman JD, Brannon EM, Andrews JR, Platt ML. Nonverbal representation of time and number in adults. Acta Psychol (Amst) 2007;124:296–318. doi: 10.1016/j.actpsy.2006.03.008. [DOI] [PubMed] [Google Scholar]
- Romo R, Brody CD, Hernández A, Lemus L. Neuronal correlates of parametric working memory in the prefrontal cortex. Nature. 1999;399:470–473. doi: 10.1038/20939. [DOI] [PubMed] [Google Scholar]
- Sawamura H, Shima K, Tanji J. Numerical representation for action in the parietal cortex of the monkey. Nature. 2002;415:918–922. doi: 10.1038/415918a. [DOI] [PubMed] [Google Scholar]
- Stoet G, Snyder LH. Single neurons in posterior parietal cortex of monkeys encode cognitive set. Neuron. 2004;42:1003–1012. doi: 10.1016/j.neuron.2004.06.003. [DOI] [PubMed] [Google Scholar]
- Stoet G, Snyder LH. Neural correlates of executive control functions in the monkey. Trends Cogn Sci. 2009;13:228–234. doi: 10.1016/j.tics.2009.02.002. [DOI] [PMC free article] [PubMed] [Google Scholar]
- Stuss DT, Levine B, Alexander MP, Hong J, Palumbo C, Hamer L, Murphy KJ, Izukawa D. Wisconsin Card Sorting Test performance in patients with focal frontal and posterior brain damage: effects of lesion location and test structure on separable cognitive processes. Neuropsychologia. 2000;38:388–402. doi: 10.1016/s0028-3932(99)00093-7. [DOI] [PubMed] [Google Scholar]
- Tanné-Gariépy J, Rouiller EM, Boussaoud D. Parietal inputs to dorsal versus ventral premotor areas in the macaque monkey: evidence for largely segregated visuomotor pathways. Exp Brain Res. 2002;145:91–103. doi: 10.1007/s00221-002-1078-9. [DOI] [PubMed] [Google Scholar]
- Tudusciuc O, Nieder A. Neuronal population coding of continuous and discrete quantity in the primate posterior parietal cortex. Proc Natl Acad Sci U S A. 2007;104:14513–14518. doi: 10.1073/pnas.0705495104. [DOI] [PMC free article] [PubMed] [Google Scholar]
- Tudusciuc O, Nieder A. Contributions of primate prefrontal and posterior parietal cortices to length and numerosity representation. J Neurophysiol. 2009;101:2984–2994. doi: 10.1152/jn.90713.2008. [DOI] [PubMed] [Google Scholar]
- Vallentin D, Nieder A. Behavioral and prefrontal representation of spatial proportions in the monkey. Curr Biol. 2008;18:1420–1425. doi: 10.1016/j.cub.2008.08.042. [DOI] [PubMed] [Google Scholar]
- Vallentin D, Nieder A. Representations of visual proportions in the primate posterior parietal and prefrontal cortices. Eur J Neurosci. 2010;32:1380–1387. doi: 10.1111/j.1460-9568.2010.07427.x. [DOI] [PubMed] [Google Scholar]
- Wallis JD, Miller EK. From rule to response: neuronal processes in the premotor and prefrontal cortex. J Neurophysiol. 2003;90:1790–1806. doi: 10.1152/jn.00086.2003. [DOI] [PubMed] [Google Scholar]
- Wallis JD, Anderson KC, Miller EK. Single neurons in prefrontal cortex encode abstract rules. Nature. 2001;411:953–956. doi: 10.1038/35082081. [DOI] [PubMed] [Google Scholar]
- White IM, Wise SP. Rule-dependent neuronal activity in the prefrontal cortex. Exp Brain Res. 1999;126:315–335. doi: 10.1007/s002210050740. [DOI] [PubMed] [Google Scholar]
- Wilson ML, Britton NF, Franks NR. Chimpanzees and the mathematics of battle. Proc Biol Sci. 2002;269:1107–1112. doi: 10.1098/rspb.2001.1926. [DOI] [PMC free article] [PubMed] [Google Scholar]
- Wise SP, Boussaoud D, Johnson PB, Caminiti R. Premotor and parietal cortex: corticocortical connectivity, and combinatorial computations. Annu Rev Neurosci. 1997;20:25–42. doi: 10.1146/annurev.neuro.20.1.25. [DOI] [PubMed] [Google Scholar]
- Womelsdorf T, Johnston K, Vinck M, Everling S. Theta-activity in anterior cingulate cortex predicts task rules and their adjustments following errors. Proc Natl Acad Sci U S A. 2010;107:5248–5253. doi: 10.1073/pnas.0906194107. [DOI] [PMC free article] [PubMed] [Google Scholar]