Abstract
Adenomatous polyposis coli 2 (APC2) is a family member of APC and mainly expressed in the nervous system. We previously reported that APC2 plays a critical role in axonal projection through the regulation of microtubule stability. Here, we show that a lack of Apc2 induces severe laminary defects in some regions of the mouse brain, including the cerebral cortex and cerebellum. In vivo BrdU labeling and immunohistochemical analyses with specific markers revealed that the laminary abnormalities are a result of dysregulated neuronal migration by a cell-autonomous mechanism. Using total internal reflection fluorescent microscopy, we found that APC2 is distributed along actin fibers as well as microtubules. Cerebellar granule cells in dissociated cultures and in vivo showed that BDNF-stimulated directional migration is impaired in Apc2-deficient neurons. We revealed that this impairment stems from the dysregulations of Rho family GTPase activation and TrkB localization, which disrupts the formation of BDNF-stimulated F-actin at the leading edge. Thus, APC2 is an essential mediator of the cytoskeletal regulation at leading edges in response to extracellular signals.
Introduction
During early development of the brain, neurons migrate in a highly ordered manner to establish a number of highly laminated structures, such as the cortex, hippocampus, and cerebellum (Ayala et al., 2007). In these regions, in addition to the radial glial fibers, which serve as a migratory scaffold, local environmental cues provide a series of critical signals to migrating neurons for orchestrating directed movement toward their proper target positions (Ayala et al., 2007). For instance, BDNF, a widely distributed neurotrophin, is known to be crucial to the migration of some neuronal species, including cerebellar granule cells (CGCs) (Borghesani et al., 2002; Zhao et al., 2009). It is also known that multiple signaling pathways triggered by various extracellular cues converge on the cytoskeletal network (Ayala et al., 2007). Thus, neuronal migration depends on the spatial and temporal regulation of cytoskeletal dynamics. However, our knowledge of how extracellular signals are detected by surface receptors and transduced to the migratory machinery of cells is still limited.
Adenomatous polyposis coli (APC) is a tumor suppressor protein, mutations of which are linked to familiar and sporadic colon cancer formation (Rowley, 2005). APC is a multidomain protein with binding sites for several proteins, including β-catenin, axin, EB1, Asef1, and microtubule (Hanson and Miller, 2005). APC is also implicated in the development of the cerebral cortex: the generation of cortical neurons from radial glial cells and polarized extension of radial glial fibers are severely affected in Apc-deficient mice (Ivaniutsin et al., 2009; Yokota et al., 2009). A second APC-like protein, APC2/APCL, has also been identified (Nakagawa et al., 1998). However, its function has not been fully elucidated, though it is known to be expressed predominantly in the brain. Although APC2 lacks the C-terminal microtubule-binding domain and the EB1-binding domain of APC, it has been shown to bind and stabilize microtubules (Shintani et al., 2009). Recently, we have found that the knockdown of Apc2 in the developing chick retina leads to a reduction in the sensitivity of retinal axons to ephrin-A2, and these axons exhibit abnormal projections to the optic tectum (Shintani et al., 2009). These results indicate that APC2 plays an important role in the axonal projection through the regulation of cytoskeletal dynamics in response to extracellular ephrin signals in vivo.
In this study, to comprehensively investigate the functional role of APC2 in brain development, we generated and examined Apc2-deficient mice. In the homozygous mutant mice, robust defects in neuronal lamination were observed in the cortex, hippocampus, cerebellum, and olfactory bulb. A line of experiments suggested that the laminary alteration of the brain is caused by a cell-autonomous defect with neurons characterized by random migration. Dissociated Apc2-deficient CGCs showed no obvious alterations in migration under nonstimulated conditions. However, BDNF-stimulated directional migration was perturbed. In addition, we show that BDNF-stimulated F-actin formation at the leading edge was impaired in migrating Apc2-deficient neurons, along with dysregulation of Rho family GTPase activity. Thus, the laminary defects observed in Apc2-deficient mice are likely due to the impaired response to extracellular signals in neuronal migration.
Materials and Methods
Generation of Apc2-deficient mice.
An ∼7 kb genomic fragment containing exon 2 of the Apc2 gene was amplified with genomic DNA from embryonic stem (ES) cells by PCR using a primer set, 5′-TGCCTCAGGACGAGAGGATGCTATTGGTGG-3′ and 5′-CTCTGGACCACATCATCTGCTTGCTCTACC-3′, and subcloned into a XhoI site of the pBluescript vector. The enhanced gfp gene isolated from pEGFP-N1 (Clontech) was inserted into the signal sequence region in exon 2 of Apc2, together with a phosphoglycerate kinase promoter-driven neomycin resistance gene (pgk-neo): the first two amino acids, Met-Ala, of APC2 were fused to the N terminus of EGFP via a 14 amino-acid linker sequence derived from the multiple cloning site in pEGFP-N1. After homologous genomic recombination, egfp should be expressed under the control of the Apc2 gene's regulatory unit. For negative selection, a diphtheria toxin A gene cassette was additionally placed at the 3′ end of the targeting construct. This construct was electroporated into R1 ES cells, and neomycin-resistant cells were selected with G418. Genomic DNA prepared from the resistant clones was analyzed by PCR using 5′-TCCAACCAGGGCTTAGATTAGATATGAGCCTTG-3′ and 5′-GTGATCAGATGGAGACCTCTGGTAGTCGTC-3′ as primers, and positive clones thus identified were further analyzed by Southern blotting with a probe located in intron 1 (probe: PCR fragment amplified using 5′-CTGTCAGTACGGACTCCAAGGCAGAATAGG-3′ and 5′-GTTCATGACTAGCCTGGGCTACATATGGCT-3′). The evaluation of 144 independent clones revealed two that had been correctly targeted.
We subsequently introduced targeted ES cells into C57BL/6J blastocysts to obtain germinal transmission as follows. Chimeras thus obtained were crossed with C57BL/6J mice to generate a heterozygous mutant (Apc2+/−). Genotyping of the progeny was performed by Southern blot analysis (as described above) or by PCR analysis of tail DNA using as primers 5′-CCATCAGTTAGCCTTATACACATC-3′ (common 5′-primer), 5′-TGGCGCACCAGCTGCTCATATGAG-3′ (wild-type-specific 3′-primer) and 5′-GGTGCAGATGAACTTCAGGGTCAG-3′ (knock-out-specific 3′-primer). Homozygous mutant Apc2−/− mice were obtained by intercrossing of Apc2+/− mice. No Apc2 transcript was detected in the brain of Apc2−/− mice by reverse-transcription PCR (RT-PCR) using 5′-ATGACCAGCTCCATGGCCTCATATGAGCAG-3′ and 5′-CTACTCCAGGAGACTGGCTGGAGAGGAGAC-3′. On the other hand, the egfp transcript was detected in the brain of Apc2+/− and Apc2−/− mice by RT-PCR using 5′-CAGCTGGACGGCGACGTAAAC-3′ and 5′-CACCTTGATGCCGTTCTTCTGC-3′, indicating that egfp is expressed from the targeted allele. Experiments with animals were performed according to the guidelines of the National Institute for Basic Biology, Okazaki, Japan.
In situ hybridization.
Section in situ hybridization was performed as described previously (Sakuta et al., 2001). The template used for the preparation of digoxigenine-labeled RNA probes for mouse Apc2 was a 910 bp fragment (nucleotide residues, 2784-3693; GenBank accession number NM011789).
Immunohistochemistry.
Embryos were fixed in 4% paraformaldehyde (PFA) in PBS overnight at 4°C. Postnatal and adult mice were anesthetized and perfused with 4% PFA in PBS, and whole brains were dissected out and postfixed in the same solution overnight at 4°C. Samples were rinsed in PBS, and infiltrated with a graded sucrose series to 18%. The embryos or brains were embedded in OCT compound and sectioned at 16 μm. The sections were treated with 0.1% Triton X-100 in Tris-buffered saline (TBS) for 5 min at room temperature, and incubated with a blocking buffer (3% skim milk in TBS) for 1 h at room temperature. In some cases, sections were subjected to antigen-retrieval by autoclaving in 100 mm Tris-HCl, pH 10.0, for 10 min before the Triton treatment. Reactions with primary antibodies were performed in a humidified chamber for 2 h at room temperature or overnight at 4°C. The sources and concentrations of primary antibodies were as follows: mouse anti-NeuN (1:300, Millipore), mouse anti-Ki-67 (1:1000, Abcam), rat anti-GFP (1:1000, Nacalai), rabbit anti-GFP (1:1000, Invitrogen), mouse anti-calbindin D-28K (1:500, Sigma-Aldrich), rabbit anti-CDP/CUX1 (1:500, Santa Cruz Biotechnology), rat anti-Ctip2 (1:500, Abcam), rabbit anti-FoxP2 (1:1000, Abcam), mouse anti-BrdU (1:150, Abcam), rabbit anti-TBR1 (1:500, Abcam), mouse anti-chondroitin sulfate (CS-56; 1:250, Abcam), mouse anti-TrkB (1:250, BD Biosciences), rabbit anti-phosphorylated TrkB (1:500, Abcam), mouse anti-acetylated tubulin (1:1000, Sigma-Aldrich), rabbit anti-GFAP (1:500, Dako), mouse anti-neuronal βIII-tubulin (Tuj1) (1:1000, Sigma-Aldrich), goat anti-APC2 (1:250, Santa Cruz Biotechnology), and mouse anti-Reelin (1:500, Millipore). After being washed with TBS, the specimens were incubated with Alexa-conjugated secondary antibodies (1:300, Invitrogen) for 30 min at room temperature. Nuclear staining was performed using DAPI at 0.5 μg/ml. The fluorescent signals were observed using a BX51TPF microscope (Olympus) equipped with a DP-70 CCD camera (Olympus), and images obtained were processed using Adobe Photoshop CS3.
Detection of apoptotic cell death.
The TUNEL assay was performed using a Click-iT TUNEL Alexa Fluor 488 Imaging Assay system (Invitrogen) according to the manufacturer's instructions.
BrdU incorporation analysis.
Pregnant mice or postnatal mice were injected intraperitoneally with 50 mg/kg 5-bromo-2′-deoxyuridine (Sigma-Aldrich). Whole brains were isolated at the appropriate time and brain sections were prepared as described in the immunohistochemistry section. The sections were washed in PBS, treated for 30 min at 37°C with 1N HCl, and given a 15 min wash in 0.1 m sodium borate. The incorporated BrdU was detected by immunostaining with anti-BrdU (1:150, Abcam) according to the manufacturer's instructions.
Western blot analysis.
Brains or cultured cells were lysed in a buffer consisting of 20 mm HEPES, pH 7.4, 120 mm NaCl, 0.1% SDS, 0.5% deoxycholate, 1% Nonidet P-40, 10% glycerol, 5 mm EDTA, 50 mm NaF, 0.5 mm Na3VO4, and a protease inhibitor mixture (10 μg/ml leupeptin, 1 μg/ml pepstatin A, and 1 mm phenylmethylsulfonyl fluoride). Cell lysates were clarified by centrifugation, and protein concentrations were determined with a Pierce BCA microassay kit (Thermo Fisher Scientific). Extracts were combined with SDS sample buffer and treated for 15 min at 75°C. Ten micrograms of each sample was then subjected to SDS-PAGE. Separated proteins were transferred onto Imobilon-P membranes (Millipore), stained with specific primary antibodies and peroxidase-linked secondary antibodies (GE Healthcare), and visualized by chemiluminiscence using ECL Reagent (GE Healthcare). For the detection, a LAS-5000 lumino-image analyzer (Fujifilm) was used. Signal intensity was quantified and analyzed by ANOVA.
Rota-rod test.
Each mouse was placed on a rod rotating at 36 rpm, and the longest latency to fall off and the number of falls within a 3 min period were measured. Data were analyzed with the Mann–Whitney U test.
Footprint analysis.
Mouse hind-paws were dipped in nontoxic water-based black paint. Mice were then allowed to walk down an enclosed runway lined with white paper. Three trials were performed for each mouse. At least five steps of each run were measured for hind-stride length.
External granule cell layer microexplant culture.
For the in vitro migration assay, microexplant cultures were prepared as described previously (Nagata and Nakatsuji, 1990). Briefly, the cerebellar external granule cell layer (EGL) at postnatal day 4 (P4) was cut into pieces (300–400 μm) and plated on dishes coated with laminin (100 μg/ml, Invitrogen) in Neurobasal medium containing B-27 serum-free supplement, 2 mm l-glutamine (Invitrogen) and 0.45% d-glucose. Cultures were maintained in 5% CO2 at 37°C and analyzed after incubation for 3 d. Cells were fixed with 4% paraformaldehyde and immunostained with antibodies against Tuj1 (1:1000, Sigma-Aldrich), along with DAPI-staining (0.5 μg/ml, Invitrogen).
Preparation and culture of dissociated cerebellar granule cells.
Mouse CGCs were prepared from P6 pups according to procedures described previously (Hatten, 1985). Briefly, dissected cerebella were digested with 1% trypsin (Invitrogen) and 1 mg/ml DNase I (Sigma-Aldrich) in calcium-magnesium-free HBSS for 3 min at room temperature. CGCs were dissociated by mechanical trituration and collected by Percoll (GE Healthcare) gradient (35 and 65%) centrifugation. For morphological analyses, the cells were plated at a density of 5 × 10⁴ cells/cm2 onto poly-l-lysine/laminin-coated coverslips in Neurobasal medium containing B-27 serum-free supplement, 2 mm l-glutamine (Invitrogen) and 0.45% d-glucose (Neurobasal/B27 medium). For biochemical analyses, cells were plated at 2.5 × 10⁵ cells/cm2 onto poly-l-lysine/laminin-coated coverslips in the same medium.
Boyden chamber assay.
Boyden chamber assays were performed using 24-well Boyden chamber-type Transwells (pore size, 8 μm; Costar). The undersurface of the membrane filter was coated with laminin at 20 μg/ml in PBS for 2 h at 37°C. CGCs (1 × 10⁶ cells) were added in Neurobasal/B27 medium to the upper chamber and allowed to migrate through the filter to the coated undersurface at 37°C for 16 h. Cells remaining on the upper membrane surface were wiped off, and the filters were fixed with 4% paraformaldehyde and stained with 0.5 μg/ml DAPI. Cells adhering to the underside of the membranes were counted in 10 random microscopic fields (100×), and the mean number was determined from duplicate experiments.
DNA constructs and transfection.
To prepare mCherry-APC2 expression constructs, the full-length mouse Apc2 cDNA was subcloned into the pmCherry-N1 vector (Clontech) using an EcoRI/SalI site. Lifeact-EGFP was constructed by tagging the Lifeact sequence (MGVADLIKKFESISKEE) to the N-terminal of EGFP (Clontech). HEK293 cells were grown in DMEM/F-12 medium supplemented with 10% fetal bovine serum. Transfection was performed using LipofectAMINE PLUS (Invitrogen) according to the manufacturer's protocol. At 24 h after transfection, fluorescent images were obtained with an Olympus IX81 microscope equipped with an Olympus total internal reflection fluorescence (TIRF) module.
Stimulation with a BDNF gradient.
To prepare a BDNF gradient, 10 μl of Matrigel plug containing 2 μg of BDNF was placed at the center of a 35 mm culture dish. For control experiments, a Matrigel plug without BDNF was used. CGCs were plated onto poly-l-lysine/laminin-coated coverslips as described above. Ten hours after the plating, the coverslips were placed around a Matrigel plug in Neurobasal/B27 medium for stimulation by a BDNF gradient. After 1 h of incubation, cells were fixed in 4% PFA or lysed in a lysis buffer. One field close to the Matrigel plug was selected for observation and images of CGCs extending their leading edges toward the plug were obtained.
Immunocytochemistry and quantification of fluorescent intensity.
Neurons were fixed in 4% PFA, rinsed three times in TBS, permeabilized in 0.1% Triton X-100, and treated with a blocking buffer (5% BSA in TBS) for 1 h. Cells were exposed to primary antibodies for 2 h at room temperature, and incubated with Alexa-conjugated secondary antibodies for 30 min at room temperature. Fluorescent images were collected with a Zeiss Axiovert 200M confocal microscope or, where noted, an Olympus IX81 microscope equipped with an Olympus TIRF module. To quantify the fluorescent intensity, all experimental and image acquisition parameters were kept constant throughout each experiment. Background-subtracted images were analyzed by creating a region of interest that circumscribed the leading edge using ImageJ software (National Institutes of Health). The leading edge area was defined as a hand-like region extending at the tip of the process. The ratio of fluorescence intensity was calculated for at least 30 leading edges per condition and compared using Student's t test.
Rac1 and Cdc42 activation assay.
The determination of active Rac1 and Cdc42 was performed using a Rac/Cdc42 Activation Assay Kit (Millipore) according to the manufacturer's instructions.
Statistical analysis.
The results are presented as the mean ± SEM or SD. Statistical differences were determined by Student's t test for two-group comparisons, ANOVAs for multiple comparisons among more than two groups, and the Mann–Whitney test for nonparametric data. Significance was set as p < 0.05.
Results
Generation of Apc2-deficient mice
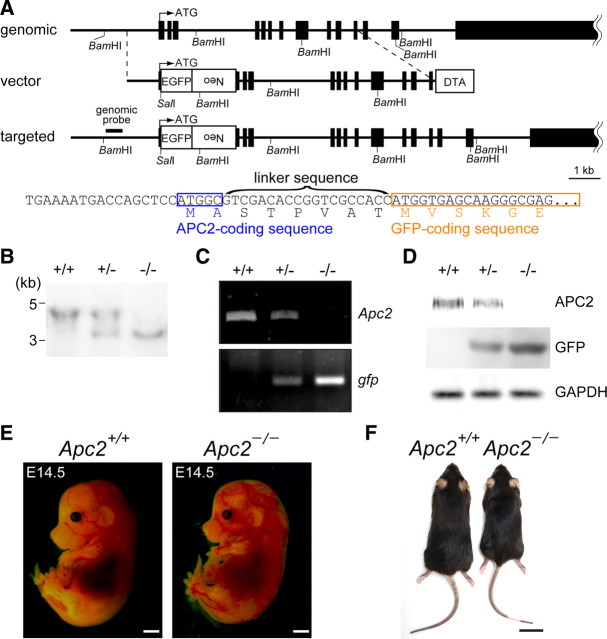
Apc2-deficient mice were generated by conventional gene-targeting methods: in the mice, an enhanced gfp gene (egfp) was inserted in frame into the Apc2 gene (Fig. 1A). Genomic Southern hybridization was used to confirm faithful gene replacement (Fig. 1B). RT-PCR analysis showed that egfp transcripts are expressed in place of Apc2 transcripts from the targeted allele (Fig. 1C). By Western blot analysis using an anti-APC2 antibody, a prominent band of APC2 (∼230 kDa) was detected in extracts of wild-type (Apc2+/+) and heterozygous mutant (Apc2+/−) brains, but not in extracts from homozygous mutant (Apc2−/−) brains (Fig. 1D).
Figure 1.
gfp knock-in mice for the Apc2 gene. A, Schematic representation of the structure of the endogenous allele (genomic), targeting vector (vector), and targeted allele (targeted). The genomic sequence of the head region of exon 2 in the targeted allele is shown below together with the encoded amino acid sequence. The protein coding exons of Apc2 are indicated by black boxes. For construction of the targeting vector, an egfp-Neo cassette was inserted in frame in the signal sequence of APC2 after the first two amino acids, Met-Ala, to yield fusion to the N terminus of GFP through a linker sequence. The diphtheria toxin A (DTA) gene cassette was placed at the 3′ terminus of the homologous region in the targeting vector for negative selection. The region used as a probe for Southern blotting is indicated by a bold bar. B, Southern blot analysis of SalI and BamHI double-digested genomic DNA from wild-type (+/+), heterozygous (+/−), and homozygous (−/−) mice. C, RT-PCR analysis of total RNA from the brain of wild-type (+/+), heterozygous (+/−), and homozygous (−/−) mice. D, Western blot analysis of brain extracts from wild-type (+/+), heterozygous (+/−), and homozygous (−/−) mice using an anti-APC2, GFP, or GAPDH antibody. E, Wild-type and homozygous Apc2-deficient E14.5 embryos. F, Wild-type and homozygous Apc2-deficient P180 mice. Scale bars: E, 1 mm; F, 2 mm.
Heterozygous mutant mice showed no morphological abnormalities in the brain in any analyses (data not shown). Intercrosses of heterozygotes yielded Apc2-deficient mice (Apc2−/−) at the expected Mendelian frequency (24.4% of 123 embryos collected at ∼P30). During the embryonic stages and at birth, Apc2-deficient pups were normal in size and appearance (Fig. 1E and data not shown), but postnatally they gradually displayed growth retardation: their body weight at P180 was ∼80% of that of wild-type sex-matched littermates (Fig. 1F). Homozygously Apc2-deficient mice, both male and female, were fertile when intercrossed with wild-type or heterozygous mice. However, in crosses of homozygous mutant mice, vaginal plugs, which indicate successful matings, were not detected. Seizures were sometimes observed in homozygous Apc2-deficient mice, but never in other genotypes (our unpublished observations).
Apc2 expression in postmitotic neurons
In heterozygous mutant mice, GFP fluorescence was specifically observed in the developing nervous system, except for liver, including the telencephalon, mesencephalon, spinal cord, retina, olfactory epithelium, dorsal root ganglion, and enteric neurons (Fig. 2A–F). Despite the growth retardation, the size of the forebrain, cerebellum, and other major structures was indistinguishable from that in wild-type mice (data not shown).
Figure 2.
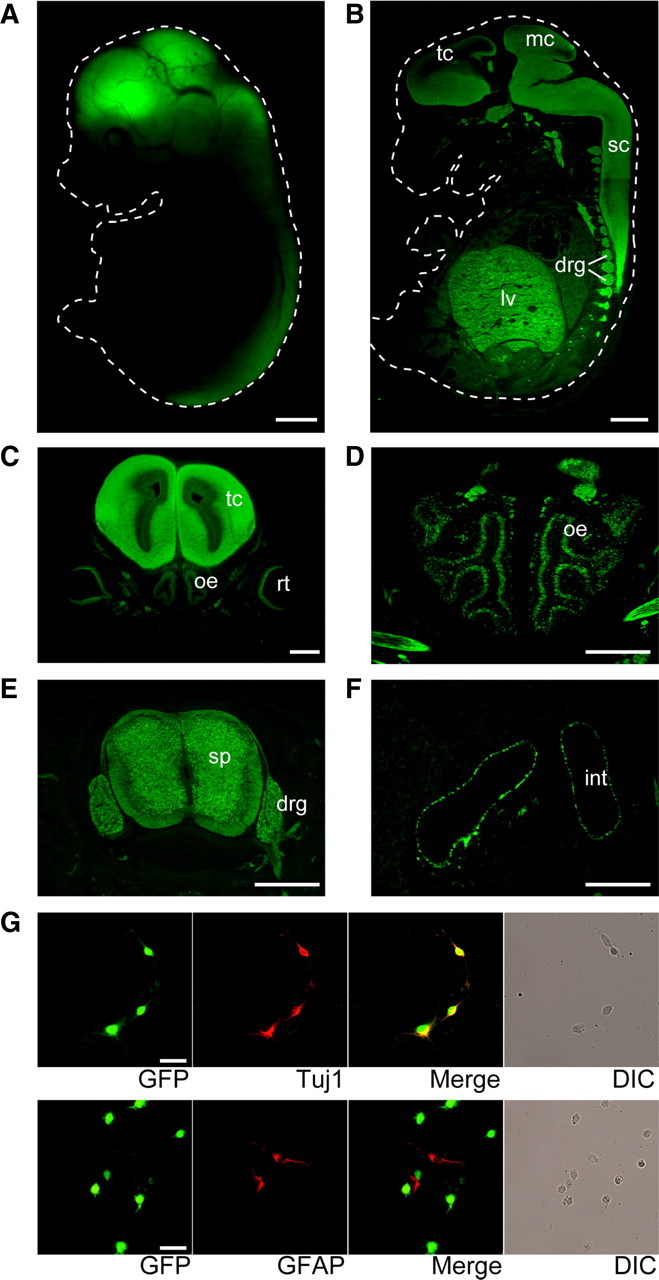
GFP expression in heterozygous Apc2-deficient mice. A, Live fluorescent image of GFP in an E14.5 heterozygous Apc2-deficient embryo. White dotted line outlines the embryo. B, A sagittal section immunostaining of an E14.5 heterozygous Apc2-deficient embryo with an anti-GFP antibody. GFP expression was observed in the telencephalon (tc), mesencephalon (mc), spinal cord (sc), dorsal root ganglion (drg), and liver (lv). C, Immunostaining of a coronal section through the middle head of an E14 heterozygous Apc2-deficient embryo. The telencephalon (tc), retina (rt), and olfactory epithelium (oe) were positive. D, Immunostaining of a coronal section through the anterior head of an E14.5 heterozygous Apc2-deficient embryo. The olfactory epithelium (oe) was positive. E, Immunostaining of a coronal section through the middle trunk of an E14.5 heterozygous Apc2-deficient embryo. The spinal cord (sc) and dorsal root ganglion (drg) were positive. F, Immunostaining of a coronal section through the posterior trunk of an E14.5 heterozygous Apc2-deficient embryo. Neurons in the intestine (int) were positive. G, Expression of GFP in neurons but not in glial cells. Immunostaining of dissociated cultures from P0 heterozygous Apc2-deficient mice with anti-GFP (green) and anti-Tuj1 (top, red) antibodies or anti-GFAP (bottom, red) antibodies. All GFP-positive cells coexpress neuron-specific marker, Tuj1, but not glia-specific marker, GFAP. Scale bars: A, B, 1 mm; C–F, 500 μm; G, 25 μm.
Immunostaining of primary cultures from the P0 cerebral cortex with anti-GFP, anti-Tuj1 (a neuron-specific marker), and anti-GFAP (a glia-specific marker) antibodies revealed that Apc2 is expressed by neuronal cells, but not glial cells (Fig. 2G), in contrast to Apc. In situ hybridization suggested that Apc2 is expressed in postmitotic neurons (Fig. 3A): a high level of Apc2 expression was observed in the cortical plate in the cortex at E16.5, and in the inner zone of the EGL of the P5 cerebellum. Moreover, rare colocalization of Ki67, a proliferation marker, with GFP signals in the developing cerebral cortex at embryonic day 13.5 (E13.5) (Fig. 3B) and cerebellum at P5 (Fig. 3C) showed that GFP-positive cells are not proliferating cells: in contrast, almost all GFP-positive cells expressed both Tuj1 and NeuN, postmitotic neuronal markers (Fig. 3D,E). Immunostaining using other postmitotic neuronal markers, doublecortin and doublecortin-like kinase, further indicated that Apc2 is expressed in postmitotic neurons (Fig. 3F,G). Coimmunostaining with anti-Reelin antibody, which specifically labels Cajal–Retzius (CR) cells, showed GFP signals in neurons just beneath the Reelin-positive CR cells (Fig. 3H), indicating that Apc2 is not expressed in CR cells.
Figure 3.
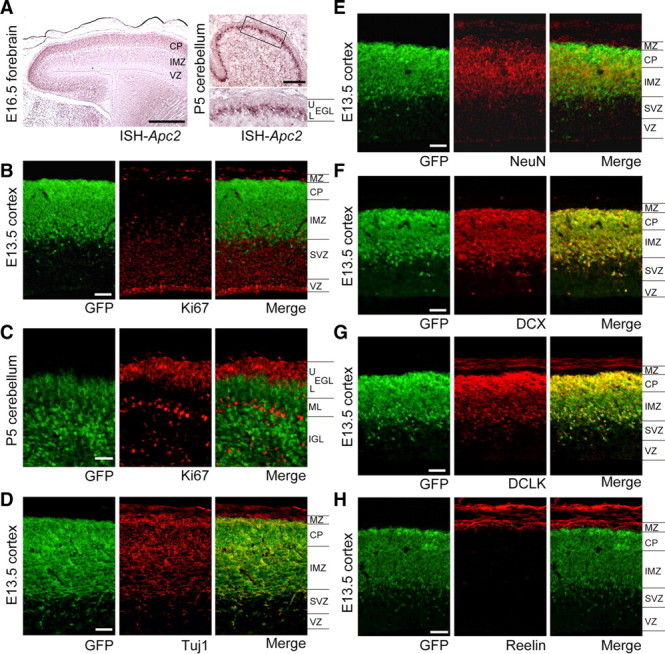
Preferential expression of Apc2 in postmitotic neurons. A, Sagittal section in situ hybridization with antisense probe for Apc2 of E16.5 forebrain or P5 cerebellum of wild-type mice. Apc2 expression was observed in the region where postmitotic neurons are distributed. B, A sagittal section immunostaining of the cortex of E13.5 heterozygous Apc2-deficient mouse with anti-GFP (green) and anti-Ki67 (red), a proliferation marker. MZ, marginal zone; CP, cortical plate; IMZ, intermediate zone; SVZ, subventricular zone; VZ, ventricular zone. C, A sagittal section of cerebellum of P5 heterozygous Apc2-deficient mouse was stained with anti-GFP (green) and anti-Ki67 (red). D, A sagittal section immunostaining of the cortex of E13.5 heterozygous Apc2-deficient mouse with anti-GFP (green) and anti-Tuj1 (red), a postmitotic neuronal marker. E, A sagittal section immunostaining of the cortex of E13.5 heterozygous Apc2-deficient mouse with anti-GFP (green) and anti-NeuN (red), a postmitotic neuronal marker. F, A sagittal section immunostaining of the cortex of E13.5 heterozygous Apc2-deficient mouse with anti-GFP (green) and anti-doublecortin (DCX, red). G, A sagittal section immunostaining of the cortex of E13.5 heterozygous Apc2-deficient mouse with anti-GFP (green) and anti-doublecortin-like kinase (DCLK, red). H, A sagittal section immunostaining of the cortex of E13.5 heterozygous Apc2-deficient mouse was stained with anti-GFP (green) and anti-Reelin, a marginal zone marker (red). Scale bars: A, 500 μm; B–H, 50 μm.
Severe laminary defects in the Apc2-deficient mouse brain
We analyzed the brains of Apc2-deficient mice anatomically and histochemically. Although the size of major regions of the brain was almost normal as described above, anti-NeuN staining revealed a disorganized lamination in the cortex, hippocampus, cerebellum, and olfactory bulb (Fig. 4). The cerebral cortex of mammals is organized into six layers at P30 (Fig. 4A, left). In the mutant cortex, cortical layers were poorly organized and layer boundaries were blurred and indistinct (Fig. 4A, middle). A quantitative analysis of cell numbers in the corresponding areas (Fig. 4A, 1–10) of both genotypes revealed that numbers of NeuN-positive cells were significantly reduced in the cortex of mutant mice, especially in areas 1 and 2 (Fig. 4A, right; p < 0.01). An increase in TUNEL-positive cells was observed in the mutant cortex, indicating that this reduction is likely caused by increased apoptosis (Fig. 5).
Figure 4.
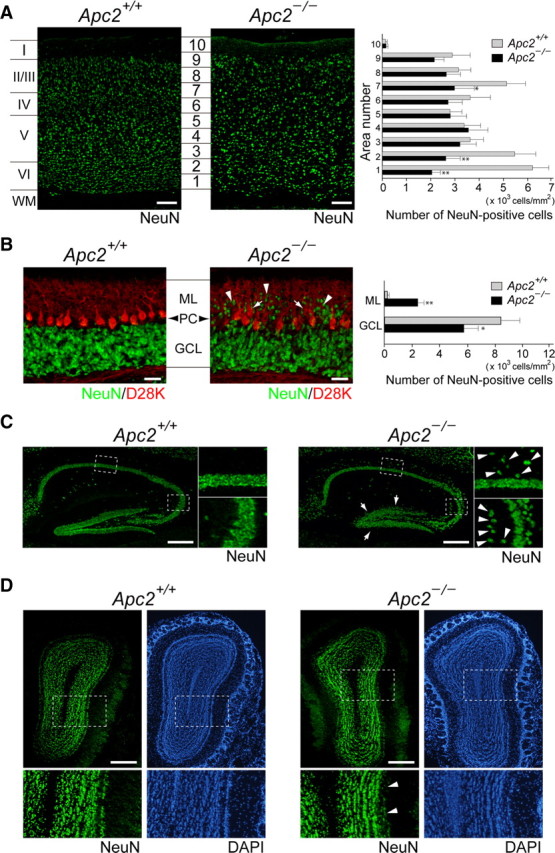
Morphological abnormalities in the brain of Apc2-deficient mice. A, Sagittal sections of P30 cerebral cortex stained with anti-NeuN (green, neuron-specific nuclear protein). Quantification was performed by measuring the distribution of NeuN-positive cells in each bin where the cortex was divided into 10 equal areas. The cell density of NeuN-positive cells in each area was plotted as histograms for wild-type (gray bars) or Apc2-deficient (dark bars) mice. Values are shown as the mean ± SEM. The asterisk indicates a significant difference between the two values in the same area by Student's t test (*p < 0.05, **p < 0.01). B, Sagittal sections of P20 cerebellum stained with anti-NeuN (green) and anti-calbindin D-28K (red). Arrows and arrowheads indicate ectopically distributed Purkinje and granule cells, respectively. Quantification was performed by measuring the distribution of NeuN-positive cells in the molecular layer (ML) and granule cell layer (GCL). The density of NeuN-positive cells in each area was plotted as histograms of wild-type (gray bars) or Apc2-deficient (dark bars) mice. *p < 0.05, **p < 0.01. PC, Purkinje cell layer. C, Sagittal sections of P30 hippocampus stained with anti-NeuN (green). Right, Enlarged images of regions surrounded by dashed lines in left panels. Arrows indicate ectopically distributed pyramidal cells, and arrowheads indicate broadening of dentate gyrus granule cells. D, Coronal sections of P30 olfactory bulb stained with anti-NeuN (green) and DAPI (blue). Bottom, Enlarged images of regions surrounded by dashed lines in upper panels. Arrowheads indicate diffusely distributed mitral cells. Scale bars: A, B, D, 50 μm; C, 100 μm.
Figure 5.
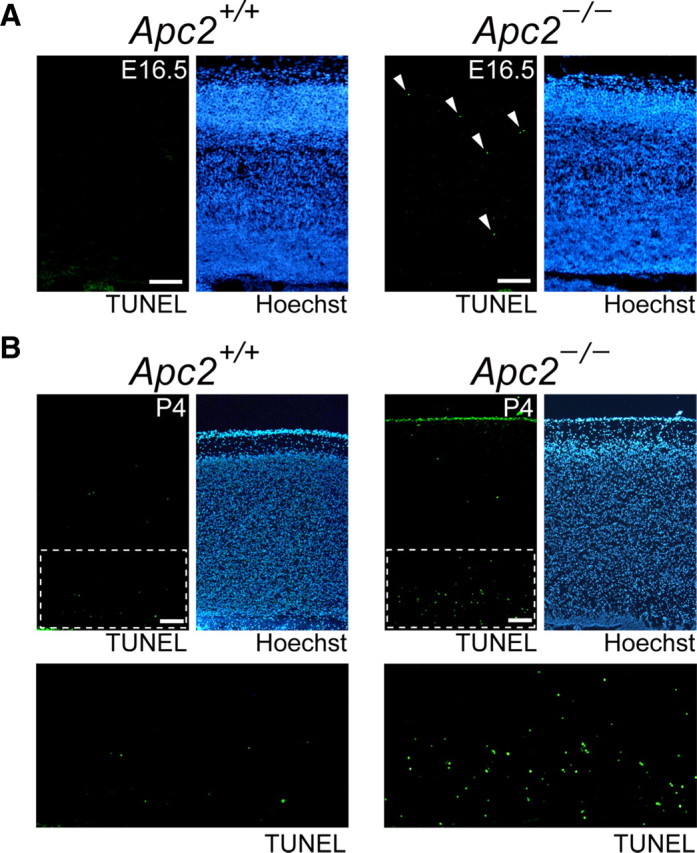
Enhanced apoptosis in the Apc2-deficient cortex. A, Apoptotic cells were detected in sagittal sections of E16.5 cerebral cortex by TUNEL staining. Sections were counterstained with Hoechst 33342. TUNEL-positive cells are indicated by arrowheads. B, Apoptotic cells in sagittal sections of P4 cerebral cortex. Bottom, Enlarged images of the region surrounded by dashed lines in upper left panels, in which TUNEL-positive cells are clearly visible by fluorescence. Scale bars, 50 μm.
Apc2-deficient mice did not show apparent foliation defects in the cerebellum (data not shown). However, anti-NeuN staining showed an abnormal distribution of CGCs in the molecular layer (ML) of the cerebellum at P20 (Fig. 4B, middle): while total numbers of NeuN-positive CGCs did not differ significantly between wild-type and mutant mice, ∼30% of the cells remained in the ML in the mutant mice (Fig. 4B, right; p < 0.01 in ML; p < 0.05 in granule cell layer). Furthermore, coimmunostaining with a Purkinje cell marker, calbindin D-28K, revealed that the layering of Purkinje cells was also affected (Fig. 4B).
In the hippocampus at P30, marked invasion of the stratum oriens by pyramidal cells was observed in the CA1 region in the mutant mice (Fig. 4C, right, top, arrowheads). The mutant mice also exhibited diffusely split pyramidal cells in the CA3 region: a population of neurons was heterotopically located in the stratum oriens (Fig. 4C, right, bottom, arrowheads). Moreover, dentate granule cells were less densely packed in the mutant (Fig. 4C, right, arrows).
In the olfactory bulb at P30 of the Apc2-deficient mice, mitral cells were scattered and a single layer of these cells, normally typical, was not observed (Fig. 4D, right, arrowheads). However, no apparent abnormality was observed in the olfactory glomerulus and internal granule layer.
Distribution analyses of cortical neurons
To further examine the defect in cortical layering, we performed immunohistochemical analyses at P30 with cortical layer-specific markers, CDP/CUX1 (layers II–IV-specific) (Nieto et al., 2004), Ctip2 (layers V- and VI-specific) (Arlotta et al., 2005), and FoxP2 (layer VI-specific) (Ferland et al., 2003) in combination with NeuN (Fig. 6A). Quantitative analyses, in which cell numbers in the respective areas (1–10) in the cortex were determined, clearly showed that neuronal positioning was severely defective in Apc2-deficient mice (Fig. 6A–C, right). In the wild-type cortex, CDP/CUX1-positive neurons were restricted to areas 6–9 with a prominent peak at area 7 (Fig. 6A). However, in the mutant cortex, they were observed broadly in areas 1–9 with a peak at area 8. Interestingly, in the mutant cortex, almost all NeuN-positive neurons in areas 1 and 2 were CDP/CUX1-positive (Fig. 6A). While Ctip2-positive cells in the wild-type cortex were observed in areas 1–6 with a peak at area 3, their distribution in the mutant cortex was shifted toward the pial surface side with a peak at area 5 (Fig. 6B). FoxP2-positive neurons were mainly distributed in areas 1–4 with a peak at area 3 in the wild-type cortex. However, they were broadly distributed in areas 3–9 with a peak at area 4 but rarely in areas 1 and 2 in the mutant cortex (Fig. 6C). Taken altogether, these results indicate that neuronal populations were highly intermingled with each other in the Apc2-deficient cerebral cortex.
Figure 6.
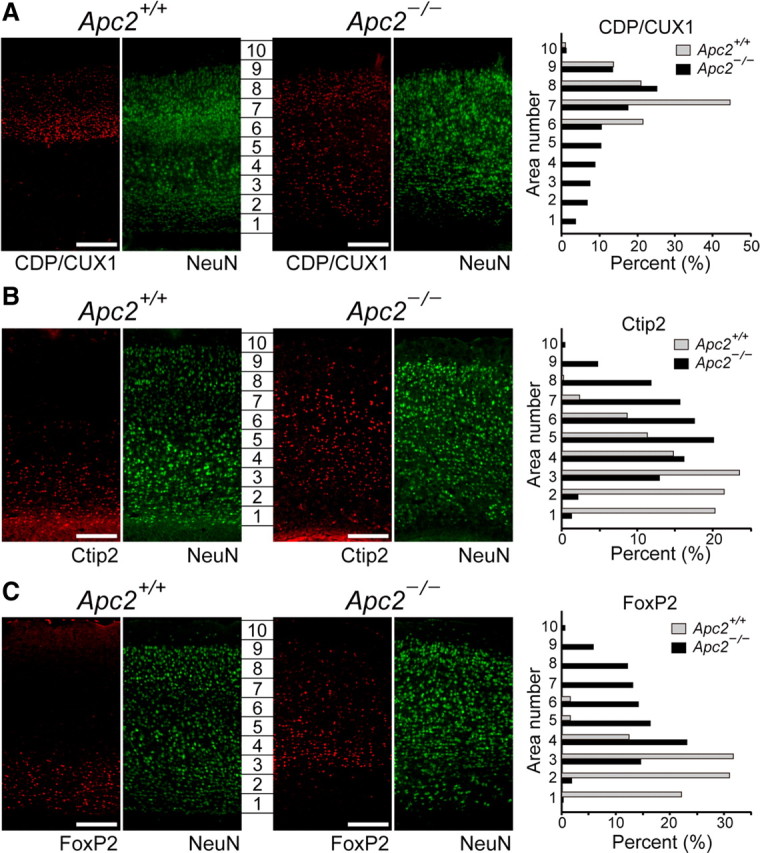
Abnormal distributions of cortical layer markers in the Apc2-deficient cortex. Sagittal sections of the cortex at P30 immunostained for layer markers. A, Anti-CDP/CUX1 antibody (red, a layer II–IV-specific marker). B, Anti-Ctip2 antibody (red, a layer V-specific and VI-specific marker). C, Anti-FoxP2 antibody (red, layer VI-specific marker). Also, all sections were coimmunostained with an anti-NeuN antibody (green). Genotypes are indicated at the top of the panels. The cortices were divided into 10 equal areas (1–10 in each panel), and the percentage of marker-positive cells in each area was determined. Results were plotted as histograms for wild-type (gray bars) or Apc2-deficient (dark bars) mice. Anti-FoxP2 signals in layers 9 and 10 in the wild-type cortex in C are nonspecific, which are not positive for NeuN. Scale bars, 50 μm.
Neuronal migration is impaired in the Apc2-deficent cortex
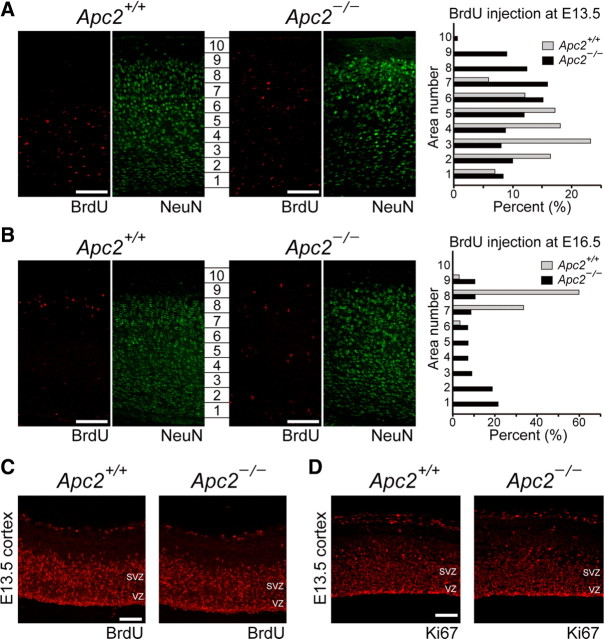
To examine whether the migration of cortical neurons was perturbed in Apc2-deficient mice, we injected BrdU into the abdominal cavity of pregnant mice at E13.5 or E16.5, and analyzed the distribution of BrdU-positive cells in the cortex at P30. In the developing cerebral cortex, most projecting neurons originate from the proliferative ventricular zone and migrate radially toward the brain's surface. Since late-born neurons migrate past their predecessors, the cortical plate is formed in an “inside-out” manner (Rakic, 2007). When BrdU was injected at E13.5, BrdU-positive cells were found mainly within lower areas of the cortex at P30 (Fig. 7A). In contrast, in Apc2-deficient mice, BrdU-positive cells were distributed in all layers of the cortex. In the wild-type cortex, an injection of BrdU at E16.5 identified neurons only in superficial layers (Fig. 7B). By contrast, in Apc2-deficient mice, neurons were found distributed throughout the cortex. These results demonstrate that the migration of cortical neurons is continuously altered in Apc2-deficient mice. Experiments of short-term BrdU labeling and anti-Ki67 immunostaining showed that the total number of positive cells and staining intensity in the cortex were similar in the two genotypes (Fig. 7C,D), suggesting that proliferation is not affected by the lack of Apc2.
Figure 7.
Impaired neuronal migration in the Apc2-deficient cortex. A, B, In vivo BrdU labeling. Wild-type and Apc2-deficient mouse brains were labeled with BrdU by injection intraperitoneally at E13.5 (A) or E16.5 (B), and fixed at P30. Sagittal sections were stained with anti-BrdU (red) and anti-NeuN (green) antibodies. Quantification was performed by measuring the distribution of BrdU-labeled cells in each bin of 10 areas. The percentage of BrdU-labeled cells in each area was plotted as histograms for wild-type (gray bars) or Apc2-deficient (dark bars) mice. C, D, Normal neuronal proliferation in the Apc2-deficient cortex. C, Immunostaining of sagittal sections of E13.5 cortex with an anti-BrdU antibody. Embryos were labeled with BrdU for 3 h before fixation. D, Immunostaining of sagittal sections of E13.5 cortex with an anti-Ki67 antibody. Scale bars, 50 μm.
We next examined the development of laminary defects of the Apc2-deficient cortex in particular by using an antibody to TBR1, which is strongly expressed in early-born cortical neurons in the subplate and layer VI (Hevner et al., 2001), together with an anti-NeuN antibody (Fig. 8A). It is known that early-born cortical neurons migrate by somal translocation, while late-born neurons migrate along radial glial fibers (Ayala et al., 2007). At E14.5, there was no obvious difference in the distribution of TBR1-positive cells between the two genotypes, suggesting that somal translocation is normal in the mutant mice. However, at E16.5, we observed an apparent difference between the two genotypes: while TBR1-positive neurons formed a layer around the bottom of the cortical plate and the subplate in the wild-type cortex, they were distributed broadly in the upper and middle region of the cortical plate in the Apc2-deficient cortex (Fig. 8A). At later developmental stages, TBR1-positive cells in wild-type mice remained in the lower region of the cortical plate and formed layer VI. In contrast, their distribution in mutant mice gradually became broader during the neonatal period (Fig. 8A). This broader distribution at later stages is supposedly explained by random positioning of late-born neurons: some populations could not migrate past early-born neurons, and so they stopped migration abnormally underneath or within the layer of TBR1-positive cells.
Figure 8.
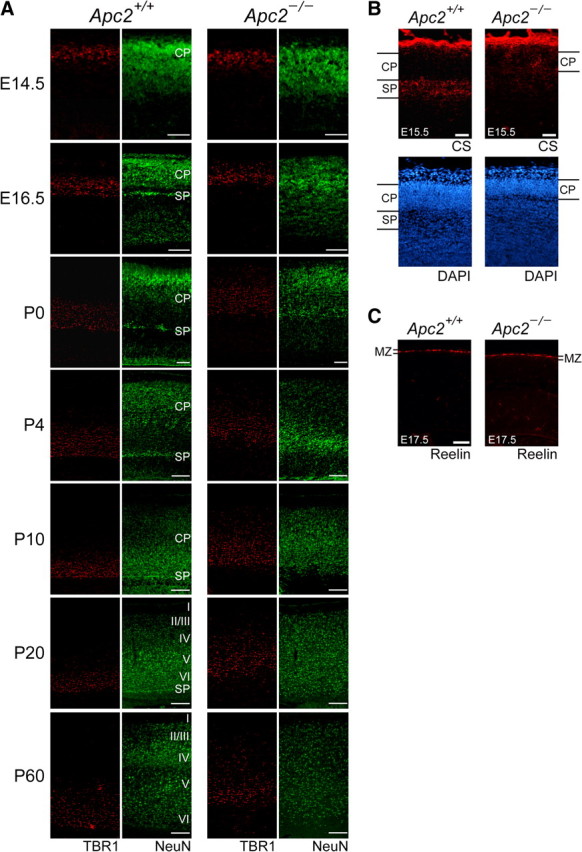
Disorganization of the subplate in the Apc2-deficient cortex revealed by the altered distribution of TBR1-positive neurons. A, Sagittal brain sections at the indicated stage immunostained with anti-NeuN (green) and anti-TBR1 (red, a marker for early-born neurons). NeuN-staining revealed that the subplate (SP) was poorly formed in Apc2-deficient brains compared with wild-type brains. There is no difference in the distribution of TBR1-positive neurons at E14.5, but the distribution increased afterward in Apc2-deficient mice. B, Disorganization of the subplate. Sagittal sections of the cortex at E15.5 stained with an anti-chondroitin sulfate (CS) antibody (red) and DAPI (blue). In the wild-type cortex, a CS-positive subplate was clearly observed beneath the cortical plate (CP). In contrast, the Apc2-deficient cortex displayed diffuse and disorganized CS staining, accompanied by hypoplasia of the cortical plate. C, Immunostaining of sagittal sections of E17.5 cortex with an anti-Reelin antibody. There is no visible difference in the Reelin expression (red) in the marginal zone between wild-type and Apc2-deficient mice. Scale bars: A, E14–P0, 100 μm; P4–P20, 250 μm; B, C, 50 μm.
In the Apc2-deficient cortex, the subplate layer was not visible by NeuN-staining (Fig. 8A, SP). Immunostaining for chondroitin sulfate proteoglycans, a marker of CR and subplate cells (Bicknese et al., 1994), indicated that the subplate is disorganized in the mutant cortex at E15.5 (Fig. 8B). Random positioning of late-born neurons in the cortex may also cause this agenesis of the subplate. Together, these results suggest that the absence of Apc2, while having no effect on somal translocation of early-born neurons, severely impairs radial migration of late-born neurons in the cortex. We further investigated whether Apc2 ablation affected CR cells. A normal CR cell layer was detected by immunostaining with an anti-Reelin antibody at E17.5 (Fig. 8C).
Neuronal migration is impaired in the Apc2-deficient cerebellum
We subsequently examined whether the abnormal lamination in the Apc2-deficient cerebellum is attributable to the altered migration of CGCs. To this end, we labeled a cohort of CGCs formed on P10 with a pulse of BrdU, and examined their migration over the next 10 d (Fig. 9). At 24 h postlabeling, BrdU-labeled CGCs remained in the EGL of both wild-type and mutant mice (Fig. 9A). Similar numbers of BrdU-labeled cells in the EGL in both mice suggest that the division of CGCs was not affected in Apc2-deficient mice, consistent with the anti-Ki67 immunostaining data (data not shown). At 72 h postlabeling, only 22% of the BrdU-positive cells in wild-type mice had migrated into the internal granule layer (IGL) (Fig. 9B). In Apc2-deficient mice, 34% of the labeled cells had successfully migrated into the IGL, with many labeled neurons deep in the IGL (Fig. 9B), as if migration of CGCs had been stimulated. However, intriguingly, a larger number of BrdU-positive cells still remained in the EGL, compared with the same cells in the wild-type mice. Thus, the migration appeared to be enhanced and attenuated. Of note, at 120 h postlabeling, 91% of the BrdU-positive cells had migrated into the IGL in wild-type mice, whereas 54% remained in the ML in mutant mice (Fig. 9C). Even at 240 h postlabeling, 41% of the BrdU-positive cells still remained in the ML in mutant mice (Fig. 9D). These results indicate that the radial migration of CGCs is impaired in the Apc2-deficient cerebellum. Here, it should be noted that immunostaining of Nestin, a marker of radial glia, in E14.5 cortical sections and of GFAP in P10 cerebellum sections demonstrated normal radial glial fibers in both regions in the mutant mouse (Fig. 10). These results suggest that the migratory defects observed in Apc2-deficient mice are not due to a deficiency in the glial scaffold.
Figure 9.
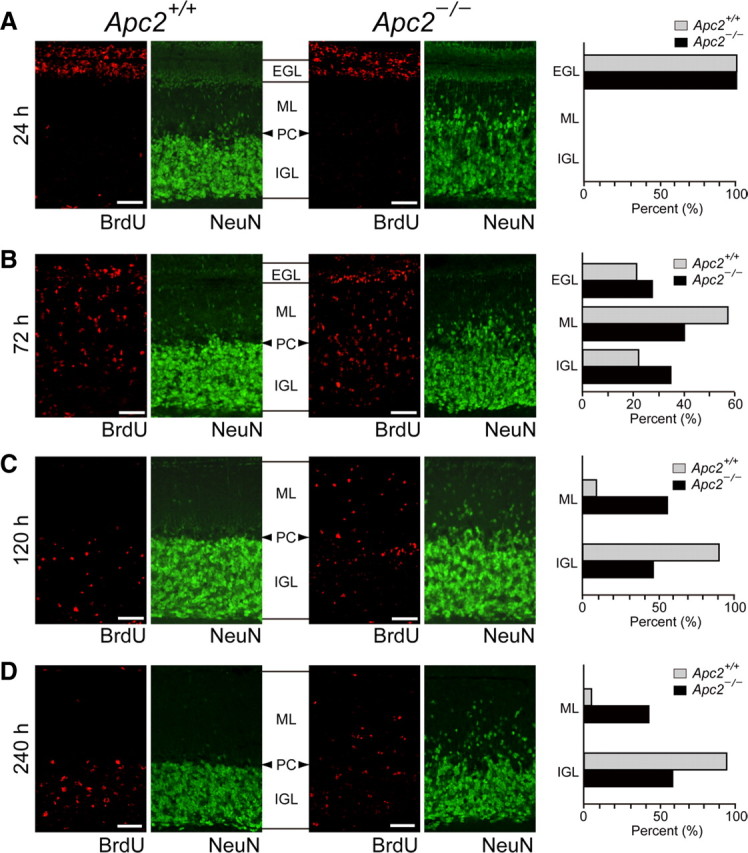
Migration defects of Apc2-deficient cerebellar granule cells. Wild-type and Apc2-deficient mice were labeled with BrdU at P10, and fixed after 24 (A), 72 (B), 120 (C), or 240 (D) h. Sagittal sections were immunostained with anti-BrdU (red) and anti-NeuN (green) antibodies. Quantification was performed by measuring the distribution of BrdU-labeled cells in the EGL, ML, and IGL in the cerebellum. The percentage of BrdU-labeled cells in each layer was plotted as histograms of wild-type (gray bars) or Apc2-deficient (dark bars) mice. PC, Purkinje cell layer. Scale bars, 50 μm.
Figure 10.
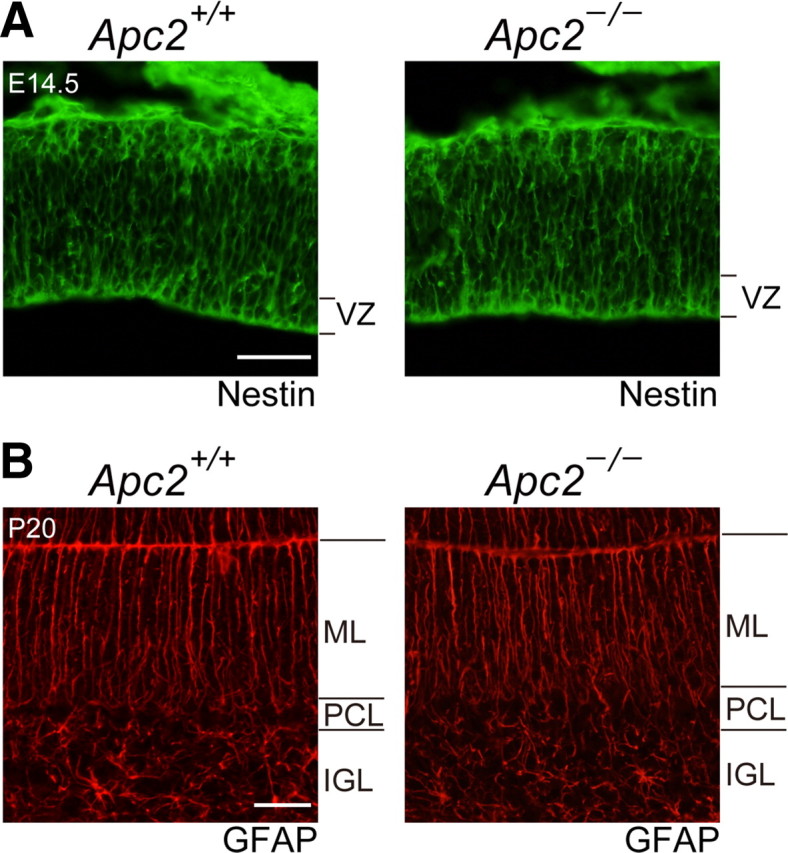
Normal scaffold of radial glial fibers in Apc2-deficient brains. A, Immunostaining of sagittal sections of E14.5 cortex with an anti-Nestin antibody. There is no visible difference in the Nestin-immunoreactive radial glial fibers (green) between wild-type and Apc2-deficient mice. B, Immunostaining of sagittal sections of P20 cerebella with an anti-GFAP antibody. There is no visible difference in the GFAP-immunoreactive Bergmann glial fibers between the two. Scale bars: A, 100 μm; B, 250 μm.
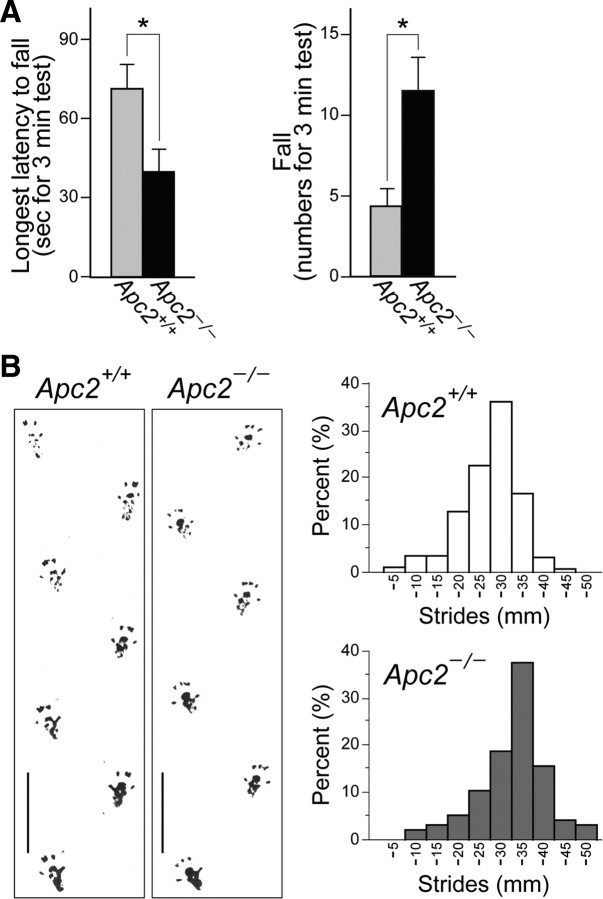
In mice, a cerebellar layering impairment is accompanied by abnormal motor behavior. Rotarod tests revealed a decrease in the latency to fall and an increase in the number of falls in the mutant mice, compared with wild-type mice (Fig. 11A, p < 0.05). In addition, a gait analysis revealed a longer hind-limb stride in the mutant mice (3.07 ± 0.72 mm) than in wild-type mice (2.58 ± 0.63 mm) (Fig. 11B; p < 0.001).
Figure 11.
Impaired rotarod performance and increased foot-stride length in the Apc2-deficient mouse. A, Behavior of wild-type (n = 7) and Apc2-deficient (n = 7) mice at ∼P70 in the rotarod test. The longest latency to fall off and the number of falls within a 3 min period at 36 rpm were measured (left and right, respectively). Values are shown as the mean ± SEM Mann–Whitney U tests showed significant differences between wild-type and mutant mice. *p < 0.05. B, Footprints and hind-limb stride lengths of wild-type (n = 7) and Apc2-deficient (n = 5) mice at ∼P70. Left, Representative footprints. Right, Distribution of hind-limb stride length. The mutant mice showed increased stride length (2.58 ± 0.63 mm in wild-type mice vs 3.07 ± 0.72 in mutant mice; the mean ± SD). Student's t test showed significant differences between wild-type and mutant mice (*p < 0.001). Scale bars, 30 mm.
BDNF-stimulated migration is impaired in CGCs deficient in Apc2
CGCs are an excellent model for investigating the molecular and cellular mechanisms underlying neuronal migration. We examined the migration of CGCs in the Apc2-deficient mouse using EGL microexplant cultures. After 72 h of culture, the wild-type explants exhibited numerous neurite outgrowths and migrating CGCs spread along these neurite extensions (Fig. 12A). Unexpectedly, wild-type and Apc2-deficient mice exhibited no significant difference in the number of migrating granule cells (Fig. 12A), migration distance (Fig. 12B), and average neurite length (Fig. 12C). We further performed a Boyden chamber migration assay. In this assay, purified CGCs were plated on the upper side of a porous membrane and migration through the membrane into the bottom compartment was quantified. Again, there was no significant difference in numbers between wild-type and mutant CGCs (Fig. 13A,B). Apc2-deficient CGCs thus showed normal migration in these culture conditions.
Figure 12.
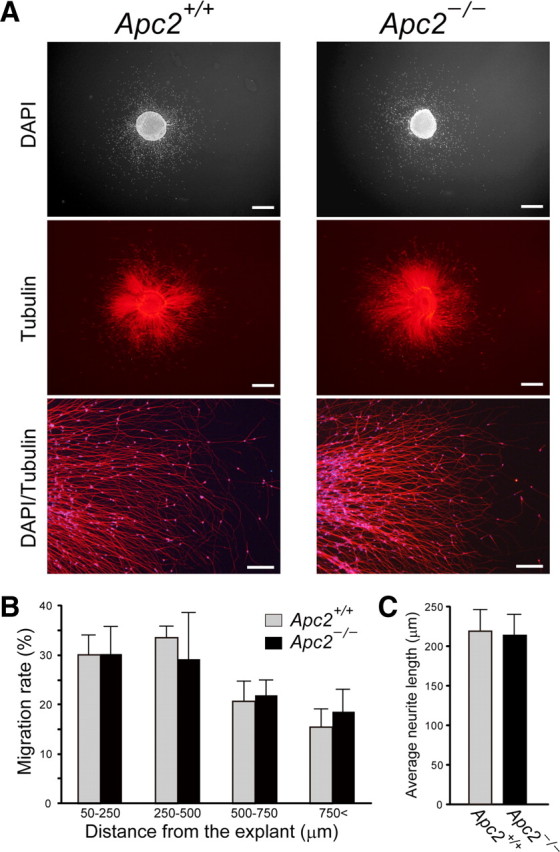
Normal in vitro migration of Apc2-deficient cerebellar granule cells. A, Neuronal migration and neurite outgrowth from P4 EGL. EGL microexplants were cultured in vitro for 72 h. Migrated granule cells were detected with DAPI, and neurite outgrowth was analyzed by anti-Tuj1 staining. Scale bars: top, middle, 500 μm; bottom, 100 μm. B, Summary of the distribution of migrating granule cells. Values are shown as the mean ± SEM C, Summary of neurite outgrowth from EGL microexplants. Values are shown as the mean ± SEM.
Figure 13.
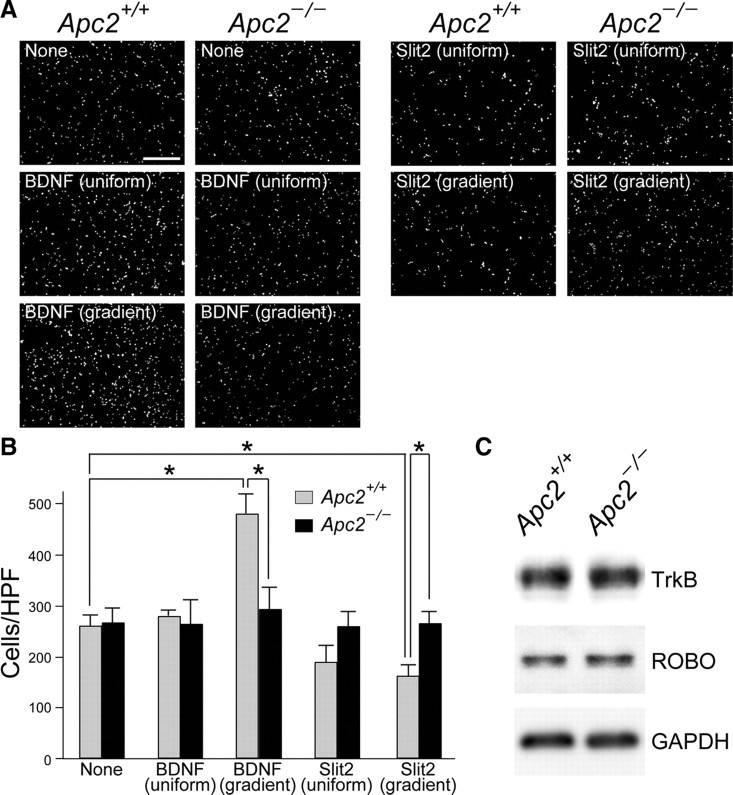
Impaired response of Apc2-deficient CGCs to a BDNF or Slit2 gradient. Purified wild-type and Apc2-deficient CGCs were grown for 16 h in Boyden chambers with or without 30 ng/ml BDNF or 50 ng/ml Slit2. The factors were added to both compartments (uniform) or only to the lower compartment (gradient). CGCs that migrated through the porous membrane into the lower chamber were stained with DAPI and quantified. A, Representative images of migrated CGCs under distinct conditions. Scale bars, 200 μm. B, Quantification was performed by counting migrated cells per high-powered field (cells/HPF ± SEM) in 10 fields from replicate wells. Gray bars, wild-type CGCs; black bars, Apc2-deficient CGCs. The asterisk indicates a significant difference between the two values by Student's t test (*p < 0.05). C, Western blot analyses of TrkB, Robo, and GAPDH in extracts of purified CGCs.
Because Apc2-knockdown caused a reduction in sensitivity to ephrin-A2 in retinal axons (Shintani et al., 2009), we postulated that Apc2-deficient CGCs would show abnormal responses to exogeneous factors. To test this possibility, we investigated the response of CGCs to BDNF, which is known to stimulate migration of CGCs in vitro and in vivo (Borghesani et al., 2002). As previously shown (Borghesani et al., 2002), the addition of BDNF into the lower well significantly stimulated the migration of wild-type CGCs (p < 0.05); the movement was not affected when BDNF was added to both compartments (Fig. 13A,B). In contrast, the migration of Apc2-deficient CGCs was not enhanced by this BDNF-gradient (Fig. 13A,B). Conversely, a gradient of Slit2, which is known as a chemorepellant for many types of neurons, including CGCs (Xu et al., 2004), inhibited the migration of wild-type but not mutant CGCs (Fig. 13A,B). These defects in response to BDNF or Slit2 among Apc2-deficient CGCs were not due to impairments in the expression of their receptors, because there was no apparent difference in levels of TrkB (a BDNF receptor) or Robo (roundabout, a Slit2 receptor) between the two (Fig. 13C).
Abnormal actin reorganization in Apc2-deficient CGCs after BDNF stimulation
We hypothesized that APC2 is implicated in transduction of extracellular signals to the intracellular migration machinery. Therefore, we investigated the response of Apc2-deficient CGCs to BDNF in more detail. At first, we examined the distribution of APC2 in isolated CGCs. Observations with a confocal laser scanning microscope revealed the protein to be well colocalized with microtubules (Fig. 14A). Also, APC2 was partially colocalized with F-actin at the leading edge (Fig. 14B). We next examined the distribution of APC2 at the CGC leading edge by using a TIRF microscope (TIRFM). With a TIRFM, images of cell surface-proximal fluorescent molecules can be obtained with excellent signal-to-noise ratios by use of shallow evanescent excitation of ∼100 nm (Axelrod, 2001). It was newly revealed that APC2 well colocalized with actin fibers in the peripheral region, and with microtubules in the central region, respectively, of the leading edge (Fig. 14C,D). Observations of HEK293 cells coexpressing APC2-mCherry and Lifeact-EGFP, which labels F-actin (Riedl et al., 2008), confirmed the colocalization of APC2 with F-actin in living cells (Fig. 14E). Western blot analyses showed total actin and total tubulin levels in Apc2-deficient CGCs to be similar to those in wild-type neurons (Fig. 14F). However, interestingly, the amount of acetylated tubulins representing stable microtubules was significantly decreased in mutant cells (Fig. 14F; p < 0.05).
Figure 14.
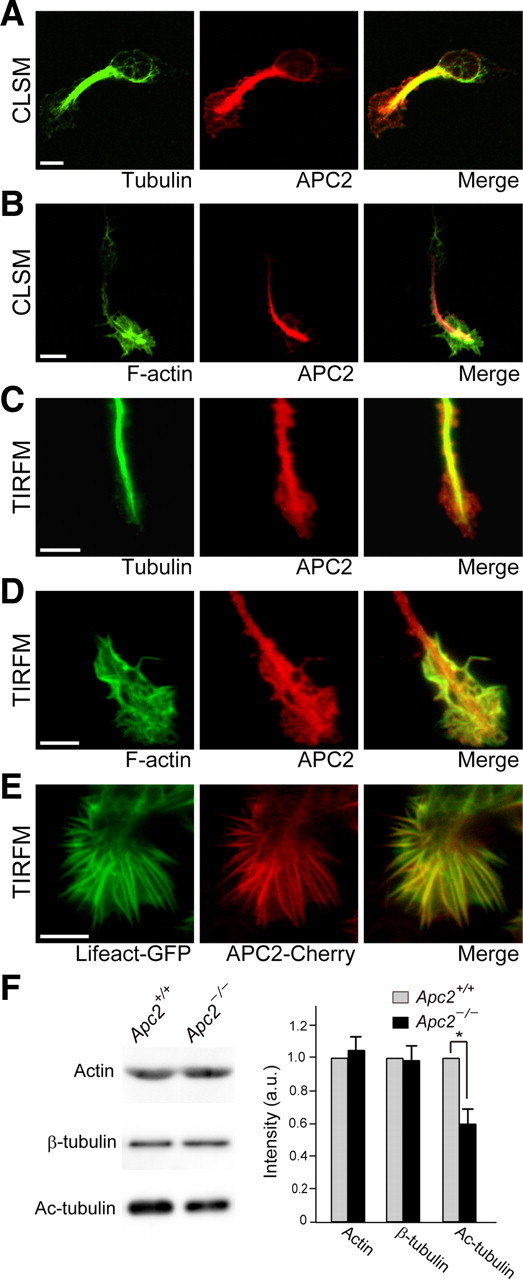
Distribution of APC2 along microtubules and actin fibers and destabilization of microtubules in Apc2-deficient CGCs. A, B, Distribution of APC2 in cultured CGCs examined by a confocal laser scanning microscope (CLSM). APC2 was well colocalized with microtubules both in the cell soma and at the leading edge (A). On the other hand, APC2 partially colocalized with F-actin in the leading edge (B). C, D, Distribution of APC2 at the leading edge of cultured CGCs examined by a TIRFM. Signals for APC2 were observed along microtubules in the shaft of the leading edge (C). On the other hand, APC2 was well colocalized with F-actin at the periphery of the leading edge (D). E, TIRFM observation of a HEK293T cell coexpressing APC2-mCherry and Lifeact-EGFP, which visualizes F-actin. Scale bars, 5 μm. F, Western blot analyses of cytoskeletal proteins in extracts of wild-type and Apc2-deficient CGCs. Signal intensities were quantified and summarized. Values are shown as the mean ± SEM. The asterisk indicates a significant difference between the two genotypes by Student's t test (*p < 0.05).
We next examined the cytoskeletal organization of CGCs (see Materials and Methods). Before BDNF-stimulation, there was no apparent difference in cell morphology, including the leading process, between the wild-type and Apc2-deficient CGCs: this is also evident from the organization of F-actin and tubulin (Fig. 15A). However, after BDNF-stimulation, the remarkable increment of F-actin at the leading edge in wild-type cells was not observed in Apc2-deficient cells (Fig. 15A).
Figure 15.
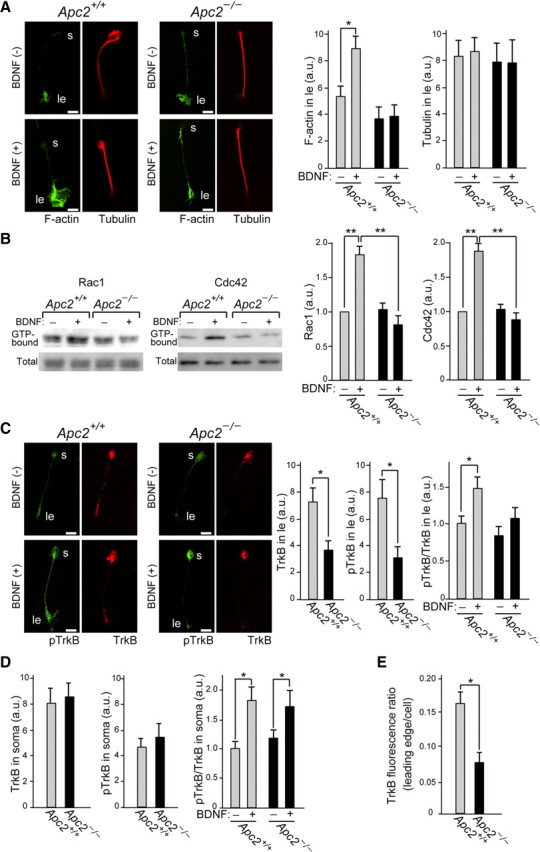
Abnormal TrkB distribution and actin reorganization in Apc2-deficient CGCs. A, Distribution of F-actin (green) and microtubule (red). Before or after stimulation with a BDNF-gradient for 1 h, CGCs were stained with an anti-Tuj1 antibody and phalloidin. Quantification was performed by measuring the fluorescent intensity in the leading edge. s, cell soma; ld, leading edge. B, Western blot analyses of GTP-bound forms of Rac1 and Cdc42, and total Rac1 and Cdc42 in extracts of CGCs with or without 1 h BDNF-gradient stimulation. Signal intensities were quantified and summarized. C, Distribution of TrkB (red) and phosphorylated TrkB (green). Before or after stimulation with a BDNF-gradient for 1 h, CGCs were immunostained with anti-TrkB and anti-phosphorylated TrkB antibodies. Quantification was performed by measuring the fluorescent intensity in the leading edge. D, Quantification of immunohistochemical staining of TrkB and pTrkB in the cell soma. Values are shown as the mean ± SEM E, Ratio of TrkB fluorescent intensity at the leading edge to the total cellular TrkB fluorescent intensity. Values are shown as the mean ± SEM. The asterisk indicates a significant difference between the two values by Student's t test (A, C–E) or ANOVAs (B) (*p < 0.05, **p < 0.01). Scale bars, 5 μm.
Since Rho family of small GTPases play an essential role in actin dynamics, we examined Rho family GTPase activities before and after BDNF-stimulation using CGCs in culture (Fig. 15B). As summarized in Figure 15B, the BDNF-stimulated upregulation of Rac1 and Cdc42 activity was highly attenuated in Apc2-deficient cells.
Because CGCs showed a difference in response to BDNF, we next examined the distribution and activation of TrkB in these cells. Surprisingly, distribution patterns of TrkB and phosphorylated TrkB (pTrkB) in Apc2-deficient CGCs were distinct from those of wild-type cells already before BDNF-stimulation. Both TrkB and pTrkB were significantly reduced at the leading edge in mutant neurons (Fig. 15C), though there was no significant difference in the cell soma (Fig. 15D): the ratio of TrkB in the leading edge to total cellular TrkB was one half in the mutant neurons (Fig. 15E). In addition, intensities of pTrkB at the leading edge were enhanced significantly by BDNF treatment in wild-type neurons, but only slightly in Apc2-deficient neurons (Fig. 15C). In contrast, the phosphorylation of TrkB in the cell soma increased equally in wild-type and mutant neurons after BDNF stimulation (Fig. 15D).
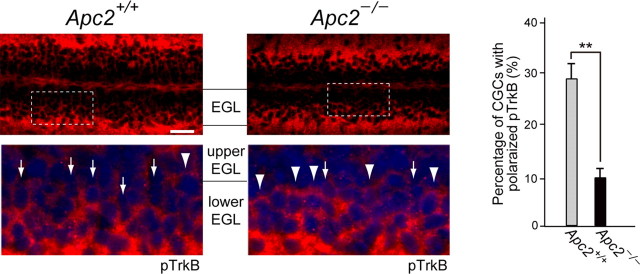
To verify that distribution of activated TrkB is affected also in migrating Apc2-deficient CGCs in vivo, we immunostained P10 cerebellar sections with an anti-pTrkB antibody. Consistent with the previous report (Zhou et al., 2007), pTrkBs were polarized at the front of migrating CGCs in wild-type cerebellum (Fig. 16). In contrast, pTrkB polarization in CGCs was significantly impaired in the Apc2-deficient cerebellum (Fig. 16). These results indicate that APC2 is essential for proper localization of activated TrkB receptors in migrating CGCs.
Figure 16.
Distribution of pTrkB in the inner EGL of cerebellar sections from P10 wild-type and Apc2-deficient mice. Sections were stained with an anti-pTrkB antibody (red) and DAPI (blue). Bottom, Enlarged images of the regions surrounded by dashed lines in upper panels. Arrows and arrowheads indicate representative CGCs with and without pTrkB polarization, respectively. Quantification was performed by calculating percentage of CGCs with pTrkB polarization. Values are shown as the mean ± SEM. The asterisk indicates a significant difference between the two values by Student's t test (**p < 0.01). Scale bar, 25 μm.
Discussion
In this study, we showed that a lack of Apc2 causes severe laminary defects in many regions of the brain, including the cerebral cortex, hippocampus, cerebellum, and olfactory bulb (Figs. 4, 6). In vivo BrdU labeling and immunohistochemical analyses indicate that laminary defects in the Apc2-deficient mouse brain are caused cell-autonomously by the perturbed migration of neurons (Figs. 7–9). We found that APC2 is colocalized with not only microtubules but also F-actin at the leading edge of migrating cells (Fig. 14). APC2 appears to be involved in the signaling pathway from membrane receptors for extracellular guidance factors to the intracellular migration machinery (Figs. 13, 15). This is the first demonstration of essential roles for APC2 in neuronal migration in the mammalian brain.
Several neurological diseases and psychiatric disorders, such as lissencephaly, schizophrenia, and epilepsy, are associated with the defective migration of postmitotic neurons (Ayala et al., 2007; Wynshaw-Boris et al., 2010). It is noteworthy that the phenotype of Apc2-deficient mice is distinct from that of other mutants, such as mice deficient in the Reelin/VLDLR/ApoER2 (Falconer, 1951; D'Arcangelo et al., 1995; Hirotsune et al., 1995; Ogawa et al., 1995; Trommsdorff et al., 1999), Cdk5/p35/p39 (Ohshima et al., 1996; Chae et al., 1997; Gilmore et al., 1998; Ko et al., 2001), Lis1 (Hirotsune et al., 1998), or DCX/DCLK (Deuel et al., 2006) genes. For instance, an “outside-in” migration pattern is observed in cortices of Reelin/VLDLR/ApoER2 and Cdk5/p35/p39 mutant mice (Falconer, 1951; D'Arcangelo et al., 1995; Hirotsune et al., 1995; Ogawa et al., 1995; Ohshima et al., 1996; Chae et al., 1997; Gilmore et al., 1998; Trommsdorff et al., 1999; Ko et al., 2001), but not in the Apc2-deficient cortex (Figs. 6, 8). In addition, cerebellar hypoplasia is observed in Reelin/VLDLR/ApoER2, Cdk5/p35/p39, and Lis1 mutant mice (Falconer, 1951; D'Arcangelo et al., 1995; Hirotsune et al., 1995, 1998; Ogawa et al., 1995; Ohshima et al., 1996; Chae et al., 1997; Gilmore et al., 1998; Trommsdorff et al., 1999; Ko et al., 2001), whereas the Apc2-deficient cerebellum is normal in size and foliation. DCX/DCLK mutant mice show defects only in the hippocampus (Deuel et al., 2006). Thus, APC2 appears to be a novel component of the cell-autonomous pathway essential for neuronal migration. The phenotypes observed in this study suggest that mutations in APC2 in humans may cause a neurodevelopmental disorder.
APC and APC2 constitute a protein family. Analyses of knock-out mice lacking the two genes suggest distinct physiological functions in cortical development. In the developing cortex, APC is expressed in radial glial cells (Ivaniutsin et al., 2009; Yokota et al., 2009). In Apc-deficient mice, not only is the generation of neuronal precursor cells severely reduced, but radial glial cells lose their polarity (Ivaniutsin et al., 2009; Yokota et al., 2009). In contrast, the lack of Apc2 in mice did not affect the overall architecture of the radial glial network (Fig. 10). This is probably because APC2 is not expressed in radial glial cells, but in postmitotic migrating neurons (Figs. 2, 3). In Apc-deficient brains, increased β-catenin levels are observed (Ivaniutsin et al., 2009; Yokota et al., 2009). Although APC2 has also been reported to regulate β-catenin levels in cell cultures (Nakagawa et al., 1998), its expression and distribution are not altered in the Apc2-deficient brain (our unpublished observations), suggesting that APC2 is not involved in the regulation of Wnt/β-catenin in vivo. APC is one of the best-characterized plus-end tracking proteins and binds selectively to the plus ends of microtubules through its C-terminal region (Mimori-Kiyosue et al., 2000). On the other hand, APC2 is distributed along not only the microtubule network, but also actin fibers as we have shown (Fig. 14). Both middle and C-terminal regions of APC2 showed colocalization with F-actin when expressed in 293T cells independently, suggesting that there exist multiple actin-binding domains in APC2 (our unpublished observations). On the other hand, APC2 binds to microtubules via a domain in the C-terminal region, which shows no homology with APC (our unpublished observations). The different distribution patterns at the subcellular level may also explain the reason why the phenotype of mice lacking Apc is distinct from the phenotype of mice lacking Apc2.
Directional migration of CGCs toward their final destination in vivo presumably relies on variegated specific cues in the cerebellar cortex. For directed migration, a migrating cell is supposed to contain complex regulatory pathways downstream of various stimuli. However, it is still unclear how extracellular signals are detected and transduced from cell surface receptors to the migration machinery. Because no obvious defects in the migration of Apc2-deficient CGCs were detected in vitro under nonstimulated conditions (Figs. 12, 13), the basic organization of the migration machinery is probably almost normal. This view is consistent with our observations that a certain proportion of neurons could reach their proper destination in vivo (Fig. 9). This phenotype of Apc2-deficient neurons is distinct from that of other migration mutants, such as Lis1 deficiency, in which the migration machinery itself appears to be defective (Hirotsune et al., 1998; Kholmanskikh et al., 2003). We found that BDNF-stimulated directional migration is affected in Apc2-deficient neurons and the same cells cannot respond to a chemorepulsive factor, Slit2, either (Fig. 13). In our previous study, Apc2-knockdown retinal axons displayed an attenuated response to ephrin-A2, a membrane-bound repulsive factor, and as a result caused abnormal axonal projections onto the optic tectum (Shintani et al., 2009). In line with these results, we have also found defects in retinocollicular projections in Apc2-deficient mice (our unpublished observations). In normal neuronal migration and axon guidance, exquisite integration and transduction of attractive and repulsive signals to control cytoskeletal dynamics is essential for the guidance of the axon/leading process. Migration of Apc2-deficient CGCs, like that of Apc2-deficient cortical neurons (Figs. 6–8), appeared to be enhanced or attenuated in the developing cerebellum (Fig. 9). This confused migration is probably caused by inability in Apc2-deficient neurons to integrate distinct extracellular signals.
Studies with cultured CGCs have showed that F-actin and microtubule are concentrated at the peripheral and central region of the leading process in migrating neurons, respectively (Rivas and Hatten, 1995). The present observation with TIRFM revealed for the first time that APC2 is colocalized with F-actin in the peripheral region of the leading edge (Fig. 14). This suggests that APC2 participates in the regulation of actin dynamics, in addition to microtubule dynamics, in neurons. Indeed, no increase in F-actin was observed at the leading edge in Apc2-deficient CGCs upon BDNF stimulation (Fig. 15A). Rac1 and Cdc42 promote the formation of the lamellipodia and filopodia at the leading edge, respectively, through regulation of actin dynamics (Kawauchi et al., 2003; Kholmanskikh et al., 2003; Raftopoulou and Hall, 2004; Tahirovic et al., 2010). APC2 appears to be directly involved in Rho family GTPase activation, because BDNF-stimulated upregulation of Rac1 and Cdc42 activity is highly attenuated in Apc2-deficient CGCs when whole-cell extracts were analyzed (Fig. 15B), regardless of identical levels of expression and activation of TrkB receptors between CGCs of the two genotypes (Figs. 13C, 15D). APC interacts with the Asef family, Rac1-specific and Cdc42-specific guanine nucleotide exchange factors (GEFs), and stimulates their GEF activity (Kawasaki et al., 2000). Because APC2 and APC have approximately similar domain structures, APC2 may also organize a multiprotein complex that regulates cytoskeletal dynamics.
The lack of BDNF-dependent activation of Rac1 at the leading edge of Apc2-deficient CGCs is partly attributable to the decreased distribution of TrkB at the leading edge (Figs. 15, 16), because Rac1 acts downstream of BDNF/TrkB signaling to mediate BDNF-induced directional migration (Zhou et al., 2007). Because APC2 is involved in the regulation of microtubule dynamics, Apc2 deficiency presumably also causes an impairment in the transport of TrkB receptors to the leading edge along microtubules. Our previous study showed that APC2 interacts with and stabilizes microtubules (Shintani et al., 2009). Indeed, destabilization of microtubules is observed also in Apc2-deficient CGCs (Fig. 14F). Both F-actin and microtubules play important roles in the control of neuronal migration. Thus, dysregulation of both actin and microtubule dynamics probably accounts for the defects in directional migration of Apc2-deficient neurons in response to extracellular guiding molecules during brain development.
Footnotes
This work was supported by grants from Japan's Ministry of Education, Culture, Sports, Science and Technology. We thank M. Tanaka (Nagoya City University) for technical advice. We also thank Y. Dokyo, K. Wada, S. Miura, and N. Hattori for technical assistance, and A. Kodama for secretarial assistance.
The authors declare no competing financial interests.
References
- Arlotta P, Molyneaux BJ, Chen J, Inoue J, Kominami R, Macklis JD. Neuronal subtype-specific genes that control corticospinal motor neuron development in vivo. Neuron. 2005;45:207–221. doi: 10.1016/j.neuron.2004.12.036. [DOI] [PubMed] [Google Scholar]
- Axelrod D. Total internal reflection fluorescence microscopy in cell biology. Traffic. 2001;2:764–774. doi: 10.1034/j.1600-0854.2001.21104.x. [DOI] [PubMed] [Google Scholar]
- Ayala R, Shu T, Tsai LH. Trekking across the brain: the journey of neuronal migration. Cell. 2007;128:29–43. doi: 10.1016/j.cell.2006.12.021. [DOI] [PubMed] [Google Scholar]
- Bicknese AR, Sheppard AM, O'Leary DD, Pearlman AL. Thalamocortical axons extend along a chondroitin sulfate proteoglycan-enriched pathway coincident with the neocortical subplate and distinct from the efferent path. J Neurosci. 1994;14:3500–3510. doi: 10.1523/JNEUROSCI.14-06-03500.1994. [DOI] [PMC free article] [PubMed] [Google Scholar]
- Borghesani PR, Peyrin JM, Klein R, Rubin J, Carter AR, Schwartz PM, Luster A, Corfas G, Segal RA. BDNF stimulates migration of cerebellar granule cells. Development. 2002;129:1435–1442. doi: 10.1242/dev.129.6.1435. [DOI] [PubMed] [Google Scholar]
- Chae T, Kwon YT, Bronson R, Dikkes P, Li E, Tsai LH. Mice lacking p35, a neuronal specific activator of Cdk5, display cortical lamination defects, seizures, and adult lethality. Neuron. 1997;18:29–42. doi: 10.1016/s0896-6273(01)80044-1. [DOI] [PubMed] [Google Scholar]
- D'Arcangelo G, Miao GG, Chen SC, Soares HD, Morgan JI, Curran T. A protein related to extracellular matrix proteins deleted in the mouse mutant reeler. Nature. 1995;374:719–723. doi: 10.1038/374719a0. [DOI] [PubMed] [Google Scholar]
- Deuel TA, Liu JS, Corbo JC, Yoo SY, Rorke-Adams LB, Walsh CA. Genetic interactions between doublecortin and doublecortin-like kinase in neuronal migration and axon outgrowth. Neuron. 2006;49:41–53. doi: 10.1016/j.neuron.2005.10.038. [DOI] [PubMed] [Google Scholar]
- Falconer DS. Two new mutants “trembler” and “reeler” with neurological actions in the house mouse. J Genet. 1951;50:192–201. doi: 10.1007/BF02996215. [DOI] [PubMed] [Google Scholar]
- Ferland RJ, Cherry TJ, Preware PO, Morrisey EE, Walsh CA. Characterization of Foxp2 and Foxp1 mRNA and protein in the developing and mature brain. J Comp Neurol. 2003;460:266–279. doi: 10.1002/cne.10654. [DOI] [PubMed] [Google Scholar]
- Gilmore EC, Ohshima T, Goffinet AM, Kulkarni AB, Herrup K. Cyclin-dependent kinase 5-deficient mice demonstrate novel developmental arrest in cerebral cortex. J Neurosci. 1998;18:6370–6377. doi: 10.1523/JNEUROSCI.18-16-06370.1998. [DOI] [PMC free article] [PubMed] [Google Scholar]
- Hanson CA, Miller JR. Non-traditional roles for the Adenomatous Polyposis Coli (APC) tumor suppressor protein. Gene. 2005;361:1–12. doi: 10.1016/j.gene.2005.07.024. [DOI] [PubMed] [Google Scholar]
- Hatten ME. Neuronal regulation of astroglial morphology and proliferation in vitro. J Cell Biol. 1985;100:384–396. doi: 10.1083/jcb.100.2.384. [DOI] [PMC free article] [PubMed] [Google Scholar]
- Hevner RF, Shi L, Justice N, Hsueh Y, Sheng M, Smiga S, Bulfone A, Goffinet AM, Campagnoni AT, Rubenstein JL. Tbr1 regulates differentiation of the preplate and layer 6. Neuron. 2001;29:353–366. doi: 10.1016/s0896-6273(01)00211-2. [DOI] [PubMed] [Google Scholar]
- Hirotsune S, Takahara T, Sasaki N, Hirose K, Yoshiki A, Ohashi T, Kusakabe M, Murakami Y, Muramatsu M, Watanabe S, Nakao K, Katsuki M, Hayashizaki Y. The reeler gene encodes a protein with an EGF-like motif expressed by pioneer neurons. Nat Genet. 1995;10:77–83. doi: 10.1038/ng0595-77. [DOI] [PubMed] [Google Scholar]
- Hirotsune S, Fleck MW, Gambello MJ, Bix GJ, Chen A, Clark GD, Ledbetter DH, McBain CJ, Wynshaw-Boris A. Graded reduction of Pafah1b1 (Lis1) activity results in neuronal migration defects and early embryonic lethality. Nat Genet. 1998;19:333–339. doi: 10.1038/1221. [DOI] [PubMed] [Google Scholar]
- Ivaniutsin U, Chen Y, Mason JO, Price DJ, Pratt T. Adenomatous polyposis coli is required for early events in the normal growth and differentiation of the developing cerebral cortex. Neural Dev. 2009;4:3. doi: 10.1186/1749-8104-4-3. [DOI] [PMC free article] [PubMed] [Google Scholar]
- Kawasaki Y, Senda T, Ishidate T, Koyama R, Morishita T, Iwayama Y, Higuchi O, Akiyama T. Asef, a link between the tumor suppressor APC and G-protein signaling. Science. 2000;289:1194–1197. doi: 10.1126/science.289.5482.1194. [DOI] [PubMed] [Google Scholar]
- Kawauchi T, Chihama K, Nabeshima Y, Hoshino M. The in vivo roles of STEF/Tiam1, Rac1 and JNK in cortical neuronal migration. EMBO J. 2003;22:4190–4201. doi: 10.1093/emboj/cdg413. [DOI] [PMC free article] [PubMed] [Google Scholar]
- Kholmanskikh SS, Dobrin JS, Wynshaw-Boris A, Letourneau PC, Ross ME. Disregulated RhoGTPases and actin cytoskeleton contribute to the migration defect in Lis1-deficient neurons. J Neurosci. 2003;23:8673–8681. doi: 10.1523/JNEUROSCI.23-25-08673.2003. [DOI] [PMC free article] [PubMed] [Google Scholar]
- Ko J, Humbert S, Bronson RT, Takahashi S, Kulkarni AB, Li E, Tsai LH. p35 and p39 are essential for cyclin-dependent kinase 5 function during neurodevelopment. J Neurosci. 2001;21:6758–6771. doi: 10.1523/JNEUROSCI.21-17-06758.2001. [DOI] [PMC free article] [PubMed] [Google Scholar]
- Mimori-Kiyosue Y, Shiina N, Tsukita S. Adenomatous polyposis coli (APC) protein moves along microtubules and concentrates at their growing ends in epithelial cells. J Cell Biol. 2000;148:505–518. doi: 10.1083/jcb.148.3.505. [DOI] [PMC free article] [PubMed] [Google Scholar]
- Nagata I, Nakatsuji N. Granule cell behavior on laminin in cerebellar microexplant cultures. Brain Res Dev Brain Res. 1990;52:63–73. doi: 10.1016/0165-3806(90)90222-k. [DOI] [PubMed] [Google Scholar]
- Nakagawa H, Murata Y, Koyama K, Fujiyama A, Miyoshi Y, Monden M, Akiyama T, Nakamura Y. Identification of a brain-specific APC homologue, APCL, and its interaction with β-catenin. Cancer Res. 1998;58:5176–5181. [PubMed] [Google Scholar]
- Nieto M, Monuki ES, Tang H, Imitola J, Haubst N, Khoury SJ, Cunningham J, Gotz M, Walsh CA. Expression of Cux-1 and Cux-2 in the subventricular zone and upper layers II-IV of the cerebral cortex. J Comp Neurol. 2004;479:168–180. doi: 10.1002/cne.20322. [DOI] [PubMed] [Google Scholar]
- Ogawa M, Miyata T, Nakajima K, Yagyu K, Seike M, Ikenaka K, Yamamoto H, Mikoshiba K. The reeler gene-associated antigen on Cajal-Retzius neurons is a crucial molecule for laminar organization of cortical neurons. Neuron. 1995;14:899–912. doi: 10.1016/0896-6273(95)90329-1. [DOI] [PubMed] [Google Scholar]
- Ohshima T, Ward JM, Huh CG, Longenecker G, Veeranna Pant HC, Brady RO, Martin LJ, Kulkarni AB. Targeted disruption of the cyclin-dependent kinase 5 gene results in abnormal corticogenesis, neuronal pathology and perinatal death. Proc Natl Acad Sci U S A. 1996;93:11173–11178. doi: 10.1073/pnas.93.20.11173. [DOI] [PMC free article] [PubMed] [Google Scholar]
- Raftopoulou M, Hall A. Cell migration: Rho GTPases lead the way. Dev Biol. 2004;265:23–32. doi: 10.1016/j.ydbio.2003.06.003. [DOI] [PubMed] [Google Scholar]
- Rakic P. The radial edifice of cortical architecture: from neuronal silhouettes to genetic engineering. Brain Res Rev. 2007;55:204–219. doi: 10.1016/j.brainresrev.2007.02.010. [DOI] [PMC free article] [PubMed] [Google Scholar]
- Riedl J, Crevenna AH, Kessenbrock K, Yu JH, Neukirchen D, Bista M, Bradke F, Jenne D, Holak TA, Werb Z, Sixt M, Wedlich-Soldner R. Lifeact: a versatile marker to visualize F-actin. Nat Methods. 2008;5:605–607. doi: 10.1038/nmeth.1220. [DOI] [PMC free article] [PubMed] [Google Scholar]
- Rivas RJ, Hatten ME. Motility and cytoskeletal organization of migrating cerebellar granule neurons. J Neurosci. 1995;15:981–989. doi: 10.1523/JNEUROSCI.15-02-00981.1995. [DOI] [PMC free article] [PubMed] [Google Scholar]
- Rowley PT. Inherited susceptibility to colorectal cancer. Annu Rev Med. 2005;56:539–554. doi: 10.1146/annurev.med.56.061704.135235. [DOI] [PubMed] [Google Scholar]
- Sakuta H, Suzuki R, Takahashi H, Kato A, Shintani T, Iemura S, Yamamoto TS, Ueno N, Noda M. Ventroptin: a BMP-4 antagonist expressed in a double-gradient pattern in the retina. Science. 2001;293:111–115. doi: 10.1126/science.1058379. [DOI] [PubMed] [Google Scholar]
- Shintani T, Ihara M, Tani S, Sakuraba J, Sakuta H, Noda M. APC2 plays an essential role in axonal projections through the regulation of microtubule stability. J Neurosci. 2009;29:11628–11640. doi: 10.1523/JNEUROSCI.2394-09.2009. [DOI] [PMC free article] [PubMed] [Google Scholar]
- Tahirovic S, Hellal F, Neukirchen D, Hindges R, Garvalov BK, Flynn KC, Stradal TE, Chrostek-Grashoff A, Brakebusch C, Bradke F. Rac1 regulates neuronal polarization through the WAVE complex. J Neurosci. 2010;30:6930–6943. doi: 10.1523/JNEUROSCI.5395-09.2010. [DOI] [PMC free article] [PubMed] [Google Scholar]
- Trommsdorff M, Gotthardt M, Hiesberger T, Shelton J, Stockinger W, Nimpf J, Hammer RE, Richardson JA, Herz J. Reeler/Disabled-like disruption of neuronal migration in knockout mice lacking the VLDL receptor and ApoE receptor 2. Cell. 1999;97:689–701. doi: 10.1016/s0092-8674(00)80782-5. [DOI] [PubMed] [Google Scholar]
- Wynshaw-Boris A, Pramparo T, Youn YH, Hirotsune S. Lissencephaly: mechanistic insights from animal models and potential therapeutic strategies. Semin Cell Dev Biol. 2010;21:823–830. doi: 10.1016/j.semcdb.2010.07.008. [DOI] [PMC free article] [PubMed] [Google Scholar]
- Xu HT, Yuan XB, Guan CB, Duan S, Wu CP, Feng L. Calcium signaling in chemorepellant Slit2-dependent regulation of neuronal migration. Proc Natl Acad Sci U S A. 2004;101:4296–4301. doi: 10.1073/pnas.0303893101. [DOI] [PMC free article] [PubMed] [Google Scholar]
- Yokota Y, Kim WY, Chen Y, Wang X, Stanco A, Komuro Y, Snider W, Anton ES. The adenomatous polyposis coli protein is an essential regulator of radial glial polarity and construction of the cerebral cortex. Neuron. 2009;61:42–56. doi: 10.1016/j.neuron.2008.10.053. [DOI] [PMC free article] [PubMed] [Google Scholar]
- Zhao CT, Li K, Li JT, Zheng W, Liang XJ, Geng AQ, Li N, Yuan XB. PKCdelta regulates cortical radial migration by stabilizing the Cdk5 activator p35. Proc Natl Acad Sci U S A. 2009;106:21353–21358. doi: 10.1073/pnas.0812872106. [DOI] [PMC free article] [PubMed] [Google Scholar]
- Zhou P, Porcionatto M, Pilapil M, Chen Y, Choi Y, Tolias KF, Bikoff JB, Hong EJ, Greenberg ME, Segal RA. Polarized signaling endosomes coordinate BDNF-induced chemotaxis of cerebellar precursors. Neuron. 2007;55:53–68. doi: 10.1016/j.neuron.2007.05.030. [DOI] [PMC free article] [PubMed] [Google Scholar]


