

Abstract
Reading sentences involves a distributed network of brain regions acting in concert surrounding the left sylvian fissure. The mechanisms of neural communication underlying the extraction and integration of verbal information across subcomponents of this reading network are still largely unknown. We recorded intracranial EEG activity in 12 epileptic human patients performing natural sentence reading and analyzed long-range corticocortical interactions between local neural activations. During a simple task contrasting semantic, phonological, and purely visual processes, we found process-specific neural activity elicited at the single-trial level, characterized by energy increases in a broad gamma band (40–150 Hz). Correlation analysis between task-induced gamma-band activations revealed a selective fragmentation of the network into specialized subnetworks supporting sentence-level semantic analysis and phonological processing. We extend the implications of our results beyond reading, to propose that gamma-band amplitude correlations might constitute a fundamental mechanism for large-scale neural integration during high-level cognition.
Introduction
Despite the rapid accumulation of evidence from functional neuroimaging, the neural processes that allow us to read a sentence like this one remain largely unknown. The brain regions that support reading have been successfully identified by fMRI and PET studies over the last 15 years (Petersen et al., 1988; Price, 2000; Binder et al., 2003; Jobard et al., 2003; Démonet et al., 2005; Dehaene and Cohen, 2011; Price and Devlin, 2011), and functional connectivity studies have revealed correlated metabolic demands between those regions, suggesting that they behave collectively as a network—the “reading network” (Bullmore et al., 1996; Bokde et al., 2001; Homae et al., 2003; Mechelli et al., 2005). However, it is difficult to infer from purely metabolic measures the fast neural mechanisms that support network interactions during reading.
Following research on network dynamics initiated with EEG and MEG (Kutas and Federmeier, 2000; Pylkkänen and Marantz, 2003; Hald et al., 2006; Salmelin and Kujala, 2006; Kujala et al., 2008; McDonald et al., 2010; Barca et al., 2011), but at the finer spatial scale of intracranial EEG (iEEG), our intention was to reveal neural interactions between individual components of the reading network, regarding two of its most characteristic subprocesses: sentence-level semantic analysis and phonological processing.
Sentence-level semantic analysis involves several regions involved in speech perception, including the bilateral middle temporal gyrus, the angular gyrus, and often Broca's area (Mashal et al., 2009; Obleser and Kotz, 2009; Rogalsky and Hickok, 2009; Ye and Zhou, 2009; Price, 2010). Phonological processing—the production of an auditory representation of linguistic content—requires several subprocesses, only a fraction of which are specific to reading, such as grapheme-to-phoneme conversion in the left ventral temporal occipital cortex (Cohen et al., 2000). It involves also less specific processes, such as working memory, in conditions that emphasize the progressive formation of an auditory word form from individual syllables (Juphard et al., 2011), in strong interaction with subvocal articulation. Those processes involve mostly lower precentral and postcentral regions from Broca to the supramarginalis gyrus, which are also generally active during speech production, for instance during picture-naming tasks (Sinai et al., 2005).
We used iEEG to clarify the interactions between those regions during a simple sentence reading task contrasting visual, phonological, and semantic analysis. We focused our analysis on gamma-band amplitude (GBA) fluctuations (40–150 Hz), which correlate with the BOLD signal (Logothetis et al., 2001; Kayser et al., 2004; Mukamel et al., 2005; Lachaux et al., 2007; Ojemann et al., 2010) and with population-level firing rate (Manning et al., 2009; Ray and Maunsell, 2011). These results suggest two testable predictions: first, that GBA should increase in all major nodes of the reading network during sentence reading, and second, that GBA time fluctuations should be correlated between those regions, in a task-dependent fashion, as do BOLD fluctuations (Richardson et al., 2011).
Our study confirmed those predictions and revealed that semantic analysis increases GBA amplitude correlation between inferior frontal and middle temporal sites, while phonological analysis strengthens the coupling between frontal, prefrontal, anterior parietal, and inferior temporal sites.
Materials and Methods
Patients and electrodes implantation.
Twelve patients, candidates for drug-resistant partial epilepsy surgery, participated in this study (all female; average age, 30 years). All participants provided written informed consent and the experimental procedures were approved by the Institutional Review Board and by the National French Science Ethical Committee (Comité Consultatif de Protection des Personnes dans la Recherche Biomédicale). Before the experiment began, patients were screened with standard clinical neuropsychological tests to evaluate their ability to perform the task.
As the location of the epileptic focus could not be identified using noninvasive methods, the patients underwent intracranial EEG recordings by means of stereotactically implanted multilead depth electrodes [stereotactic EEG (SEEG)] (Kahane et al., 2004; Jerbi et al., 2009b). Selection of sites to implant was entirely based on clinical purposes, with no reference to the present experimental protocol. The 12 participants were native French speakers with normal or corrected-to-normal vision. Patients performed the task 4 d after the implantation of the electrodes.
Each patient was implanted with semirigid electrodes (0.8 mm diameter), consisting of a linear array of 10–15 recording sites (with an equal intersite spacing of 3.5 mm, center to center) (Dixi). Electrodes were inserted perpendicular to the sagittal plane (see Fig. 1D), therefore recording from both middle and lateral cortical areas, including sulcal cortex. The spatial resolution of such intracerebral EEG recordings is on the order of the distance between consecutive recording sites, that is, 3.5 mm (Lachaux et al., 2003; Jerbi et al., 2009b). Electrode contacts were identified on each individual stereotactic scheme and then anatomically localized using the proportional atlas of Talairach and Tournoux (1988). In addition, computer-assisted matching of a postimplantation computerized tomography scan with a preimplantation 3-D MRI provided a direct visualization of the electrode contacts with respect to the brain anatomy of each patient (Activis).
Figure 1.
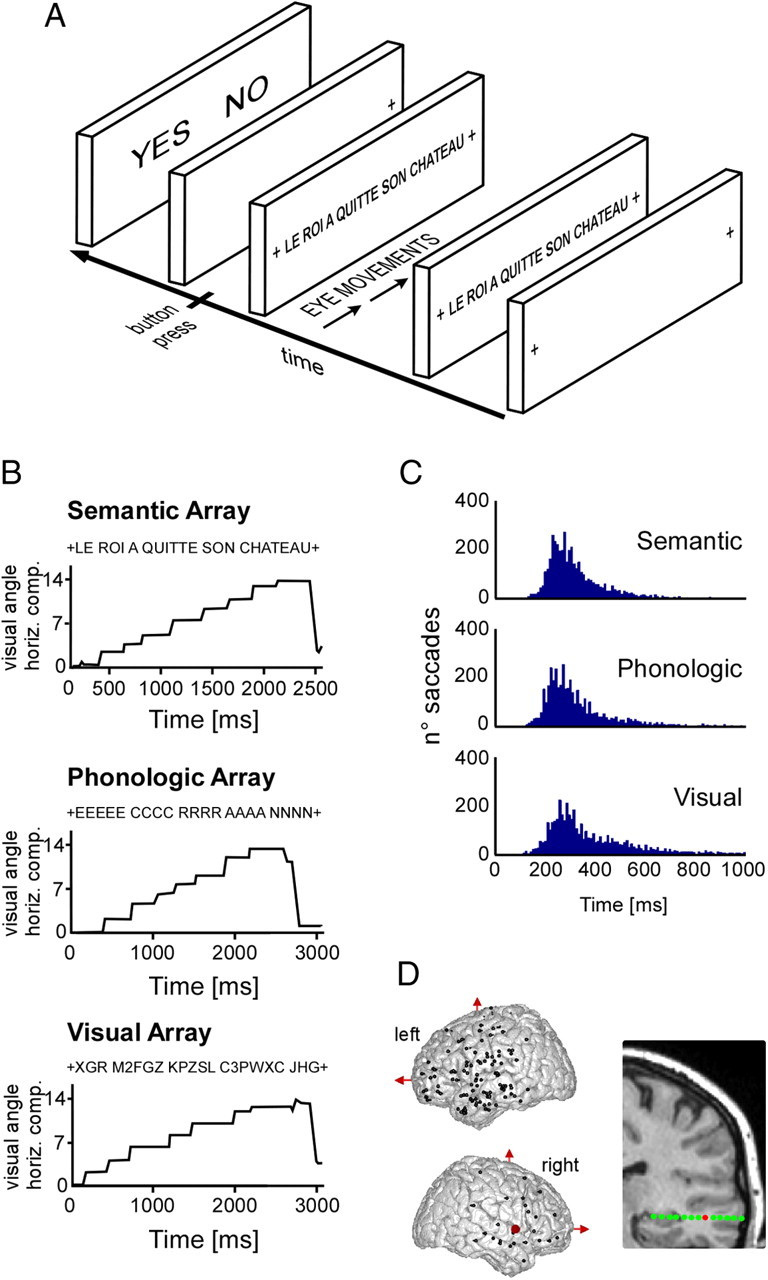
Experimental design, ocular behavior, and electrode implantation. A, Depiction of the images and general time sequence used in the reading experiment. In each trial, a sentence was presented and patients were asked to scan through it from left to right and press a button when finished to subsequently perform the task (see Materials and Methods). B, Three illustrative examples of saccadic eye movements during sentence reading for each one of the three conditions termed semantic, phonological, and visual (see Materials and Methods). In the semantic condition, subjects had to read a real sentence and judge whether it belonged to an ongoing story. In the phonological condition, subjects had to form a global pronounceable character string from groups of identical letters and decide whether the global string was a word or a pseudoword. Subjects were explicitly instructed to form a mental auditory representation of the string, as it formed. In the visual condition, subjects had to determine whether there were more than two digits hidden in a string of random letters. English translation: Left panel, “The king has left his castle”; middle panel, “screen.” C, Histogram of saccade distribution in time after stimulus onset, for each one of the three conditions. D, The top panel depicts electrode implantation sites for all patients in a MNI brain, from left and right hemispheres, respectively. On the lower part, a coronal brain view shows an example of multiple contact sites of a single electrode in one patient.
Recordings.
Experimental data were recorded extraoperatively according to our routine procedure (Kahane et al., 2004). Intracranial recordings were conducted using an audiovideo EEG monitoring system (Micromed) that allowed the simultaneous recording of 128 SEEG channels sampled at 1024 Hz (0.1–250 Hz bandwidth) during the experimental paradigm. One of the contact sites in the white matter was chosen as a reference; however, all signals were re-referenced to their nearest neighbor on the same electrode, 3.5 mm away before analysis (bipolar montage). Recording sites showing clear epileptiform activities were excluded from the analysis. Among the remaining sites, monopolar and bipolar data were systematically inspected, both raw and high-pass filtered (>15 Hz), and any trial showing epileptiform activity (such as spikes) in any of those traces was discarded. The cortical regions analyzed in this study were all located outside the seizure onset zone, in each patient (Table 1), and have been functionally mapped with electrical cortical stimulation (Table 2).
Table 1.
Patients' demographics
| Patient | Gender | Age | Handedness | Verbal IQ | Hemispheric lateralization for language | Seizure onset zone |
|---|---|---|---|---|---|---|
| 1 | F | 43 | RH | 87 | Left | Left anterior entorhinal cortex |
| 2 | M | 51 | RH | 96 | Left | Left anterior temporal lobe |
| 3 | F | 38 | RH | 98 | ND | Left anterior temporal lobe |
| 4 | F | 35 | RH | 96 | ND | Right insula and anterior temporal cortex |
| 5 | F | 33 | RH | ND | ND | Left hippocampus |
| 6 | F | 56 | AM | 104 | Left | Left medial temporal lobe |
| 7 | F | 26 | RH | ND | ND | Left precentral gyrus |
| 8 | F | 46 | RH | 101 | Left | Left anterior hippocampus/temporal pole |
| 9 | F | 23 | LH | 101 | Bilateral (L > R) | Right anterior frontal cortex |
| 10 | M | 23 | RH | 105 | ND | Left posterior temporal cortex |
| 11 | F | 22 | RH | 101 | Left | Left hippocampus |
| 12 | F | 24 | LH | 83 | Bilateral (R > L) | Left temporal pole/hippocampus |
Patients' descriptives include gender, age, handedness, verbal IQ, hemispheric lateralization for language assessed by fMRI, and seizure onset zone. RH, Right-handed; LH, left-handed; AM, ambidextrous; ND, not done.
Table 2.
Effects of electrical cortical stimulations at 50 Hz
| ROI | Electrode | Patient | Electric stimulation mapping responses |
|---|---|---|---|
| MTG | e′6 | 1 | Heavy weight feeling rising from legs to stomach (1 mA) |
| MTG | u′5 | 6 | Feels like gravel in the head, not auditory (1 mA) |
| MTG | u′6 | 6 | Feels like gravel in the head, not auditory (1 mA) |
| SMG | s′9 | 2 | Hard to find words to talk (2 mA); trouble reading (3 mA) |
| SMG | s′10 | 2 | Hard to find words to talk (2 mA); trouble reading (3 mA) |
| SMG | s′7 | 5 | Trouble pronouncing words when reading (0.8 mA) |
| SMG | s′8 | 5 | Trouble pronouncing words when reading (0.8 mA) |
| PFC PHO | q′6 | 6 | Wants to move left hand (1 mA) |
| PFC PHO | q′7 | 6 | Wants to move left hand (1 mA) |
| PFC PHO | r′8 | 7 | Paresthesis of right inferior hemi-face (1.6 mA) |
| PFC PHO | r′9 | 7 | Paresthesis of right inferior hemi-face (1.6 mA) |
| VOTC INT | f′2 | 1 | Searching for words during speech (1–3 mA) |
| VOTC INT | f′2 | 5 | Trouble reading; had to decompose words to read them (2 mA) |
| VOTC MID | f′3 | 5 | Trouble reading; had to decompose words to read them (2 mA) |
| VOTC MID | f′4 | 11 | Right hemifield visual illusion (1 mA) |
| VOTC EXT | f′7 | 1 | Searching for words during speech (1–3 mA) |
| VOTC EXT | f′8 | 1 | Searching for words during speech (1–3 mA) |
| VOTC EXT | e′7 | 2 | Trouble reading (3 mA) |
| VOTC EXT | e8 | 4 | Body tilts to the side L > R (1 mA) |
The patient's response is reported for each electrode in region of interest (ROI). Electrical stimulation was applied for maximum 5 s at varying intensities, ranging from 0.8 to 3 mA.
Eye movements were recorded with two external electro-oculogram (EOG) channels.
Experimental paradigm.
The experiment consisted of three conditions: in the first condition (called, in short, “semantic” or SEM, because it involved semantic, as well as syntactic, processing at sentence level; see Fig. 1B, left panel), participants were presented with 80 short one-line sentences taken from a children book story [one sentence per trial (e.g., in French, “LE ROI A QUITTE SON CHATEAU”; in English, “THE KING HAS LEFT HIS CASTLE”)]. Sentences were in French and had between 7 and 13 words. However, in 20% of trials (16 trials), the sentence was from a completely unrelated story, found in a sport magazine (e.g., in French, “SON JEU DE REVERS EST VRAIMENT BON”; in English, “HIS BACKHAND IS REALLY GOOD”). The task was to identify for each sentence whether it belonged to the main story or not. General presentation structure was the same for each trial (see Fig. 1A): First, a fixation cross appeared for 2000 ms in the left end of the screen, instructing the participant to shift her gaze to that position. The next screen would display the sentence, which the participant had to read at her own pace until her gaze reached a fixation cross at the right end of the screen. At that time, the participant had to press a button (right index finger) to display the response panel, asking whether the sentence belonged to the main story (“left index button press”) or not (“right index button press”). That second button press triggered the next trial. Note the design of experiment made it possible to calibrate eye movements in each trial, since participants were instructed to look at a left and a right fixation cross.
In the second condition (called “phonological” or PHO because it involved explicit grapho-phonological conversion, as well as working memory; see Fig. 1B, middle panel), words were replaced with groups of repeated letters (e.g., “PPP HHHH OOO NNNN EEE”), and the participants had to shift their gaze from group to group with the explicit instruction to progressively silently read the letter string formed by the letters of the successive groups (e.g., “PH..O..NE”). This was a lexical decision task on whether the formed word represented or not a real word (64 of 100 trials contained a word in each block). Nonwords were all pronounceable.
In the third condition [visual (VIS); see Fig. 1B, right panel], words were replaced by strings of alphanumeric signs, some of which contained a digit (e.g., “HDF3Z NGTD SZY2G FZTS JRGBD PFHD”). Participants had read them shifting their gaze from group to group and from left to right. The task was to decide whether there were two or three groups comprising digits (64 trials with two digits and 16 trials with three digits in each block). On average, the number of character strings displayed in each trial, in the visual or the phonological conditions, matched the sentence length in the semantic condition.
Three patients (P4, P6, and P12) also performed a separate single-word processing task. The semantic condition was a classic animacy decision: in each trial, a single word was displayed for 3 s, after a 1 s fixation period (central cross). Participants had to press a button to indicate whether the word was a living entity or not. In the phonological condition, stimuli were two- or three-syllable pronounceable pseudowords that patients had to read silently to specify the number of syllables with a response button.
Each condition was presented in blocks of 40 trials each in the following order: phonological, visual, semantic, visual, phonological, and semantic.
Stimuli were shown in white on a black background computer screen, located 70 cm in front of the participant. The experiment was performed using Presentation Package (version 0.70; Neurobehavioral Systems). Visual angle between peripheral left and right fixation crosses was 14° (−7 to 7°). Precise visual extent of sentences varied with sentence length, between 12 and 13°.
Data analysis.
Intracranial EEG data were analyzed with respect to the three experimental conditions involving free saccadic eye movements. Saccades onset and offset were identified from EOG data segments recorded during sentence reading (semantic) or during left-to-right gaze shifts across letter strings (phonological and visual). Identification was semiautomatic: a custom MATLAB (The Mathworks) script provided first-pass automatic detection of saccade onsets and offsets. The script used a moving window of 100 ms: in every window, EOG data were normalized (Z-score) relative to the mean and SD of the EOG signal measured in the first half of that window (the first 50 ms). Fixations (saccade offsets) were defined at samples with a local maximum and an absolute value >5. Saccade onset was defined as the first sample of the EOG slope leading to fixation. All saccades were then inspected manually to eliminate false-positives of the algorithm. In addition, careful visual inspection of the saccade-related activity was performed to exclude recording sites with artifactual gamma activity caused by extraocular eye muscle movements. We have previously shown how reading saccades can produce such artifacts, even in iEEG (Jerbi et al., 2009a).
Intracranial EEG data were analyzed in the time-frequency domain in the time interval from −1000 to 5000 ms, locked to array onset. For each epoch, bipolar derivations computed between adjacent electrode contacts were analyzed in the time-frequency domain. Continuous SEEG signals were first bandpass filtered in multiple successive 10-Hz-wide frequency bands (e.g., 810 bands from 50–70 to 130–150 Hz). Next, for each bandpass-filtered signal, we computed the envelope using standard Hilbert transform. The obtained envelope has a time resolution of 64 Hz (time bins every 15,625 ms). Again for each band, this envelope signal (i.e., time-varying amplitude) was divided by its mean across the entire recording session and multiplied by 100. This yields instantaneous envelope values expressed in percentage (%) of the mean. Finally, the envelope signals computed for each consecutive frequency bands (e.g., 10 bands of 10 Hz intervals between 50 and 150 Hz) were averaged together, to provide one single time series (the high gamma-band envelope). By construction, the mean value of that time series across the recording session is equal to 100.
All statistical evaluations were done on band-limited envelopes (i.e., amplitude profiles in time). A first assessment of neural response was obtained through the comparison of poststimulus activity to its average baseline power level (−500 to −100 ms) with a Wilcoxon signed-rank test for matched pairs, with a Bonferroni correction for multiple comparisons for number of time samples and electrodes. We applied this test separately for each condition across all electrodes and all time points between 0 and 5000 ms poststimulus for each patient individually.
Comparison between tasks was done between gamma-band envelopes via a Kruskal–Wallis nonparametric test, thus avoiding any assumption about the data distribution (Kruskal and Wallis, 1952). Specific effects were further studied by means of a post hoc Tukey–Kramer test, with a Bonferroni correction for multiple comparisons (samples by electrodes).
We also tested whether gamma-band activity was modulated by the timing of fixations. Since each fixation brings novel information into the reading network, one might expect that part of that network would react to each saccade with a systematic gamma-band energy increase, time-locked to fixation. For that purpose, data were divided into 1 s epochs centered on each fixation. We then performed a Kruskal–Wallis test comparing gamma-band amplitude across eight non-overlapping windows of 50 ms duration covering a 0:400 ms interval (relative to fixation). The test was corrected for multiple comparisons (number of channels by number of conditions). Significant p values indicate an effect of window latency on the gamma amplitude within the 0:400 ms interval (i.e., an effect of fixation on the gamma amplitude over that short timescale).
Amplitude correlations.
Based on the average reaction times measured in the three conditions, we chose to compute correlation coefficient in a 3 s window starting at the stimulus onset, to restrict the analysis to the actual reading or visual processes.
In each condition, we measured for each trial the correlation coefficient between the gamma envelopes recorded in pairs of recording sites. This distribution of correlation coefficients was then compared through a Wilcoxon nonparametric test with the distribution of coefficients obtained when shuffling trials from one of the two sites (e.g., computing the correlation between trial i from site 1 and trial j from site 2, i ≠ j). This surrogate distribution included all possible shuffling (i.e., for each individual trial of the first electrode, the correlation between that trial and all other trials from the second electrode). For each patient, the threshold of significance was set to 0.05 divided by the total number of channel pairs tested in this patient (Bonferroni's correction for multiple comparisons). Channel pairs with a significant correlation coefficient in any of the three conditions were then passed through a Kruskal-Wallis procedure comparing the coefficients measured in the three conditions, to test for task sensitivity with a post hoc Tukey–Kramer procedure.
Prediction value estimate.
The prediction value estimate is computed as follows: considering a sample X that does not belong to group P1 if it is >95% of P1 (risk 5%), N2 is the number of elements of P2 that do not belong to P1. This percentage corresponds to the following: 100 − 100 * (N2/P2). If all elements of P2 pass the test, then the score should be 0 (dissociation index). All reported prediction values estimates are thus associated to a p value of p < 0.05.
Test for volume conduction effects.
To evaluate the contribution of proximity on measured correlation values, we evaluated the correlation between sites as a function of the distance between them. Regular spacing between consecutive probes on SEEG electrodes provides a convenient way to measure the fall-off of correlation with distance between sites. We selected eight electrodes sampling frontal, temporal, and parietal lobes in six patients, and estimated the correlation for each pair within each electrode. We tested a total of 675 pairs, separated by a intersite distance ranging from 3.5 to 17.5 mm; the percentage of significant correlation coefficient (comparison with trial-shuffled surrogates, p < 0.05, uncorrected for multiple comparisons) decreased as a function of distance to fall below chance level at 3.5 mm: 98% (180 of 183); 7 mm, 62% (99 of 159); 10.5 mm, 51% (69 of 135); 14 mm, 21% (24 of 111); 17.5 mm, 4% (3 of 187). We concluded that high correlation values between sites separated by >2 cm was unlikely to be attributed to volume conduction.
Results
Task description and behavioral results
The three conditions of the experiment are summarized in Figure 1, A and B: (1) reading a meaningful sentence [semantic condition (SEM)], (2) integrating individual letters into a word or pseudoword while emphasizing mental pronunciation [phonological condition (PHO)], and (3) searching for digits embedded in groups of consonant strings [visuo-orthographic condition (VIS)].
This design was adapted from a classic single-word presentation protocol (Mainy et al., 2008) and revised to mimic oculomotor behavior characteristic of sentence reading. The three conditions are also reminiscent of three major stages of reading acquisition: (1) seeing words as meaningless groups of letters (VIS), (2) deciphering the word letter by letter or syllable by syllable (PHO), and (3) as an expert reader (SEM).
Visual inspection of the stimuli lasted between 4 and 5 s on average, with no significant difference between conditions (VIS, mean, 5066 ± 1971 ms; PHO, 4350 ± 1813 ms; SEM, 3832 ± 1605 ms; Kruskal–Wallis, p > 0.05). To rule out that differences in gamma-band activity across conditions could be due to different oculomotor patterns, we performed a simple quantification of saccadic behavior in all conditions: there were four to five saccades and fixations per trial for a total number of saccades and fixations close to 400, with no significant difference between conditions (VIS, 394 ± 145; PHO, 369 ± 120; SEM, 366 ± 82; Kruskal–Wallis, p > 0.05). There were 80 trials per condition. The mean duration of a fixation was ∼400 ms (VIS: 456 ± 135 ms; median, 388; PHO: 389 ± 83 ms; median, 373; SEM: 358 ± 83 ms; median, 345), but the saccade latency distribution (Fig. 1C) revealed a clear asymmetric shape, with an accumulation of values between 200 and 400 ms (VIS, 56% of all fixations durations; PHO, 62%; SEM, 67%). Fixations were slightly shorter in the SEM than in the VIS condition (Kruskal–Wallis test followed by post hoc Tukey–Kramer, p = 0.043). Overall, we found that oculomotor behavior was, if not identical, at least comparable in the three conditions.
Average behavioral accuracy was 96.35% (±0.66 SEM) correct responses in the semantic condition, 96.56% (±0.51) correct responses in the phonological condition and 95.52% (±0.52) correct responses in the visual condition. A one-way ANOVA showed no significant difference across conditions (F = 0.94; p = 0.4).
High-frequency energy modulations during reading
Cortical responses were defined from task-related energy modulations of iEEG signals between 50 and 150 Hz, which we refer to as “gamma-band responses” (GBRs). This measure has become increasingly popular in iEEG studies because of its high stimulus and task sensitivity (Jacobs and Kahana, 2009; Vidal et al., 2010) and because of its coupling with the BOLD signal (Logothetis et al., 2001; Kayser et al., 2004; Mukamel et al., 2005; Niessing et al., 2005; Lachaux et al., 2007; Ojemann et al., 2010) and population-level neural firing rate (Manning et al., 2009; Whittingstall and Logothetis, 2009; Ray and Maunsell, 2011). Theta-band activity was not analyzed in this study because its frequency range overlapped with the dominant rhythm of reading saccades, so endogenous theta oscillations could not be isolated from neural activity locked to eye movements. GBRs were detected in each participant and for each recording site, by comparing the energy in two poststimulus windows [(0:1000 ms) and (1000:2000 ms) relative to stimulus onset] with a neutral prestimulus baseline during screen fixation (−500:−100 ms) (Wilcoxon's test). After Bonferroni's correction for multiple comparisons, the analysis revealed significant positive responses in 9.9% (129 of 1302) and significant negative responses in 2.9% of the recording sites (38 of 1302) (p < 0.05; corrected for 2604 tests).
The sparseness of the effects was explained by the anatomical selectivity of the reading network. Responses were strong and consistent across participants, clustered in a small number of cortical regions that matched the different nodes of the reading network: left middle temporal gyrus (MTG), left supramarginalis gyrus (SMG), left inferior frontal cortex (IFC), and ventral occipitotemporal cortex (VOTC) (Figs. 2–4). Based on differences in task sensitivity and timing, we further distinguished in the IFC two subregions that reflected preference for either SEM or PHO conditions (Fig. 3). We termed these regions IFC SEM and IFC PHO. Similarly, the VOTC was subdivided into three ROIs, interior (INT), intermediate (MID), and lateral (EXT) (see the next section and Fig. 4). Two other regions, the dorsal lateral prefrontal cortex (DLPFC), and the supplementary motor area (SMA), showed undifferentiated activations in all conditions (data not shown). Negative responses (e.g., energy decreases relative to baseline) were also found in the temporo-parietal junction (TPJ) and the ventral-lateral prefrontal cortex (VLPFC) (data not shown). As previously shown by our group, they coincide with task-unspecific deactivations of the default-mode network (Lachaux et al., 2008; Mainy et al., 2008; Jerbi et al., 2010).
Figure 2.
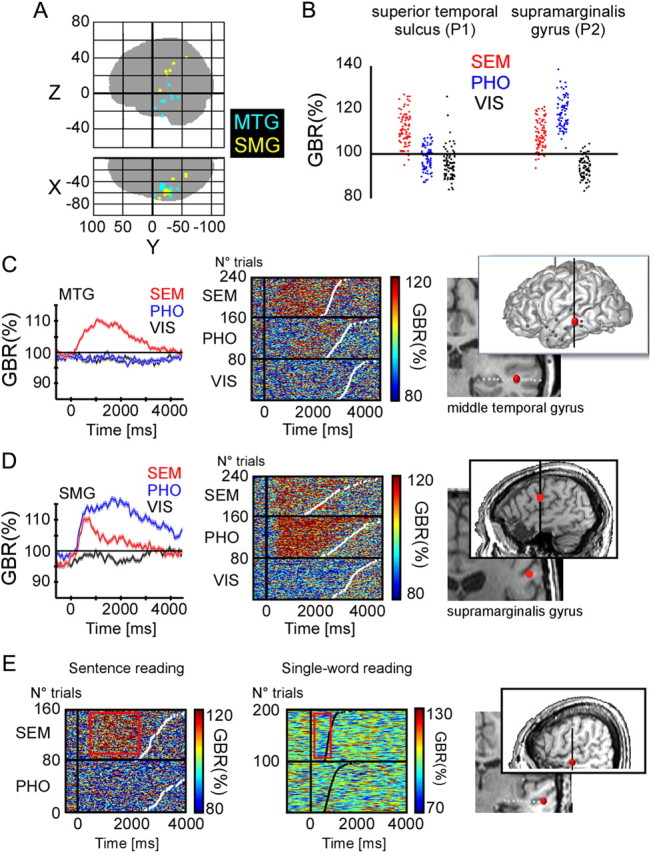
Recordings from MTG and SMG. A, Glass brain illustrating the recording sites for all patients concerned with the MTG and SMG clusters. B, Examples of single-trial average gamma-band amplitudes in (0:2000 ms) time window after stimulus onset, from two different recording sites. The amplitude value of each trial is plotted as a dot, in different color for each one of the three experimental conditions. C, Left panel, Group average of gamma-band amplitude (40–150 Hz) for the SEM, PHO, and VIS conditions, for the MTG recording sites across patients. Shaded regions indicate ±1SEM. Middle, Single-trial gamma-band amplitude responses in one patient, at an MTG recording site for patient 1. Right, Anatomical location of the recording site shown in the middle panel (Talairach coordinates: −53 −33 −4.4). D, Left panel, Group average of gamma-band amplitude (40–150 Hz) for the SEM, PHO, and VIS conditions, for the SMG recording sites across patients. Shaded regions indicate ±1SEM. Middle, Single-trial gamma-band amplitude responses at an SMG recording site for patient 2. Right, Anatomical location of the recording site shown in the middle panel (Talairach coordinates: −60 −22 25). E, Comparison of gamma-band responses from the same electrode in two different reading tasks in patient 4. Left panel, Single-trial gamma-band plot from the current sentence reading experiment showing dominant responses in the SEM condition. Middle, Single-trial gamma-band plot in a separate single-word reading task. There is no specific gamma-band response compared with baseline for meaningful words. Right, The Talairach coordinates from this recording site are as follows: (−53 −20 −8.4).
Figure 3.
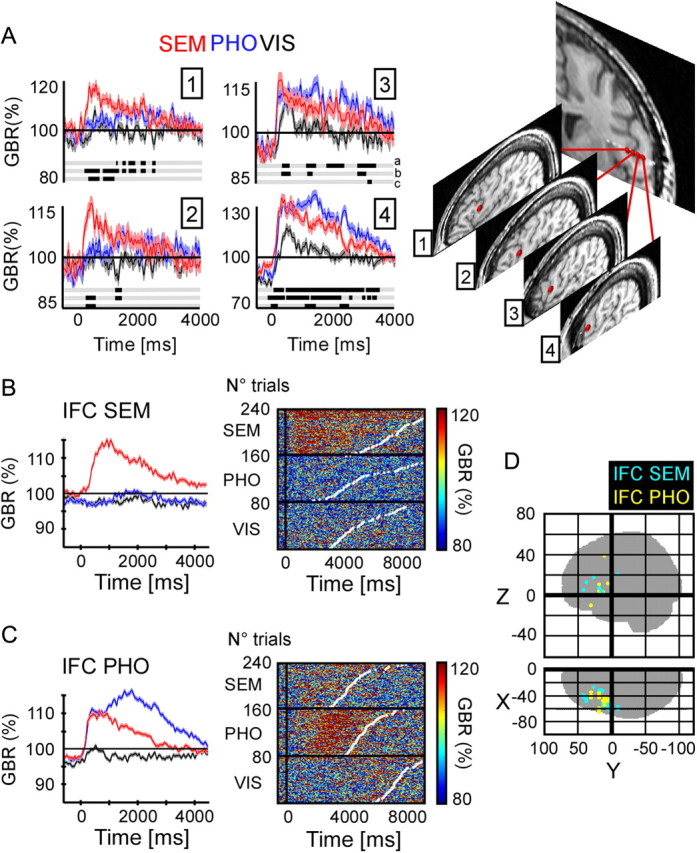
Recordings from IFC clusters specific to semantic sentences (IFC SEM) and phonologic sentences (IFC PHO). A, Left panel, Average gamma-band amplitude across trials (40–150 Hz) for the SEM, PHO, and VIS conditions, for four recording sites in the prefrontal cortex of patient 4. Shaded regions indicate ±1SEM. Right, MRI located anatomical positions of the four recording sites. Talairach coordinates of recording sites from medial to lateral position on the electrode: (−44 5.7 12), (−48 5.7 12), (−52 5.7 12), (−55 5.7 12). B, Left panel, Group average of gamma-band amplitude (40–150 Hz) for the SEM, PHO, and VIS conditions for the IFC SEM cluster. The shaded regions indicate ±1SEM. Right, Single-trial gamma-band amplitude responses from the IFC SEM in patient 11. Sustained gamma-band activity is observed, mainly in the SEM condition. Single trials are ordered according to increased reaction time represented by white dots. C, Left panel, Group average of gamma-band amplitude (40–150 Hz) for the SEM, PHO, and VIS conditions for the IFC PHO cluster. The shaded regions indicate ±1SEM. Right, Single-trial gamma-band amplitude responses from the IFC PHO in patient 8. Sustained gamma-band activity is observed, mainly in the PHO condition. D, Glass brain illustrating the recording sites for all patients concerned with the IFC SEM and IFC PHO clusters.
Figure 4.

Recordings from three ventral occipito-temporal cortex clusters (VOTC INT, VOTC MID, VOTC EXT). A, Group average of gamma-band amplitude (40–150 Hz) for the SEM, PHO, and VIS conditions within the three VOTC clusters. B, Glass brain illustrating the recording sites for all patients concerned with the three VOTC clusters. C, Top panel, MRI location of three recording sites. Bottom, Single-trial gamma-band amplitude responses for the three recording sites in VOTC. Gamma-band responses in the inner recording site show a clear amplitude increase in the semantic and phonological condition compared with the visual condition. In the external sites, the phonological condition shows the strongest gamma-band response. In all plots, single trials are ordered according to increased reaction time represented by white dots. Talairach coordinates of the three recording sites from medial to lateral position on the electrode are as follows: (−29 −43 −9.8), (−33 −43 −9.8), (−51 −43 −9.8).
The VOTC was the only region showing gamma-band energy increases time-locked to fixation [P12: VOTC MID (one site) and VOTC EXT (one site); P8: VOTC MID (two sites) and VOTC EXT (one site); P5: VOTC MID (three sites); Kruskal-Wallis comparison testing for an effect of postfixation latency on gamma-band amplitude] (see Materials and Methods). A systematic energy peak was observed between 200 and 400 ms following fixation, consistent with response latencies observed after flashed visual stimuli in those regions.
Comparison of the latency of gamma-band responses after stimulus onset revealed a robust difference between posterior and anterior clusters (Wilcoxon's test of matched pairs vs baseline, FDR corrected for multiple comparisons): responses started earlier, before 200 ms, in VOTC INT and MID (patients: 1, 2, 5, 8, 11, 12) and later in the two PFC clusters, after 500 ms (patients: 1, 2, 5, 6, 7).
Components of the sentence reading network
Phonology in the supramarginal and posterior inferior frontal cortex
The SMG and posterior IFC PHO extends on both sides of the central sulcus reaching Broca's area pars opercularis in its most anterior extension (Fig. 2 for SMG and Fig. 3 for IFC PHO, respectively). Both regions have been associated with phonological processing in most brain imaging studies (Fiez and Petersen, 1998; Gabrieli et al., 1998; Price and Mechelli, 2005; Juphard et al., 2011), and our results are in agreement with those observations: GBA responses were significantly stronger in the PHO than in the VIS condition in all sites (SMG, 13 of 13; IFC PHO, 20 of 20; for all, p < 0.05). Responses in the PHO condition were also stronger than in the SEM condition in most sites (SMG, 13 of 13; IFC PHO, 14 of 20; for all, p < 0.05). These effects are visible in the ROI group average (Fig. 2C,D, left panel) but also in single-trial gamma-band amplitude profiles, organized according to reaction times (Fig. 2C,D, middle panel). Using the amplitude of the gamma-band response as a simple classification criterion, we found that in some SMG and IFC PHO sites, as illustrated in Figure 2B, the dissociation between PHO and VIS responses was complete: 2 s of recordings randomly drawn anywhere from the 30 min experiment were sufficient to determine with a 95% accuracy whether the participant was performing the PHO or the VIS task.
Semantics in the middle temporal and anterior inferior frontal cortex
A global analysis of task preference in active IFC sites confirmed a functional partition in the frontal lobe between phonological and semantic processing (Fig. 3). Overall, the SEM condition activated sites more anterior than the PHO condition; however, the anatomical dissociation between the two clusters was quite subtle and sometimes along the lateral dimension, as illustrated by Figure 3A: a clear-cut change in task sensitivity in the IFC across sites <7 mm apart. Semantic responses were in fact found well beyond Broca's area in the more dorsal lateral prefrontal cortex. In that broad frontal ROI, the majority of sites had stronger responses in the SEM than in the PHO or VIS condition (SEM > PHO, 11 of 18; SEM > VIS, 12 of 18; for all, p < 0.05), and none showed opposite effects. The dissociation between SEM and PHO was not as pronounced as between PHO and VIS in SMG and IFC SEM, but reached 74% of correct classifications (p < 0.05 for all sites). We found even stronger preferences for SEM in the middle temporal gyrus (Fig. 2C,D), in an elongated ROI connecting the temporal pole with the angular gyrus (SEM > PHO, 20 of 24; SEM > VIS, 19 of 24; with a maximum of 72% correct separation between SEM and PHO; for all, p < 0.05). Interestingly, MTG sites were active during semantic analysis of sentences, but not in response to isolated words in three patients that performed a secondary animacy decision task on single words (see Materials and Methods). In patient 4 for instance, MTG sites active in the SEM condition of the sentence reading task showed either no response, or even a slight deactivation while processing the meaning of single, isolated words. Single-trial gamma-band responses in Figure 2E show no energy increase relative to baseline in the semantic condition. This example illustrates the marked difference in neural activity during sentence-level or single-word semantic processing.
Functional heterogeneities in the ventral occipitotemporal cortex
In the VOTC, activation time profiles and task sensitivity clearly distinguished between three distinct clusters along a medial-lateral axis (Fig. 4A). The most medial and lateral ROIs responded preferentially to the PHO and SEM conditions, and were separated, in individual subjects, by an intermediate region showing little or no preference in the fusiform gyrus. On individual MRIs, the most medial ROI corresponded to the border of the lingual gyrus and the collateral sulcus, and the most lateral ROI to a region immediately lateral to the fusiform, in the inferior temporal gyrus (ITG).
Further differences in GBA time courses suggest that the lingual gyrus/collateral sulcus and the ITG do not support the same function: as seen in Figure 4A, lingual GBA responses start with a rapid and transient increases equivalent across all conditions, which are nearly absent in the ITG. The lingual gyrus and the ITG also differed in task sensitivity: lingual GBA responses were stronger in SEM than in the PHO condition during the first 1000 ms of visual inspection, when the integration of the individual letters into a word or a pseudoword (for all, p < 0.05), characteristic of the PHO condition, has not completed yet (SEM > PHO in four of eight sites, with no site showing the opposite effect). The single-trial gamma-band response profiles in Figure 4C show a clear transition from a medial temporal selectivity for the SEM and PHO conditions indifferently to a lateral superiority effect in the PHO condition only. The participant is confronted with groups of identical letters in the PHO conditions (e.g., “PPP”), and with real words in the SEM condition. The superiority of the SEM GBA response might then be interpreted as a preference for word forms in the lingual gyrus. Yet this must be reconciled with the observation that the later part of the PHO GBA response is similar to the SEM response, while visual stimuli remain markedly different. In contrast, the ITG GBA response showed a clear preference for the PHO condition, resembling the selectivity of the SMG and posterior IFC (PHO > VIS in 20 of 20 sites, PHO > SEM in 14 of 20 sites; with a 100% dissociation rate between PHO and VIS). This preference was particularly clear in some ITG sites with serious diminished GBA responses in the SEM condition (Fig. 4B).
Task-dependent correlations in the reading network
We reasoned that neural populations interacting within the reading network should exchange information as they process it, in a parallel fashion, and therefore be active at the same time. Such time coincidence can be directly measured by correlation coefficients between time courses of gamma-band responses induced by the stimulus in pairs of recording sites. Figures 5–7 show three different examples of task-specific long-range gamma-band amplitude correlations. The correlation analysis was restricted to regions responding to the task, as described before. In each ROI, we selected sites with the significant task sensitivity (SEM > VIS or PHO > VIS), and assigned them to one of the two networks, semantic or phonological or to both (according to the condition yielding the strongest response in that site). This task sensitivity is visible at the single-trial level (Fig. 5B, 6B, 7B). We found that seven patients had sites with similar task sensitivity, but distant anatomical location. We then considered in each patient pairs of sites with similar sensitivity (for a total of 28 pairs across all patients), measured the strength of the correlation between their gamma-band responses in every trial, and compared those measures in the three conditions. Significant correlation coefficients were defined relative to trial-shifted surrogate data (see Materials and Methods). We found that 64% of pairs had significantly correlated gamma-band responses (18 of 28), when considering their preferred condition. This percentage fell to 25% when considering their least preferred condition (e.g., the VIS condition for a MTG/IFC pair). This shows that correlation between regional gamma-band amplitude (50–150 Hz) changes was not systematic but dependent upon task demands. Figures 5C and 6C show three single-trial examples of gamma-band amplitude correlations. Figure 7C displays an example of anticorrelation. This was confirmed by a Kruskal–Wallis testing the effect of condition on correlation values: the test was significant for all pairs (28 of 28) with stronger correlation coefficients in the preferred condition in each case (Figs. 5D, 6D, 7D). This statistical strength of the correlations was visible at single-trial level (Fig. 8B). A resume of the gamma-band correlations connecting the previously mentioned nodes in the reading network in this study are shown in Figure 8A.
Figure 5.
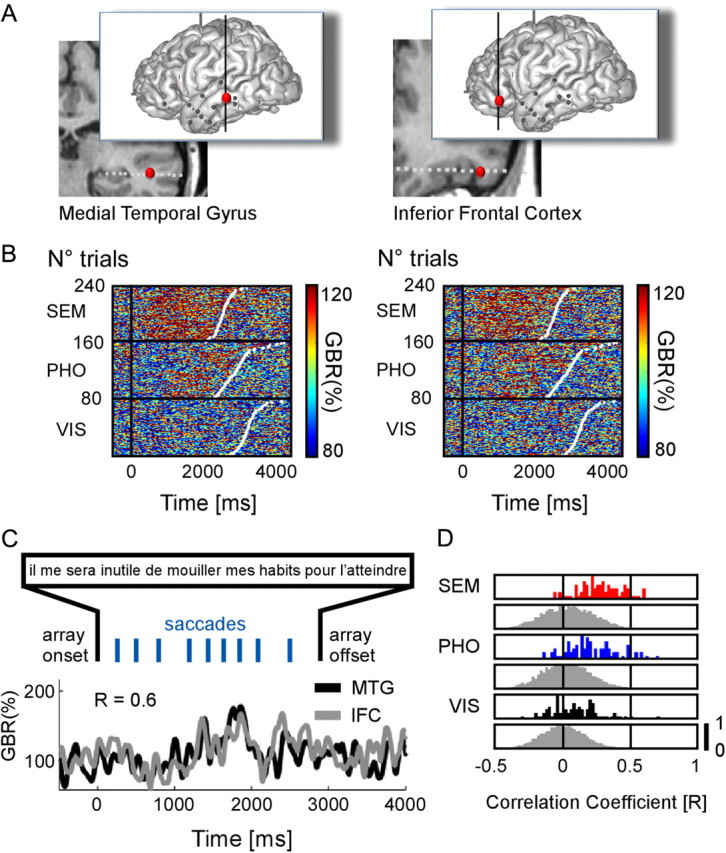
Long-range fronto-temporal gamma-band amplitude correlations during reading. A, Anatomical locations of two recordings sites, in the middle temporal gyrus (Talairach coordinates: −53 −33 −4.4) and in the inferior frontal cortex (Talairach coordinates: −43 31 −9.5) in one patient. B, Single-trial plots of each recording site are ordered according to increasing reaction times (white dots in plots). In both sites, there are more gamma-band responses in the SEM condition compared with the PHO and VIS conditions. C, Illustrative single-trial amplitude profiles from MTG and IFC elicited while reading one sentence. The correlation coefficient for this trial is r = 0.6. The sentence in French reads: “I will not have to wet my clothes to reach it.” D, The outcome of the statistics when comparing the trial-by-trial correlation coefficients to a surrogate distribution of correlation coefficients, for each condition. The y-axis represents a quantitative trial number value, normalized between 0 and 1.
Figure 6.
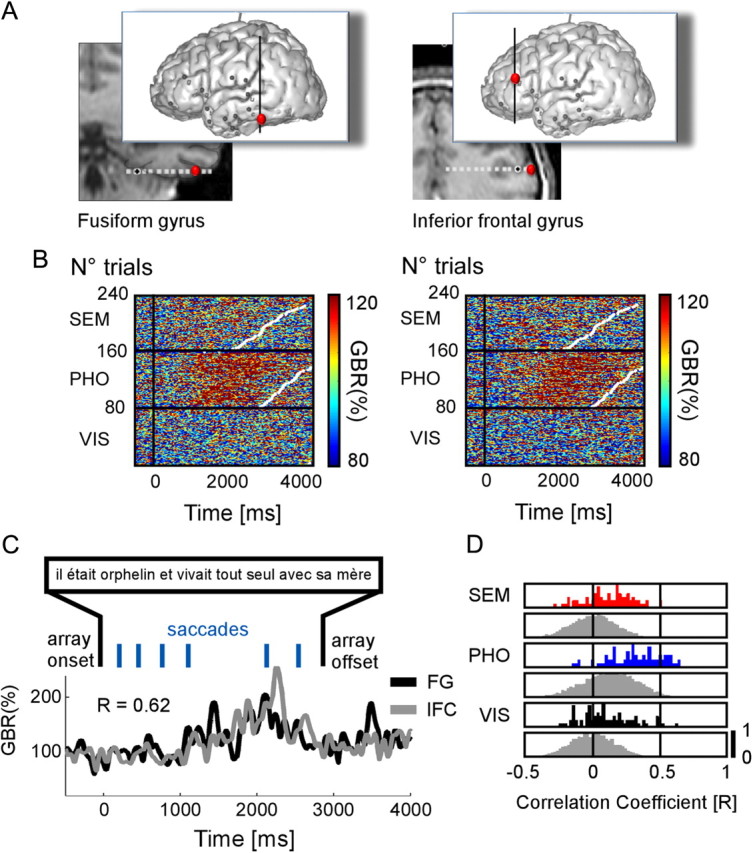
Long-range gamma-band amplitude correlations during reading between fusiform gyrus and inferior frontal cortex. A, Anatomical locations of two recordings sites, in the fusiform gyrus (Talairach coordinates: −50 −45 −12) and in the inferior frontal cortex (Talairach coordinates: −41 38 13) in one patient. B, Single-trial plots of each recording site are ordered according to increasing reaction times (white dots in plots). In both sites, there are more gamma-band responses in the SEM condition compared with the PHO and VIS conditions. C, Illustrative single-trial amplitude profiles from FG and IFC elicited while reading one sentence. The correlation coefficient for this trial is r = 0.62. The sentence reads: “He was an orphan and lived alone with his mother.” D, The outcome of the statistics when comparing the trial-by-trial correlation coefficients to a surrogate distribution of correlation coefficients, for each condition. The y-axis represents a quantitative trial number value, normalized between 0 and 1.
Figure 7.
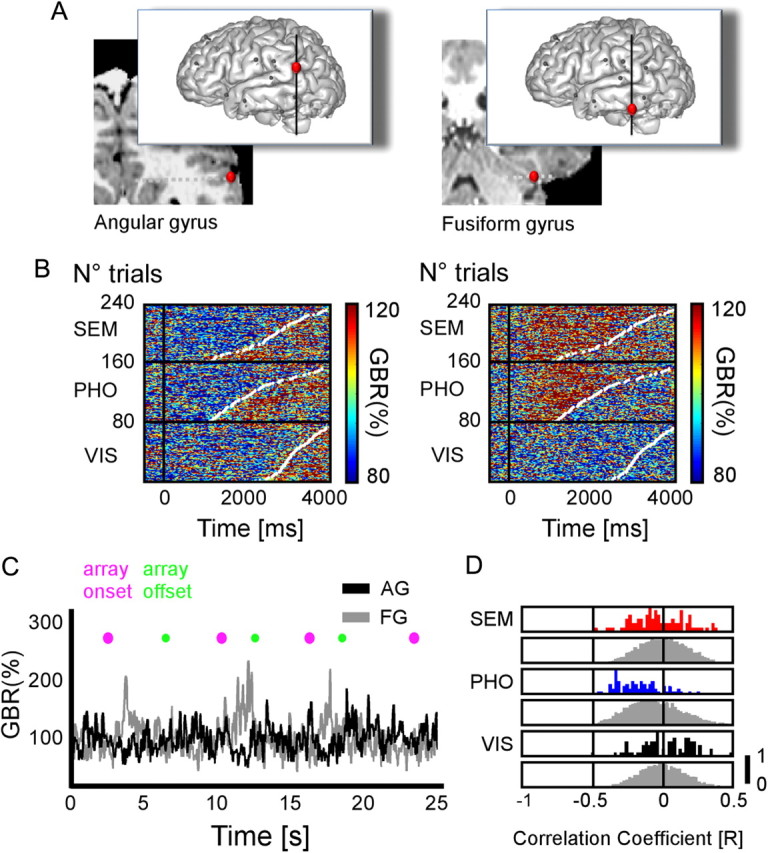
Illustrative gamma-band amplitude anticorrelation during reading between angular gyrus and fusiform gyrus. A, Anatomical locations of two recordings sites, in the angular gyrus (Talairach coordinates: −53 −39 31) and in the fusiform gyrus (Talairach coordinates: −33 −51 −17) in one patient. B, Single-trial plots of each recording site are ordered according to increasing reaction times (white dots in plots). Gamma-band responses in the angular gyrus systematically decrease for SEM and PHO conditions compared with baseline. In the fusiform gyrus, gamma-band responses increase in both SEM and PHO conditions compared with baseline. C, Illustrative example of gamma-band amplitude behavior in consecutive trials at both recording sites during sentence reading. D, The outcome of the statistics when comparing the trial-by-trial correlation coefficients to a surrogate distribution of correlation coefficients, for each condition. The y-axis represents a quantitative trial number value, normalized between 0 and 1. Single-trial correlation coefficients for gamma-band responses tend to be negative between recorded angular gyrus and fusiform gyrus, in both SEM and PHO conditions.
Figure 8.

Fragmentation of the reading network. A, Red (blue, respectively) dots indicate sites with the strongest response in the semantic (phonological, respectively) condition. The green dots indicate sites with equally strong response in both conditions. The figure only shows sites selected for the correlation analysis (see Results). Positions are displayed in the y,z MNI space (3-D model of the MNI single-subject brain; microGL; www.mricro.com). In the top panel, the white lines connect sites with significant correlation in either condition. In the middle panel, the red lines connect sites with a stronger correlation in SEM than in PHO or VIS (Kruskal–Wallis, p < 0.05). In the bottom panel, the blue lines connect sites with a stronger correlation in condition PHO than in conditions SEM or VIS. B, Individual plots show examples of single-trial gamma amplitude. These signals, from two distant recording sites, correlated during condition PHO and during condition SEM (sites indicated by square boxes). Left panel, Two recordings sites (patient 1) are fusiform gyrus (blue) and inferior frontal gyrus (red). Right panel, The two recording sites (patient 8) are in the middle temporal gyrus (blue) and in the inferior frontal cortex (red).
To rule out any spurious volume conduction effect, we conducted a separate analysis measuring correlation coefficients between random sites as a function of the distance between them (see Materials and Methods). We found that the probability of two random sites to be significantly correlated fell to chance level (p < 0.05 uncorrected for multiple comparisons) at distances >20 mm (all 28 pairs selected in the previous analysis were >20 mm apart). One of the strongest correlation values on the real data (r = 0.62) was found between a prefrontal site and a temporal site separated by >8 centimeters (Fig. 7A–D) [Talairach coordinates: IFC (−41 38 13) and MTG (−50 −45 −12)]. One remaining concern was that correlations could be due to a common driving of neural activity by reading saccades. Since our significance criterion was based on a comparison with trial-shifted surrogates, our analysis was vulnerable to such effect, because different trials are constrained by different oculomotor dynamics and correlation between nonmatched trials might be low for this reason. However, the typical fixation duration ranged between 200 and 300 ms (see saccade timing distributions; Fig. 1B). If saccades had been driving neural activity in the reading system in a correlated fashion, high correlation values would be due to such rhythmic component. This was not the case. We performed the same correlation analysis as above, after removing frequency components >3 Hz from gamma-amplitude modulations. All significant results remained significant, and all nonsignificant results remained nonsignificant.
To determine whether amplitude correlations were due to coherent amplitude fluctuations in a specific frequency range, we performed a coherence analysis in each single trial between gamma-band amplitude time series (between 0 and 3000 ms following stimulus onset). For every pair of recording sites detected by the amplitude correlation analysis, we compared the distribution of coherence values in two frequency bands (alpha, 8–12 Hz; beta, 16–24 Hz) with trial-shuffled surrogates, and found no significant values (p > 0.1, uncorrected for multiple comparisons). We conclude that amplitude correlations occur between nonrhythmic modulations of gamma-band activity.
Overall, our study shows that energy modulations in the gamma band are correlated in more than one-half of the pairs (64%) belonging to the same functional network. This correlation is not due to volume conduction or saccadic eye movement. It is also task dependent: two subregions of the same network are predominantly correlated when this network is actively processing information.
Discussion
We used direct, high-resolution, neural recordings to reveal two novel properties of the reading network: (1) it is characterized by systematic increases in neural activity as soon as an individual reads a sentence, in a broad (40–150 Hz) gamma frequency range; (2) neural responses induced by the reading process are correlated within the network, across long distances and in a task-dependent fashion. We will now discuss those findings, starting with long-range interactions.
A previous study (Nir et al., 2008) had shown that spontaneous gamma-band amplitude fluctuations are correlated between homologous sensory (auditory) cortices during rest and sleep. The novelty of our findings is that such amplitude correlations occur also during high-level cognition and are strongly task specific. Our results complement a recent meta-analysis of the language networks (Price, 2010) pointing out the current lack of knowledge about the long-distance cortical interactions supporting language processing. Correlated metabolic demands had been reported within the reading network since the mid-1990s (Bullmore et al., 1996), but our study provides novel insights regarding how neural populations interact during reading. We demonstrate correlated fluctuations of neural activity between the inferior frontal gyrus (IFG) and the MTG during semantic analysis and between the DLPFC, IFG, SMG, and VOTC during phonological analysis. Interestingly, the latter observation fits with a recent report that cortical potentials evoked by intracranial electrical stimulations show a direct anatomical connection between basal temporal and perisylvian cortex (Koubeissi et al., 2011).
We found some sites in the DLPFC and the SMA with strong and sustained energy increase throughout the task, with no difference in timing nor amplitude between experimental conditions. However, they should not be mistaken for sites preferentially active in the semantic condition in the LPFC. Numerous fMRI and animal electrophysiology studies have shown that subregions of the DLPFC support working memory and task-set maintenance, and are generally active during most types of goal-driven behavior (Grosbras et al., 1999; Sakai, 2008), might support goal-driven behavior involving eye movements, as required by each of the three experimental conditions.
Long-distance amplitude correlations have received relatively little interest compared with long-distance phase synchronization (Salmelin and Kujala, 2006; Kujala et al., 2007), partly because synchrony is believed to be the main mechanism for neural integration across distant brain regions (Varela et al., 2001). But phase coupling cannot be easily defined for broadband signals ranging between 40 and 150 Hz. Our approach rather draws from earlier findings that trial-to-trial amplitude fluctuations of visual gamma-band responses are correlated between temporal and parietal regions (Lachaux et al., 2005) and from previous demonstrations that amplitude and phase-based neural connectivity can reflect different underlying mechanisms. Gamma-amplitude modulations have been associated with the emergence of local communication processes between nearby neurons (Singer, 1999), and with increased local neural activity (increased spike count) (Miller, 2010). By extension, gamma-amplitude correlations would then be a natural reflection of the parallel organization of the brain: neural populations would interact maximally when they actively process information. The neural mechanism we propose here might co-occur with a phase synchronization phenomenon in narrow frequency bands (Salmelin and Kujala, 2006; Kujala et al., 2007), which has been associated with other mechanisms of neural communication (Fries, 2005, 2009). Also, because gamma-band activity has been shown to correlate with BOLD signal (Logothetis et al., 2001; Mukamel et al., 2005; Niessing et al., 2005), gamma-amplitude correlations could be a neural correlate of the BOLD co variations revealed by fMRI functional connectivity measures.
Neuroimaging studies often report group statistics that exclude intersubject regional and functional variability. These specificities can only be revealed by comparing adjacent neural responses in individual subjects across different task conditions. iEEG has often proven to be a powerful approach for this purpose (Sahin et al., 2009) and has provided here these advantages when analyzing the left ventral occipitotemporal cortex and the middle temporal gyrus.
The left VOTC is a major node of the reading network, with preferential responses to word form visual stimuli in a region lateral to the midportion of the fusiform gyrus, often called “visual word form area” (VWFA) (Cohen et al., 2000, 2002). Our results are consistent with such specialization, but interindividual response variations led us to dissect this broad area into three regions of interest containing recording sites along the middle-lateral axis. The latter occurs repeatedly as a consequence of the depth-electrode implantation procedure.
We found reading-specific responses in the middle and lateral VOTC on each side of an intermediate region showing little or no preference for word forms. Detailed anatomical analysis in the two participants with consecutive sites on a single electrode sampling all three regions revealed a clear-cut frontier in the collateral sulcus, separating middle responses in the lingual gyrus and nonspecific responses in the fusiform gyrus. Therefore, lingual sites responded most vigorously in the two conditions that required reading processes, phonological and semantic. This is in disagreement with earlier findings suggesting that the lingual gyrus has no specificity for word forms, and might even respond stronger to false-font stimuli (Vinckier et al., 2007). One possible explanation is that BOLD signals might be biased by the strong initial transient peak of lingual responses, 200 ms after stimulus onset, which is similar for word forms and random consonant strings. This common transient might underlie a global identification process of the visual stimulus, to determine whether it contains a word form. iEEG reveals that this initial step is followed by a second period of neural activity specific to word forms. An intriguing result, however, is that the later part of the neural response is equally sustained in both phonological and semantic conditions. Yet stimuli in the phonological condition are for the visual system meaningless letter groups (e.g., “NNN”): the word form emerges only when individual letters are progressively assembled in visual short-term memory (“P” + “H” + “O” + “N” + “E” = “PHONE”). This suggests that the lingual gyrus reacts to word forms, both as actual visual inputs (i.e., a fully written word) and as purely mental constructs (i.e., at the final stage of the assembly process required by the phonological condition). Lingual GBA activation in the phonological condition might then correspond to a searching process within an internal lexicon of word forms.
The most lateral VOTC GBA responses were slightly delayed compared with responses in the lingual gyrus. They also occurred only in the phonological and semantic conditions, and were stronger in the former, with some sites showing even no response to words in the semantic condition. This finding was unexpected, considering that this region of interest lies within the limits of the visual word form area (Cohen et al., 2000, 2002; Mainy et al., 2008; Vidal et al., 2010). The VWFA is believed to support word form recognition, while lateral GBA responses in our study are more consistent with either phonological or memory processes. The phonological condition includes a strong visual working memory component, since individual letters must be assembled mentally into a word. This suggests that the lateral VOTC might serve as a visuospatial sketchpad for that purpose, as proposed by Baddeley (2010). This is consistent with recent findings from our group that gamma-band activity increases in this region with memory load during a visuospatial working memory task (Hamamé et al., 2012). The additional observation that this region is strongly correlated with the DLPFC, suggests a large-scale fronto-temporal network supporting visual working memory (Pasternak and Greenlee, 2005). These findings suggest that the VOTC contains three subregions involved in reading, in the lingual gyrus and in the lateral VOTC, in addition to the VWFA. The lingual gyrus could subserve lexical retrieval, while the lateral VOTC could support visual working memory processes.
All gamma-band activity responses reported in this study fit nicely with preexisting neuroimaging literature on language processing during reading, and with previous iEEG studies on single-word identification, including the clear dissociation between semantics and phonology in the inferior frontal lobe (Sahin et al., 2009). Recruitment of the IFG and SMG during phonological processing is also largely established, for both grapheme-to-phoneme conversion and auditory working memory (Hickok and Poeppel, 2007; Mainy et al., 2008; Hickok, 2009; Price, 2010; Juphard et al., 2011). Here, we extend these considerations by reporting as a network of correlated neural activations. It was less expected, however, that a region comprising the middle temporal gyrus and the superior temporal sulcus would be active during sentence processing, but not in response to isolated words—a notable discrepancy with our previous single-word study (Mainy et al., 2008). During sentence comprehension, active sites in the MTG defined a broad cortical territory, reaching the canonical Wernicke's area in its most posterior extension. Within this region, our simple experimental design did not reveal any functional heterogeneity, but rather, a highly integrated network, with strong site-to-site gamma-amplitude correlations (r = 0.62) in the semantic condition. If the MTG comprises subcomponents, they must exchange information rapidly during sentence comprehension. The exact functional role of the MTG is thus not yet completely clear. The MTG is deactivated in many tasks requiring attentive processing of external stimuli, such as visual search tasks similar to the visual condition in our task (Ossandon et al., 2011). For this reason, the MTG has been often associated with the default-mode network (Ossandon et al., 2011), in relation with endogenous, mind-wandering processes such as covert, imaginary narration involved in “story-building.” This hypothesis is consistent with previous reports (Price, 2010) that this region is specifically activated during sentence comprehension, when consecutive words are integrated into a coherent story and not for single, isolated words. The MTG cluster included the superior temporal sulcus, which is associated with social cognition, and dysfunctional in autism (Zilbovicius et al., 2006). Our interpretation is that MTG plays a central role in elaborating little scenarios, on a visual basis, that naturally take place when understanding concrete sentences describing people's actions (Redcay, 2008).
Footnotes
This work was supported by the Agence Nationale de la Recherche, CONTINT “OpenVibe2”, ANR blanc “MLA” (J.-P.L.), and Fondation Fyssen (C.H.). We thank all patients for their participation; the staff of the Grenoble Neurological Hospital epilepsy unit; and Dominique Hoffmann, Patricia Boschetti, Carole Chatelard, and Véronique Dorlin for their support.
The authors declare no competing financial interests.
References
- Baddeley A. Working memory. Curr Biol. 2010;20:R136–R140. doi: 10.1016/j.cub.2009.12.014. [DOI] [PubMed] [Google Scholar]
- Barca L, Cornelissen P, Simpson M, Urooj U, Woods W, Ellis AW. The neural basis of the right visual field advantage in reading: an MEG analysis using virtual electrodes. Brain Lang. 2011;118:53–71. doi: 10.1016/j.bandl.2010.09.003. [DOI] [PubMed] [Google Scholar]
- Binder JR, McKiernan KA, Parsons ME, Westbury CF, Possing ET, Kaufman JN, Buchanan L. Neural correlates of lexical access during visual word recognition. J Cogn Neurosci. 2003;15:372–393. doi: 10.1162/089892903321593108. [DOI] [PubMed] [Google Scholar]
- Bokde AL, Tagamets MA, Friedman RB, Horwitz B. Functional interactions of the inferior frontal cortex during the processing of words and word-like stimuli. Neuron. 2001;30:609–617. doi: 10.1016/s0896-6273(01)00288-4. [DOI] [PubMed] [Google Scholar]
- Bullmore ET, Rabe-Hesketh S, Morris RG, Williams SC, Gregory L, Gray JA, Brammer MJ. Functional magnetic resonance image analysis of a large-scale neurocognitive network. Neuroimage. 1996;4:16–33. doi: 10.1006/nimg.1996.0026. [DOI] [PubMed] [Google Scholar]
- Cohen L, Dehaene S, Naccache L, Lehéricy S, Dehaene-Lambertz G, Hénaff MA, Michel F. The visual word form area: spatial and temporal characterization of an initial stage of reading in normal subjects and posterior split-brain patients. Brain. 2000;123:291–307. doi: 10.1093/brain/123.2.291. [DOI] [PubMed] [Google Scholar]
- Cohen L, Lehéricy S, Chochon F, Lemer C, Rivaud S, Dehaene S. Language-specific tuning of visual cortex? Functional properties of the visual word form area. Brain. 2002;125:1054–1069. doi: 10.1093/brain/awf094. [DOI] [PubMed] [Google Scholar]
- Dehaene S, Cohen L. The unique role of the visual word form area in reading. Trends Cogn Sci. 2011;15:254–262. doi: 10.1016/j.tics.2011.04.003. [DOI] [PubMed] [Google Scholar]
- Démonet JF, Thierry G, Cardebat D. Renewal of the neurophysiology of language: functional neuroimaging. Physiol Rev. 2005;85:49–95. doi: 10.1152/physrev.00049.2003. [DOI] [PubMed] [Google Scholar]
- Fiez JA, Petersen SE. Neuroimaging studies of word reading. Proc Natl Acad Sci U S A. 1998;95:914–921. doi: 10.1073/pnas.95.3.914. [DOI] [PMC free article] [PubMed] [Google Scholar]
- Fries P. A mechanism for cognitive dynamics: neuronal communication through neuronal coherence. Trends Cogn Sci. 2005;9:474–480. doi: 10.1016/j.tics.2005.08.011. [DOI] [PubMed] [Google Scholar]
- Fries P. Neuronal gamma-band synchronization as a fundamental process in cortical computation. Annu Rev Neurosci. 2009;32:209–224. doi: 10.1146/annurev.neuro.051508.135603. [DOI] [PubMed] [Google Scholar]
- Gabrieli JD, Poldrack RA, Desmond JE. The role of left prefrontal cortex in language and memory. Proc Natl Acad Sci U S A. 1998;95:906–913. doi: 10.1073/pnas.95.3.906. [DOI] [PMC free article] [PubMed] [Google Scholar]
- Grosbras MH, Lobel E, Van de Moortele PF, LeBihan D, Berthoz A. An anatomical landmark for the supplementary eye fields in human revealed with functional magnetic resonance imaging. Cereb Cortex. 1999;9:705–711. doi: 10.1093/cercor/9.7.705. [DOI] [PubMed] [Google Scholar]
- Hald LA, Bastiaansen MC, Hagoort P. EEG theta and gamma responses to semantic violations in online sentence processing. Brain Lang. 2006;96:90–105. doi: 10.1016/j.bandl.2005.06.007. [DOI] [PubMed] [Google Scholar]
- Hamamé CM, Vidal JR, Ossandón T, Jerbi K, Dalal SS, Minotti L, Bertrand O, Kahane P, Lachaux JP. Reading the mind's eye: online detection of visuo-spatial working memory and visual imagery in the inferior temporal lobe. Neuroimage. 2012;59:872–879. doi: 10.1016/j.neuroimage.2011.07.087. [DOI] [PubMed] [Google Scholar]
- Hickok G. The functional neuroanatomy of language. Phys Life Rev. 2009;6:121–143. doi: 10.1016/j.plrev.2009.06.001. [DOI] [PMC free article] [PubMed] [Google Scholar]
- Hickok G, Poeppel D. The cortical organization of speech processing. Nat Rev Neurosci. 2007;8:393–402. doi: 10.1038/nrn2113. [DOI] [PubMed] [Google Scholar]
- Homae F, Yahata N, Sakai KL. Selective enhancement of functional connectivity in the left prefrontal cortex during sentence processing. Neuroimage. 2003;20:578–586. doi: 10.1016/s1053-8119(03)00272-6. [DOI] [PubMed] [Google Scholar]
- Jacobs J, Kahana MJ. Neural representations of individual stimuli in humans revealed by gamma-band electrocorticographic activity. J Neurosci. 2009;29:10203–10214. doi: 10.1523/JNEUROSCI.2187-09.2009. [DOI] [PMC free article] [PubMed] [Google Scholar]
- Jerbi K, Freyermuth S, Dalal S, Kahane P, Bertrand O, Berthoz A, Lachaux JP. Saccade related gamma-band activity in intracerebral EEG: dissociating neural from ocular muscle activity. Brain Topogr. 2009a;22:18–23. doi: 10.1007/s10548-009-0078-5. [DOI] [PubMed] [Google Scholar]
- Jerbi K, Ossandón T, Hamamé CM, Senova S, Dalal SS, Jung J, Minotti L, Bertrand O, Berthoz A, Kahane P, Lachaux JP. Task-related gamma-band dynamics from an intracerebral perspective: review and implications for surface EEG and MEG. Hum Brain Mapp. 2009b;30:1758–1771. doi: 10.1002/hbm.20750. [DOI] [PMC free article] [PubMed] [Google Scholar]
- Jerbi K, Vidal JR, Ossandon T, Dalal SS, Jung J, Hoffmann D, Minotti L, Bertrand O, Kahane P, Lachaux JP. Exploring the electrophysiological correlates of the default-mode network with intracerebral EEG. Front Syst Neurosci. 2010;4:27. doi: 10.3389/fnsys.2010.00027. [DOI] [PMC free article] [PubMed] [Google Scholar]
- Jobard G, Crivello F, Tzourio-Mazoyer N. Evaluation of the dual route theory of reading: a metanalysis of 35 neuroimaging studies. Neuroimage. 2003;20:693–712. doi: 10.1016/S1053-8119(03)00343-4. [DOI] [PubMed] [Google Scholar]
- Juphard A, Vidal JR, Perrone-Bertolotti M, Minotti L, Kahane P, Lachaux JP, Baciu M. Direct evidence for two different neural mechanisms for reading familiar and unfamiliar words: an intra-cerebral EEG study. Front Hum Neurosci. 2011;5:101. doi: 10.3389/fnhum.2011.00101. [DOI] [PMC free article] [PubMed] [Google Scholar]
- Kahane P, Minotti L, Hoffmann D, Lachaux JP, Ryvlin P. Invasive EEG in the definition of the seizure onset zone: depth electrodes. In: Rosenow F, Luders H, editors. Handbook of clinical neurophysiology. Pre-surgical assessment of the epilepsies with clinical neurophysiology and functional neuroimaging. Paris: Elsevier; 2004. pp. 109–135. [Google Scholar]
- Kayser C, Kim M, Ugurbil K, Kim DS, König P. A comparison of hemodynamic and neural responses in cat visual cortex using complex stimuli. Cereb Cortex. 2004;14:881–891. doi: 10.1093/cercor/bhh047. [DOI] [PubMed] [Google Scholar]
- Koubeissi MZ, Lesser RP, Sinai A, Gaillard WD, Franaszczuk PJ, Crone NE. Connectivity between perisylvian and bilateral basal temporal cortices. Cereb Cortex. 2011 doi: 10.1093/cercor/bhr163. [DOI] [PMC free article] [PubMed] [Google Scholar]
- Kruskal WH, Wallis WA. Use of ranks in one-criterion variance analysis. J Am Stat Assoc. 1952;47:583–621. [Google Scholar]
- Kujala J, Pammer K, Cornelissen P, Roebroeck A, Formisano E, Salmelin R. Phase coupling in a cerebro-cerebellar network at 8–13 Hz during reading. Cereb Cortex. 2007;17:1476–1485. doi: 10.1093/cercor/bhl059. [DOI] [PubMed] [Google Scholar]
- Kujala J, Gross J, Salmelin R. Localization of correlated network activity at the cortical level with MEG. Neuroimage. 2008;39:1706–1720. doi: 10.1016/j.neuroimage.2007.10.042. [DOI] [PubMed] [Google Scholar]
- Kutas M, Federmeier KD. Electrophysiology reveals semantic memory use in language comprehension. Trends Cogn Sci. 2000;4:463–470. doi: 10.1016/s1364-6613(00)01560-6. [DOI] [PubMed] [Google Scholar]
- Lachaux JP, Chavez M, Lutz A. A simple measure of correlation across time, frequency and space between continuous brain signals. J Neurosci Methods. 2003;123:175–188. doi: 10.1016/s0165-0270(02)00358-8. [DOI] [PubMed] [Google Scholar]
- Lachaux JP, George N, Tallon-Baudry C, Martinerie J, Hugueville L, Minotti L, Kahane P, Renault B. The many faces of the gamma band response to complex visual stimuli. Neuroimage. 2005;25:491–501. doi: 10.1016/j.neuroimage.2004.11.052. [DOI] [PubMed] [Google Scholar]
- Lachaux JP, Fonlupt P, Kahane P, Minotti L, Hoffmann D, Bertrand O, Baciu M. Relationship between task-related gamma oscillations and BOLD signal: new insights from combined fMRI and intracranial EEG. Hum Brain Mapp. 2007;28:1368–1375. doi: 10.1002/hbm.20352. [DOI] [PMC free article] [PubMed] [Google Scholar]
- Lachaux JP, Jung J, Mainy N, Dreher JC, Bertrand O, Baciu M, Minotti L, Hoffmann D, Kahane P. Silence is golden: transient neural deactivation in the prefrontal cortex during attentive reading. Cereb Cortex. 2008;18:443–450. doi: 10.1093/cercor/bhm085. [DOI] [PubMed] [Google Scholar]
- Logothetis NK, Pauls J, Augath M, Trinath T, Oeltermann A. Neurophysiological investigation of the basis of the fMRI signal. Nature. 2001;412:150–157. doi: 10.1038/35084005. [DOI] [PubMed] [Google Scholar]
- Mainy N, Jung J, Baciu M, Kahane P, Schoendorff B, Minotti L, Hoffmann D, Bertrand O, Lachaux JP. Cortical dynamics of word recognition. Hum Brain Mapp. 2008;29:1215–1230. doi: 10.1002/hbm.20457. [DOI] [PMC free article] [PubMed] [Google Scholar]
- Manning JR, Jacobs J, Fried I, Kahana MJ. Broadband shifts in local field potential power spectra are correlated with single-neuron spiking in humans. J Neurosci. 2009;29:13613–13620. doi: 10.1523/JNEUROSCI.2041-09.2009. [DOI] [PMC free article] [PubMed] [Google Scholar]
- Mashal N, Faust M, Hendler T, Jung-Beeman M. An fMRI study of processing novel metaphoric sentences. Laterality. 2009;14:30–54. doi: 10.1080/13576500802049433. [DOI] [PubMed] [Google Scholar]
- McDonald CR, Thesen T, Carlson C, Blumberg M, Girard HM, Trongnetrpunya A, Sherfey JS, Devinsky O, Kuzniecky R, Dolye WK, Cash SS, Leonard MK, Hagler DJ, Jr, Dale AM, Halgren E. Multimodal imaging of repetition priming: using fMRI, MEG, and intracranial EEG to reveal spatiotemporal profiles of word processing. Neuroimage. 2010;53:707–717. doi: 10.1016/j.neuroimage.2010.06.069. [DOI] [PMC free article] [PubMed] [Google Scholar]
- Mechelli A, Crinion JT, Long S, Friston KJ, Lambon Ralph MA, Patterson K, McClelland JL, Price CJ. Dissociating reading processes on the basis of neuronal interactions. J Cogn Neurosci. 2005;17:1753–1765. doi: 10.1162/089892905774589190. [DOI] [PubMed] [Google Scholar]
- Miller KJ. Broadband spectral change: evidence for a macroscale correlate of population firing rate? J Neurosci. 2010;30:6477–6479. doi: 10.1523/JNEUROSCI.6401-09.2010. [DOI] [PMC free article] [PubMed] [Google Scholar]
- Mukamel R, Gelbard H, Arieli A, Hasson U, Fried I, Malach R. Coupling between neuronal firing, field potentials, and FMRI in human auditory cortex. Science. 2005;309:951–954. doi: 10.1126/science.1110913. [DOI] [PubMed] [Google Scholar]
- Niessing J, Ebisch B, Schmidt KE, Niessing M, Singer W, Galuske RA. Hemodynamic signals correlate tightly with synchronized gamma oscillations. Science. 2005;309:948–951. doi: 10.1126/science.1110948. [DOI] [PubMed] [Google Scholar]
- Nir Y, Mukamel R, Dinstein I, Privman E, Harel M, Fisch L, Gelbard-Sagiv H, Kipervasser S, Andelman F, Neufeld MY, Kramer U, Arieli A, Fried I, Malach R. Interhemispheric correlations of slow spontaneous neuronal fluctuations revealed in human sensory cortex. Nat Neurosci. 2008;11:1100–1108. doi: 10.1038/nn.2177. [DOI] [PMC free article] [PubMed] [Google Scholar]
- Obleser J, Kotz SA. Expectancy constraints in degraded speech modulate the language comprehension network. Cereb Cortex. 2010;20:633–640. doi: 10.1093/cercor/bhp128. [DOI] [PubMed] [Google Scholar]
- Ojemann GA, Corina DP, Corrigan N, Schoenfield-McNeill J, Poliakov A, Zamora L, Zanos S. Neuronal correlates of functional magnetic resonance imaging in human temporal cortex. Brain. 2010;133:46–59. doi: 10.1093/brain/awp227. [DOI] [PMC free article] [PubMed] [Google Scholar]
- Ossandon T, Jerbi K, Vidal JR, Bayle DJ, Henaff MA, Jung J, Minotti L, Bertrand O, Kahane P, Lachaux JP. Transient suppression of broadband gamma power in the default-mode network is correlated with task complexity and subject performance. J Neurosci. 2011;31:14521–14530. doi: 10.1523/JNEUROSCI.2483-11.2011. [DOI] [PMC free article] [PubMed] [Google Scholar]
- Pasternak T, Greenlee MW. Working memory in primate sensory systems. Nat Rev Neurosci. 2005;6:97–107. doi: 10.1038/nrn1603. [DOI] [PubMed] [Google Scholar]
- Petersen SE, Fox PT, Posner MI, Mintun M, Raichle ME. Positron emission tomographic studies of the cortical anatomy of single-word processing. Nature. 1988;331:585–589. doi: 10.1038/331585a0. [DOI] [PubMed] [Google Scholar]
- Price CJ. The anatomy of language: contributions from functional neuroimaging. J Anat. 2000;197:335–359. doi: 10.1046/j.1469-7580.2000.19730335.x. [DOI] [PMC free article] [PubMed] [Google Scholar]
- Price CJ. The anatomy of language: a review of 100 fMRI studies published in 2009. Ann N Y Acad Sci. 2010;1191:62–88. doi: 10.1111/j.1749-6632.2010.05444.x. [DOI] [PubMed] [Google Scholar]
- Price CJ, Devlin JT. The interactive account of ventral occipitotemporal contributions to reading. Trends Cogn Sci. 2011;15:246–253. doi: 10.1016/j.tics.2011.04.001. [DOI] [PMC free article] [PubMed] [Google Scholar]
- Price CJ, Mechelli A. Reading and reading disturbance. Curr Opin Neurobiol. 2005;15:231–238. doi: 10.1016/j.conb.2005.03.003. [DOI] [PubMed] [Google Scholar]
- Pylkkänen L, Marantz A. Tracking the time course of word recognition with MEG. Trends Cogn Sci. 2003;7:187–189. doi: 10.1016/s1364-6613(03)00092-5. [DOI] [PubMed] [Google Scholar]
- Ray S, Maunsell JH. Different origins of gamma rhythm and high-gamma activity in macaque visual cortex. PLoS Biol. 2011;9:e1000610. doi: 10.1371/journal.pbio.1000610. [DOI] [PMC free article] [PubMed] [Google Scholar]
- Redcay E. The superior temporal sulcus performs a common function for social and speech perception: implications for the emergence of autism. Neurosci Biobehav Rev. 2008;32:123–142. doi: 10.1016/j.neubiorev.2007.06.004. [DOI] [PubMed] [Google Scholar]
- Richardson FM, Seghier ML, Leff AP, Thomas MS, Price CJ. Multiple routes from occipital to temporal cortices during reading. J Neurosci. 2011;31:8239–8247. doi: 10.1523/JNEUROSCI.6519-10.2011. [DOI] [PMC free article] [PubMed] [Google Scholar]
- Rogalsky C, Hickok G. Selective attention to semantic and syntactic features modulates sentence processing networks in anterior temporal cortex. Cereb Cortex. 2009;19:786–796. doi: 10.1093/cercor/bhn126. [DOI] [PMC free article] [PubMed] [Google Scholar]
- Sahin NT, Pinker S, Cash SS, Schomer D, Halgren E. Sequential processing of lexical, grammatical, and phonological information within Broca's area. Science. 2009;326:445–449. doi: 10.1126/science.1174481. [DOI] [PMC free article] [PubMed] [Google Scholar]
- Sakai K. Task set and prefrontal cortex. Annu Rev Neurosci. 2008;31:219–245. doi: 10.1146/annurev.neuro.31.060407.125642. [DOI] [PubMed] [Google Scholar]
- Salmelin R, Kujala J. Neural representation of language: activation versus long-range connectivity. Trends Cogn Sci. 2006;10:519–525. doi: 10.1016/j.tics.2006.09.007. [DOI] [PubMed] [Google Scholar]
- Sinai A, Bowers CW, Crainiceanu CM, Boatman D, Gordon B, Lesser RP, Lenz FA, Crone NE. Electrocorticographic high gamma activity versus electrical cortical stimulation mapping of naming. Brain. 2005;128:1556–1570. doi: 10.1093/brain/awh491. [DOI] [PubMed] [Google Scholar]
- Singer W. Neuronal synchrony: a versatile code for the definition of relations? Neuron. 1999;24:49–65. 111–125. doi: 10.1016/s0896-6273(00)80821-1. [DOI] [PubMed] [Google Scholar]
- Talairach J, Tournoux P. 3-dimensional proportional system: an approach to cerebral imaging. Stuttgart, Germany: Thieme; 1988. Co-planar stereotaxic atlas of the human brain. [Google Scholar]
- Varela F, Lachaux JP, Rodriguez E, Martinerie J. The brainweb: phase synchronization and large-scale integration. Nat Rev Neurosci. 2001;2:229–239. doi: 10.1038/35067550. [DOI] [PubMed] [Google Scholar]
- Vidal JR, Ossandon T, Jerbi K, Dalal SS, Minotti L, Ryvlin P, Kahane P, Lachaux JP. Category-specific visual responses: an intracranial study comparing gamma, beta, alpha, and ERP response selectivity. Front Hum Neurosci. 2010;4:195. doi: 10.3389/fnhum.2010.00195. [DOI] [PMC free article] [PubMed] [Google Scholar]
- Vinckier F, Dehaene S, Jobert A, Dubus JP, Sigman M, Cohen L. Hierarchical coding of letter strings in the ventral stream: dissecting the inner organization of the visual word-form system. Neuron. 2007;55:143–156. doi: 10.1016/j.neuron.2007.05.031. [DOI] [PubMed] [Google Scholar]
- Whittingstall K, Logothetis NK. Frequency-band coupling in surface EEG reflects spiking activity in monkey visual cortex. Neuron. 2009;64:281–289. doi: 10.1016/j.neuron.2009.08.016. [DOI] [PubMed] [Google Scholar]
- Ye Z, Zhou X. Conflict control during sentence comprehension: fMRI evidence. Neuroimage. 2009;48:280–290. doi: 10.1016/j.neuroimage.2009.06.032. [DOI] [PubMed] [Google Scholar]
- Zilbovicius M, Meresse I, Chabane N, Brunelle F, Samson Y, Boddaert N. Autism, the superior temporal sulcus and social perception. Trends Neurosci. 2006;29:359–366. doi: 10.1016/j.tins.2006.06.004. [DOI] [PubMed] [Google Scholar]