

Abstract
Dendritic spines, the actin-rich protrusions emerging from dendrites, are the locations of excitatory synapses in mammalian brains. Many molecules that regulate actin dynamics also influence the morphology and/or density of dendritic spines. Since dendritic spines are neuron-specific subcellular structures, neuron-specific proteins or signals are expected to control spinogenesis. In this report, we characterize the distribution and function of neuron-predominant cortactin-binding protein 2 (CTTNBP2) in rodents. An analysis of an Expressed Sequence Tag database revealed three splice variants of mouse CTTNBP2: short, long, and intron. Immunoblotting indicated that the short form is the dominant CTTNBP2 variant in the brain. CTTNBP2 proteins were highly concentrated at dendritic spines in cultured rat hippocampal neurons as well as in the mouse brain. Knockdown of CTTNBP2 in neurons reduced the density and size of dendritic spines. Consistent with these morphological changes, the frequencies of miniature EPSCs in CTTNBP2 knockdown neurons were lower than those in control neurons. Cortactin acts downstream of CTTNBP2 in spinogenesis, as the defects caused by CTTNBP2 knockdown were rescued by overexpression of cortactin but not expression of a CTTNBP2 mutant protein lacking the cortactin interaction. Finally, immunofluorescence staining demonstrated that, unlike cortactin, CTTNBP2 stably resided at dendritic spines even after glutamate stimulation. Fluorescence recovery after photobleaching further suggested that CTTNBP2 modulates the mobility of cortactin in neurons. CTTNBP2 may thus help to immobilize cortactin in dendritic spines and control the density of dendritic spines.
Introduction
Dendritic spines, the major locations of excitatory synapses in mammalian brains (Harris and Stevens, 1989), are actin-rich structures (Fischer et al., 2000). Neuronal activity controls actin cytoskeleton dynamics and thus modulates dendritic spine morphology and remodeling (Matus, 2000; Pontrello and Ethell, 2009). Cortactin, an actin-binding protein (Wu and Parsons, 1993), promotes branching and stabilization of actin filaments (for review, see Ammer and Weed, 2008; Ren et al., 2009) and is highly enriched in the lamellipodia of motile cells (Wu and Parsons, 1993) and in the dendritic spines of neurons (Hering and Sheng, 2003). Knockdown of endogenous cortactin reduces the spine density in cultured hippocampal neurons (Hering and Sheng, 2003), indicating a critical role for cortactin in spinogenesis. Moreover, NMDA receptor (NMDAR) activation triggers the redistribution of cortactin from dendritic spines to the dendritic shaft (Hering and Sheng, 2003), suggesting that cortactin participates in neuronal activity-dependent remodeling of dendritic spines.
Cortactin interacts with filamentous actin (F-actin) via central actin-binding repeats (Weed et al., 2000) and binds to the Arp2/3 complex with its N-terminal acidic domain (Weed et al., 2000; Uruno et al., 2001; Weaver et al., 2001). These interactions stabilize and promote the branching of actin filaments (Uruno et al., 2001; Weaver et al., 2001). Cortactin thus contributes to the morphological maintenance of dendritic spines (Hering and Sheng, 2003). We wondered whether the activity of cortactin in the regulation of dendritic spinogenesis, a neuron-specific event, is controlled by a neuron-specific signal or interacting protein. Several proteins containing a proline-rich sequence that interacts with the C-terminal Src homology 3 (SH3) domain of cortactin can direct cortactin's participation in various cellular events (for review, see Cosen-Binker and Kapus, 2006; Ammer and Weed, 2008). For instance, the SH3 domain of cortactin interacts with postsynaptic density cortactin-binding protein 1 (CortBP1) (Du et al., 1998), also known as Shank (Naisbitt et al., 1999). This interaction bridges F-actin, the postsynaptic guanylate kinase-associated protein–PSD-95–NMDAR complex (Naisbitt et al., 1999), and the Homer–mGluR complex (Tu et al., 1999). In addition, cortactin-binding protein 2 (CTTNBP2), also known as CortBP2 (Cheung et al., 2001) or CBP90 (Ohoka and Takai, 1998), was found to interact with the SH3 domain of cortactin (Ohoka and Takai, 1998). Although CTTNBP2 is exclusively expressed in the brain (Ohoka and Takai, 1998), its function in neurons and in the regulation of cortactin activity is still completely unknown.
In the present study, we hypothesize that CTTNBP2 regulates neuron-specific cortactin functions, such as dendritic spine formation. The interaction between cortactin and CTTNBP2 in neurons was confirmed by immunoprecipitation and immunostaining. Through a combination of RNAi knockdown, immunostaining, and fluorescence recovery after photobleaching (FRAP), our investigation suggests that CTTNBP2 regulates the mobility of cortactin and thus controls the formation and maintenance of dendritic spines.
Materials and Methods
Antibodies and reagents.
The following antibodies were used in this study: rabbit polyclonal cortactin (H-191; Santa Cruz Biotechnology); mouse monoclonal PSD-95 (K28/43; Millipore); mouse monoclonal Myc-tag (9B11; Cell Signaling Technology); rabbit polyclonal green fluorescent protein (GFP; A-6455, Invitrogen); chicken polyclonal GFP (ab13970; Abcam); mouse vesicular GABA transporter (VGAT; 131 011, Synaptic Systems); and mouse monoclonal α-tubulin (B-5-1-2; Sigma-Aldrich). CTTNBP2 polyclonal antibody was generated by immunizing rabbits with glutathione S-transferase (GST)-CTTNBP2 (amino acids 498–625) recombinant protein. After passage through a GST-coupled affinity column, specific antibody was purified with a GST-CTTNBP2 (amino acids 498–625)-conjugated column. Alexa Fluor 546-conjugated phalloidin was purchased from Invitrogen. Tetrodotoxin and bicuculline were purchased from Tocris Bioscience.
DNA constructs.
pGW1-CMV-Myc-cortactin and pGW1-CMV-GFP-cortactin (Hering and Sheng, 2003) were gifts from Dr. Morgan Sheng at the Howard Hughes Medical Institute and Massachusetts Institute of Technology, Cambridge, MA (current affiliation: Genentech, South San Francisco, CA). To construct the CTTNBP2 short-form expression plasmid, the 5′ (1–1413 bp) and 3′ (1393–1893 bp) regions of the coding sequence (CDS) were amplified by PCR from RIKEN 4732477G22 and IMAGE 6833056, respectively. The resulting overlapped DNA fragments were mixed for an assembly PCR in which they primed on each other and assembled into the CTTNBP2 short-form full-length CDS. Following PCR with primers carrying additional KpnI and BglII restriction sites, the full-length CDS was cloned into the vector pGW1–CMV with or without a Myc tag.
For long-form CTTNBP2, the 3′ coding sequences were amplified from mouse genomic DNA (1393–2038 bp) and RIKEN 6430526E05 (2020–4947 bp) and were assembled by PCR. For the intron form CTTNBP2, the 3′ coding sequences (1393–2133 bp) were amplified from mouse genomic DNA. To generate the CTTNBP2 long-form and intron-form expression constructs, the resulting 3′ coding sequences were individually cloned into the short-form expression vector using NheI and EcoRI to replace the 3′ segment of the short-form CDS.
For miRNA knockdown, the linearized vector pcDNA6.2–GW/EmGFP-miR was purchased from Invitrogen. The nucleotide sequence of base pairs 1362–1382 of the CTTNBP2 CDS was then used to construct pcDNA6.2-GW/EmGFP-miR-BP2 (BP2-miR) according to the manufacturer's instructions. Plasmid cDNA6.2-GW/EmGFP-neg control (Ctrl-miR), which expresses a miRNA that was predicted to not target any gene in mammalian genomes, was used as the negative control in the knockdown experiments. Both miR-BP2 and Ctrl-miR coexpress EmGFP, which was used to outline cell morphology. To obtain miRNA vectors coexpressing mCherry, the miRNA cassettes in BP2-miR and Ctrl-miR were individually amplified and cloned into the pGW1–CMV–mCherry vector using EcoRI. Consequently, the miRNA cassettes were integrated into the 3′ untranslated region of the mCherry transcripts. The original pRSETB–mCherry construct was kindly provided by Professpr Roger Tsien at the University of California, San Diego, CA. The mCherry coding region was PCR amplified and subcloned into the vector GW1–CMV.
For generating the CTTNBP2 constructs PA1 (P540A/P543A), PA2 (P599A/P602A), and a silent mutant resistant to the CTTNBP2 miRNA, site-directed mutagenesis was performed with the following oligonucleotides: PA1, 5′-CAGAGGAAATCCTGCTCCTATCGCTCCCAAAAAGCCAG-3′; PA2, 5′-CTAAGTCGTCCTCCGCTCAGCTGGCACCAAAACCGTCC-3′; silent mutant, 5′-GGGCAATGCAAATGATCCTGACCAAAATGGAAATAACACT-3′. The bases in italics indicate the mutated sites.
Reverse transcription-PCR.
Total RNA was isolated from embryonic day 14.5 mouse brain using Trizol (Invitrogen), followed by treatment with DNase I (Sigma-Aldrich). Reverse transcription-PCR (RT-PCR) was performed with the One-Step RT-PCR Kit (Genemark) according to the manufacturer's instructions. To discriminate between the various splicing forms of CTTNBP2 (see Fig. 1A), three oligonucleotide primers were designed: A, 5′-CCTCCCTCTACTTTGCCACA-3′; B, 5′-GCCATCTTCGCAGGAGTAAT-3′; C, 5′-AAGAAATGAGGAAGTGGGTGAA-3′.
Figure 1.

Expression of CTTNBP2 in the brain. A, Schematic of genomic structure and splicing forms of CTTNBP2 transcripts. Arrowheads point to the first and second splice donor sites at the end of exon 4. Arrows denote the positions of RT-PCR primers a–c. Primer a hybridizes before the first splicing site, primer b binds in exon 5, and primer c corresponds to the sequence in intron 4. B, Alignment of the predicted C-terminal amino acid sequences of the long, short, and intron forms of CTTNBP2. The corresponding alternative splice sites are indicated by arrowheads. Amino acid residues in the gray box are encoded by exon 5. Residues in the black box are encoded by intron 4. For the long and short forms, the amino acid sequence encoded by exon 5 results from a frameshift caused by usage of a different spice site. For the long form, the amino acid sequence beyond residue 715 is omitted. C, RT-PCR using mRNA purified from E14.5 mouse brain. D, Domain structures of the three CTTNBP2 forms. The lengths of the three forms are indicated, as is the region (498∼625 aa) used as the immunogen for the production of specific antibodies. CC, Coiled-coil; P, proline-rich; Ank, ankyrin repeat. E, Adult rat brain extract and whole-cell lysates prepared from COS cells transfected with CTTNBP2 isoforms were immunoblotted for CTTNBP2, suggesting that the short form predominates in the brain.
Animals.
All animal experiments were performed with the approval of the Academia Sinica Institutional Animal Care and Utilization Committee. For primary culture, pregnant rats were killed by CO2 inhalation; E18–E19 fetal pups were then isolated and killed by decapitation. To prepare brain extracts for biochemical study, adult rats of either sex were killed by decapitation with a guillotine. For immunohistochemistry, 2- to 3-month-old mice of either sex were first anesthetized by intraperitoneal injection with a mixture of ketamine (8.7 mg/100 g of body weight) and xylazine (1.3 mg/100 g of body weight) and intracardiacally perfused with >50 ml of PBS containing heparin (10 U/ml) followed by >50 ml of 4% paraformaldehyde in PBS to fix brain tissue. After dissection from skulls, brains were post-fixed in 4% paraformaldehyde overnight at 4°C for slicing at a later time.
Immunoprecipitation.
To obtain a soluble synaptosome fraction, the brains of 2- to 4-month-old rats of either sex were homogenized in lysis buffer (10 mm Tris, pH 7.4, 320 mm sucrose, 2 mm dithiothreitol, 2 μg/ml leupeptin, 2 μg/ml pepstatin-A, 2 μg/ml aprotinin, 1 mm tosylphenylalanylchloromethane, and 2 mm phenylmethylsulfonyl fluoride) and centrifuged at 800 × g for 10 min at 4°C. The supernatant was centrifuged at 9200 × g for 15 min to collect the synaptosomal fraction (P2), which was then resuspended and incubated in 20 mm Tris, pH 7.4, 5 mm ethylenediaminetetraacetic acid, 200 mm NaCl, and 1% Triton X-100 for 1 h at 4°C. After centrifugation at 35,000 × g for 40 min, the supernatant was collected for further experiments. For immunoprecipitation, the soluble synaptosome fraction was diluted fivefold in 20 mm Tris buffer and incubated with antibody preadsorbed Sepharose resin at 4°C overnight. The resin was washed three times with 20 mm Tris, pH 7.4, 40 mm NaCl, and 0.2% Triton X-100, and immunoblotted.
Primary rat hippocampal neuron cultures and immunofluorescence.
At embryonic day 18–19, rat hippocampal neurons were dissociated by trypsinization, resuspended in growth medium (50% Neurobasal Medium and 50% DMEM supplemented with 2% B27 supplement, 0.5 mm glutamine, and 12.5 μm glutamate), and plated in 12-well culture plates containing glass coverslips coated with poly-l-lysine (1 mg/ml) at a density of 200,000 neurons per well. Transfection was performed at 12 DIV using calcium phosphate precipitation. For immunofluorescence, cells were fixed with 4% paraformaldehyde and 4% sucrose in PBS, followed by permeabilization with 0.2% Triton X-100 in PBS at 18 DIV. To explore the role of CTTNBP2 in the maintenance of dendritic spines, transfection was performed at 20 DIV and immunostaining was performed at 26 DIV. After blocking with 10% bovine serum albumin, cells were incubated with primary antibodies diluted in PBS containing 3% bovine serum albumin at 4°C overnight. Following PBS washes, the cells were incubated with secondary antibodies conjugated with Alexa Fluor 488, 555, and/or 647 (Invitrogen) for 2 h. DNA was counterstained with 4′,6′-diamidino-2-phenylindole dihydrochloride (DAPI). Vectashield mounting medium (H-1000; Vector Laboratories) was used to mount the samples for imaging. Images were acquired using a confocal microscope (LSM510-Meta or LSM700; Carl Zeiss) equipped with a 63×/NA 1.4 oil (Plan-Apochromat; Carl Zeiss) objective lens and LSM 3.2 or Zen 2009 (Carl Zeiss) acquisition and analysis software. All fixed cells were imaged at 20–22°C. For publication, the images were processed with Photoshop (Adobe) with minimal adjustment of brightness or contrast applied to the whole images. Quantitation of spine morphology and density was performed using ImageJ 1.45 (NIH). Density and size were manually quantitated along 20 μm of dendrite starting 20 μm away from the soma. Some experiments were repeated blind to minimize the effect of bias. Statistical analysis of spine density was performed with unpaired Student's t tests (see Fig. 4D) or with one-way ANOVA and Tukey's post hoc test (see Fig. 5C) using GraphPad Prism 5.0 (GraphPad Software). Spine width and length were analyzed with the Kolmogorov–Smirnov test using SPSS 10.0 (SPSS).
Figure 4.
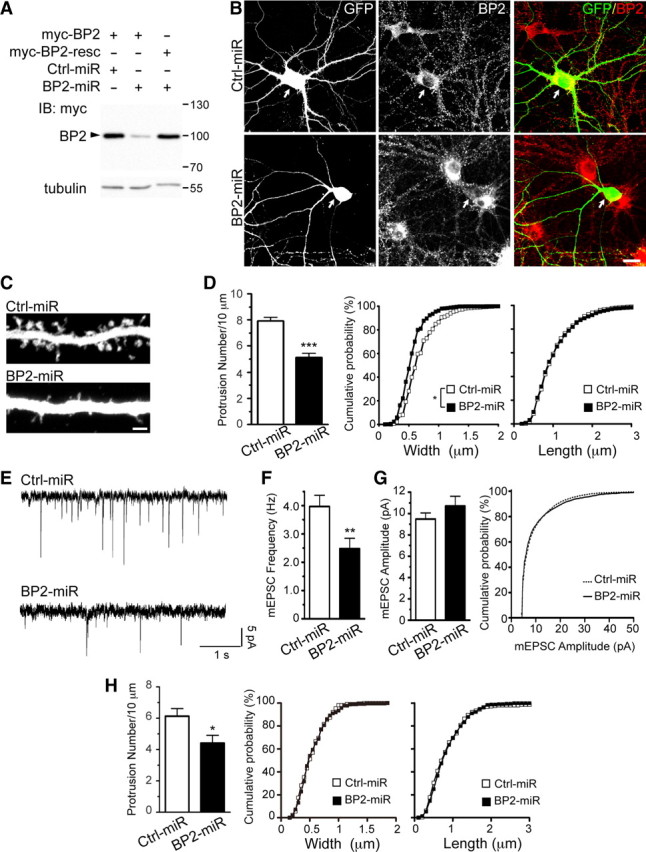
Knockdown of CTTNBP2 impairs dendritic spine density and reduces spontaneous neuronal activity. A, Knockdown of CTTNBP2 assayed in COS cells cotransfected with BP2-miR or Ctrl-miR and Myc-tagged wild-type CTTNBP2 (Myc-BP2) or a CTTNBP2 silent mutant resistant to BP2-miR (Myc-BP2-resc). Whole-cell extracts were immunoblotted with Myc antibody and tubulin antibody. B–F, The effect of expression of the BP2-miR in cultured neurons. Rat hippocampal neurons were transfected at 12 DIV with BP2-miR or Ctrl-miR. GFP expressed by the miRNA vectors highlights the transfected cells. Neurons were harvested at DIV 18 for analysis. B, BP2-miR reduces the endogenous CTTNBP2 protein level in rat hippocampal neurons. Transfected neurons were fixed and immunostained with CTTNBP2 antibody. C, CTTNBP2 knockdown decreases spine density and reduces spine width. Representative images of GFP signal are shown. D, Quantification of the number of protrusions per 10 μm of dendrites (left) and width and length of protrusions (right two panels). A total of 20 neurons were collected from two independent experiments for each group; >50 dendrites and 400 spines for each group were assayed. E, mEPSCs were recorded on transfected hippocampal neurons. F, G, Quantification of mEPSC frequency (F) and amplitude (G) in transfected neurons (n = 23 for Ctrl-miR and n = 27 for BP2-miR). H, CTTNBP2 participates in the in maintenance of dendritic spines. Cultured rat hippocampal neurons were transfected with Ctrl-miR and BP2-miR at 20 DIV and were fixed for staining at 26 DIV. Error bars indicate mean ± SEM. *p < 0.05; **p < 0.01; ***p < 0.005. Scale bars: B, 20 μm; C, 2 μm.
Figure 5.

Cortactin functions downstream of CTTNBP2 in the regulation of dendritic spine density. A, Coimmunoprecipitation of cortactin and CTTNBP2 (BP2) mutants. Whole-cell extracts of COS cells transfected with cortactin and wild-type or mutant CTTNBP2 (PA1, P540A/P543A; PA2, P599A/P602A) were precipitated with CTTNBP2 antibody. Immunoblotting (IB) was then performed to assess the presence of cortactin and CTTNBP2 in the precipitates. The arrowhead indicates the position of cortactin (top) or CTTNBP2 (bottom). The asterisk indicates a nonspecific signal. B–D, Rat hippocampal neurons were transfected with control miRNA (Ctrl-miR) or CTTNBP2 miRNA (BP2-miR) along with the Myc-tagged CTTNBP2 silent mutant (BP2-resc), the PA1 mutant (BP2-PA1-resc), or cortactin at 12 DIV. Neurons were harvested for staining with GFP and Myc-tag antibodies at DIV 18. B, Cortactin and the CTTNBP2 silent mutant restore the spine density in CTTNBP2 knock-down neurons. GFP signals were used to outline dendrite and spine morphology. Scale bar, 2 μm. C, Quantification of the density of protrusions. Eighteen neurons and >50 dendrites were assayed for each group. D, The width and length of protrusions assessed from >400 spines in each group. Error bars indicate mean ± SEM. *p < 0.05; ***p < 0.005.
Immunohistochemistry.
The 50-μm-thick adult mouse brain sections were collected with a vibratome and incubated with CTTNBP2 antibody at 1 μg/ml in PBS containing 3% horse serum, 2% bovine serum albumin, and 0.3% Triton X-100 at 4°C for 2 d. After washing, the brain sections were incubated with Alexa Fluor 488-conjugated secondary antibody, Alexa Fluor 546-conjugated phalloidin, and DAPI at room temperature for 2 h. Images were acquired as described above.
Time-lapse recording and FRAP.
Time-lapse recording was performed using a confocal microscope (LSM700; Carl Zeiss) with a 63×/1.4 oil objective (Plan-Apochromat; Carl Zeiss) at 37°C supplied with 5% CO2. One day after transfection, COS cells were trypsinized and replated on poly-l-lysine (0.1 mg/ml)-coated glass coverslips, followed by a 4 h incubation at 37°C. Before recording, culture medium was replaced with prewarmed HBSS (Invitrogen). The GFP and mCherry signals were acquired every 5 s for 5–10 min.
For FRAP, hippocampal neurons grown on poly-l-lysine (1 mg/ml)-coated glass coverslips were transfected at 12 DIV and recorded at 18 DIV. During FRAP, the image series was captured before and immediately after photobleaching with 0.5 s intervals and a scan speed of ∼0.2 s/scan. Spines of interest were photobleached 10 times with a 488 nm laser at 100% output. ImageJ was used to measure fluorescence intensity in the image series. For each image, a region without transfected cells was measured as background, and its intensity was subtracted from the intensity of the region of interest. These raw data were divided by the intensity measured at unbleached dendrites to correct for fluorescence loss during image acquisition. Finally, all intensity data were normalized to the average fluorescence intensity of 10 scans acquired just before bleaching. GraphPad Prism was used for curve fitting with the following one-phase exponential equation: y = a(1 − exp(−bx)).
Electrophysiology.
Cultured rat hippocampal neurons were transfected at 12 DIV, and whole-cell patch-clamps were performed at 18 DIV to record miniature EPSCs (mEPSCs). Neurons were incubated in extracellular solution containing 145 mm NaCl, 3 mm KCl, 10 mm HEPES, 3 mm CaCl2, 2 mm MgCl2, 8 mm glucose, 0.001 mm tetrodotoxin, and 0.02 mm bicuculline. The intracellular solution contained 136.5 mm K-gluconate, 9 mm NaCl, 17.5 mm KCl, 10 mm HEPES, 0.2 mm ethylene glycol tetraacetic acid, 4 mm Mg-ATP, and 0.3 mm Na-ATP. Neurons were voltage-clamped at −70 mV, and mEPSCs were recorded with the Axon Axopatch 200B amplifier (Molecular Devices) and filtered at 1 kHz. The Clampfit 9 software (Molecular Devices) was used to detect mEPSCs from the raw data with an amplitude threshold of 4.5 pA. The mEPSC recording was performed blind at the Electrophysiology and Calcium Imaging Core Facility, Neuroscience Program and Institute of Molecular Biology, Academia Sinica. Statistical analyses of amplitude and frequency were then performed with unpaired Student's t tests using GraphPad Prism.
Results
The CTTNBP2 short form is the major gene transcript in the brain
Rat CTTNBP2 was originally identified as a protein product smaller than 90 kDa from a pulldown assay with a GST-cortactin fusion protein (Ohoka and Takai, 1998). Later, human CTTNBP2 was predicted to encode a 1663 aa product (Cheung et al., 2001). Through analysis of an Expressed Sequence Tag database, we identified three transcripts encoded by CTTNBP2: short, long, and intron forms (Table 1). This variation is due to alternative splicing between exon 4 and exon 5 of CTTNBP2 (Fig. 1A). Two RNA splice donor sites are present at the end of exon 4 of CTTNBP2. When the first splice site is used, the transcript encodes the short form of CTTNBP2. When the second splice site is chosen, the long protein is produced. Retention of intron 4 causes the production of the intron form; the polypeptide chain terminates early at the alternative stop codon in intron 4. Thus, the C-terminal amino acid sequences of these three forms are variant (Fig. 1B).
Table 1.
Mouse CTTNBP2 expressed sequence tag clones
| GenBank accession no. | Clone ID | Source tissue | Containing full exon 4 | Containing intron | Splicing form |
|---|---|---|---|---|---|
| BC141407 | IMAGE 9056020 | Brain | Yes | No | Long |
| AK173254 | Pancreatic islet, adult | Yes | No | Long | |
| BC068156 | IMAGE 30362957 | Brain | No | No | Short |
| BQ769661 | IMAGE 5697958 | Brain, E12.5 | No | No | Short |
| CB526439 | IMAGE 6848778 | Brain, embryo | No | No | Short |
| AK032356 | RIKEN 6430526E05 | Olfactory bulb, adult | No | No | Short |
| CB244938 | IMAGE 6833056 | Brain, embryonic | No | No | Short |
| AK028980 | RIKEN 4732477G22 | Skin, 10 d neonate | Yes | Yes | Intron |
| BQ961104 | IMAGE 6439978 | Mammary gland tumor, 5-month-old female | Yes | Yes | Intron |
To investigate expression of these three forms in neurons, we first performed RT-PCR using RNA extracted from mouse brain, which suggested that the short-form transcripts were the predominant products of CTTNBP2 in the mouse brain (Fig. 1C). To confirm this observation, we generated CTTNBP2-specific antibodies to analyze the protein products of CTTNBP2 (Fig. 1D); only the fragment containing the proline-rich domain successfully generated CTTNBP2-specific antibodies (Fig. 1D). Compared with cell extracts prepared from COS cells transfected with the short, long, and intron forms individually, the short form appeared to be the dominant protein product of CTTNBP2 in the brain (Fig. 1E). We therefore only included the short form in our subsequent investigations.
CTTNBP2 interacts with cortactin in COS cells and in neurons
A previous study demonstrated the interaction between cortactin and CTTNBP2 by a fusion protein pulldown assay (Ohoka and Takai, 1998). To confirm the interaction of cortactin and CTTNBP2 in cells, we transfected GFP-cortactin and mCherry-CTTNBP2 into COS cells; 1 d after transfection, cells were replated and analyzed by time-lapse recording ∼4 h after replating. Under these conditions, high cell mobility facilitates the observation of cytoskeleton dynamics. The live imaging clearly showed the colocalization and comigration of cortactin and CTTNBP2 at the cell cortex and intracellular puncta of COS cells (Fig. 2A,B). Some CTTNBP2/cortactin puncta associated with intracellular vesicles [Fig. 2A(inset),B]. Additionally, cortactin antibodies precipitated cortactin as well as CTTNBP2 from rat brain extracts (Fig. 2C), further supporting the interaction of CTTNBP2 and cortactin in neurons.
Figure 2.
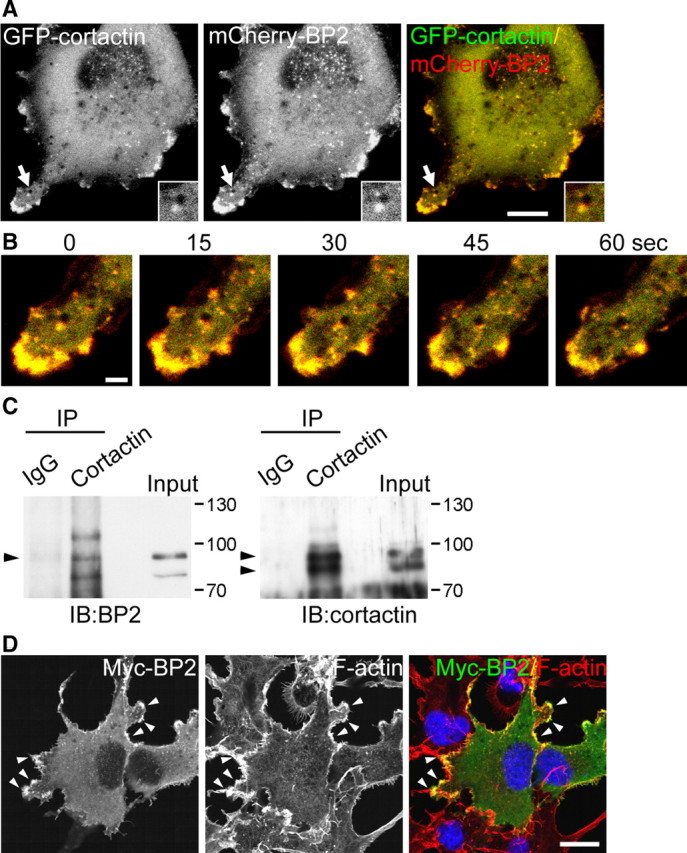
CTTNBP2 interacts with cortactin. A, Colocalization of fluorescence protein-tagged CTTNBP2 and cortactin in living cells. GFP-cortactin and mCherry-CTTNBP2 (mCherry-BP2) transiently cotransfected COS cells were replated on glass coverslips 4 h before recording. Images were recorded every 5 s for ∼10 min. A representative image at a single time point is shown. The insets are the local enlargement of the area indicated by the arrow and illustrate the colocalization of CTTNBP2 and cortactin surrounding an intracellular vesicle. B, Enlarged time-lapse images corresponding to the region indicated by the arrow in A. C, Coimmunoprecipitation of cortactin and CTTNBP2 from rat brain with anti-cortactin and nonimmune rabbit IgG. The precipitates were immunoblotted (IB) with CTTNBP2 or cortactin antibodies as indicated. The arrowhead indicates the position of CTTNBP2 (left) or cortactin (right). D, Overlapping distribution of CTTNBP2 and F-actin at the cell cortex (arrowheads). COS cells expressing Myc-tagged CTTNBP2 (Myc-BP2) were fixed and stained with anti-Myc, DAPI (to label nuclei), and phalloidin (to label F-actin). Scale bars: A, 10 μm; B, 2 μm; D, 20 μm.
Cortactin interacts with F-actin via its central repeat domains and binds to CTTNBP2 through its C-terminal SH3 domain. CTTNBP2 therefore likely associates with F-actin through the interaction with cortactin. To test this possibility, COS cells were transfected with Myc-tagged CTTNBP2 and immunostained 1 d after transfection using an anti-Myc antibody and phalloidin. In fixed cells, F-actin and CTTNBP2 were colocalized at the cell cortex (Fig. 2D, arrowheads), reflecting the association of CTTNBP2 with the cortactin-F-actin cytoskeletons.
CTTNBP2 is highly concentrated at synapses in cultured neurons and brains
Since cortactin is concentrated at the dendritic spines and regulates spine morphology, we wondered whether CTTNBP2 also localized to dendritic spines in neurons. Myc-tagged CTTNBP2 and GFP were coexpressed in neurons, and immunostaining indicated that Myc-tagged CTTNBP2 was highly concentrated at dendritic spines (Fig. 3A). CTTNBP2-specific antibody was then used to examine the distribution of endogenous CTTNBP2. In Myc-tagged CTTNBP2-transfected COS cells, the immunoreactivities of the CTTNBP2 antibody colocalized well with Myc-tag immunoreactivities (Fig. 3B), supporting the specificity of our CTTNBP2 antibody. Triple staining with anti-CTTNBP2, postsynaptic marker PSD-95 antibody, and phalloidin in cultured hippocampal neurons at 23 DIV demonstrated that the CTTNBP2 immunoreactivities colocalized very well with those of PSD-95 and F-actin in mature cultured neurons (Fig. 3C). In adult mouse brains, CTTNBP2 immunoreactivities were also colocalized with F-actin (Fig. 3D), and higher magnification revealed the punctate patterns of CTTNBP2 and F-actin, which colocalized along dendrites (Fig. 3E). The CTTNBP2/F-actin double-positive puncta did not colocalize with the inhibitory synapse marker VGAT (Fig. 3E, enlarged images), suggesting that the CTTNBP2/F-actin puncta are not the location of inhibitory synapses. In addition to dendritic spines, CTTNBP2 antibody also accumulated in a punctate signal in the soma; however, these somatic CTTNBP2 puncta were not colocalized with F-actin (Fig. 3E). Together, these immunofluorescence experiments identified the synaptic distribution of CTTNBP2 in cultured neurons and mouse brains and suggested an association of CTTNBP2 with actin cytoskeletons.
Figure 3.
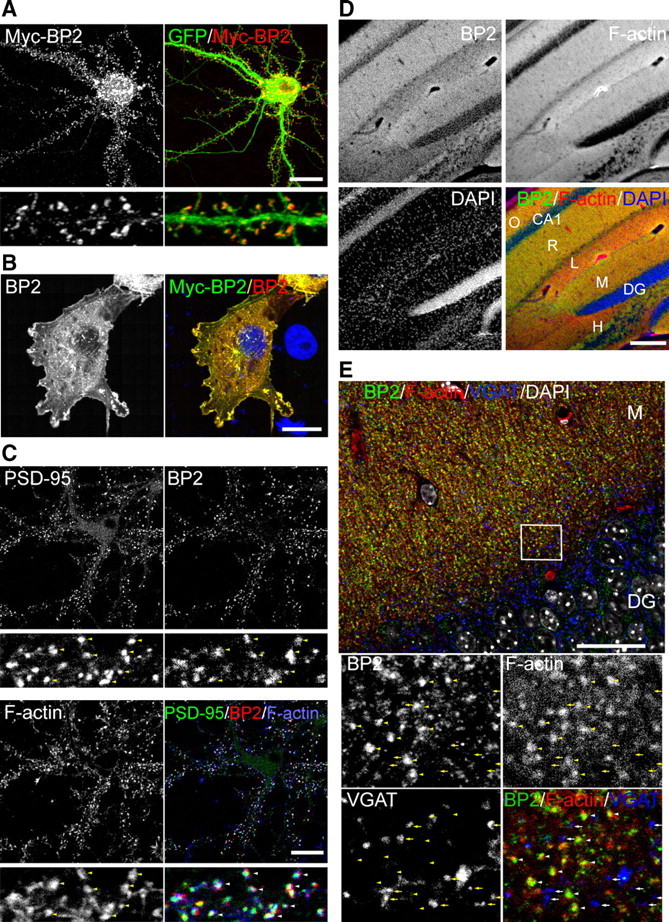
Synaptic distribution of CTTNBP2 in neurons. A, Rat hippocampal neurons were transfected with Myc-tagged CTTNBP2 (Myc-BP2) and GFP at DIV 12 and immunostained with Myc antibody at DIV 18. Bottom panels show higher magnification of dendrites. B, Specificity of CTTNBP2 antibody in immunostaining. Myc-tagged CTTNBP2-transfected COS cells were analyzed by double immunostaining with Myc antibody and CTTNBP2 antibody. C, Synaptic distribution of CTTNBP2 (BP2) in rat hippocampal neurons. Fluorescence staining using PSD-95 and CTTNBP2 antibodies and phalloidin was performed at DIV 23. D, E, Immunohistochemistry of adult mouse hippocampus with CTTNBP2 antibody. D, Low-magnification image covering a part of CA1 and the dentate gyrus of the hippocampus. E, High-magnification image of the dentate gyrus. CTTNBP2 and VGAT antibodies were used for fluorescence immunostaining. F-actin and nuclei were labeled with phalloidin and DAPI, respectively. The enlarged individual images are also shown in the bottom panel. VGAT immunoreactivity is not obviously overlapping or adjacent to the CTTNBP2 puncta. O, Stratum oriens; R, stratum radiatum; L, stratum lacunosum; M, stratum moleculare; DG, dentate gyrus; H, hilus. In C, yellow arrowheads in the individual panels and white arrowheads in the merged panels highlight examples of colocalization. In E, arrowheads indicate the colocalization of CTTNBP2 and F-actin, while arrows denote the positions of VGAT alone. Scale bars: A–C, 20 μm; D, 200 μm; E, 30 μm.
Knockdown of CTTNBP2 reduces the density and size of dendritic spines
To explore the role of CTTNBP2 in dendritic spine morphogenesis, we generated an artificial CTTNBP2 miRNA construct (BP2-miR) to knock down CTTNBP2 expression in cells. Nonsilencing Ctrl-miR predicted not to target any gene in mammalian genomes was used as a negative control. BP2-miR reduced the expression of cotransfected Myc-tagged CTTNBP2 in COS cells (Fig. 4A). We next examined the effect of BP2-miR in cultured hippocampal neurons; since our miRNA constructs coexpressed EmGFP, the EmGFP signals labeled transfected neurons and outlined cell morphology. Immunostaining with GFP and CTTNBP2 antibodies demonstrated that the CTTNBP2 immunoreactivities were lower in BP2-miR-transfected neurons than in Ctrl-miR-transfected neurons or neighboring untransfected neurons (Fig. 4B). High-magnification images revealed that BP2-miR expression impaired dendritic spine morphology (Fig. 4C). The spine density of CTTNBP2-knockdown neurons (5.1 ± 0.3 spines/10 μm) was significantly lower than that of neurons transfected with Ctrl-miR (7.9 ± 0.3 spines/10 μm) (Fig. 4D). The width of the spine heads was also reduced in CTTNBP2-knock-down neurons (mean widths: BP2-miR, 0.55 μm; Ctrl-miR, 0.68 μm). However, the lengths of the dendritic spines were not affected by CTTBP2 knockdown (Fig. 4D). The same conclusions were also obtained in blind experiments (data not shown).
To corroborate these morphological changes in the dendritic spines, we conducted blind experiments to further measure the frequency and amplitude of mEPSCs in BP2-miR-transfected neurons. Consistent with the change in dendritic spine density, the mEPSC frequency of BP2-miR-transfected neurons was lower than that of control neurons (Fig. 4E,F); however, the amplitude of the mEPSC did not differ significantly between CTTNBP2 knock-down neurons and control neurons (Fig. 4E,G). Knockdown of CTTNBP2 in neurons thus impairs the density and morphology of dendritic spines and the electrophysiological response of neurons.
In typical cultured hippocampal neurons, dendritic filopodia actively emerge from dendrites at ∼12–14 DIV and then transform to dendritic spines (Ziv and Smith, 1996; Chao et al., 2008). Therefore, the experiments performed during DIV 12–18 favor a role of CTTNBP2 in spinogenesis. In fully mature cultured hippocampal neurons, dendritic spines are relatively stable along dendrites (Ziv and Smith, 1996). Newborn spines are difficult to detect in cultured hippocampal neurons at ∼3 weeks in vitro (H.-W. Chao, unpublished data). To investigate whether CTTNBP2 influences the maintenance of established dendritic spines in fully mature neurons, transfection was performed at 20 DIV and immunostaining was performed at 26 DIV. Similar to the results collected at 18 DIV, knockdown of CTTNBP2 starting at 20 DIV also reduced the spine density at 26 DIV (Fig. 4H), although the widths and lengths of the dendritic spines were not affected by CTTNBP2 knockdown (Fig. 4H). These data suggest that CTTNBP2 is likely also involved in the maintenance of dendritic spines.
The interaction of CTTNBP2 and cortactin is required for regulation of spine density by CTTNBP2
Since CTTNBP2 interacts with cortactin in neurons and since cortactin also regulates spine morphology and density, we wished to explore the relationship between CTTNBP2 and cortactin in spinogenesis. A previous study had identified the proline-rich domain of CTTNBP2 as a domain that interacted with the cortactin SH3 domain (Ohoka and Takai, 1998). We further identified two candidate SH3-binding domains in CTTNBP2: amino acids 538–547 (-NPPPIPPKKP-) and amino acids 597-606 (-SSPQLPPKPS-). Two proline-to-alanine mutations were introduced into each stretch to identify the region critical for cortactin binding. These mutants were designated PA1 for the P540A/P543A double mutant and PA2 for the P599A/P602A double mutant. Compared with wild-type CTTNBP2, both the PA1 and PA2 mutations reduced the interaction between cortactin and CTTNBP2 in COS cells; the PA1 mutation almost completely abolished the interaction (Fig. 5A).
Since the PA1 mutation more strongly interfered with the interaction between cortactin and CTTNBP2, we used this mutant to examine the role of the interaction of cortactin and CTTNBP2 in dendritic spinogenesis. In CTTNBP2 knock-down neurons, expression of the silent mutant resistant to BP2-miR (BP2-resc) rescued the effect of BP2-miR on spine density (Fig. 5B,C). However, the PA1 mutant also resistant to BP2-miR (BP2-PA1-resc) did not rescue the spine density phenotype of the CTTNBP2 knockdown (Fig. 5B,C), suggesting that the interaction with cortactin is required for CTTNBP2 to control spine density. Consistent with this possibility, cortactin overexpression also rescued the phenotype of the CTTNBP2 knockdown (Fig. 5B,C). Together, these observations suggest that cortactin functions downstream of CTTNBP2 to regulate dendritic spine density.
Dendritic spine length was unaffected by treatment with BP2-resc, BP2-PA1-resc, or cortactin (Fig. 5D, right), consistent with our conclusion that CTTNBP2 does not regulate spine length. For the widths of the spine heads, cortactin overexpression rescued the spine-head phenotype of the CTTNBP2 knockdown (Fig. 5B,D). Unexpectedly, although the BP2-PA1-resc mutant did not rescue the effect of BP2-miR on spine density (Fig. 5C), it restored the spine-head phenotype of the CTTNBP2 knockdown (Fig. 5B,D), suggesting that there are two pathways downstream of CTTNBP2 to control the size of spine heads, one cortactin dependent, the other cortactin independent. Activation of either pathway is sufficient to maintain the size of spine heads. Alternatively, since the effect of BP2-miR on the spine widths is weaker than that on the spine density, it is also possible that the spine width phenotype is easier to rescue with BP2-PA1-resc, although the interaction between cortactin and BP2-PA1-resc is reduced to a very low level.
Cortactin, but not CTTNBP2, redistributes into the dendritic shaft after glutamate treatment
A previous study showed that glutamate treatment induces the redistribution of cortactin and actin from dendritic spines to the dendritic shaft (Hering and Sheng, 2003), which may contribute to the regulation of activity-dependent remodeling of dendritic spines. Since our data suggest that cortactin acts downstream of CTTNBP2 to control spine density, we investigated whether CTTNBP2 also redistributed to the dendritic shaft after glutamate stimulation. Two treatments were used to stimulate cultured hippocampal neurons at ∼21–24 DIV: 50 μm glutamate treatment for 2 min (plus 8 min recovery) or 15 min.
Similar to the previous report (Hering and Sheng, 2003), F-actin and cortactin were redistributed to the dendrites after glutamate treatment in both conditions (Fig. 6A,B, data not shown for the distribution of cortactin after 15 min glutamate treatment). In contrast, CTTNBP2 remained at the dendritic spines after glutamate stimulation (Fig. 6A,B). As previously (Hering and Sheng, 2003), glutamate-induced F-actin and cortactin redistribution relied on NMDAR but not AMPAR, since the effect of NMDA on F-actin and cortactin is similar to that of glutamate (Fig. 6, compare C, A). KCl stimulation also induced redistribution of F-actin and cortactin (Fig. 6C); in contrast, regardless of KCl, NMDA, or AMPA treatment, CTTNBP2 localized to the dendritic spines (Fig. 6C). Together, these observations suggest that, unlike cortactin and F-actin, the synaptic distribution of CTTNBP2 does not shift to the dendritic shaft in response to neuronal activation.
Figure 6.

CTTNBP2 stably resides at dendritic spines after glutamate stimulation. At 21∼24 DIV, cultured rat hippocampal neurons were stimulated with glutamate (50 μm), NMDA (100 μm), AMPA (100 μm), and KCl (75 μm) for 15 min (A), 15 min (C), or 2 min plus 8 min of recovery (B) in normal growth medium. A, Triple staining with PSD-95 antibodies, CTTNBP2 (BP2) antibodies, and phalloidin. Yellow arrowheads in the individual panels and white arrowheads in the merged panels point to the puncta containing overlapping PSD-95 and CTTNBP2. B, C, Distributions of PSD-95, CTTNBP2, F-actin, and cortactin along dendrites with or without stimulation. Due to technical limitations, we were unable to visualize PSD-95, CTTNBP2, cortactin, and F-actin in the same neurons. Images shown in B and C were not captured from the same cells. Scale bars, 5 μm.
CTTNBP2 regulates the mobility of cortactin in dendritic spines
We observed that CTTNBP2 stably resides at dendritic spines and that CTTNBP2 acts upstream of cortactin to regulate spine density and morphology. FRAP was therefore used to test whether CTTNBP2 regulated the mobility of cortactin at dendritic spines. To label miRNA expression in GFP-cortactin-positive neurons, the miRNA cassettes in the miRNA constructs were cloned into the mCherry expression vector to generate BP2-miR(Cherry) and Ctrl-miR(Cherry). At 12 DIV, GFP-cortactin was cotransfected with BP2-miR(Cherry) and Ctrl-miR(Cherry) into cultured hippocampal neurons; only neurons double labeled with GFP and mCherry (Fig. 7A) were subjected to FRAP analysis at 18 DIV. After bleaching, time-lapse recording was continued to monitor the recovery of GFP-cortactin (Fig. 7B). The recovery rate of GFP-cortactin at the dendritic spines of CTTNBP2-knockdown neurons was faster than that in neurons transfected with Ctrl-miR(Cherry) (Fig. 7C), with recovery half-times of 2.18 and 4.22 s, respectively, suggesting that cortactin mobility is regulated by CTTNBP2. Moreover, recovered GFP-cortactin fluorescence reached prebleaching levels in CTTNBP2-knock-down neurons (Fig. 7C). By contrast, the plateau of recovered GFP-cortactin fluorescence in control neurons maximized at 85% of the prephotobleaching levels (Fig. 7C), suggesting that ∼15% of the cortactin stably resided in dendritic spines due to the presence of CTTNBP2, likely through the interaction of CTTNBP2 and cortactin.
Figure 7.
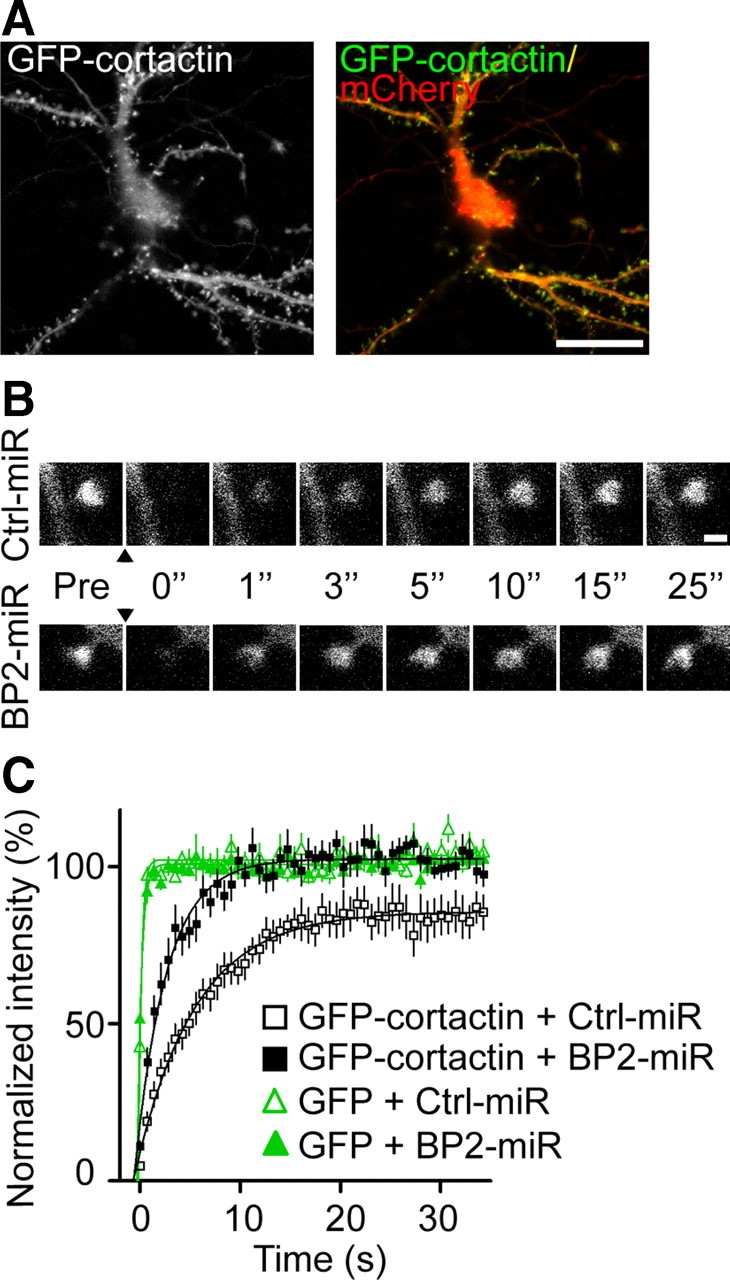
GFP-cortactin is more mobile in the absence of CTTNBP2. Rat hippocampal neurons were transfected at 12 DIV with GFP or GFP-cortactin along with control miRNA (Ctrl-miR) or CTTNBP2 miRNA (BP2-miR). The plasmid expressing miRNA coexpresses mCherry, which was therefore used to label miRNA-expressing neurons. FRAP measurements were performed at 18 DIV. A, Expression of GFP-cortactin and mCherry in transfected neurons. B, FRAP of GFP-cortactin in the spines of Ctrl-miR or BP2-miR transfected neurons. Images depict the same spine before (Pre) and 0, 1, 3, 5, 10, 15, and 25 s after photobleaching. The arrowheads indicate the time of photobleaching. Scale bar, 1 μm. C, FRAP analysis of GFP and GFP-cortactin over the 35 s period after photobleaching. The average of the fluorescence intensities of 10 scans acquired before photobleaching was set to 100%, and the curves were fit with one-phase exponential equations. A total of 10 neurons for each group and three spines for each neuron were analyzed. Error bars indicate mean ± SEM.
To ensure that the mobility of GFP fluorescence was controlled by cortactin, rather than by GFP itself, we also performed FRAP with cultured hippocampal neurons transfected with GFP. The recovery rate of GFP alone was much faster than that of GFP-cortactin in control and CTTNBP2 knock-down neurons (Fig. 7C), supporting the relevance of the GFP-cortactin FRAP assay.
Knockdown of CTTNBP2 reduces the distribution of cortactin at dendritic spines
To further confirm the role of CTTNBP2 in controlling the synaptic distribution of cortactin, we performed immunostaining of endogenous cortactin in CTTNBP2 knock-down neurons and control neurons. Consistent with a previous study (Hering and Sheng, 2003), cortactin was highly enriched at dendritic spines in control neurons. In CTTNBP2 knock-down neurons, the density and size of the dendritic spines was reduced (Fig. 8A), with mature spines preserved in few CTTNBP2 knock-down neurons. In these residual dendritic spines, the enrichment of cortactin was reduced (Fig. 8A). A line scan starting from the tip of the dendritic spine and ending on the other side of the dendritic shaft was then performed to quantify the intensity of cortactin at spines and dendrites. Our quantitative analysis revealed a reduction in the cortactin protein levels at the dendritic spines in CTTNBP2 knock-down neurons (Fig. 8B). We noticed that the global intensity of cortactin in CTTNBP2 knock-down neurons seemed lower than that in control neurons. It is possible that knockdown of CTTNBP2 influences the levels of cortactin protein in neurons. We then compared the ratio of the cortactin protein level at the spines to that at the dendrites. In control neurons, the ratio was 3.8 (the peak of cortactin intensity/the mean of cortactin intensity from a distance of 2.5–3.5 μm = 149.4/39.6). When CTTNBP2 was knocked down, the ratio dropped to 2.4 (67.9/28.2). Therefore, the global reduction in cortactin protein levels is unlikely to be the main cause of the reduction in cortactin enrichment at the spines. Together, these data support the notion that CTTNBP2 regulates the dendritic spine distribution of cortactin in neurons.
Figure 8.
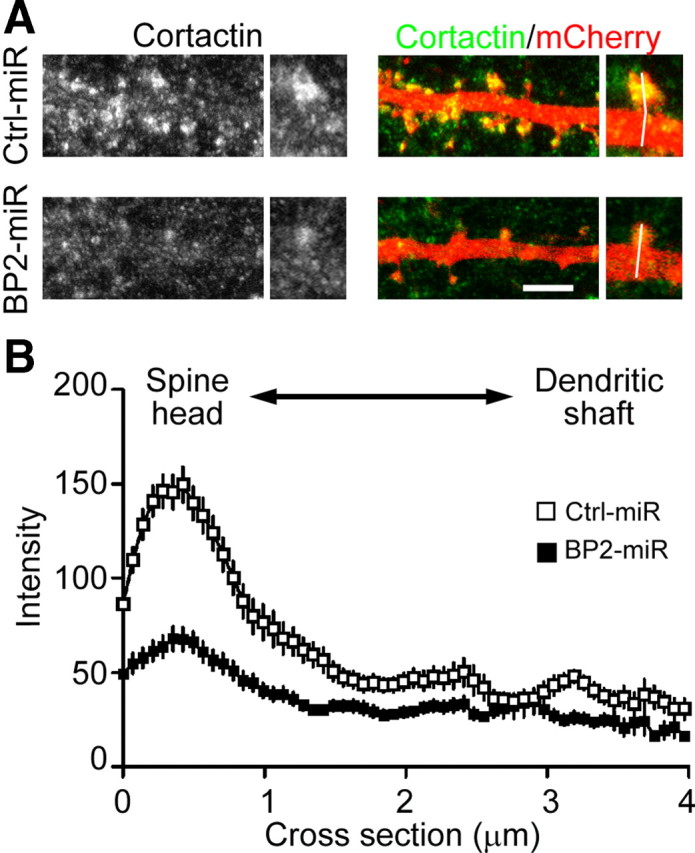
Knockdown of CTTNBP2 reduces the dendritic spine distribution of cortactin. Cultured rat hippocampal neurons were transfected with Ctrl-miR(mCherry) or BP2-miR(mCherry) at 12 DIV and fixed for staining at 18 DIV using cortactin antibody. Cortactin was visualized by Alexa Fluor 488. mCherry signals were used to outlined neuronal morphology. A, Representative images of the distribution of cortactin along dendrites. The 3-pixel-width lines in the enlarged images indicate the paths for line scanning, which start from the tip of dendritic spines and then cross the dendritic shaft. Scale bar, 5 μm. B, Quantitative analysis of cortactin distribution by line scan. More than 35 spines collected from seven neurons were analyzed for each group. The means ± SEM of fluorescence intensity along the path from dendritic spine to dendritic shaft are provided.
Discussion
Here we have characterized the distribution and function of CTTNBP2 in neurons. CTTNBP2 proteins, which are specifically expressed in neurons (Ohoka and Takai, 1998), are highly concentrated at the dendritic spines of cultured hippocampal neurons and brains. Knockdown of CTTNBP2 reduced the density and size of dendritic spines, supporting a role for CTTNBP2 in dendritic spine formation and maintenance. Our observations also suggest that CTTNBP2 interacts with and immobilizes cortactin at dendritic spines and functions upstream of cortactin to control dendritic spine density.
Through interactions with F-actin and the Arp2/3 complex, cortactin is believed to facilitate actin polymerization and branching (Weaver et al., 2001). It thus controls enlargement of the dendritic spines and maintenance of dendritic spine morphology (Hering and Sheng, 2003). When neurons were treated with glutamate, cortactin dispersed to the dendritic shafts. However, CTTNBP2 stably resided in dendritic spines and controlled the mobility of cortactin. Shank, another protein that interacts with the SH3 domain of cortactin, also remains at the postsynaptic density after glutamate treatment (Naisbitt et al., 1999; Tao-Cheng et al., 2010). Although it is unclear whether Shank also regulates the mobility of cortactin in dendritic spines, it is possible that multiple binding partners participate in this regulation.
Through these interactions with binding partners, cortactin targets various upstream protein complexes and receives signals to influence dendritic spine formation. Since NMDAR activation triggers translocation of cortactin from the dendritic spines to the dendritic shaft, unknown signals downstream of NMDAR may regulate the interaction of cortactin and CTTNBP2. Given that cortactin is highly phosphorylated on tyrosine, serine, and threonine residues by Src family kinase and ERK (Martin et al., 2006), and that phosphorylation modulates cortactin function (Huang et al., 1998; Ammer and Weed, 2008; Ren et al., 2009; Kelley et al., 2010), protein phosphorylation may regulate the interaction between cortactin and CTTNBP2.
A previous proteomics study indicated that CTTNBP2 N terminus-like (CTTNBP2NL), a molecule sharing 54% amino acid similarity with CTTNBP2, associates with the serine/threonine protein phosphatase 2A (PP2A) protein complex in HEK293 cells (Goudreault et al., 2009). Since the PP2A complex contains striatins (Goudreault et al., 2009), which are highly enriched at dendritic spines (Gaillard et al., 2006), it seems possible that CTTNBP2 associates with the PP2A complex in neurons. Since cortactin is regulated by phosphorylation, if CTTNBP2 interacts with the PP2A complex, it is likely that PP2A dephosphorylates cortactin or CTTNBP2 and thus modulates the activity of cortactin and CTTNBP2 in controlling F-actin polymerization and actin branching (Fig. 9A).
Figure 9.
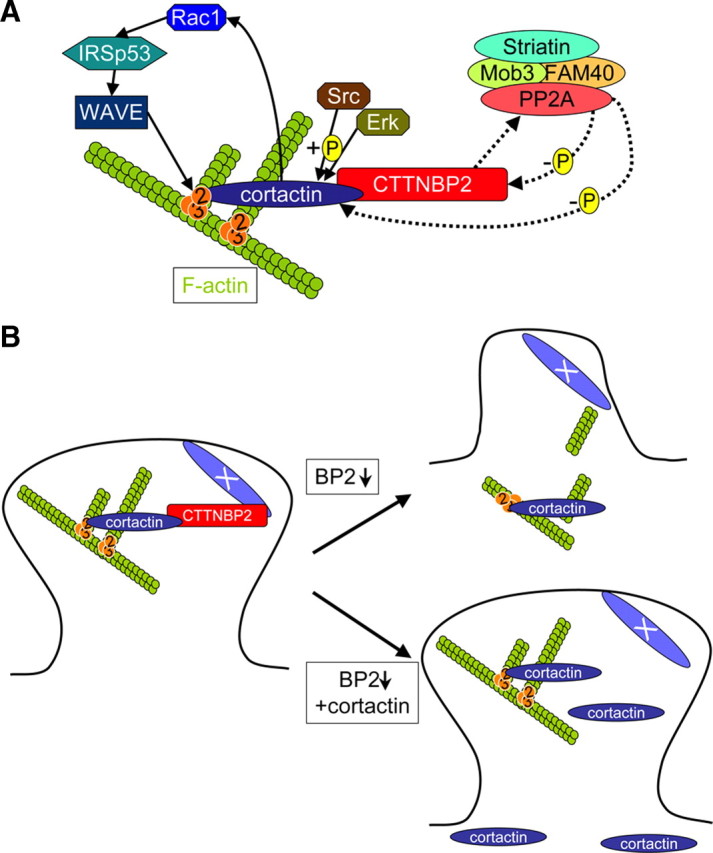
Model of the function of CTTNBP2 at dendritic spines. A, Protein–protein interactions of CTTNBP2 and cortactin and the potential regulatory signals of actin cytoskeleton dynamics. Cortactin interacts with the Arp2/3 complex through its N-terminal region and binds F-actin via the middle repeat domains. The C-terminal SH3 domain of cortactin is the binding site for CTTNBP2. Src and ERK phosphorylation of cortactin influences the activity of cortactin. In addition to directly binding to the F-actin cytoskeleton, cortactin may also regulate F-actin branching through the Rac1-IRSp53-WAVE pathway. CTTNBP2NL, a molecule sharing similarity with CTTNBP2, associates with the PP2A protein complex, which contains PP2A, striatins, Mob3, and FAM40A/B. Striatins are highly enriched at dendritic spines (Gaillard et al., 2006), and the Mob protein family has been shown to regulate synapse formation in Drosophila (Schulte et al., 2010). FAM40A and FAM40B have recently been shown to modulate the actin cytoskeleton (Bai et al., 2011). It is unclear whether CTTNBP2 also associates with the PP2A complex in neurons; if so, the PP2A complex likely dephosphorylates the cortactin–CTTNBP2 complex and regulates F-actin dynamics. B, CTTNBP2 regulates cortactin distribution at dendritic spines and thus maintains spine structure. The presence of CTTNBP2 targets cortactin to the dendritic spines. When CTTNBP2 is knocked down, cortactin is not efficiently targeted to dendritic spines, leading to shrinkage of the spines. When cortactin is overexpressed in CTTNBP2 knock-down neurons, the ectopic distribution of cortactin into the dendritic spines maintains the spine structure and rescues the defects caused by CTTNBP2 knockdown. Thus far, it is unclear what mechanism or molecule anchors CTTNBP2 at the dendritic spines.
Actin polymerization and branching have been suggested to play an essential role in the enlargement of dendritic spines (for review, see Ethell and Pasquale, 2005; Tada and Sheng, 2006). Rac1, a small GTPase protein, is known to promote actin branching and polymerization through the pathway containing the insulin receptor substrate p53 (IRSp53), neural-Wiskott–Aldrich syndrome protein or WASP family verprolin-homologous protein, and the Arp2/3 complex (for review, see Ethell and Pasquale, 2005). Recently, cortactin was also shown to regulate cellular mobility and actin cytoskeleton dynamics via regulation of Rac1 (Lai et al., 2009). Thus, cortactin may use two mechanisms to regulate actin cytoskeleton dynamics: direct binding to F-actin and the Arp2/3 complex, and via control of Rac1 activity (Fig. 9A).
Our data suggest that CTTNBP2 is required for anchoring cortactin at dendritic spines. CTTNBP2 may thus direct cortactin-dependent actin dynamics at dendritic spines and control spine morphology and density. When CTTNBP2 protein levels are reduced, endogenous cortactin is unable to target dendritic spines to maintain the structure of these spines. When cortactin is overexpressed in CTTNBP2 knock-down neurons, cortactin ectopically distributes into the dendritic spines, thus rescuing the spine defects caused by CTTNBP2 knockdown (Fig. 9B).
It is not yet clear how CTTNBP2 stably resides at dendritic spines. If CTTNBP2 associates with the striatin–PP2A protein complex, similar to CTTNBP2NL (Gaillard et al., 2006; Goudreault et al., 2009), it will be interesting to examine whether the PP2A complex is involved in the CTTNBP2 distribution in dendritic spines. On the other hand, it is also possible that synaptic distribution of the PP2A complex is dependent on CTTNBP2.
Synapses, the sites where neurons transmit signals to other cells, may be compromised in autism or other psychiatric disorders. The Shank protein family interacts with cortactin to regulate the size and/or density of dendritic spines (Sala et al., 2001; Hung et al., 2008; Durand et al., 2011). Human genetic studies have demonstrated the association of Shank3 mutations with autism or other psychiatric disorders (Bonaglia et al., 2001; Durand et al., 2007; Moessner et al., 2007). Interestingly, chromosome 7q31, the location of CTTNBP2, is an autism candidate region. The contribution of CTTNBP2 to dendritic spine formation highlights the possibility that CTTNBP2 participates in controlling cognitive functions related to autism or other psychiatric disorders.
Although the full-length human CTTNBP2 sequence encodes a large protein of up to 1663 aa residues (Cheung et al., 2001), we identified three splicing variants of CTTNBP2 and demonstrated that the short form is the major protein product in the brain. The sequence around the alternative splicing sites is highly conserved from human to chicken (data not shown), suggesting that expression of CTTNBP2 splicing variants is conserved. To explore the role of CTTNBP2 in autism, it will be critical to focus on mutations located before exon 5 of CTTNBP2, since the C-terminal half of the CTTNBP2 long-form protein is not present or exists in limited amounts in neurons.
Exogenous CTTNBP2 proteins in COS cells are colocalized with cortactin and enriched at the cell cortex (lamellipodia and intracellular puncta); a similar distribution of GFP-cortactin was reported in NIH3T3 cells (Kaksonen et al., 2000). Cortactin has been implicated in endocytosis because cortactin localizes with clathrin-coated pits (Cao et al., 2003, 2010) and because the knockdown of cortactin impairs endocytosis (Zhu et al., 2005). Cortactin may bind dynamin and thus couple the F-actin beneath the plasma membrane to endocytic vesicles, providing physical force to separate endocytic vesicles from the plasma membrane (Zhu et al., 2005). A recent investigation has demonstrated that cortactin is required for endosomal segregation from early endosomes to late/recycling endosomes (Ohashi et al., 2011). We also observed punctate colocalization of CTTNBP2 and cortactin, particularly in time-lapse imaging. Intracellular vesicles always associated with cortactin/CTTNBP2 puncta in COS cells, and thus CTTNBP2 is likely also involved in endocytosis in neurons.
Footnotes
This work was supported by grants from Academia Sinica (AS-100-TP-B09 to Y.-P. H.) and the National Science Council (NSC 99-2321-B-001-032 and NSC 100-2321-B-001-022 to Y.-P. H.). We thank Dr. Morgan Sheng for the cortactin constructs; Dr. Roger Tsien for the mCherry plasmid; and the Electrophysiology and Calcium Imaging Core Facility, Neuroscience Program and Institute of Molecular Biology, Academia Sinica, and Drs. Tzyy-Nan Huang and Chiung-Ya Chen for technical support.
The authors declare no conflicting financial interests.
References
- Ammer AG, Weed SA. Cortactin branches out: roles in regulating protrusive actin dynamics. Cell Motil Cytoskeleton. 2008;65:687–707. doi: 10.1002/cm.20296. [DOI] [PMC free article] [PubMed] [Google Scholar]
- Bai SW, Herrera-Abreu MT, Rohn JL, Racine V, Tajadura V, Suryavanshi N, Bechtel S, Wiemann S, Baum B, Ridley AJ. Identification and characterization of a set of conserved and new regulators of cytoskeletal organisation, cell morphology and migration. BMC Biol. 2011;9:54. doi: 10.1186/1741-7007-9-54. [DOI] [PMC free article] [PubMed] [Google Scholar]
- Bonaglia MC, Giorda R, Borgatti R, Felisari G, Gagliardi C, Selicorni A, Zuffardi O. Disruption of the ProSAP2 gene in a t(12;22)(q24.1;q13.3) is associated with the 22q13.3 deletion syndrome. Am J Hum Genet. 2001;69:261–268. doi: 10.1086/321293. [DOI] [PMC free article] [PubMed] [Google Scholar]
- Cao H, Orth JD, Chen J, Weller SG, Heuser JE, McNiven MA. Cortactin is a component of clathrin-coated pits and participates in receptor-mediated endocytosis. Mol Cell Biol. 2003;23:2162–2170. doi: 10.1128/MCB.23.6.2162-2170.2003. [DOI] [PMC free article] [PubMed] [Google Scholar]
- Cao H, Chen J, Krueger EW, McNiven MA. SRC-mediated phosphorylation of dynamin and cortactin regulates the “constitutive” endocytosis of transferrin. Mol Cell Biol. 2010;30:781–792. doi: 10.1128/MCB.00330-09. [DOI] [PMC free article] [PubMed] [Google Scholar]
- Chao HW, Hong CJ, Huang TN, Lin YL, Hsueh YP. SUMOylation of the MAGUK protein CASK regulates dendritic spinogenesis. J Cell Biol. 2008;182:141–155. doi: 10.1083/jcb.200712094. [DOI] [PMC free article] [PubMed] [Google Scholar]
- Cheung J, Petek E, Nakabayashi K, Tsui LC, Vincent JB, Scherer SW. Identification of the human cortactin-binding protein-2 gene from the autism candidate region at 7q31. Genomics. 2001;78:7–11. doi: 10.1006/geno.2001.6651. [DOI] [PubMed] [Google Scholar]
- Cosen-Binker LI, Kapus A. Cortactin: the gray eminence of the cytoskeleton. Physiology (Bethesda) 2006;21:352–361. doi: 10.1152/physiol.00012.2006. [DOI] [PubMed] [Google Scholar]
- Du Y, Weed SA, Xiong WC, Marshall TD, Parsons JT. Identification of a novel cortactin SH3 domain-binding protein and its localization to growth cones of cultured neurons. Mol Cell Biol. 1998;18:5838–5851. doi: 10.1128/mcb.18.10.5838. [DOI] [PMC free article] [PubMed] [Google Scholar]
- Durand CM, Betancur C, Boeckers TM, Bockmann J, Chaste P, Fauchereau F, Nygren G, Rastam M, Gillberg IC, Anckarsäter H, Sponheim E, Goubran-Botros H, Delorme R, Chabane N, Mouren-Simeoni MC, de Mas P, Bieth E, Rogé B, Héron D, Burglen L, et al. Mutations in the gene encoding the synaptic scaffolding protein SHANK3 are associated with autism spectrum disorders. Nat Genet. 2007;39:25–27. doi: 10.1038/ng1933. [DOI] [PMC free article] [PubMed] [Google Scholar]
- Durand CM, Perroy J, Loll F, Perrais D, Fagni L, Bourgeron T, Montcouquiol M, Sans N. SHANK3 mutations identified in autism lead to modification of dendritic spine morphology via an actin-dependent mechanism. Mol Psychiatry. 2011 doi: 10.1038/mp.2011.57. [DOI] [PMC free article] [PubMed] [Google Scholar]
- Ethell IM, Pasquale EB. Molecular mechanisms of dendritic spine development and remodeling. Prog Neurobiol. 2005;75:161–205. doi: 10.1016/j.pneurobio.2005.02.003. [DOI] [PubMed] [Google Scholar]
- Fischer M, Kaech S, Wagner U, Brinkhaus H, Matus A. Glutamate receptors regulate actin-based plasticity in dendritic spines. Nat Neurosci. 2000;3:887–894. doi: 10.1038/78791. [DOI] [PubMed] [Google Scholar]
- Gaillard S, Bailly Y, Benoist M, Rakitina T, Kessler JP, Fronzaroli-Molinières L, Dargent B, Castets F. Targeting of proteins of the striatin family to dendritic spines: role of the coiled-coil domain. Traffic. 2006;7:74–84. doi: 10.1111/j.1600-0854.2005.00363.x. [DOI] [PubMed] [Google Scholar]
- Goudreault M, D'Ambrosio LM, Kean MJ, Mullin MJ, Larsen BG, Sanchez A, Chaudhry S, Chen GI, Sicheri F, Nesvizhskii AI, Aebersold R, Raught B, Gingras AC. A PP2A phosphatase high density interaction network identifies a novel striatin-interacting phosphatase and kinase complex linked to the cerebral cavernous malformation 3 (CCM3) protein. Mol Cell Proteomics. 2009;8:157–171. doi: 10.1074/mcp.M800266-MCP200. [DOI] [PMC free article] [PubMed] [Google Scholar]
- Harris KM, Stevens JK. Dendritic spines of CA 1 pyramidal cells in the rat hippocampus: serial electron microscopy with reference to their biophysical characteristics. J Neurosci. 1989;9:2982–2997. doi: 10.1523/JNEUROSCI.09-08-02982.1989. [DOI] [PMC free article] [PubMed] [Google Scholar]
- Hering H, Sheng M. Activity-dependent redistribution and essential role of cortactin in dendritic spine morphogenesis. J Neurosci. 2003;23:11759–11769. doi: 10.1523/JNEUROSCI.23-37-11759.2003. [DOI] [PMC free article] [PubMed] [Google Scholar]
- Huang C, Liu J, Haudenschild CC, Zhan X. The role of tyrosine phosphorylation of cortactin in the locomotion of endothelial cells. J Biol Chem. 1998;273:25770–25776. doi: 10.1074/jbc.273.40.25770. [DOI] [PubMed] [Google Scholar]
- Hung AY, Futai K, Sala C, Valtschanoff JG, Ryu J, Woodworth MA, Kidd FL, Sung CC, Miyakawa T, Bear MF, Weinberg RJ, Sheng M. Smaller dendritic spines, weaker synaptic transmission, but enhanced spatial learning in mice lacking Shank1. J Neurosci. 2008;28:1697–1708. doi: 10.1523/JNEUROSCI.3032-07.2008. [DOI] [PMC free article] [PubMed] [Google Scholar]
- Kaksonen M, Peng HB, Rauvala H. Association of cortactin with dynamic actin in lamellipodia and on endosomal vesicles. J Cell Sci. 2000;113:4421–4426. doi: 10.1242/jcs.113.24.4421. [DOI] [PubMed] [Google Scholar]
- Kelley LC, Hayes KE, Ammer AG, Martin KH, Weed SA. Cortactin phosphorylated by ERK1/2 localizes to sites of dynamic actin regulation and is required for carcinoma lamellipodia persistence. PLoS One. 2010;5:e13847. doi: 10.1371/journal.pone.0013847. [DOI] [PMC free article] [PubMed] [Google Scholar]
- Lai FP, Szczodrak M, Oelkers JM, Ladwein M, Acconcia F, Benesch S, Auinger S, Faix J, Small JV, Polo S, Stradal TE, Rottner K. Cortactin promotes migration and platelet-derived growth factor-induced actin reorganization by signaling to Rho-GTPases. Mol Biol Cell. 2009;20:3209–3223. doi: 10.1091/mbc.E08-12-1180. [DOI] [PMC free article] [PubMed] [Google Scholar]
- Martin KH, Jeffery ED, Grigera PR, Shabanowitz J, Hunt DF, Parsons JT. Cortactin phosphorylation sites mapped by mass spectrometry. J Cell Sci. 2006;119:2851–2853. doi: 10.1242/jcs.03034. [DOI] [PubMed] [Google Scholar]
- Matus A. Actin-based plasticity in dendritic spines. Science. 2000;290:754–758. doi: 10.1126/science.290.5492.754. [DOI] [PubMed] [Google Scholar]
- Moessner R, Marshall CR, Sutcliffe JS, Skaug J, Pinto D, Vincent J, Zwaigenbaum L, Fernandez B, Roberts W, Szatmari P, Scherer SW. Contribution of SHANK3 mutations to autism spectrum disorder. Am J Hum Genet. 2007;81:1289–1297. doi: 10.1086/522590. [DOI] [PMC free article] [PubMed] [Google Scholar]
- Naisbitt S, Kim E, Tu JC, Xiao B, Sala C, Valtschanoff J, Weinberg RJ, Worley PF, Sheng M. Shank, a novel family of postsynaptic density proteins that binds to the NMDA receptor/PSD-95/GKAP complex and cortactin. Neuron. 1999;23:569–582. doi: 10.1016/s0896-6273(00)80809-0. [DOI] [PubMed] [Google Scholar]
- Ohashi E, Tanabe K, Henmi Y, Mesaki K, Kobayashi Y, Takei K. Receptor sorting within endosomal trafficking pathway is facilitated by dynamic actin filaments. PLoS One. 2011;6:e19942. doi: 10.1371/journal.pone.0019942. [DOI] [PMC free article] [PubMed] [Google Scholar]
- Ohoka Y, Takai Y. Isolation and characterization of cortactin isoforms and a novel cortactin-binding protein, CBP90. Genes Cells. 1998;3:603–612. doi: 10.1046/j.1365-2443.1998.00216.x. [DOI] [PubMed] [Google Scholar]
- Pontrello CG, Ethell IM. Accelerators, brakes, and gears of actin dynamics in dendritic spines. Open Neurosci J. 2009;3:67–86. doi: 10.2174/1874082000903020067. [DOI] [PMC free article] [PubMed] [Google Scholar]
- Ren G, Crampton MS, Yap AS. Cortactin: coordinating adhesion and the actin cytoskeleton at cellular protrusions. Cell Motil Cytoskeleton. 2009;66:865–873. doi: 10.1002/cm.20380. [DOI] [PubMed] [Google Scholar]
- Sala C, Piëch V, Wilson NR, Passafaro M, Liu G, Sheng M. Regulation of dendritic spine morphology and synaptic function by Shank and Homer. Neuron. 2001;31:115–130. doi: 10.1016/s0896-6273(01)00339-7. [DOI] [PubMed] [Google Scholar]
- Schulte J, Sepp KJ, Jorquera RA, Wu C, Song Y, Hong P, Littleton JT. DMob4/Phocein regulates synapse formation, axonal transport, and microtubule organization. J Neurosci. 2010;30:5189–5203. doi: 10.1523/JNEUROSCI.5823-09.2010. [DOI] [PMC free article] [PubMed] [Google Scholar]
- Tada T, Sheng M. Molecular mechanisms of dendritic spine morphogenesis. Curr Opin Neurobiol. 2006;16:95–101. doi: 10.1016/j.conb.2005.12.001. [DOI] [PubMed] [Google Scholar]
- Tao-Cheng JH, Dosemeci A, Gallant PE, Smith C, Reese T. Activity induced changes in the distribution of Shanks at hippocampal synapses. Neuroscience. 2010;168:11–17. doi: 10.1016/j.neuroscience.2010.03.041. [DOI] [PMC free article] [PubMed] [Google Scholar]
- Tu JC, Xiao B, Naisbitt S, Yuan JP, Petralia RS, Brakeman P, Doan A, Aakalu VK, Lanahan AA, Sheng M, Worley PF. Coupling of mGluR/Homer and PSD-95 complexes by the Shank family of postsynaptic density proteins. Neuron. 1999;23:583–592. doi: 10.1016/s0896-6273(00)80810-7. [DOI] [PubMed] [Google Scholar]
- Uruno T, Liu J, Zhang P, Fan Yx, Egile C, Li R, Mueller SC, Zhan X. Activation of Arp2/3 complex-mediated actin polymerization by cortactin. Nat Cell Biol. 2001;3:259–266. doi: 10.1038/35060051. [DOI] [PubMed] [Google Scholar]
- Weaver AM, Karginov AV, Kinley AW, Weed SA, Li Y, Parsons JT, Cooper JA. Cortactin promotes and stabilizes Arp2/3-induced actin filament network formation. Curr Biol. 2001;11:370–374. doi: 10.1016/s0960-9822(01)00098-7. [DOI] [PubMed] [Google Scholar]
- Weed SA, Karginov AV, Schafer DA, Weaver AM, Kinley AW, Cooper JA, Parsons JT. Cortactin localization to sites of actin assembly in lamellipodia requires interactions with F-actin and the Arp2/3 complex. J Cell Biol. 2000;151:29–40. doi: 10.1083/jcb.151.1.29. [DOI] [PMC free article] [PubMed] [Google Scholar]
- Wu H, Parsons JT. Cortactin, an 80/85-kilodalton pp60src substrate, is a filamentous actin-binding protein enriched in the cell cortex. J Cell Biol. 1993;120:1417–1426. doi: 10.1083/jcb.120.6.1417. [DOI] [PMC free article] [PubMed] [Google Scholar]
- Zhu J, Zhou K, Hao JJ, Liu J, Smith N, Zhan X. Regulation of cortactin/dynamin interaction by actin polymerization during the fission of clathrin-coated pits. J Cell Sci. 2005;118:807–817. doi: 10.1242/jcs.01668. [DOI] [PubMed] [Google Scholar]
- Ziv NE, Smith SJ. Evidence for a role of dendritic filopodia in synaptogenesis and spine formation. Neuron. 1996;17:91–102. doi: 10.1016/s0896-6273(00)80283-4. [DOI] [PubMed] [Google Scholar]