

Abstract
When a salient object in the visual field captures attention, the neural representation of that object is enhanced at the expense of competing stimuli. How neural activity evoked by a salient stimulus evolves to take precedence over the neural activity evoked by other stimuli is a matter of intensive investigation. Here, we describe in pigeons (Columba livia) how retinal inputs to the optic tectum (TeO, superior colliculus in mammals), triggered by moving stimuli, are selectively relayed on to the rotundus (Rt, caudal pulvinar) in the thalamus, and to its pallial target, the entopallium (E, extrastriate cortex). We show that two satellite nuclei of the TeO, the nucleus isthmi parvocelullaris (Ipc) and isthmi semilunaris (SLu), send synchronized feedback signals across tectal layers. Preventing the feedback from Ipc but not from SLu to a tectal location suppresses visual responses to moving stimuli from the corresponding region of visual space in all Rt subdivisions. In addition, the bursting feedback from the Ipc imprints a bursting rhythm on the visual signals, such that the visual responses of the Rt and the E acquire a bursting modulation significantly synchronized to the feedback from Ipc. As the Ipc feedback signals are selected by competitive interactions, the visual responses within the receptive fields in the Rt tend to synchronize with the tectal location receiving the “winning” feedback from Ipc. We propose that this selective transmission of afferent activity combined with the cross-regional synchronization of the areas involved represents a bottom-up mechanism by which salient stimuli capture attention.
Introduction
Salient visual stimuli, like the sudden motion of an object, capture attention by recruiting attentive mechanisms that enhance the neuronal representation of the salient object at the expense of competing stimuli (for review, see Desimone and Duncan, 1995; Connor et al., 2004; Reynolds and Chelazzi, 2004; Mulckhuyse and Theeuwes, 2010). This selective enhancement presumably requires recursive connections across neural stages and inhibitory interactions among competing representations (Itti and Koch, 2001; Knudsen, 2007; Soltani and Koch, 2010). Here, we describe feedback signals from the isthmic region to the optic tectum (TeO) of the pigeon that selectively boost the propagation of visual inputs from selected tectal locations to higher visual areas. Because the feedback signal's location in the tectal visual map is controlled by suppressive interactions (Marín et al., 2007, Asadollahi et al., 2010; 2011), only the strongest visual inputs reach higher brain areas.
In birds, the superficial layers of TeO contain a fine-grained map representing the visual field of the contralateral eye (Hunt and Webster, 1975; Angaut and Repérant, 1976) (for review, see, Luksch, 2003; Wylie et al., 2009). Tectal ganglion cells (TGCs) in deeper layers pool this precise retinotopy and project to the thalamic nucleus rotundus (Fig. 1A,B) (Benowitz and Karten, 1976; Karten et al., 1997; Luksch et al., 1998; Hellmann and Güntürkün, 2001; Luksch et al., 2001; Marín et al., 2003), resulting in large receptive fields (RFs), which typically would contain several stimuli simultaneously.
Figure 1.
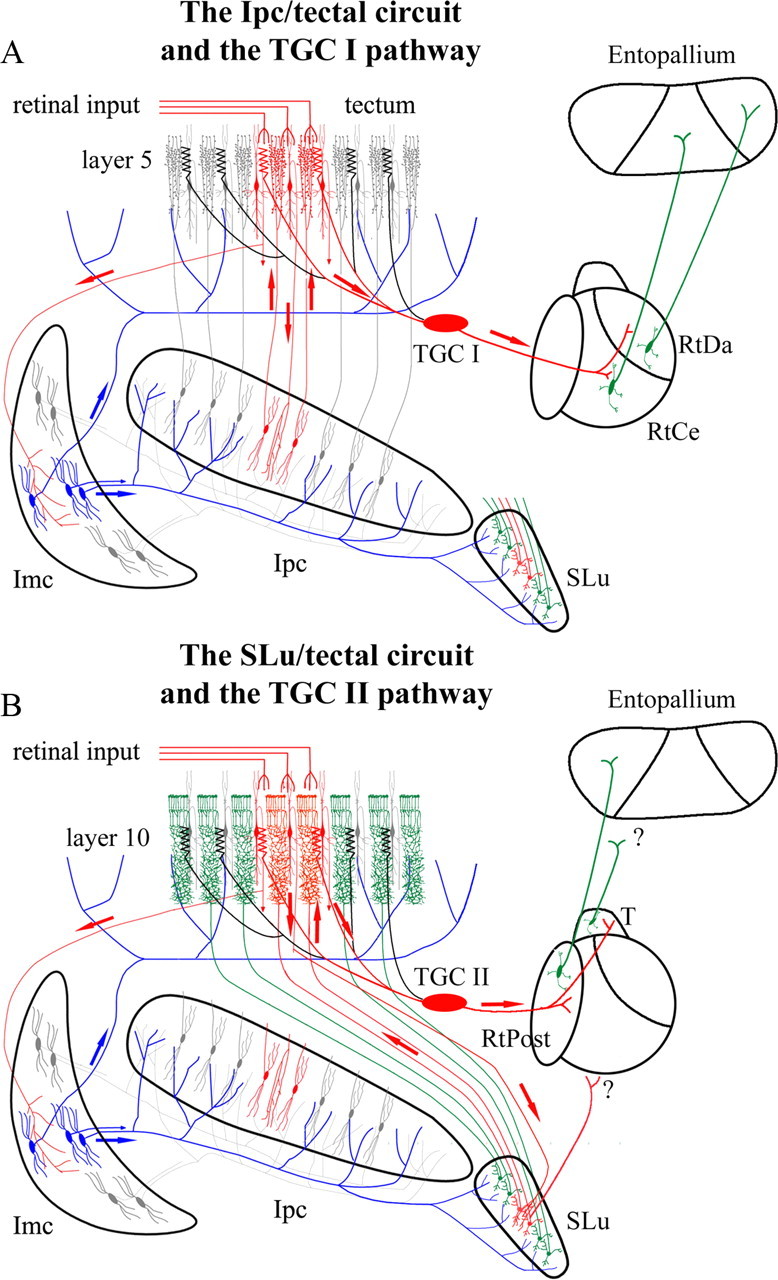
The isthmotectal circuit and the hypothetical control of the tectofugal pathway. A, Schematic of the Ipc–tectal circuit. Tectal shepherd-crook projects to the Ipc, Imc, and SLu; each Ipc neuron sends back a columnar axon densely ramifying in superficial tectal layers; Imc neurons send wide-field axons to the Ipc, SLu, and TeO. Type I tectal ganglion cells, with dendritic specializations overlapping Ipc axon terminals, project to the RtDa and RtCe subdivisions of the Rt, which in turn project to corresponding subdivisions in the entopallium. B, Schematic of the SLu–tectal circuit. Each neuron from the SLu receiving the shepherd-crook input sends back a columnar axon densely ramifying in deeper tectal layers. Type II TGCs with dendritic specializations overlapping SLu axon terminals send axonal projections to the RtPost and triangularis (T) divisions of the Rt. A retinal input arriving at the superficial tectal layers will activate a local feedback response from the Ipc and SLu (in red), and a widespread inhibition in the TeO, Ipc, and SLu mediated by the activation of Imc neurons (in blue). Activated TGCs will transmit this visual activity to the corresponding divisions in the Rt (adapted with permission from Wang et al., 2006).
The optic tectum is reciprocally connected with three nuclei in the isthmic complex, the nucleus isthmi pars magnocellularis (Imc), pars parvocellularis (Ipc), and pars semilunaris (SLu), each of which receives a prominent visual projection from neurons in tectal layer ten (Hunt et al., 1977; Güntürkün and Remy, 1990; Hellmann et al., 2001; Wang et al., 2004; Wang et al., 2006). Imc neurons have large GABAergic terminal fields providing wide-field inhibition throughout Ipc, SLu, and the deep layers of TeO (Wang et al., 2004; Marín et al., 2007). Ipc and SLu neurons project back to TeO in a precise homotopic fashion, via columnar axons that densely ramify in complementary layers (Wang et al., 2006). It has been proposed that this complementary arrangement could differentially control the ascending visual streams mediated by the different TGC classes, each class projecting to specific Rt subdivisions (Wang et al., 2006) (Fig. 1, details).
In a previous study, we showed that retinal afferent volleys triggered by salient moving stimuli are transmitted to the dorsal anterior division of the nucleus rotundus (RtDa) only if boosted by feedback signals from Ipc (Marín et al., 2007). We now extend this analysis to the effects on all Rt subdivisions and its target the entopallium (E), as well as test for an analogous role for the SLu feedback. We find that both Ipc and SLu send synchronized visual responses to the tectum, but only Ipc selects which afferent activity propagates to the different Rt subdivisions and to the entopallium. We propose that this selective transmission of afferent activity, combined with a cross-regional synchronization across areas, constitutes attentional selection of particular afferent volleys.
Materials and Methods
Experiments were conducted on 44 feral pigeons (300–350 g) of both sexes, obtained from a local dealer and maintained in an institutional facility. All procedures were approved by the Ethics Committee of the Science Faculty of the University of Chile and conformed to the guidelines of the NIH on the use of animals in experimental research.
Surgical procedures.
The pigeons were anesthetized by an intramuscular injection of ketamine (75 mg/kg) and xylazine (5 mg/kg) and placed in the standard stereotaxic position (Karten and Hodos, 1967) in a stereotaxic frame that did not interfere with the animal's visual field. Anesthesia was maintained during surgery and throughout the recording process by infusing 15% of the initial dose every 90 min via an intramuscular cannula. During the experiment, the body temperature of the animal was kept between 38–42°C by means of a thermo-regulated blanket (FHC). Two small windows were opened in the right side of the skull, exposing the dorsal–lateral part of the tectum and the telencephalic regions lying above the rotundus and the entopallium. The dura overlying these structures was removed and the exposed surface covered with 3% agar saline solution.
Physiological recordings.
Extracellular recordings were performed in the tectum, the rotundus, the entopallium, the Ipc, and the SLu using tungsten microelectrodes (1–2 MOhms) and a multichannel amplifier (model 3600, AM System). A silver chloride wire was implanted in the bone in contact with the agar saline as a reference electrode. The tectum and the isthmi were approached through the bone window in vertical or oblique penetrations using hydraulic manipulators (Narishige). The Rt subdivisions and the E were approached with an array of four tungsten electrodes, arranged every 350 μm from anterior to posterior, each lowered independently with a motorized manipulator (Alpha-Omega). The usual strategy was to find the rostral portion of the nuclei by performing exploratory penetrations with the most anterior electrode of the array. Visual responses recorded in the anterior part of both the Rt and E are mostly evoked by stimuli in the anterior–inferior visual field, and have a characteristically marked bursting profile. As the extent of the anterior/posterior axis of the Rt and E is ∼2 and 3 mm, respectively, the rest of the array reached the target at comparable depths.
Depending on the experiment, two recording configurations were generally used. To investigate the synchronization between the isthmi and the Rt or E, two electrodes were placed in approximately homotopic positions in the SLu and Ipc. To attain this condition, electrode penetrations were first aimed at the medial tip of the Ipc, which had the RFs located very low and medial in the visual field. As the head was tilted down 45 degrees, these RFs usually pointed to the birds' breast or neck. From this position, the electrode penetrations were shifted medially, in 50 μm steps, until spike activity was found displaying both the characteristic SLu properties (see Results) and, given the retinotopy of the nucleus, visual responses from RFs located high in the visual field. Thereafter, the second electrode was positioned in the Ipc, and relocated as necessary to obtain overlapping RFs. Generally, two to five penetrations in each nucleus were required to reach this condition. These overlapped RFs normally rested inside the very large RFs of at least two or three recording sites in the Rt or E, allowing the recording of simultaneous responses in all structures with a single moving stimulus. To investigate how the responses in the Rt were affected when the isthmic feedback shifted from one tectal location to another, bursting responses originating from Ipc axons (Marín et al., 2005) were recorded with two separate microelectrodes in the superficial layers of the TeO, such that their respective non-overlapped RFs were also included within the RFs in the Rt. To trace the recording tracts in the Rt and E, the tungsten microelectrodes were immersed before recording in a 2% DiI and 95% ethanol solution, and allowed to dry for a few minutes. By this procedure, each penetration left an intense fluorescent tract, which could be observed in coronal sections under an epifluorescent microscope. Recording sites in the SLu and selected tracts in the Rt were marked with electrolytic lesions by passing 6 μA of positive current for 6 s through the tungsten electrode.
To transiently inactivate a locus in the Ipc or SLu, the recording microelectrodes inserted in each nucleus were replaced by three-barreled glass microelectrodes, with individual tip diameters of 12–15 μm. One barrel was filled with 0.5 m sodium acetate for recording, another was filled with either 2% lidocaine or the AMPA/KA receptor antagonist CNQX (250 μm in saline) for inactivation, and the third barrel was filled with 2% rhodamine for marking the injection site. This microelectrode was lowered into the SLu or Ipc by monitoring the visual responses through the recording barrel. Transient inactivation was attained by injecting 3–15 micro-drops (6–30 nl of total volume) of either lidocaine or CNQX, using a picospritzer (Parker). The release of the drug was monitored by the loss of neural activity at the injection site. The location and extent of the injection was estimated with the fluorescent marker.
Visual stimulation.
Visual stimulation consisted of small (0.5–5 deg) bright spots (red or white, 20–25 candles/m2) over a dark background presented on two 17 inch cathode ray tube monitors placed 20–50 cm from the pigeon's eye. After mapping the RFs of the recording sites with a hand-held laser beam, spots were moved within the RFs at 5–50 deg/s, using a computer-based stimulus generator synchronized to the recording system (Leonardo, Lohmann Research Equipment). In the experiments investigating the synchronization between the isthmi and the Rt, one monitor was centered on the common RF and a spot swept the screen from top to bottom in 15 equidistant, horizontal sweeps, each starting 1 s after the end of the previous one. In the experiments investigating how the responses in the Rt were affected when the isthmic feedback to the TeO shifted from one tectal location to another, one monitor was centered on each tectal RF. The RFs were then stimulated with a single sweep, either one at a time, simultaneously or sequentially. In the last case, a second spot started to move while the first was midway through its movement. Stimuli were repeated at least 10 times for each recording configuration.
Data acquisition and analysis.
All physiological data were sampled continuously at 20 kHz, with a bandpass of 3 Hz to 10 Khz, using a standard PC computer with a 16 channel A/D converter board (National Instruments). Data acquisition and off-line analysis were performed using the Igor Pro 5.2 (WaveMetrics) software environment.
Recordings from the isthmi, the Rt, and the E were mostly multi-units, as the bursting, synchronized character of the responses hampered the isolation of individual spikes. These responses were associated with a local wave potential (ranging from 15 to 40 Hz), especially prominent in the Ipc and SLu. We therefore relied on multiunit spike activity (MUA) and this local field potential (LFP) for all the analyses. The LFP component was separated from the spike activity by digitally filtering each recording trace <100 Hz and >300 Hz, respectively. To better characterize the data, MUA was measured in two ways. For recordings in the isthmi, usually containing one or two different spikes with a high signal-to-noise ratio, MUA was considered as discrete time events, defined by those spikes with amplitude larger than a voltage threshold, usually larger than three SDs above the average voltage. For recordings in the Rt and E, where units were more difficult to define and the signal-to-noise ratio was lower, MUA was defined as a continuous envelope. To that end, low- and high-frequency components were removed from the spike records by bandpass filtering between 600 and 2500 Hz. The resulting traces were then rectified and subsequently smoothed by zeroing the five larger wavelet scales of a Battle–Lemarie discrete wavelet transform [for a similar method to estimate MUA, see Stark and Abeles (2007), and Marín et al. (2007)]. This procedure produced a smooth envelope that fits without time shifts the bursting profile of spike discharges in the rotundus and the entopallium (Fig. 2).
Figure 2.

Measurement of MUA in the Rt and the isthmi. To obtain an estimation of MUA in the isthmi recording traces (left, lower trace), the traces are first filtered between 300 Hz and 10 kHz and then transformed in discrete events by a voltage threshold (middle, lower trace). To obtain a MUA estimation in the noisier Rt recordings (left, top trace), the traces are filtered between 600 and 2500 Hz, to remove the lower and higher frequency components, rectified, and then smoothed using a wavelet filtering procedure, in which the five larger wavelet scales of a Battle–Lemarie discrete wavelet transform are set to zero. The smoothed waveform is shown in the middle panel and overlapped on the Rt recording trace (left, top trace). Note that this trace well fits the bursting profile of the Rt discharges. A STA of the Rt MUA trace is then computed using the Isthmi MUA as trigger events. The right graph shows the actual STA of the depicted trace. Vertical calibration: Rt trace, 200 μV; isthmi trace, 100 μV; horizontal calibration: 200 ms.
Synchronization between the Ipc and SLu was assessed by computing discrete MUA to MUA cross-correlograms in 500 ms segments of simultaneously recorded traces. These correlograms represented the distribution of 1 ms binned time intervals between each spike in the reference trace and all the spikes in the target trace. For each pair of recording sites, 10–15 cross-correlograms were averaged and then normalized by dividing the average cross-correlogram by the number of spikes in the reference trace. Accordingly, for a given time delay, a value of 1 indicates that there was on average one spike in the target trace for each spike in the reference trace, at 1 ms resolution.
To cross-correlate activity in the Ipc and SLu with MUA and LFP in the Rt and the E, spike-triggered averages (STAs) were computed using single and multiunit spikes of the Ipc and SLu as trigger sources. Each STA was the average of 500 ms segments of 10–15 recording traces. To compare the strength of the synchronization across recording sites, STAs were normalized by first subtracting the mean value of the MUA recording segments and then dividing by the SD values of the same segments. A value of 1 at a given delay therefore, indicates that for each reference spike there was an average voltage in the MUA trace equivalent to 1 SD of amplitude.
To determine the significance of the correlations, “shift predictor” correlograms, estimating the correlation produced by chance, were computed for alternate recording traces. Thereafter, discrete cross-correlograms and STAs were normalized to the z score of chance correlation, using the mean and SD values of the respective shift predictor correlograms. Values of peak correlation had to be higher than two z scores (p < 0.05) to be considered significant.
To evaluate the effect of blocking the visually evoked, isthmic feedback to the TeO on the Rt visual responses, we calculated the average amplitude of the MUA of each Rt site, before and after inactivation of the isthmi. To better visualize the steady level of the MUA, before averaging, the envelope defining the Rt MUA was further smoothed by convolving the MUA with a 50 ms square window (a procedure provided by the Igor tools). The averages were obtained in 500 ms intervals of 15 sweeps, during which the visual stimulus passed through that part of the RF in the Rt corresponding to the RF of the inactivated site in the isthmi. The average spontaneous MUA, in a 500 ms interval measured 1 s before visual stimulation, was subtracted from that average. An equivalent measurement was also performed for the Ipc and SLu MUA, using in this case the average spike counts above a voltage threshold as a measure of activity.
In each experiment investigating how the visual responses in the Rt were affected when the isthmic feedback to the TeO shifted from one location to another, 10 trials were selected in which the second stimulus completely suppressed the feedback elicited by the first stimulus, during at least 300–500 ms intervals, and the feedback shifted to the second location. In those trials, we measured the synchrony between the Rt MUA and the corresponding feedback in each tectal location calculating the STAs of MUA in the Rt, using the bursting spikes recorded in each site in the TeO as trigger events. These bursting events correspond to the bursting firing of the Ipc terminals in the TeO, and thus closely represent the local feedback signal (Marín et al., 2005). To compare the frequency rhythms of the Ipc feedback and the Rt responses, discrete and continuous auto-correlograms were computed for the TeO bursting responses and the Rt MUA, respectively, using the same 10 intervals selected above. The fast Fourier power spectrum was then evaluated for each auto-correlogram and the result averaged for the 10 intervals.
Histological procedures.
To identify fluorescent injections and recording traces, animals were killed at the end of the experiments, with an overdose of anesthesia, and their brains were immersed, without perfusion, in a 4% paraformaldehyde solution in saline, for at least 4 d. The brains were then transferred to 30% sucrose for 3 d and cut in 45–60 μm coronal sections. Wet sections were mounted, examined, and photographed using a conventional microscope (BX 60, Olympus), equipped with epi-fluorescent illumination, and coupled to a Spot digital color camera (Diagnostic Instruments). In cases in which marking lesions had been made, the sections were processed with a standard Nissl or Giemsa protocol. Only data obtained from well identified tracts are reported.
Results
Multi-unit recordings and inactivation experiments were performed on 44 anesthetized pigeons to investigate four main issues. First, we made simultaneous recordings in the SLu and Ipc to determine the spatial-temporal relation of their respective feedback signals to the TeO. Second, to assess whether the feedback signals from the Ipc and SLu control the ascending afferent volleys to specific Rt subdivisions in the thalamus and the ensuing pallial target, the entopallium, we studied the synchrony between responses recorded in the Ipc and SLu versus responses recorded in the four main Rt subdivisions and the entopallium. To the same end, we studied the effect of inactivating the Ipc and SLu on the Rt visual responses. Finally, to determine whether the isthmic feedback to the TeO can select the afferent volley arriving at the Rt under conditions of stimulus competition, we investigated whether visually induced shifts of the Ipc feedback from one tectal location to another produce a corresponding change in the synchrony between the Ipc feedback and the bursting responses recorded in the Rt.
Simultaneous recording in the Ipc and SLu
As shown in Figure 1, the Ipc and SLu have a remarkably similar connectivity, both receiving a topographic projection from shepherd-crook neurons in tectal layer ten, and a non-topographic projection from the Imc neurons, the last consisting of large axonal fields ramifying extensively in each nucleus (Wang et al., 2006). Extracellular recordings in the Ipc reveal this dual input: Ipc neurons respond with bursting discharges from circumscribed RFs, while the Imc terminals respond with synchronized barrages of spikes, which can be elicited by stimulating most parts of the visual field (Marín et al., 2007).
Extracellular recordings in the SLu (62 recording sites in 19 pigeons) also showed two types of responses, consisting of large-amplitude spike discharges elicited from circumscribed RFs, and lower-amplitude high-frequency responses elicited by more peripheral stimulation. Instead of burst-like responses as recorded in the Ipc, units in the SLu responded with single or double spikes with a characteristic separation of 5 ± 0.6 ms. These single or double spikes always appeared riding on a large amplitude (0.2–0.25 mV), positive-going LFP (Fig. 3), very much like bursts in the Ipc. Spike-triggered averages of the raw traces (filtered between 3 Hz and 10 KHz) using the spikes as triggering events showed the spikes of the SLu and Ipc riding at similar latencies with respect to the positive peak of the LFP (inset Fig. 4C). The average latency between the spike/burst and the positive peak of the LFP was −10 ms for the Ipc recordings and −6 ms for the SLu recordings (12 cases each).
Figure 3.

Physiological characteristics of SLu responses. Recording traces showing SLu unitary visual responses elicited by a bright spot (2 deg visual angle, 15 deg/s, 2 s duration) moved across the RF. SLu units have a spontaneous discharge before the stimulus and fire characteristic double or single spikes riding on a positive-going slow-wave potential. The recordings were filtered between 3 Hz and 10 kHz. Calibration: 200 μV and 50 ms. Length of the arrow on top represents 2 s. Photograph on the left shows marking lesions (arrows, 500 μm separation) delimiting the segment of the microelectrode's tract where this type of activity was recorded. Photographic calibration: 0.5 mm.
Figure 4.

Synchrony of visual responses between the Ipc and SLu. A, Simultaneous extracellular multiunit recordings in the Ipc and SLu, showing the tight coupling of the bursting responses in the Ipc and the spikes in the SLu, in response to a bright spot (1.7 deg visual angle) sweeping the screen monitor, from top to bottom, in 15 horizontal sweeps separated by 2 deg, at 15 deg/s (see schematics above). The circles outline the partially overlapped RFs of the Ipc and SLu. B, Expansion of recording traces corresponding to sweep # 7 (top) and cross-correlograms obtained for 12 repetitions of the indicated sweeps (bottom). Correlograms were computed from 0.5 s recording segments in the overlapped portion of the RFs. C, Mean cross-correlograms obtained for 14 paired Ipc/SLu recordings. Before averaging, correlograms for each recorded site were divided by the number of Ipc spikes. Therefore, the y-axis represents the probability of getting one spike in the SLu in a 1 ms bin for a given spike in the Ipc. The width of the correlogram represents the SEM. Inset, STAs of unfiltered samples of simultaneous Ipc (top) and SLu (bottom) records using the respective spikes as trigger events. Spikes in both nuclei ride synchronously on the ascending phase of a slow positive wave.
With marking lesions and tract reconstructions (n = 16), we determined that this spike activity was located exclusively inside the SLu (Fig. 3), and two observations indicated that the single and double spikes were fired by SLu neurons. First, they lasted for 2 ms with a clear biphasic profile characteristic of soma recordings. Second, their RFs' position followed the retinotopic map described for the nucleus (Hellmann et al., 2001; Wang et al., 2006), with superior to inferior shifts in RF position (in the visual field) as the electrode moved from lateral to medial in the nucleus, and posterior to anterior shifts in RF position as the electrode moved from posterior to anterior in the nucleus. Large changes in RF position occurred for short displacements of the electrodes, in accordance with the small size of the nucleus.
With the stimuli used in this study, SLu neurons showed very consistent responses across experiments, indicating that, like the Ipc, this nucleus is rather homogeneous in its functional properties (but see Yang et al., 2002). SLu neurons showed average spontaneous firing rates ranging from 2 to 7 spikes/s, higher than the ones recorded for Ipc neurons (ranging from 0.2 to 0.8 spikes/s), and their RFs were also consistently larger (45 ± 15 deg vs 20 ± 3 deg). They responded strongly to moving bars and dots, with firing rates ranging from 13 to 33 spikes/s. Just like the bursting responses in the Ipc, this firing rate and the concomitant LFP showed a strong periodic modulation, within the 15–40 Hz, low gamma frequency range.
In a total of 57 pairs of simultaneous recording sites in the Ipc and SLu, in which the respective RFs were overlapped, SLu spike responses to moving stimuli were remarkably synchronized to Ipc bursting responses (Fig. 4). Even in cases where the overlapping was partial, as shown in Figure 4A, the synchronization in the overlapped segments of the recordings was evident by visual inspection (Fig. 4A,B), and clearly manifested in the cross-correlograms computed for those segments (Fig. 4B,C, average correlation peak = 10 z scores, n = 14). As Ipc and SLu visual responses both showed a clear rhythmic modulation, all cross-correlograms exhibited a visible and significant periodic modulation of 15–40 Hz (second satellite peaks of the cross-correlograms higher than two z scores, p < 0.05, in 9 of14 cases tested). The central peak of the cross-correlograms had an average latency near 0 ms. In all cases tested, cross-correlograms computed for alternate presentations of the stimulus (shift predictor) were flat, indicating that the correlations were not caused by independent covariations of firing rates produced either by chance or by phase locking to the stimulus. On the other hand, the spontaneous activity recorded in the two nuclei was also significantly correlated. The strength of the correlation, standardized by the number of spikes, was much weaker than during visual stimulation (average peak value 0.07 ± 0.02 vs 0.18 ± 0.07, Mann–Whitney test, p = 0.001), suggesting that the correlation is boosted by the visual input. An equivalent strong correlation with a periodic modulation in the 15–40 Hz frequency range was found between the visually evoked slow-wave potential recorded in the two nuclei.
In a previous study (Marín et al., 2007), we showed that bursting feedback from the Ipc to the TeO was controlled by a long-range suppressive mechanism such that a new visual stimulus presented at a second spatial location could completely suppress the feedback signal generated by a visual stimulus in the first location. This suppression operates even for stimuli located far from the RF center, at distances up to 90 deg of visual angle (Asadollahi et al., 2010, 2011). We repeated this experiment during simultaneous recordings of the Ipc and SLu, finding that when a second moving spot was presented while the first stimulus was in the middle of its trajectory, the responses recorded in both nuclei were simultaneously suppressed. Although the strength and time course of the suppression was variable across trials and locations, it was virtually identical in both nuclei, revealing the tight coupling of their visually driven activity (Fig. 5).
Figure 5.

Simultaneous suppression of the visual responses in the Ipc and SLu. Top, Two pairs of recording traces obtained from the repetition of the same experiment (described in the schematics above), in which a second moving dot (12 deg/s) is presented while the first moving dot (12 deg/s) is crossing the overlapped RFs of the Ipc and SLu. Note that although the suppression of responses was partial and lasted ∼500 ms, it is almost identical in each pair of recordings. Note also the characteristic double-spike discharge of the SLu neurons. Bottom, Cumulative PSTH, in the same timescale, for six repetitions of this sequential stimulation.
Synchrony between visual responses in the Ipc/SLu and Rt
Extracellular multiunit activity and LFPs were sampled in the Ipc, SLu, and the three main subdivisions of the Rt with up to six tungsten electrodes moved independently. In the typical recording condition, two electrodes were positioned in homotopic locations in the Ipc and SLu, and four electrodes were located in the Rt, each separated by 350 μm in the anterior to posterior axis. This arrangement usually permitted targeting the four Rt subdivisions: dorsal anterior (RtDa), centralis (RtCe), triangularis (RtT), and posterior (RtPost). However, due to the fact that RtDa units respond more strongly to stimulation in the inferior part of the visual field, while RtPost units respond more strongly in the dorsal part of the visual field, simultaneous activation of all divisions with a single visual stimulus was unlikely.
Although several studies have indicated that neurons from different Rt subdivisions are selective to specific visual stimuli (Wang and Frost, 1992; Wang et al., 1993; Nguyen et al., 2004; Revzin, 1979), we found that units in all subdivisions strongly responded to tangential motion across the receptive fields. In fact, with marking lesions we determined that the borders of the nucleus along its entire rostrocaudal axis were neatly delimited by the appearance of strong responses to moving spots. Sustained “on” or transient “on/off” responses, without motion sensitivity, were always found as the electrodes were lowered down, but they invariably corresponded to recordings within the nucleus opticus principalis (OPT), lying above the Rt. Although we did not search systematically for differences among subdivisions, using color or other complex static stimulation, many neurons displayed strong responses to looming stimuli. However, as these same neurons were also responsive to tangential motion, we relied on this type of stimulus to simultaneously stimulate the different recording sites. In any case, tract reconstructions using DiI-stained electrodes and marking lesions, demonstrated that all recording locations responding to tangential motion were distributed across the Rt subdivisions. Figure 6 shows a schematic of coronal sections across the thalamus displaying the reconstruction of the 67 recording sites considered in this study.
Figure 6.

Synchrony of visual responses recorded in the different subdivisions of the Rt with respect to responses in the Ipc and SLu. Left column, Series of schematics from coronal sections at the level of the thalamus showing the main Rt subdivisions (posterior is above) and the reconstructed recording sites used for analysis. Sections are separated by 180 μm. Right column, STAs between the Ipc or SLu and multiunit activity in the different Rt subdivisions. Each STA represents the average of individual STAs, numbered on each panel, obtained in the different recording sites. Before averaging, individual STAs were normalized to the SD of the MUA of the Rt recording traces. The thickness of the STAs represents the SEM. Inset histogram shows the distribution of the latencies of correlation peaks of individual STAs. Average latencies are 8.2 and 5.5 ms for the respective Ipc and SLu STAs. Inset photograph shows an example of the fluorescent tract left by DiI-immersed electrodes, allowing the reconstruction of recording sites.
Moving stimuli induced strong 12–40 Hz rhythmic multiunit discharges and LFP oscillations across the Rt, just like the Ipc and SLu, although with smaller amplitude. This oscillatory modulation was also evident during spontaneous discharges recorded in the absence of visual motion. STAs of MUA recordings from the Rt, using the Ipc bursting spikes (n = 39) and the SLu single and double spikes (n = 29) as trigger events, showed a clear correlation between Ipc–SLu spikes and Rt visual responses (Fig. 6). These cross-correlations were significant across the main Rt subdivisions (only two cases were obtained for the RtT), and although the Ipc/Rt correlations were on average stronger for the RtDa and RtCe compared with the RtPost, the difference was not significant (Mann–Whitney test, p = 0.17 and p = 0.27, respectively). As the Ipc and SLu are tightly correlated, STAs between the SLu/Rt and Ipc/Rt were virtually identical (Mann–Whitney test, p > 0.45 for all comparisons). The STAs had a central peak located ∼8.2 ± 1.9 ms for the Ipc and 5.5 ± 1.7 ms for the SLu, indicating that the bursting activity in the Rt was delayed with respect to that of the Ipc and SLu. Secondary peaks separated by 12–30 ms were also observed in some STAs reflecting the oscillatory character of the responses (secondary peak larger than two z scores in 14 of 37 and 11 of 30 STAs tested in the Ipc and SLu, respectively). The STAs for recording sites outside the Rt were flat as was the case for STAs computed using the shift predictor.
The strength of the STAs of Rt activity did not depend on stimulus-evoked activity and on average was not significantly attenuated when computed during periods in which the animal was not confronted with any moving stimulus (average correlation peaks for all subdivisions of 0.6 ± 0.24 compared with 0.59 ± 0.38 in the visually stimulated condition).
Effect of Ipc and SLu inactivation on Rt visual responses
To determine both whether there is a causal relationship in the above correlations and whether the Ipc and SLu may control the ascending output to specific subdivisions, we blocked the visual responses in the Ipc and SLu using CNQX (the AMPA glutamate antagonist) or lidocaine, during simultaneous recordings in the Rt.
Blocking the visual responses locally in the Ipc with CNQX (11 injections in 7 pigeons) produced a total suppression of visual responses across the Rt, including MUA and LFP, from those locations in the visual field corresponding to the tectal locations deprived of the Ipc feedback. Figure 7A shows an example of almost complete loss of responses in a simultaneous recording from the four Rt subdivisions during Ipc blockade. Figure 7B summarizes results from 38 recordings in different Rt subdivisions, before and after blockade of the Ipc visual feedback.
Figure 7.

Ascending transmission of visual inputs to the Rt require Ipc feedback to the TeO. A, Examples of the abolition of visual responses across the Rt subdivisions after local inactivation of the Ipc. Voltage traces representing averaged multiunit visual activity recorded in each Rt subdivision, in response to 15 horizontal sweeps of a bright spot (2 deg, 32 deg/s), before (black) and after (gray) local Ipc inactivation (CNQX 0.2 mm). To avoid response adaptation, successive stimulus paths were shifted as they crossed the RF of the site in the Ipc (or SLu) to be inactivated (see schematics above). Rectangles demarcate a 500 ms interval centered on the respective inactivated site. The integral of the response within these intervals was used to evaluate the response changes across experiments. Note that responses drop to baseline at some point within these intervals. B, C, Averages of normalized visual responses in each Rt subdivision before (black) and after (gray) inactivation of the Ipc (B) and SLu (C). Note that, unlike the Ipc, SLu inactivation does not produce significant variations in Rt responses. Gray bars represent CNQX (250 μm) injections and white bars lidocaine (0.2%) injections. Numbers on each bar indicate the number of recording sites used for averaging. D, Epifluorescent photographs of coronal sections of wet tissue showing the spread of 1% rhodamine injected during the experiments to assess the location and spread of the injected drugs. Left and center photographs, Representative injection volumes (∼20 nl) in the Ipc and SLu. Right photograph, Largest volume spread found in the SLu. Arrows point to injection sites and pipette tracts. Calibration bar: 0.5 mm.
In addition to the effect on the Rt, the Ipc blockade also suppressed SLu visual spike and LFP responses (6 CNQX injections, 4 animals; spikes: 68% average reduction, p = 0.01; LFP: 95% average reduction, p = 0.01, Wilcoxon matched-pairs test; Fig. 8). As there is no direct Ipc projection to the SLu, this result indicates that the Ipc feedback is controlling the visual input to SLu neurons. The spike and LFP spontaneous activity in the SLu were barely reduced (11%, p = 0.17 for the spikes and 6%, p = 0.15 for the LFP, Wilcoxon matched-pairs test), indicating that the spontaneous activity in the SLu is less affected by the spontaneous Ipc feedback to the TeO.
Figure 8.

Blocking visual responses in the Ipc abolishes visual responses in the SLu. A, Traces showing multiunit paired recordings in the SLu and Ipc in response to three consecutive sweeps of a bright spot (2 deg, 16 deg/s, 1.5 s duration) through the overlapped RFs of both recording sites, as depicted in C. B, Same paired recordings after local blockade of the Ipc with CNQX (0.2 mm). Rectangles demarcate the RF of the Ipc recording site before inactivation. Note that some spontaneous activity remains in the SLu along with some visual responses to stimulation outside the RF of the inactivated site. D, Average drop of activity in the SLu in six experiments in four animals. In each experiment, activity was estimated as the spike count within the rectangle to five repetitions of the three sweeps represented in C (15 sweeps total).
Given the above result, it was possible that part or all of the strong effect of the Ipc blockade on Rt responses resulted from the concomitant suppression of the SLu activity, either directly, as the SLu has a sparse projection to the Rt (Hellmann et al., 2001), or indirectly, via the SLu feedback projection to the TeO. It has been hypothesized that the SLu could specifically modulate the visual input to type II TGCs (Wang et al., 2006), thus it would control the responses of the posterior and triangularis subdivisions of the Rt. Therefore, it was important to assess the effect of the SLu blockade on Rt visual responses.
Due to the small size and deep location of the nucleus, blocking the activity in the SLu was extremely difficult. To assess the location and diffusion of the inactivating drug, we injected fluorescent markers using one barrel of the three-barrel pipette (Fig. 7D). Injections of CNQX (7 injections, 4 pigeons) or lidocaine (8 injections, 3 pigeons) inside the SLu (Fig. 7C) produced no discernible effects on the visual responses recorded in the Rt subdivisions (p > 0.1 for all comparisons, Wilcoxon matched-pairs test). Although a larger number of cases may, perhaps, uncover a significant effect missed in this study, the dramatic outcome of the Ipc inactivation on Rt responses cannot be attributed to the concomitant suppression of SLu responses.
Stimulus selection within Rt receptive fields
The above results strongly indicate that Ipc bursting feedback signals exert a boosting or gating effect on the tectal ascending output to the Rt, to the extent that MUA across the Rt subdivisions become phase-locked to bursts in the Ipc. We then investigated whether visually induced shifts of the Ipc feedback location in the tectum produced a concomitant change in the visual responses recorded in the Rt. In principle, if a visual stimulus elicits a retinal input to the tectum, a bursting feedback from the Ipc, along with the feedback spikes from the SLu, will invade the activated tectal location. As a consequence, most neurons throughout the Rt will respond to the visual stimulus with bursting discharges synchronized to the corresponding tectal feedback. Given the competing mechanism operating in the isthmo–tectal circuit, if a second stimulus appears in the visual field, the feedback to the first location could be diminished or abolished, and a new bursting feedback will start at the newly activated tectal location. Bursting responses in the Rt should then synchronize to the bursting feedback at this new location.
The middle panel of recordings in Figure 9 illustrates one example of this experiment. When one stimulus was presented in the inferior visual field, multiunit bursting responses in two recording sites in the RtDa and RtCe reflected the temporal course of bursting responses recorded at the corresponding location in the TeO, as shown by the corresponding STAs at the left of the panel. This bursting profile varies according to the activated tectal location, such that when the stimulus is now presented in the superior visual field, bursting responses with a shorter interburst interval (42 ± 36 ms vs 76 ± 30 ms) are recorded in the superior tectal location in the TeO, which then becomes synchronized to the MUA in both Rt subdivisions (Fig. 9, top, right STAs). The peak latency of the STAs also varies from 8 ms for the inferior visual field to 10 ms in the superior visual field. When both stimuli are presented in sequence and the second stimulus suppresses the Ipc feedback to the first tectal location, the bursting profile in the Rt changes accordingly, such that the synchronization between the Rt and TeO shifted from the first to the second tectal location (Fig. 9, bottom). Importantly, the profile and latency of the STA between the bursting spikes from the second tectal location and the MUA in the Rt in this condition are very similar to these same parameters computed when the second stimulus was alone, indicating that the Rt responses are indeed under the control of the “winning” feedback in the TeO. We analyzed 23 cases in 13 pigeons, choosing recording segments in which there was a complete suppression of the Ipc feedback to the first location induced by the presentation of the second stimulus. In all cases the results were similar—Rt responses shifted from synchronizing to the feedback signal in the first tectal location, to the feedback signal in the second tectal location (peak correlations higher than two z scores in 39 of the 46 computed STAs). In 8 of 10 additional cases tested, in which the feedback suppression was partial and the feedback persisted in the two locations, the responses in the RT had a mixed appearance and the computed STAs showed significant synchrony with the feedback in both locations.
Figure 9.

The Rt synchronizes to the “winning Ipc feedback” in the TeO. Each of the three panels shows four recording traces corresponding to the simultaneous extracellular recordings of the Ipc bursting feedback in two separate sites in the TeO (TeO 1 and TeO 2) and the MUA recorded in two subdivisions in the Rt. Note that the large RFs in the Rt include the smaller RFs recorded in the TeO. Top, Moving a light spot through the TeO 2 RF produces a strong bursting discharge in that site synchronized to the MUA activity recorded in the RtDa and RtCe (right correlograms). Middle, Moving a light spot through the TeO 1 RF produces a strong bursting discharge in that site synchronized to MUA activity recorded in the RtDa and RtCe (left correlograms). Bottom, Overlapped stimulation of both tectal RFs produces the suppression of bursting discharges in TeO 1 and the activation of bursting discharges in TeO 2, which is manifested in corresponding changes in the discharge profile in both Rt subdivisions: to the left of the dotted line marking the beginning of the second stimulus, both Rt subdivisions synchronize with TeO 1 (left correlograms), to the right of the dotted line, both subdivisions synchronize with TeO 2 (right correlograms). Velocity of both stimuli is 8.2 deg/s.
The stimulus-induced shift in the synchrony between the Rt and TeO was generally associated with a change in the temporal profile of the Rt responses (Figs. 9, 10), especially evident in cases displaying a large difference in the rhythm of the Ipc feedback at the two tectal locations. In particular, the Ipc feedback in the TeO representing the superior temporal visual field, normally displayed higher frequency than in the tectal regions representing the inferior nasal visual field (14 paired comparisons, p = 0.045, Fisher sign test). Figure 10 shows an example of this experiment, in which the slow rhythm of the Ipc feedback to an inferior tectal location is replaced by a higher-frequency feedback rhythm located more superiorly. There is a clear transition in the MUA response recorded in the Rt that mimics the frequency shift of the tectal feedback, such that the main frequency component of the Rt MUA and Ipc feedback tends to coincide on each side of the transition. This tendency was clearly observed in 10 of 14 experiments analyzed. Similar frequency shifts that followed the frequency transitions of the tectal feedback were observed in the recorded Rt local field potential.
Figure 10.
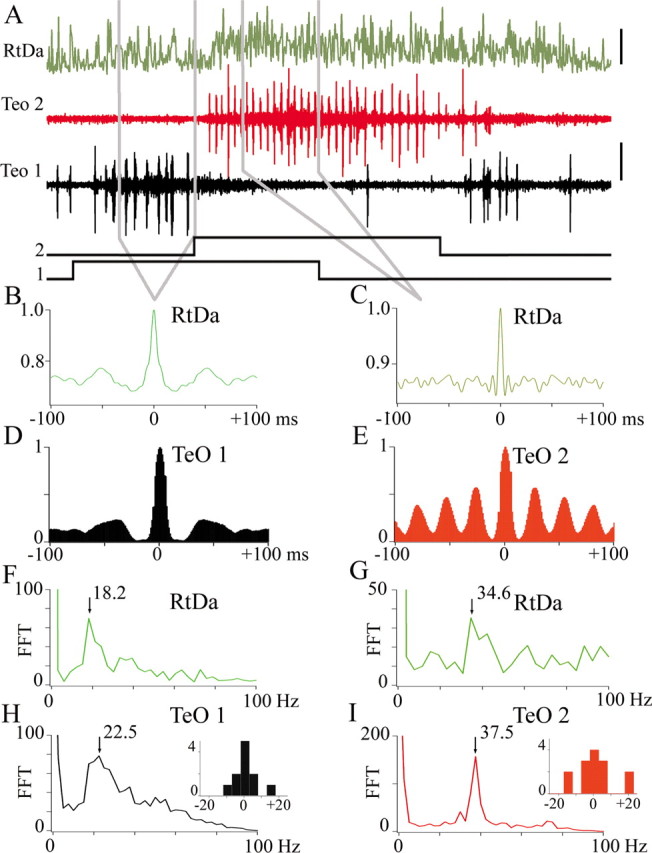
Stimulus-induced shifts of the Ipc feedback to the TeO manifest as changes in the rhythm of the MUA in the Rt. A, Example of simultaneous recordings of the Ipc feedback in two sites of the TeO (1 and 2) and MUA activity in the RtDa in response to the sequential presentation of two moving stimuli, as displayed in Figure 7 (5 deg bright spots, 20 deg/s). Note that the switch of the feedback signal in the TeO is associated with a change in both the level of discharge and bursting frequency of the MUA in the Rt and the tectum. B, C, Average auto-correlograms of the MUA activity within the indicated segments for nine repetitions of the sequential stimulation. D, E, Average auto-correlograms of TeO 1 and TeO 2 feedback activity within the same indicated segments and for the same stimulus repetitions. F, G and H, I, Average fast Fourier transforms (FFT) of the auto-correlograms averaged in B, C and D, E respectively: the dominant frequency of the auto-correlograms of the MUA responses in each segment is similar to the dominant frequency of the auto-correlograms of the respective feedback signal in the TeO. Inset histograms represent the difference in the averaged FFT between the MUA and the respective tectal feedback signals from 14 repetitions of this same experiment. Note that despite the dispersion, the differences are grouped around zero.
Synchrony between visual responses in the Ipc and the entopallium
The Rt sends an organized projection to the entopallium, such that separate regions of the entopallium receive topographic input from different rotundal subdivisions (Laverghetta and Shimizu, 2003; Krützfeldt and Wild, 2005; Fredes et al., 2010). To determine whether the effect of the Ipc on the ascending tectal pathway extends to the entopallium, we made 74 simultaneous recordings in both structures, 36 of which were tested in a systematic way to be used for quantitative analysis. Recording sites were distributed along the rostral–caudal extent of the E, mostly within and around its external division, where rotundal terminals are more densely distributed (Krützfeldt and Wild, 2004, 2005; Fredes et al., 2010) and visual responses were stronger. As in the Rt, the RFs in the E were very large and easily included the RF of the recorded site in the Ipc.
Single and multiunit recordings showed that neurons in the E responded to moving stimulation with bursting discharges synchronized to responses recorded in the Ipc (Fig. 11). Using Ipc multiunit spikes as trigger events, 28 of 36 STAs of E activity showed significant correlation peaks, with an average z score of 8 ± 1.7. However, the average strength of the peak correlations, standardized in terms of the SD of the MUA, was significantly less than the average strength of the STAs obtained in the Rt (0.5 in the Rt vs 0.28 in the E, Mann–Whitney test, p = 0.007). On the other hand, the latencies of the correlation peaks in the E were significantly longer (average 14.4 ± 4.2 ms) than the ones in the Rt, indicating a transmission delay of 6.2 ms between the Rt and the entopallium.
Figure 11.

Visual responses in the entopallium synchronize to the Ipc feedback signals. Example of paired recordings of MUA in the Ipc and E, and average spike-triggered averages of MUA in the E, using the Ipc spikes as trigger events. The STAs are expressed in units of SD of the MUA voltage traces. The thickness of the STA represents the SEM of 36 paired recording sites. Inset shows the distribution of latencies of the peaks of the individual STAs. Mean peak latency = 14 ms.
Discussion
This study describes how visual signals in the optic tectum are selectively relayed on to higher brain areas. We find that visual responses from the isthmic nuclei Ipc and SLu are closely synchronized and send phase-locked feedback signals across the tectal layers. Bursting feedback from the Ipc selects which afferent activity propagates to the different subdivisions of the Rt and entopallium, synchronizing neural responses representing the chosen stimuli across stages in the tectofugal pathway.
Synchronized feedback to the TeO from the Ipc and SLu
The synchronization of visual responses between the Ipc and SLu is remarkably tight, with almost zero time lag, usually involving most of the spikes and bursts fired by the neurons in each nucleus in response to a moving spot, even in cases where the receptive fields only partially overlapped (Fig. 4). Because of this tight synchrony of responses by neurons in the SLu and Ipc, and because stimulation of distant RFs in the Ipc induces mutual suppression between recording sites, with flat or negative correlograms (Marín et al., 2007) (G. J. Marín, C. Morales, E. Durán, unpublished observations), we would expect no synchronization of distant recording sites in the Ipc and SLu.
Furthermore, presentation of a second moving spot outside of both RFs caused virtually identical suppression in both nuclei of the activity elicited by the first moving spot, despite the suppression being variable in strength and time course across trials and locations (Fig. 5). As the Ipc and SLu are not interconnected, this synchrony is probably produced by common input, either axon collaterals of shepherd-crook neurons innervating both nuclei, or separate shepherd-crook neurons synchronized by recurrent projections within the tectum, perhaps via electrical synapses (Wiggers, 1998).
The synchrony between the Ipc and SLu involves firing in rhythmic fashion at frequencies of 15–40 Hz, implying that shepherd-crook input to both nuclei is also rhythmic, as suggested by Shao et al. (2009), but susceptible to feedback from the Ipc, because blocking visual responses in the Ipc suppresses visual responses in the SLu.
Although Slu and Ipc neurons have restricted axon terminals in the tectum (120–150 and 35–50 μm wide, respectively) (Wang et al., 2006), their visual RFs are relatively large, therefore any point-light visual stimulus will trigger feedback from both nuclei affecting a tectal area wider than the area activated by the retinal input. Because SLu neurons have RFs twice as large as Ipc neurons (45 ± 15 deg in diameter vs 20 ± 3 deg), feedback from the SLu would affect a larger tectal area than feedback from the Ipc. Thus, a 1 deg visual spot activating a tectal area of 0.1 mm in diameter (Clarke and Whitteridge, 1976) would elicit simultaneous feedback from the SLu and Ipc encompassing a tectal area of ∼4.5 and 2 mm in diameter, respectively, both larger than the retinal input in the superficial layers. For visual stimuli moving in one direction, feedback from the Ipc and SLu may exert a priming effect on neurons ahead of the visual wave-front propagating across the tectal surface, e.g., by targeting the shepherd-crook neurons projecting back to the isthmi or the widely distributed bottlebrush endings of tectal ganglion cells.
The feedback from the Ipc controls the ascending tectal output to the rotundus and entopallium
Our results show that feedback from the Ipc controls the ascending visual output from the TeO to the entire Rt, rather than only the part of the Rt shown in previous work (Marín et al., 2007). Thus, bursting responses across the Rt synchronize to bursts from the Ipc, and blocking visual responses in the Ipc suppresses visual responses in the Rt from the region of the visual field represented in the inactivated location (Figs. 6, 7). Furthermore, visual responses in the entopallium (Fig. 11) also show the bursting rhythm imposed by Ipc feedback, and blocking visual responses in the Ipc with CNQX produces a visual scotoma within the entopallial RFs (preliminary data, not shown).
Although SLu visual responses were also synchronized to Rt responses, blocking visual responses in the SLu did not produce a significant effect in the Rt. Therefore, Slu feedback would not modulate visual input to type II TGCs, as suggested in Figure 1, and SLu/Rt synchronization seems due only to Ipc feedback, which seems to entrain visual responses in both nuclei. Although SLu neurons send a sparse projection to the Rt (Hellmann et al., 2001), perhaps only to its external part (Wang et al., 2006), SLu feedback may be more closely linked to descending tectal circuits, operating in concert with the ascending tectal pathway. These descending projections could be modulated both directly by SLu axons and indirectly via its projection to the nucleus spiriformis lateralis (Hellmann et al., 2001), which conveys basal ganglia inputs to the TeO (Reiner et al., 1982).
Even though Ipc feedback was significantly synchronized to the three main Rt subdivisions (insufficient data for triangularis) and to the entopallium, in all paired recordings a substantial fraction of bursting responses were not synchronized to the bursts in the Ipc, especially in the entopallium, perhaps as a result of other inputs to the Rt and E, not phase-locked to the TGC's input, or neural interactions within the nuclei themselves. Also, the spatiotemporal pattern of Ipc feedback and complex topography of the tectum-Rt projection may disturb the correlation between Rt and Ipc.
As the tectal output to the Rt stems exclusively from the TGCs, the effect of Ipc feedback upon Rt responses implies that this feedback ultimately controls the firing of TGCs themselves. TGCs have large dendritic arborizations, and the large RFs of TGC neurons (up to 40 deg) are further pooled in the Rt forming RFs larger than 100 deg. Because the visual scotoma in the Rt produced by focal Ipc inactivation is restricted to a small region of the visual field as predicted by the retinotopy of the focal inactivating region, it is likely that the Ipc feedback effect is manifested on the superficial tectal layers, presumably at the level of retinal terminals and/or the bottlebrush endings of type I TGCs (Wang et al., 2006). As type II TGCs have more deeply located bottlebrush endings, which may not receive direct contacts from the paintbrush terminals, the former mechanism seems more parsimonious.
Stimulus selection within Rt receptive fields
The control of the ascending visual signals by Ipc suggests an attentional mechanism, given that the strength and location of this feedback in the tectal map is modulated by long-range competitive interactions. Thus, if a second stimulus appears in the visual field while the first one is still present, the feedback to the first tectal location can be suppressed and shifted to the second tectal location. This suppression operates for stimuli located well outside the RF and is mediated by wide-field GABAergic projections from the Imc (Marín et al., 2007). In view of this evidence, and ideas stated by Sereno and Ulinski (1987) for the isthmo-tectal system in the turtle, we have proposed that the isthmo-tectal circuitry in birds forms a “winner-take-all” mechanism for stimulus selection, with Imc neurons providing long-range inhibition to the Ipc and TeO, and Ipc feedback responses assigning the “winning” location in the tectal map (Marín et al., 2007) (Fig. 1A). Consistent with this hypothesis, many neurons in the owl Ipc exhibit a switch-like behavior, increasing or decreasing their responses depending on the relative strength between stimuli inside and outside the RF (Asadollahi et al., 2010, 2011).
Our results show that when a second visual stimulus is introduced, suppressing Ipc feedback to the first tectal location, synchronization between the activated locations in the TeO and Rt shifts from the first to the second location (Fig. 9), indicating that the suppression of Ipc feedback induced by the second stimulus is equivalent to that induced experimentally by CNQX, and that Ipc feedback is governing the responses in Rt. As Ipc feedback in the dorsal–posterior TeO (superior temporal visual field) has higher frequency than feedback in the ventral–anterior TeO (inferior nasal visual field), the stimulus-induced shifts in Ipc feedback between these tectal regions are also manifested as discrete shifts in the oscillatory pattern of multiunit activity in the Rt (Fig. 10).
In mammals, the parabigeminal nucleus is the homolog to the avian Ipc/SLu complex. Major et al. (2000) have proposed that in the squirrel, parabigeminal axons are directed to the bottlebrush endings of the TGCs, which send a non-topographic, bilateral projection to the caudal pulvinar in the thalamus, just like Rt-projecting TGCs in birds (Major et al., 2000, Fredes et al., 2011). The parabigeminal axons might exert similar control of the collicular-caudal pulvinar pathway as shown here for birds.
In summary, we have shown that afferent activity triggered by moving stimuli only proceeds from the optic tectum to higher visual areas if boosted by feedback signals from the Ipc. As these feedback signals compete among each other, stronger visual signals are transmitted to higher areas. In addition, feedback from the Ipc seems to imprint a bursting rhythm on the transmitted signals that synchronizes the elicited responses at several stages in the tectofugal pathway. These processes may represent a bottom-up mechanism by which afferent volleys triggered by salient stimuli achieve widespread representation across visual areas and thus capture attention. Studies in mammals have suggested that cortical, top-down and bottom-up modulations may dynamically transmit selected sensory signals by increasing the synchrony of neuronal groups activated by the attended stimulus (Fries et al., 2001, 2008; Womelsdorf et al., 2006). Our results suggest that feedback signals from the isthmi can broadcast a selected rhythm in a bottom-up fashion. Possibly, descending inputs from higher visual areas, like the wulst and the arcopallium (Zeier and Karten, 1971; Karten et al., 1973), can modulate these isthmic signals during top-down attentional control.
Footnotes
This work was supported by FONDECYT Grants 1080220, 1110281, and 1080094. We thank Josh Wallman for valuable comments and substantial help in preparing this manuscript. We also thank Diane Greenstein for editorial assistance.
References
- Angaut P, Repérant J. Fine structure of the optic fibre termination layers in the pigeon optic tectum: a Golgi and electron microscope study. Neuroscience. 1976;1:93–105. doi: 10.1016/0306-4522(76)90003-8. [DOI] [PubMed] [Google Scholar]
- Asadollahi A, Mysore SP, Knudsen EI. Stimulus-driven competition in a cholinergic midbrain nucleus. Nat Neurosci. 2010;13:889–895. doi: 10.1038/nn.2573. [DOI] [PMC free article] [PubMed] [Google Scholar]
- Asadollahi A, Mysore SP, Knudsen EI. Rules of competitive stimulus selection in a cholinergic isthmic nucleus of the owl midbrain. J Neurosci. 2011;31:6088–6097. doi: 10.1523/JNEUROSCI.0023-11.2011. [DOI] [PMC free article] [PubMed] [Google Scholar]
- Benowitz LI, Karten HJ. Organization of the tectofugal visual pathway in the pigeon: a retrograde transport study. J Comp Neurol. 1976;167:503–520. doi: 10.1002/cne.901670407. [DOI] [PubMed] [Google Scholar]
- Clarke PG, Whitteridge D. The projection of the retina, including the ‘red area’ on to the optic tectum of the pigeon. Q J Exp Physiol Cogn Med Sci. 1976;61:351–358. doi: 10.1113/expphysiol.1976.sp002366. [DOI] [PubMed] [Google Scholar]
- Connor CE, Egeth HE, Yantis S. Visual attention: bottom-up versus top-down. Curr Biol. 2004;14:R850–R852. doi: 10.1016/j.cub.2004.09.041. [DOI] [PubMed] [Google Scholar]
- Desimone R, Duncan J. Neural mechanisms of selective visual attention. Annu Rev Neurosci. 1995;18:193–222. doi: 10.1146/annurev.ne.18.030195.001205. [DOI] [PubMed] [Google Scholar]
- Fredes F, Tapia S, Letelier JC, Marín G, Mpodozis J. Topographic arrangement of the rotundo-entopallial projection in the pigeon (Columba livia) J Comp Neurol. 2010;518:4342–4361. doi: 10.1002/cne.22460. [DOI] [PubMed] [Google Scholar]
- Fredes F, Vega-Zuniga T, Karten HJ, Mpodozis J. Bilateral and ipsilateral ascending tecto-pulvinar pathways in mammals: a study in the squirrel (Spermophilus beecheyi) J Comp Neurol. 2011 doi: 10.1002/cne.23014. [DOI] [PMC free article] [PubMed] [Google Scholar]
- Fries P, Reynolds JH, Rorie AE, Desimone R. Modulation of oscillatory neuronal synchronization by selective visual attention. Science. 2001;291:1560–1563. doi: 10.1126/science.1055465. [DOI] [PubMed] [Google Scholar]
- Fries P, Womelsdorf T, Oostenveld R, Desimone R. The effects of visual stimulation and selective visual attention on rhythmic neuronal synchronization in macaque area V4. J Neurosci. 2008;28:4823–4835. doi: 10.1523/JNEUROSCI.4499-07.2008. [DOI] [PMC free article] [PubMed] [Google Scholar]
- Güntürkün O, Remy M. The topographical projection of the nucleus isthmi pars parvocellularis (Ipc) onto the tectum opticum in the pigeon. Neurosci Lett. 1990;111:18–22. doi: 10.1016/0304-3940(90)90337-9. [DOI] [PubMed] [Google Scholar]
- Hellmann B, Güntürkün O. Structural organization of parallel information processing within the tectofugal visual system of the pigeon. J Comp Neurol. 2001;429:94–112. doi: 10.1002/1096-9861(20000101)429:1<94::aid-cne8>3.0.co;2-5. [DOI] [PubMed] [Google Scholar]
- Hellmann B, Manns M, Güntürkün O. Nucleus isthmi, pars semilunaris as a key component of the tectofugal visual system in pigeons. J Comp Neurol. 2001;436:153–166. [PubMed] [Google Scholar]
- Hunt SP, Webster KE. The projection of the retina upon the optic tectum of the pigeon. J Comp Neurol. 1975;162:433–445. doi: 10.1002/cne.901620403. [DOI] [PubMed] [Google Scholar]
- Hunt SP, Streit P, Künzle H, Cuénod M. Characterization of the pigeon isthmo-tectal pathway by selective uptake and retrograde movement of radioactive compounds and by Golgi-like horseradish peroxidase labeling. Brain Res. 1977;129:197–212. doi: 10.1016/0006-8993(77)90001-4. [DOI] [PubMed] [Google Scholar]
- Itti L, Koch C. Computational modelling of visual attention. Nat Rev Neurosci. 2001;2:194–203. doi: 10.1038/35058500. [DOI] [PubMed] [Google Scholar]
- Karten H, Hodos W. Baltimore: Johns Hopkins; 1967. A stereotaxic atlas of the brain of the pigeon Columba livia. [Google Scholar]
- Karten HJ, Hodos W, Nauta WJ, Revzin AM. Neural connections of the visual Wulst, of the avian telencephalon. Experimental studies in the pigeon (Columba livia) and owl (Speotyto cunicularia) J Comp Neurol. 1973;150:253–278. doi: 10.1002/cne.901500303. [DOI] [PubMed] [Google Scholar]
- Karten HJ, Cox K, Mpodozis J. Two distinct populations of tectal neurons have unique connections within the retinotectorotundal pathway of the pigeon (Columba livia) J Comp Neurol. 1997;387:449–465. [PubMed] [Google Scholar]
- Knudsen EI. Fundamental components of attention. Annu Rev Neurosci. 2007;30:57–78. doi: 10.1146/annurev.neuro.30.051606.094256. [DOI] [PubMed] [Google Scholar]
- Krützfeldt NO, Wild JM. Definition and connections of the entopallium in the zebra finch (Taeniopygia guttata) J Comp Neurol. 2004;468:452–465. doi: 10.1002/cne.10972. [DOI] [PubMed] [Google Scholar]
- Krützfeldt NO, Wild JM. Definition and novel connections of the entopallium in the pigeon (Columba livia) J Comp Neurol. 2005;490:40–56. doi: 10.1002/cne.20627. [DOI] [PubMed] [Google Scholar]
- Laverghetta AV, Shimizu T. Organization of the ectostriatum based on afferent connections in the zebra finch (Taeniopygia guttata) Brain Res. 2003;963:101–112. doi: 10.1016/s0006-8993(02)03949-5. [DOI] [PubMed] [Google Scholar]
- Luksch H. Cytoarchitecture of the avian optic tectum: neuronal substrate for cellular computation. Rev Neurosci. 2003;14:85–106. doi: 10.1515/revneuro.2003.14.1-2.85. [DOI] [PubMed] [Google Scholar]
- Luksch H, Cox K, Karten HJ. Bottlebrush dendritic endings and large dendritic fields: motion-detecting neurons in the tectofugal pathway. J Comp Neurol. 1998;396:399–414. [PubMed] [Google Scholar]
- Luksch H, Karten HJ, Kleinfeld D, Wessel R. Chattering and differential signal processing in identified motion-sensitive neurons of parallel visual pathways in the chick tectum. J Neurosci. 2001;21:6440–6446. doi: 10.1523/JNEUROSCI.21-16-06440.2001. [DOI] [PMC free article] [PubMed] [Google Scholar]
- Major DE, Luksch H, Karten HJ. Bottlebrush dendritic endings and large dendritic fields: motion-detecting neurons in the mammalian tectum. J Comp Neurol. 2000;423:243–260. [PubMed] [Google Scholar]
- Marín G, Letelier JC, Henny P, Sentis E, Farfán G, Fredes F, Pohl N, Karten H, Mpodozis J. Spatial organization of the pigeon tectorotundal pathway: an interdigitating topographic arrangement. J Comp Neurol. 2003;458:361–380. doi: 10.1002/cne.10591. [DOI] [PubMed] [Google Scholar]
- Marín G, Mpdozis J, Sentis E, Ossandón T, Letelier JC. Oscillatory bursts in the optic tectum of birds represent re-entrant signals from the nucleus isthmi pars parvocellularis. J Neurosci. 2005;25:7081–7089. doi: 10.1523/JNEUROSCI.1379-05.2005. [DOI] [PMC free article] [PubMed] [Google Scholar]
- Marín G, Salas C, Sentis E, Rojas X, Letelier JC, Mpodozis J. A cholinergic gating mechanism controlled by competitive interactions in the optic tectum of the pigeon. J Neurosci. 2007;27:8112–8121. doi: 10.1523/JNEUROSCI.1420-07.2007. [DOI] [PMC free article] [PubMed] [Google Scholar]
- Mulckhuyse M, Theeuwes J. Unconscious attentional orienting to exogenous cues: a review of the literature. Acta Psychol (Amst) 2010;134:299–309. doi: 10.1016/j.actpsy.2010.03.002. [DOI] [PubMed] [Google Scholar]
- Nguyen AP, Spetch ML, Crowder NA, Winship IR, Hurd PL, Wylie DR. A dissociation of motion and spatial-pattern vision in the avian telencephalon: implications for the evolution of “visual streams.”. J Neurosci. 2004;24:4962–4970. doi: 10.1523/JNEUROSCI.0146-04.2004. [DOI] [PMC free article] [PubMed] [Google Scholar]
- Reiner A, Brecha NC, Karten HJ. Basal ganglia pathways to the tectum: the afferent and efferent connections of the lateral spiriform nucleus of pigeon. J Comp Neurol. 1982;208:16–36. doi: 10.1002/cne.902080103. [DOI] [PubMed] [Google Scholar]
- Revzin AM. Functional localization in the nucleus rotundus. In: Granda AM, Maxwell JH, editors. Neural mechanisms of behaviour in the pigeon. New York: Plenum; 1979. pp. 165–175. [Google Scholar]
- Reynolds JH, Chelazzi L. Attentional modulation of visual processing. Annu Rev Neurosci. 2004;27:611–647. doi: 10.1146/annurev.neuro.26.041002.131039. [DOI] [PubMed] [Google Scholar]
- Sereno MI, Ulinski PS. Caudal topographic nucleus isthmi and the rostral nontopographic nucleus isthmi in the turtle, Pseudemys scripta. J Comp Neurol. 1987;261:319–346. doi: 10.1002/cne.902610302. [DOI] [PubMed] [Google Scholar]
- Shao J, Lai D, Meyer U, Luksch H, Wessel R. Generating oscillatory bursts from a network of regular spiking neurons without inhibition. J Comput Neurosci. 2009;27:591–606. doi: 10.1007/s10827-009-0171-5. [DOI] [PMC free article] [PubMed] [Google Scholar]
- Soltani A, Koch C. Visual saliency computations: mechanisms, constraints, and the effect of feedback. J Neurosci. 2010;30:12831–12843. doi: 10.1523/JNEUROSCI.1517-10.2010. [DOI] [PMC free article] [PubMed] [Google Scholar]
- Stark E, Abeles M. Predicting movement from multiunit activity. J Neurosci. 2007;27:8387–8394. doi: 10.1523/JNEUROSCI.1321-07.2007. [DOI] [PMC free article] [PubMed] [Google Scholar]
- Wang Y, Frost BJ. Time to collision is signalled by neurons in the nucleus rotundus of pigeons. Nature. 1992;356:236–238. doi: 10.1038/356236a0. [DOI] [PubMed] [Google Scholar]
- Wang Y, Major DE, Karten HJ. Morphology and connections of nucleus isthmi pars magnocellularis in chicks (Gallus gallus) J Comp Neurol. 2004;469:275–297. doi: 10.1002/cne.11007. [DOI] [PubMed] [Google Scholar]
- Wang Y, Luksch H, Brecha NC, Karten HJ. Columnar projections from the cholinergic nucleus isthmi to the optic tectum in chicks (Gallus gallus): a possible substrate for synchronizing tectal channels. J Comp Neurol. 2006;494:7–35. doi: 10.1002/cne.20821. [DOI] [PubMed] [Google Scholar]
- Wang YC, Jiang S, Frost BJ. Visual processing in pigeon nucleus rotundus: luminance, color, motion, and looming subdivisions. Vis Neurosci. 1993;10:21–30. doi: 10.1017/s0952523800003199. [DOI] [PubMed] [Google Scholar]
- Wiggers W. Isthmotectal connections in plethodontid salamanders. J Comp Neurol. 1998;395:261–272. [PubMed] [Google Scholar]
- Womelsdorf T, Fries P, Mitra PP, Desimone R. Gamma-band synchronization in visual cortex predicts speed of change detection. Nature. 2006;439:733–736. doi: 10.1038/nature04258. [DOI] [PubMed] [Google Scholar]
- Wylie DR, Gutierrez-Ibanez C, Pakan JM, Iwaniuk AN. The optic tectum of birds: mapping our way to understanding visual processing. Can J Exp Psychol. 2009;63:328–338. doi: 10.1037/a0016826. [DOI] [PubMed] [Google Scholar]
- Yang J, Li X, Wang SR. Receptive field organization and response properties of visual neurons in the pigeon nucleus semilunaris. Neurosci Lett. 2002;331:179–182. doi: 10.1016/s0304-3940(02)00882-0. [DOI] [PubMed] [Google Scholar]
- Zeier H, Karten HJ. The archistriatum of the pigeon: organization of afferent and efferent connections. Brain Res. 1971;31:313–326. doi: 10.1016/0006-8993(71)90185-5. [DOI] [PubMed] [Google Scholar]