

Abstract
The spatial distribution of ion channels is an important determinant of neuronal excitability. However, there are currently no quantitative techniques to map endogenous ion channels with single-channel resolution in living cells. Here, we demonstrate that integration of pharmacology with single-molecule atomic force microscopy (AFM) allows for the high-resolution mapping of native potassium channels in living neurons. We focus on calcium-activated small conductance (SK) potassium channels, which play a critical role in brain physiology. By linking apamin, a toxin that specifically binds to SK channels, to the tip of an AFM cantilever, we are able to detect binding events between the apamin and SK channels. We find that native SK channels from rat hippocampal neurons reside primarily in dendrites as single entities and in pairs. We also show that SK channel dendritic distribution is dynamic and under the control of protein kinase A. Our study demonstrates that integration of toxin pharmacology with single-molecule AFM can be used to quantitatively map individual native ion channels in living cells, and thus provides a new tool for the study of ion channels in cellular physiology.
Introduction
A major challenge in cellular biology is to determine the subcellular distribution of ion channels resident in neurons and other cells in living tissue. In neurons, the differential localization of ion channels specifies the intrinsic excitability and computational properties of the subcellular neuronal compartments (dendrites, soma, axon). The distribution of ion channels is typically determined using antibodies raised against ion channel subunits together with light, confocal, total internal reflection fluorescence (TIRF) microscopy or electron microscopy (EM). These studies have revealed that ion channels can be polarized within cells and can concentrate in high- and low-density areas within the plasma membrane (Vacher et al., 2008; Nusser, 2009).
Unlike confocal or TIRF microscopy, which have an in-plane spatial resolution of ∼250 nm, immunogold-EM has a spatial resolution of 20–30 nm, making it the highest resolution method to determine the subcellular distribution of ion channels (Toomre and Bewersdorf, 2010; Nusser, 2012). However, it is limited by its inability to map ion channels in living cells. Lately, several advances in super-resolution fluorescence microscopy have made it possible to image proteins in either living or fixed tissue at high spatial resolutions (30–70 nm; Toomre and Bewersdorf, 2010). Still, these approaches are generally limited by antibody specificity and/or the use of fluorescent labels that require overexpression of tagged channels in cells.
Recently, single-molecule atomic force microscopy (AFM) has been used to localize native proteins in living cells at high resolution (∼10 nm; Müller et al., 2009). The technique involves detection of binding events occurring between a cell surface protein and a protein attached to the tip of the AFM cantilever (Dufrêne and Hinterdorfer, 2008). However, single-molecule AFM inherently relies on the specificity and affinity of the protein–protein interactions, which are often unknown. Given the wealth of knowledge available regarding the binding of natural toxins to specific ion channels, we hypothesized that combination of AFM with toxin pharmacology could reveal the localization of endogenous ion channels in neurons with single-channel resolution.
Following neuronal activity, calcium can activate apamin-sensitive small conductance (SK) channels with relatively high affinity (Faber et al., 2005; Ngo-Anh et al., 2005; Bloodgood and Sabatini, 2007). Such activation can regulate synaptic plasticity and dendritic neuronal excitability (Adelman et al., 2012). SK channels are enriched in dendrites and postsynaptic densities, although other evidence indicates an approximately uniform neuronal distribution (Bowden et al., 2001; Sailer et al., 2002, 2004; Lin et al., 2008; Ballesteros-Merino et al., 2012). Moreover, the spatial organization of these channels within a neuronal compartment is unclear. At least one SK channel isoform (SK2-L) is prone to clustering in heterologous cells (Strassmaier et al., 2005), raising the possibility that SK channels might not be uniformly distributed on neuronal surfaces, even within a neuronal compartment. To determine SK channel subcellular distribution, we speculated that by attaching apamin molecules to the tip of an AFM cantilever, we could detect binding forces between apamin and single SK channels on neuronal surfaces of living cells. Apamin is a bee venom toxin that specifically binds to SK channels at their extracellular region with high affinity and with 1:1 stoichiometry (Weatherall et al., 2010).
Materials and Methods
Experiments were carried out according to the guidelines of the University of Connecticut Institutional Animal Care and Use Committee.
Preparation of functionalized cantilever probes.
Silicon nitride AFM cantilevers were rinsed with ethanol and 18 MΩ water before being treated with 30 μl of APTES and 10 μl of triethylamine for 1 h. Cantilevers were then added to the PEG-linker solution containing the following: 0.5 ml of methylene chloride, 7 μl of triethylamine, and 7.5 μl of PEG-linker (Quanta Biodesign) at 4°C for 1 h. Probes were rinsed with methylene chloride, ethanol, and 18 MΩ water. A total of 50 μl of 100 nm apamin was added in contact with the probes for 2 h. Cantilevers were rinsed in PBS buffer and stored in PBS at 4°C.
Atomic force microscopy measurements.
Binding force maps and force–distance curves were obtained using a MFP-3D-BIO (Asylum Research) AFM. HEK293T cell measurements were performed in culture media at 25°C. Neuronal cell measurements were performed in Neurobasal media stabilized with 30 μl of 20 mm HEPES buffer at 25°C. Cells were located via differential interference contrast microscopy, and a scan area of 1 μm2 was chosen with a lateral resolution of 31.25 nm.
Unless otherwise specified, measurements were recorded with a loading rate of 24,000 pN/s, calculated by multiplying the tip retraction velocity (nm/s) by the cantilever spring constant (pN/nm). The nominal spring constant kc of the used cantilever was 30 pN/nm, as provided by the manufacturer. Exact values for the cantilever spring constants were obtained via a thermal noise-based method implemented by the manufacturer and used in all calculations. This cantilever stiffness was chosen because it is known that when kc > 10 pN/nm, the soft linkage of the protein–protein interaction dominates the behavior of the cantilever-protein effective spring system (Evans, 2001). Probes had nominal tip radii of 20 nm and nominal angle of 20°.
Electrophysiology.
HEK293T cells were transfected with recombinant DNA (0.1–3 μg) using Lipofectamine 2000 (Invitrogen) and recorded 24 h post-transfection. SK2 currents were recorded with conventional whole-cell patch-clamp recordings. The recording electrodes were filled with solution containing (in mm): 110 K-gluconate, 10 KCl, 20 KOH, 4 Mg · ATP, 8.73 CaCl2, 20 HEPES, 10 EGTA · KOH, pH 7.2. Based on the Ca-Mg-ATP-EGTA Calculator v1.0 using constants from National Institute of Standards and Technology database #46 v8, the free Ca2+ concentration was 1.1 μm. The electrode resistances were 4–5 MΩ. The extracellular solution contained (in mm): 144 NaCl, 2.5 KCl, 2.5 CaCl2, 1.2 MgCl2, 10 HEPES, and 22 glucose, pH 7.2. A voltage ramp was applied from a holding potential of −100 mV to +20 mV (13 mV/s). The data were low-pass filtered at 2 kHz and sampled at 10 kHz. For all recordings, we used a Multiclamp 700B amplifier interfaced to a computer through a Digidata 1440A digitizer (Molecular Devices). Data were acquired with Clampex v10.2 (Molecular Devices).
Primary hippocampal cultures.
Dissociated hippocampal cultures were prepared from Sprague Dawley pups of either sex as described previously (Lim and Walikonis, 2008).
Molecular biology.
SK2-S subcloned into a pEGFP-N1 vector (Clontech) was a gift from Dr. Chul-Seung Park (Gwangju Institute of Science and Technology, Gwangju, Korea), while SK2-L was a gift from John P. Adelman (Vollum Institute, Oregon Health and Science University, Portland, OR).
Data analysis.
To detect the distribution of SK2 channels on the cell surface, spatially resolved binding force maps were recorded using an apamin functionalized probe over 1 μm2 areas. Binding forces were extracted from each of the 1024 force curves acquired from each test. A MATLAB (MathWorks) program was used to create visual binding force maps.
Results
To test our approach, we functionalized the tip of an AFM cantilever with apamin through a PEG-linker (Fig. 1A) and transiently transfected HEK293T cells with the most commonly used SK2 channel isoform, SK2-S. Force–distance curves were recorded between the apamin-functionalized tips and SK2-S channels. A binding force is defined as the maximum rupture force associated with the force–distance curve (Fig. 1B). We expected that binding forces would be higher in areas where the apamin-functionalized cantilever made contact with underlying SK channels compared with areas without SK channels, as the attraction between apamin and the channels would require a higher rupture force compared with apamin interactions with the plasma membrane. Binding forces were measured over a 1 μm2 area of HEK293T plasma membrane in cells transfected with SK2-S. For each recording, 1024 force–distance curves were obtained with a lateral resolution of 31.25 nm. Potassium channel width has been reported to be ∼10 nm (Sokolova et al., 2001). Figure 1Ci shows an example of a SK2-S binding force map with rupture forces detected between 21.0 and 56.4 pN for events above baseline. Such events were detected in 4.56 ± 0.75% of sampled sites (n = 6). We also investigated the dynamics of the apamin SK2-S interaction by recording the force–distance curves at different cantilever retraction rates (2400 pN/s, 32 ± 7 pN; 24,000 pN/s, 33 ± 10 pN; 240,000 pN/s, 34 ± 10 pN; n = 3). The mean binding force did not depend on the retraction rate, suggesting that the observed interactions between apamin and SK2-S were at thermodynamic equilibrium (Evans, 2001).
Figure 1.
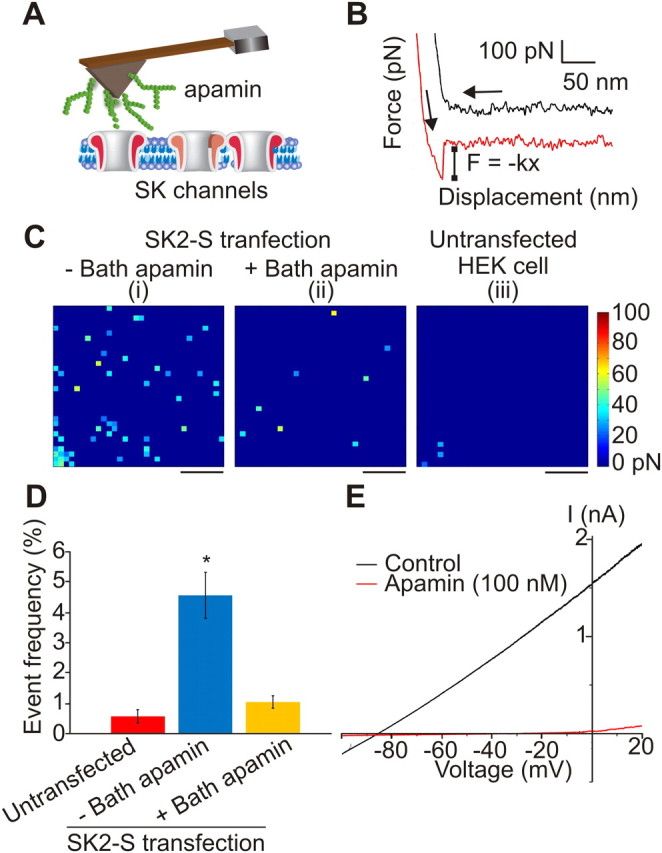
Detection of SK2 channels on living cells using AFM. A, AFM cantilever probe is functionalized with apamin, a toxin that specifically binds to SK channels. B, When apamin attached to the AFM probe adheres to an SK2 channel on the cell surface, the force–displacement curve exhibits an abrupt shift to zero value as shown in the red curve. The shift corresponds to the rupture force. If there is no SK2 channel at the detection point and consequently no binding interaction, the retraction curve is smooth similar to the black curve. The arrow pointing from right-to-left shows the movement of the AFM probe approaching and making contact with the cell surface, while the arrow pointing downward and to the right demonstrates the movement of the AFM probe retracting from the cell surface. C, Binding force map of a HEK293T cell transfected with SK2-S channels in the absence (i) and presence of 100 nm ambient apamin (ii) to mask SK2 channels apamin binding sites. iii, Binding force map of an untransfected HEK293T cell probed with an apamin functionalized probe shows minimal attraction. Each pixel corresponds to a rupture force according to the color scale shown. D, Frequency graph of untransfected and SK2-S-transfected cells in the absence or presence of ambient apamin. Star indicates statistical significance of p < 0.01 (ANOVA Tukey post hoc test). E, Expression of SK2-S channels in HEK293T lead to apamin-sensitive currents. Scale bars, 250 nm. Color scale as shown.
To determine the specificity of the measured binding forces, we repeated experiments in SK2-S-transfected cells preincubated with apamin as well as untransfected HEK293T cells. As shown in Figure 1, C and D, we found that the frequency of binding force events was not significantly different between SK2-S-transfected cells preincubated with apamin (Fig. 1Cii) and untransfected cells (Fig. 1Ciii). Events with significant binding forces most likely reflected SK2-S channels that were not bound by bath-applied apamin. Last, we measured SK2-S current using patch-clamp electrophysiological recordings to verify that the expressed channels were functional and apamin-sensitive (Fig. 1E).
Do the detected events indicate the presence of a single SK channel? To answer this question, we transfected varying concentrations of two SK channel isoforms, SK2-S and SK2-L in HEK293T cells. Previously it has been shown that the SK2-L isoform tends to form clusters possibly due to its cysteine-rich N terminus (Strassmaier et al., 2005), unlike the SK2-S isoform. We found that increasing the concentration of transfected SK2-S plasmid (0.5–3.0 μg) did not substantially change the mean binding force of detected events (0.5 μg, 27 ± 7 pN; 1.5 μg, 32 ± 8 pN; 3.0 μg, 31 ± 10 pN; Fig. 2A). By plotting a histogram of binding forces, a unimodal Gaussian distribution was obtained for each concentration. The unimodal distribution together with the unchanged mean binding force suggested that we primarily detected a single population of SK2-S channels with no more than one SK2-S channel per 31.25 nm.
Figure 2.
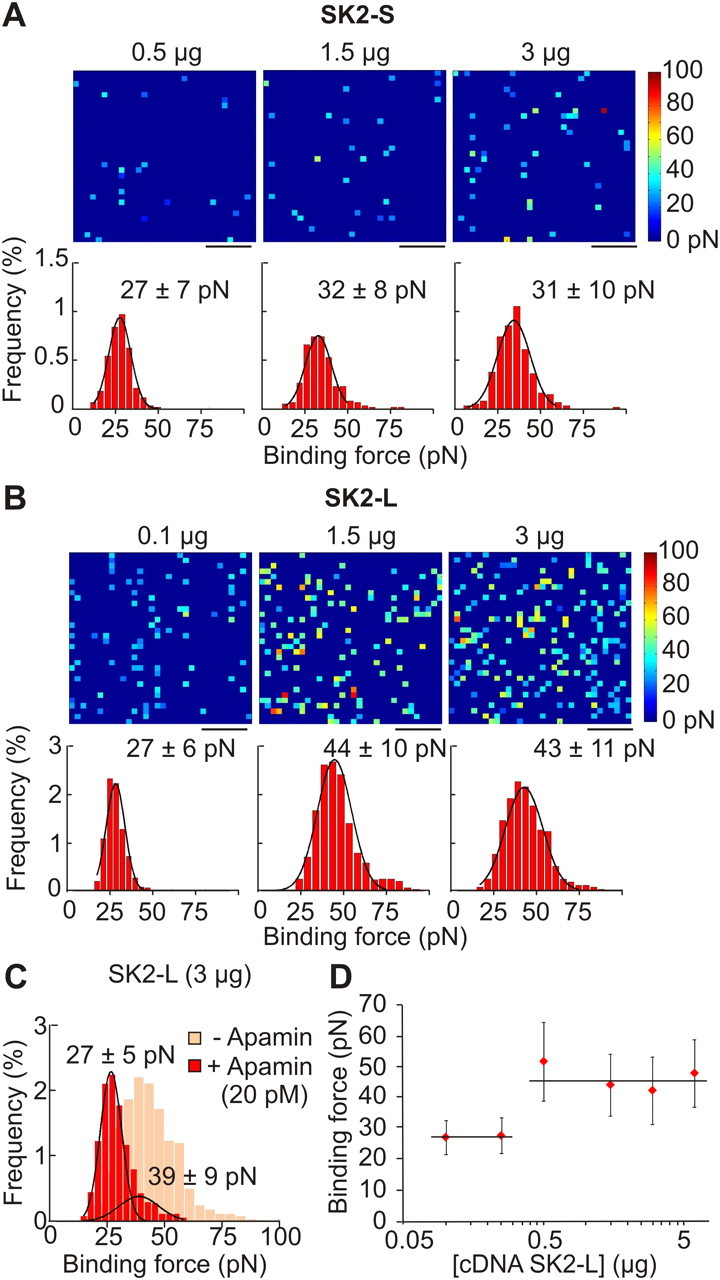
Counting SK2 channels in living cells. A, B, Binding force map and corresponding frequency histograms of HEK293T cells transfected with 3.0 μg of SK2-S (n = 6), 1.5 μg of SK2-S (n = 6), and 0.5 μg of SK2-S (n = 6) (A), or 0.1 μg of SK2-L (n = 6), 1.5 μg of SK2-L (n = 6), and 3.0 μg of SK2-L (n = 6) (B). C, Binding force frequency histograms of HEK293T cells transfected with 3.0 μg of SK2-L (n = 5) preincubated with 20 pm apamin. D, Summary graph showing the relationship between binding force and increased levels of SK2-L transfection. Scale bars, 250 nm. Color scale as shown.
A different situation was encountered with the SK2-L isoform. Increasing the concentration of transfected SK2-L plasmid from 0.1 to 3.0 μg substantially increased the mean binding force (0.1 μg, 27 ± 6 pN; 1.5 μg, 44 ± 10 pN; 3.0 μg, 43 ± 11 pN; Fig. 2B). Cells transfected with 0.1 μg of SK2-L resulted in force distributions similar to experiments on cells transfected with the SK2-S isoform, suggesting that at this very low concentration, single SK2-L channels can be identified. At the higher concentrations of 1.5 and 3.0 μg, the mean binding forces for SK2-L were approximately twice as large as the mean force obtained with 0.1 μg SK2-L or the nonclustering SK2-S.
Considering that both isoforms share the same apamin binding site sequence (Strassmaier et al., 2005), the higher mean binding force most likely reflected the presence of two SK2-L channels per recorded site. If this was the case, cells preincubated with 20 pm apamin should have a similar mean binding force to the value obtained for single SK2-L channels. This is because the dissociation constant (KD) for apamin binding to SK2 channels is ∼10 pm (Weatherall et al., 2010). Thus, in the presence of 20 pm apamin, at least one of the two SK2-L channels in a cluster should be occupied by apamin, thereby becoming unavailable for detection by the AFM probe. Indeed, in cells transfected with 3 μg of SK2-L and in the presence of ambient 20 pm apamin, the binding force histogram became bimodal (Fig. 2C) with a major peak at 27 ± 5 pN (n = 5), a value similar to that obtained with low plasmid concentrations (27 pN; Fig. 2D). A minor second peak was also recorded (39 ± 9 pN, n = 5), likely reflecting remaining clustered channels not bound by the preapplied apamin. In summary, our data suggest that the apamin-dependent binding forces measured by AFM are specific and can be used to quantitatively map SK channels on living cell surfaces.
After establishing the technique in HEK293T cells, we next employed AFM using apamin-functionalized tips to map the subcellular distribution of native SK channels in cultured hippocampal pyramidal neurons. Although SK channels play a critical role in hippocampal neurons, there is no consensus about their subcellular localization, with some studies indicating a somatic localization of SK channels (Bowden et al., 2001) whereas others, a more dendritic localization of SK channels (Lin et al., 2008; Ballesteros-Merino et al., 2012). We probed different 1 μm2 cell surface regions, focusing on the soma and dendrites (Fig. 3). Based on our recordings, SK channel distribution in neurons was polarized with the highest binding event frequency found on dendritic regions furthest from the soma (>30 μm; 6.2 ± 1.1%, n = 11), and the lowest frequency at the soma itself (0.29 ± 0.1%, n = 5), a 20-fold difference (Fig. 3A–C; p < 0.001, Student's t test). The frequency of binding events at dendritic areas proximal to the soma (∼10–20 μm) was 0.70 ± 0.2% (n = 7). Interestingly, the binding force distribution at more distal dendritic regions (>30 μm) did not follow a unimodal distribution, but instead was best fitted as a mixture of two Gaussians with peaks at 22 ± 6 pN and 41 ± 14 pN (Fig. 3). These values are similar to those we obtained for single and clustered channels in HEK293T cells (Fig. 2), suggesting that native SK channels are distributed as single channels or as groups of two channels in distal dendritic regions of hippocampal pyramidal neurons. Therefore, the density of SK channels on dendritic surfaces is ∼60–90 channels/μm2, assuming a 6.2% event detection frequency over the 1024 samples in the 1 μm2 area (Fig. 3).
Figure 3.

SK channels are polarized in pyramidal neurons. A, Binding force maps and corresponding histogram showing detected SK channels on the distal region of the dendrite (n = 11). B, Binding force maps and corresponding histogram showing detected SK2 channels on the proximal region of the dendrite (n = 7). C, Binding force maps and corresponding histogram showing the detection of SK channels on the soma (n = 7). D, Binding force maps and corresponding histogram showing the detection of SK channels on the soma after transfection with SK channels (n = 6). Scale bars, 250 nm. Color scale as shown.
The absence of apamin-sensitive SK channels at the soma was intriguing given that they had been detected in the soma of cultured pyramidal neurons in prior studies (Ngo-Anh et al., 2005). However, this work focused on the localization of transfected SK2-S channels rather than endogenous channels and may have resulted in artificially high levels of SK2 channels throughout the cell. To determine whether overexpression changed the distribution of channels, we overexpressed SK2-S channels in cultured hippocampal pyramidal neurons and repeated measurements with the apamin-functionalized AFM probe. In this situation, binding forces were readily detectable at the soma from SK2-S-transfected neurons (Fig. 3D). The binding force histogram could be fitted as a mixture of two Gaussians, with peaks of 40 ± 11 pN and 67 ± 14 pN (Fig. 3D), values approximately two- and threefold greater than the mean binding force for a single SK channel. This confirms that overexpressed SK2 channels are localized to the soma and suggests that they cluster in groups of two to three channels. However, the absence of significant binding events in the soma of untransfected neurons indicates that native SK channels are minimally expressed in this subcellular compartment.
Finally, we used the quantitative nature of this technique to determine how the dendritic SK channel distribution changes in response to neuromodulation. SK channel activity is affected by multiple neuromodulators, often through generation of cAMP and subsequent activation of protein kinase A (PKA). Studies in neurons and heterologous cells have shown that application of forskolin (FSK), a strong PKA activator, causes the internalization of SK2 channels from cell surfaces (Ren et al., 2006; Faber et al., 2008). Therefore, we measured binding events in neurons that had received either 15 or 30 μm forskolin for 15 min. Compared with untreated neurons, the more distal dendrites (>30 μm from the soma) of forskolin-treated neurons exhibited fewer apamin-dependent binding events (Fig. 4). Interestingly, the mean binding force histograms are different in all three conditions (Fig. 4C): (1) in untreated neurons there is a bimodal histogram with relatively equal peaks at 22 and 44 pN; (2) the histogram for neurons treated with 15 μm FSK is bimodal, with a larger peak at 31 pN and a smaller peak at 42 pN; and (3) the apamin binding force histogram follows a unimodal distribution after 30 μm forskolin treatment centered on 27 pN. The peak in the presence of 30 μm forskolin is centered at 27 pN, a value in between the two peaks in the untreated neurons, thus making it difficult to conclude whether clusters were preferentially lost. Future studies are needed to explore the effect of FSK on the SK channels' subcellular distribution.
Figure 4.
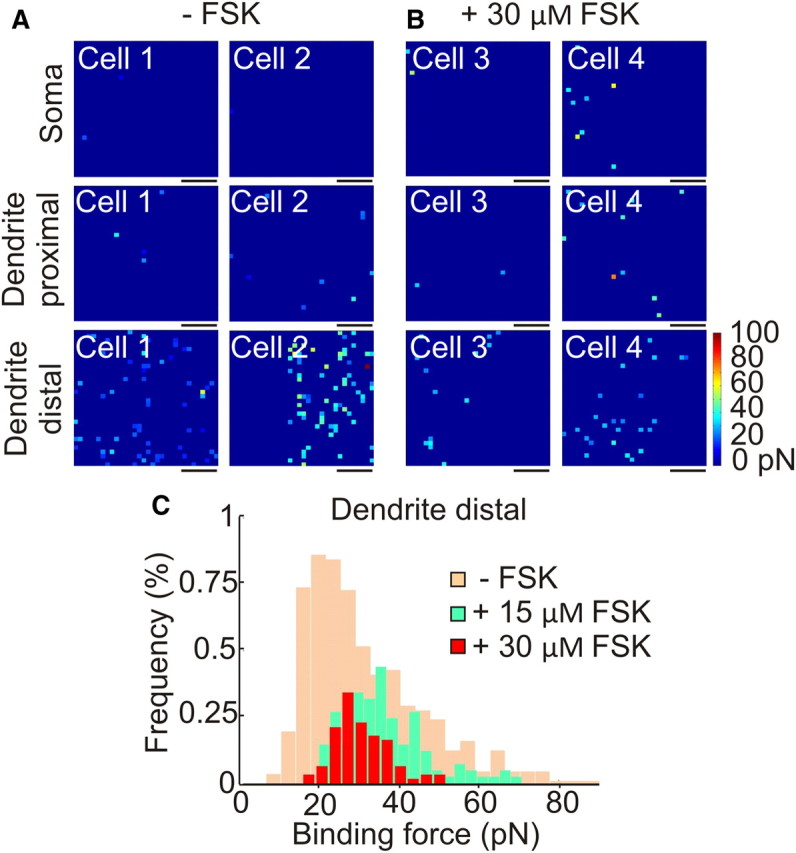
SK channel maps in pyramidal neurons are dynamic. A, Binding force maps showing detected SK2 channels without FSK on the soma, proximal dendrite, and outward dendrite. B, Binding force maps showing a significant decrease in detected SK2 channels after administration of 30 μm FSK for 15 min. C, Binding force histograms showing the distribution of rupture forces in the native state (tan, background; n = 11) and after 15 μm (green; n = 4) and 30 μm FSK administration (red, foreground; n = 6). Scale bars, 250 nm. Color scale as shown.
Discussion
In this work we show that integration of single-molecule AFM with toxin pharmacology allowed us to map the spatial organization and density of endogenous SK channels in living neurons. By taking advantage of the nanometer resolution of single-molecule AFM, we demonstrate that SK channels are highly concentrated on neuronal dendrites. Importantly, we show that SK channels are organized on neuronal membranes as either groups of two or single entities. This differential clustering might represent the distribution of the two SK2 channel isoforms, plasma membrane diffusional barriers, or areas of exocytosis. Currently, we cannot distinguish between these alternatives.
The high density of SK channels in dendrites is also consistent with electrophysiological and imaging work showing that SK channels are critical in regulating dendritic integration (Cai et al., 2004), controlling the kinetics of EPSPs, and induction of long-term potentiation, and learning and memory (Adelman et al., 2012). But is there a particular advantage for the high SK channel concentration in dendrites? We suggest that high SK channel concentration might increase the gain and reliability of SK channel activation. This might be necessary as SK channels are found in calcium microdomains. That is, SK channels and calcium channels are found within 100–150 nm distances from each other, unlike BK channels that are in calcium nanodomains (10–30 nm; Fakler and Adelman, 2008). As the calcium concentration decays very rapidly following calcium channel closure, the likelihood of activating SK channels would also decrease quickly. SK channels partly counteract this effect by having high calcium affinity (Km, ∼500–700 nm; Fakler and Adelman, 2008). However, SK channel activation might also be boosted though their high dendritic density. This will further increase their prospect of activation, as more SK channels will be available to capture calcium. Future studies and modeling are required to test this possibility and to examine whether high SK channel density could lead to buffered diffusion of calcium within the SK channel clusters (Katz and Miledi, 1973). Calcium buffered diffusion will further increase the probability of SK channel activation.
In conclusion, by using naturally derived toxins that bind with high affinity to ion channels, we can map the subcellular distribution of native ion channels at the cell surface. Over the years, toxins have emerged as an invaluable tool to study ion channel physiology as well as the relationship between their structure and function (Terlau and Olivera, 2004). Other studies have also used toxins for ion channel localization; however, these studies relied on non-living tissue and the use of either radioactive labeled toxins or toxins conjugated with fluorescence probes. Although conjugating toxins with fluorescent dyes would allow for the determination of ion channel density in living neurons, it would be difficult to visualize ion channels on the single-channel level without appropriate computational tools. Integration of toxin pharmacology with single-molecule AFM bypasses these issues, as it only requires knowledge of the forces between the toxin and the ion channel of interest. We expect our approach to have a significant impact to the study of ion channels and other surface proteins for which high-affinity toxins exist.
Footnotes
This work is supported by the University of Connecticut Research Foundation (A.V.T., G.L., R.S.W.) and the American Heart Association (Fellowship 11PRE7280009 to J.L.M.). We thank Drs. Karen Menuz and Jacques Wadiche for their comments on the manuscript.
The authors declare no competing financial interests.
References
- Adelman JP, Maylie J, Sah P. Small-conductance Ca2+-activated K+ channels: form and function. Annu Rev Physiol. 2012;74:245–269. doi: 10.1146/annurev-physiol-020911-153336. [DOI] [PubMed] [Google Scholar]
- Ballesteros-Merino C, Lin M, Wu WW, Ferrandiz-Huertas C, Cabañero MJ, Watanabe M, Fukazawa Y, Shigemoto R, Maylie J, Adelman JP, Luján R. Developmental profile of SK2 channel expression and function in CA1 neurons. Hippocampus. 2012;22:1467–1480. doi: 10.1002/hipo.20986. [DOI] [PMC free article] [PubMed] [Google Scholar]
- Bloodgood BL, Sabatini BL. Nonlinear regulation of unitary synaptic signals by CaV2.3 voltage-sensitive calcium channels located in dendritic spines. Neuron. 2007;53:249–260. doi: 10.1016/j.neuron.2006.12.017. [DOI] [PubMed] [Google Scholar]
- Bowden SEH, Fletcher S, Loane DJ, Marrion NV. Somatic colocalization of rat SK1 and D class (Cav 1.2) L-type calcium channels in rat CA1 hippocampal pyramidal neurons. J Neurosci. 2001;21:RC175. doi: 10.1523/JNEUROSCI.21-20-j0006.2001. (1–6) [DOI] [PMC free article] [PubMed] [Google Scholar]
- Cai X, Liang CW, Muralidharan S, Kao JPY, Tang CM, Thompson SM. Unique roles of SK and Kv4.2 potassium channels in dendritic integration. Neuron. 2004;44:351–364. doi: 10.1016/j.neuron.2004.09.026. [DOI] [PubMed] [Google Scholar]
- Dufrêne YF, Hinterdorfer P. Recent progress in AFM molecular recognition studies. Pflugers Arch. 2008;456:237–245. doi: 10.1007/s00424-007-0413-1. [DOI] [PubMed] [Google Scholar]
- Evans E. Probing the relation between force–lifetime–and chemistry in single molecular bonds. Annu Rev Biophys Biomol Struct. 2001;30:105–128. doi: 10.1146/annurev.biophys.30.1.105. [DOI] [PubMed] [Google Scholar]
- Faber ESL, Delaney AJ, Sah P. SK channels regulate excitatory synaptic transmission and plasticity in the lateral amygdala. Nat Neurosci. 2005;8:635–641. doi: 10.1038/nn1450. [DOI] [PubMed] [Google Scholar]
- Faber ESL, Delaney AJ, Power JM, Sedlak PL, Crane JW, Sah P. Modulation of SK channel trafficking by beta adrenoceptors enhances excitatory synaptic transmission and plasticity in the amygdala. J Neurosci. 2008;28:10803–10813. doi: 10.1523/JNEUROSCI.1796-08.2008. [DOI] [PMC free article] [PubMed] [Google Scholar]
- Fakler B, Adelman JP. Control of KCa channels by calcium nano/microdomains. Neuron. 2008;59:873–881. doi: 10.1016/j.neuron.2008.09.001. [DOI] [PubMed] [Google Scholar]
- Katz B, Miledi R. The binding of acetylcholine to receptors and its removal from the synaptic cleft. J Physiol. 1973;231:549–574. doi: 10.1113/jphysiol.1973.sp010248. [DOI] [PMC free article] [PubMed] [Google Scholar]
- Lim CS, Walikonis RS. Hepatocyte growth factor and c-Met promote dendritic maturation during hippocampal neuron differentiation via the Akt pathway. Cell Signal. 2008;20:825–835. doi: 10.1016/j.cellsig.2007.12.013. [DOI] [PMC free article] [PubMed] [Google Scholar]
- Lin MT, Luján R, Watanabe M, Adelman JP, Maylie J. SK2 channel plasticity contributes to LTP at Schaffer collateral-CA1 synapses. Nat Neurosci. 2008;11:170–177. doi: 10.1038/nn2041. [DOI] [PMC free article] [PubMed] [Google Scholar]
- Müller DJ, Helenius J, Alsteens D, Dufrêne YF. Force probing surfaces of living cells to molecular resolution. Nat Chem Biol. 2009;5:383–390. doi: 10.1038/nchembio.181. [DOI] [PubMed] [Google Scholar]
- Ngo-Anh TJ, Bloodgood BL, Lin M, Sabatini BL, Maylie J, Adelman JP. SK channels and NMDA receptors form a Ca2+-mediated feedback loop in dendritic spines. Nat Neurosci. 2005;8:642–649. doi: 10.1038/nn1449. [DOI] [PubMed] [Google Scholar]
- Nusser Z. Variability in the subcellular distribution of ion channels increases neuronal diversity. Trends Neurosci. 2009;32:267–274. doi: 10.1016/j.tins.2009.01.003. [DOI] [PubMed] [Google Scholar]
- Nusser Z. Differential subcellular distribution of ion channels and the diversity of neuronal function. Curr Opin Neurobiol. 2012;22:366–371. doi: 10.1016/j.conb.2011.10.006. [DOI] [PubMed] [Google Scholar]
- Ren Y, Barnwell LF, Alexander JC, Lubin FD, Adelman JP, Pfaffinger PJ, Schrader LA, Anderson AE. Regulation of surface localization of the small conductance Ca2+-activated potassium channel, Sk2, through direct phosphorylation by cAMP-dependent protein kinase. J Biol Chem. 2006;281:11769–11779. doi: 10.1074/jbc.M513125200. [DOI] [PubMed] [Google Scholar]
- Sailer CA, Hu H, Kaufmann WA, Trieb M, Schwarzer C, Storm JF, Knaus HG. Regional differences in distribution and functional expression of small-conductance Ca2+-activated K+ channels in rat brain. J Neurosci. 2002;22:9698–9707. doi: 10.1523/JNEUROSCI.22-22-09698.2002. [DOI] [PMC free article] [PubMed] [Google Scholar]
- Sailer CA, Kaufmann WA, Marksteiner J, Knaus HG. Comparative immunohistochemical distribution of three small-conductance Ca2+-activated potassium channel subunits, SK1, SK2, and SK3 in mouse brain. Mol Cell Neurosci. 2004;26:458–469. doi: 10.1016/j.mcn.2004.03.002. [DOI] [PubMed] [Google Scholar]
- Sokolova O, Kolmakova-Partensky L, Grigorieff N. Three-dimensional structure of a voltage-gated potassium channel at 2.5 nm resolution. Structure. 2001;9:215–220. doi: 10.1016/s0969-2126(01)00578-0. [DOI] [PubMed] [Google Scholar]
- Strassmaier T, Bond CT, Sailer CA, Knaus HG, Maylie J, Adelman JP. A novel isoform of SK2 assembles with other SK subunits in mouse brain. J Biol Chem. 2005;280:21231–21236. doi: 10.1074/jbc.M413125200. [DOI] [PubMed] [Google Scholar]
- Terlau H, Olivera BM. Conus venoms: a rich source of novel ion channel-targeted peptides. Physiol Rev. 2004;84:41–68. doi: 10.1152/physrev.00020.2003. [DOI] [PubMed] [Google Scholar]
- Toomre D, Bewersdorf J. A new wave of cellular imaging. Annu Rev Cell Dev Biol. 2010;26:285–314. doi: 10.1146/annurev-cellbio-100109-104048. [DOI] [PubMed] [Google Scholar]
- Vacher H, Mohapatra DP, Trimmer JS. Localization and targeting of voltage-dependent ion channels in mammalian central neurons. Physiol Rev. 2008;88:1407–1447. doi: 10.1152/physrev.00002.2008. [DOI] [PMC free article] [PubMed] [Google Scholar]
- Weatherall KL, Goodchild SJ, Jane DE, Marrion NV. Small conductance calcium-activated potassium channels: from structure to function. Prog Neurobiol. 2010;91:242–255. doi: 10.1016/j.pneurobio.2010.03.002. [DOI] [PubMed] [Google Scholar]