

Abstract
Perisoma-inhibiting interneurons (PIIs) control fundamental aspects of cortical network function by means of their GABAergic output synapses. However, whether they depolarize or hyperpolarize their target cells in the mature circuitry remains controversial. By using unitary field potential and gramicidin D perforated-patch recordings, we provide evidence that the postsynaptic effect of GABAergic synapses is fundamentally different in two regions of rat hippocampus. Signaling at PII output synapses is hyperpolarizing in CA1 principal cells (PCs) but depolarizing in dentate gyrus (DG) PCs. While the reversal potential of GABAA receptor-mediated currents is identical in both areas, ∼15 mV more negative resting potentials of DG compared with CA1 PCs underlie the opposing effects of perisomatic GABAergic transmission. Thus, the nature of PII output signaling is circuit-dependent and may therefore contribute differentially to information processing in the two brain areas.
Introduction
The hippocampus is a complex neuronal network that encodes places and sequences of events (Moser et al., 2008). GABAergic cells control fundamental aspects of these functions with their inhibitory output synapses. Perisoma-inhibiting interneurons (PIIs) provide rapid and strong feedforward and feedback inhibition in hippocampal circuits (Bartos et al., 2002, 2007). In particular, the shunting nature of the PII-mediated postsynaptic inhibitory conductance was proposed to be essential to control timing and frequency of action potential generation in target cells (Vida et al., 2006; Mann and Paulsen, 2007). Precise spike timing has been revealed to be a fundamental principle of coding in synchronously active principal cell (PC) assemblies (Buzsáki, 2006).
Although gramicidin perforated-patch recordings showed that GABAA receptor-mediated signaling is shunting in various postsynaptic interneuron types (Martina et al., 2001; Chavas and Marty, 2003; Vida et al., 2006; Sauer and Bartos, 2010) and remains shunting throughout postnatal development (Banke and McBain, 2006), one of the most basic questions, namely whether interneurons hyperpolarize or depolarize PCs, is still open. Gramicidin perforated-patch recordings have uncovered depolarizing actions of GABAergic input synapses on the dendrites and axon initial segment of neocortical PCs (Gulledge and Stuart, 2003; Szabadics et al., 2006), suggesting that they may recruit instead of inhibit PCs. Opposed to this, recent noninvasive unitary field potential (uField) recordings in the hippocampal CA1 (Glickfeld et al., 2009) and CA3 (Bazelot et al., 2010) region found inhibition on PCs to be hyperpolarizing along the entire somatodendritic axis. GABAergic signaling might therefore differ substantially among brain areas. Here we tested this hypothesis by examining the effect of individual morphologically identified PIIs on the PC population in the hippocampal dentate gyrus (DG) and CA1. We provide evidence that PII output signaling onto PCs is highly circuit-specific, depolarizing in the DG but hyperpolarizing in CA1. Thus, PIIs perform versatile forms of output signaling depending on which circuitry they are embedded in.
Materials and Methods
Electrophysiology.
Female and male Wistar rats of two age groups were used in this study: 17–25-d-old and 5–7-weeks-old. Animals were killed by decapitation in accordance with national legislation. Brains were transferred to an ice-cold solution containing the following (in mm): NaCl 87, NaHCO3 25, KCl 2.5, NaH2PO4 1.25, glucose 10, sucrose 75, CaCl2 0.5, and MgCl2 7 (aerated with 95%O2/5%CO2). Transverse hippocampal slices (300 μm) were cut with a vibratome (VT-1200; Leica), recovered (15–30 min, 34°C) in artificial CSF consisting of (in mm): NaCl 125, NaHCO3 25, KCl 2.5, NaH2PO4 1.25, glucose 25, CaCl2 2, and MgCl2 1 (equilibrated with 95%O2/5%CO2) and then stored at 20–23°C. Patch pipettes were pulled from borosilicate glass tubing (Hilgenberg; Flaming-Brown P-97 puller, Sutter Instruments). Pipettes for whole-cell patch-clamp recordings (pipette resistance, ∼3–6 MΩ) were filled with internal solution containing the following (in mm): HEPES 10, MgCl2 2, Na2ATP 2, EGTA 0.1, and either KCl 40 and K-gluconate 110 or KCl 20 and K-gluconate 120 (pH, 7.2). Biocytin (1–2 mg/ml) was added for morphological recovery. Two Axopatch200B or one Multiclamp 700B amplifier (Molecular Devices) were used. Signals were filtered at 5–10 kHz and digitized at 20–40 kHz with a Power1401 laboratory interface (Cambridge Electronic Design). Neurons were patched under infrared-differential interference contrast microscopy (IR-DIC). Pipette capacitance was compensated in all recordings. Action potential firing patterns were recorded during 1-s-long current injections of increasing amplitude (100 pA increments; −100–600 pA) with the access resistance (<20 MΩ) always compensated. The spike threshold was defined as the potential where the voltage slope exceeded 20 Vs−1 (Sauer and Bartos, 2010). Resting membrane potentials were determined in the I = 0 mode, immediately after break through. Data were acquired with custom-made software (F-pulse, Igor Pro 5; U. Fröbe, University of Freiburg, Freiburg, Germany). All perforated patch recordings and a subset of uField recordings in the DG were performed at recording temperatures of 30–34°C. All uField recordings in CA1 and a subset of uField measurements in the DG were done at room temperature (20–23°C). We did not observe an influence of the recording temperature on the amplitude of uFields (DG, −4.2 ± 1.0 vs −4.6 ± 0.6 μV at 20–23 and 30–34°C, 5 and 12 experiments, respectively; p = 0.793) or on the postsynaptic resting membrane potential (−75.8 ± 1.9 vs −75.8 ± 1.4 mV, 10 and 20 DG PCs, respectively; p = 0.480). Data obtained at different temperatures were therefore pooled.
uFields were measured with glass pipettes (∼1–4 MΩ) filled with 3 m NaCl (Glickfeld et al., 2009). Action potentials were evoked in interneurons by brief somatic current injection (1 ms, 600–1200 pA). uField traces were averaged (50–405 sweeps) and filtered offline using a fourth-order low-pass Bessel-filter (cutoff, 0.3 kHz). In a subset of experiments (n = 6), gabazine (5 μm) was bath-applied to examine the GABAA receptor-mediated nature of uField recordings. Multiple-pulse depression was analyzed as the ratio of the fifth to the first uField amplitude resulting from a presynaptic action potential train (5 pulses, 50 Hz). Peak amplitudes of uField signals were measured from preceding baseline. PC resting potentials were similar to previous reports (St John et al., 1997; Harvey et al., 2009).
Perforated-patch recordings were performed as reported previously (Sauer and Bartos, 2010). In brief, pipettes were tip-filled with a solution containing (in mm) HEPES 10, KCl 100, MgCl2 5, and glucose 5, and then back-filled with the same solution additionally containing gramicidin D (15–50 μg/ml; Sigma or Merck). A cell-attached configuration was obtained and a voltage pulse (10 mV) was applied to monitor the progressive decline of the access resistance. Recordings were started once the access resistance fell below 100 MΩ. IPSPs were pharmacologically isolated by bath-application of kynurenic acid (4–5 mm) and evoked by extracellular stimulation (0.1–0.5 Hz). When dendritic inputs were activated, CGP55845 (1 μm) was added to the bath to block GABAB receptors. Extracellular fiber stimulation was performed with glass pipettes filled with a solution containing the following (in mm): HEPES 5, NaCl 135, KCl 5.4, CaCl2 1.8, and MgCl2 1. The amplitude of average IPSPs was plotted against the holding potential (Vhold) and fitted with a second order polynomial function to determine the reversal potential of GABAA receptor-mediated currents (EGABA). Cells were repatched after perforated-patch measurements with a pipette filled with biocytin-containing solution (see above).
Electrophysiological data were analyzed with custom made software (Stimfit32, C. Schmidt-Hieber, University College London, UK), as described previously (Sauer and Bartos, 2010). Briefly, the rise time of evoked signals was determined as the time interval between the points corresponding to 20 and 80% of the peak amplitude. The decay phase of the signal was fitted with a biexponential function (A−t/τ1 + B−t/τ2) using a least-squares fit algorithm. Stimulation artifacts were clipped in all figures. Statistical significance was assessed using SigmaPlot 11 with a Student's t test, a Mann–Whitney U test, or one-way ANOVA analysis. Values are given as mean ± SEM.
Immunohistochemistry.
Slices were fixed in 4% paraformaldehyde overnight and stained as follows. For parvalbumin (PV)/biocytin colabeling, slices were washed in phosphate buffer and blocked in PBS plus 10% normal goat serum (NGS; 60 min). The primary antibody (rabbit anti-PV, 1:1000; Swant) was applied in PBS plus 0.3% Triton X-100 plus 5% NGS for 24 h at 22–24°C, the secondary antibody (goat anti-rabbit Cy3, 1:1000; Jackson Immunoresearch) was incubated together with streptavidin (AlexaFluor647-conjugate, 1:500; Invitrogen) in PBS plus 0.3% Triton X-100 plus 3% NGS for 24 h at 4°C. For staining of biocytin alone, slices were incubated with streptavidin (AlexaFluor647-conjugate, 1:500; Invitrogen) in PBS plus 0.3% Triton X-100 plus 3% NGS for 24 h at 4°C. Slices were mounted in Mowiol and visualized using a confocal microscope (LSM510 or LSM710; Zeiss).
Neuron identification.
Interneurons with their axon primarily located in the PC layer (PCL) were classified as PIIs. Axoaxonic cells and basket cells, the two PII types, could not be reliably distinguished. In the DG, PIIs expressed PV (6 of 7 tested cells) and had fast-spiking action potential firing patterns [600 pA current injection, 1 s: 99 ± 9 Hz; first/last interspike-interval (ISI): 1.02 ± 0.22; duration of single action potentials <0.5 ms; 12 cells]. One PV-negative PII had an adapting action potential phenotype (44 Hz at 600 pA; first/last ISI: 0.2). In CA1, four of seven PIIs were fast spiking (140 ± 10 Hz at 600 pA; first/last ISI: 0.61 ± 0.07) and the remaining three PIIs had adapting firing pattern (40 ± 2 Hz at 600 pA; first/last ISI: 0.27 ± 0.01). Neurons with axon in the DG molecular layer (ML) were classified as dendrite-inhibiting interneurons (DIIs). They fired adapting trains of action potentials (39 ± 3 Hz at 600 pA; first/last ISI: 0.31 ± 0.03; 3 cells) and did not express PV (13 cells). PCs were identified unequivocally by their characteristic soma shape under IR-DIC conditions. They were small and round in the DG but had a triangular shape in CA1. They discharged at low frequencies (DG: 26 ± 6 Hz at 400 pA; 3 cells; CA1: 13 ± 2 Hz at 200–300 pA; 3 cells) with a strongly adapting firing pattern (first/last ISI DG: 0.14 ± 0.03 at 400 pA; CA1: 0.22 ± 0.05 at 200–300 pA; half duration of single action potentials >0.5 ms). Recordings from DG PCs were performed in the outer third of the PCL (input resistances, <250 MΩ), identifying them as mature cells (Schmidt-Hieber et al., 2004). Images of the presented cells are either based on 2D maximum intensity projections of confocal stacks or 3D representations.
To analyze axon densities of interneurons, confocal single-plane images were used (20× objective, 1024 × 1024 pixels). A region of interest (ROI; 100 × 100 μm) was placed in the area of a labeled cell where the axon was visually judged as most dense. For PIIs, the ROI was centered in the PCL, ∼50–70 μm from the soma and for DIIs in the ML. Axon fragments in the ROI were traced using NeuronJ plug-in (V1.4.1) of ImageJ (V1.42 h). For quantification, the total axon length in the ROI (pixel/10000 μm2) was normalized to the average axonal length of DIIs.
Results
PII-mediated output signals are depolarizing in the DG and hyperpolarizing in CA1
To address the hypothesis of circuit-dependent GABAergic signaling systematically, we probed the nature of inhibition in the hippocampal DG and CA1. First, we measured extracellular uFields that are triggered by synaptic GABA release from an individual PII upon single-action potential generation in rat hippocampal slices (Glickfeld et al., 2009). These cells had axons confined to the PCL, a characteristic fast-spiking action potential phenotype, and expressed the Ca2+-binding protein PV (6 of 7 cells; Fig. 1) (Freund and Buzsáki, 1996). PIIs in the DG evoked negative uFields in the PCL when recorded with a glass electrode filled with 3 m NaCl (amplitude: −4.9 ± 0.6 μV, 17 cells; Fig. 2A). Since the extracellular uField gives a mirror image of the intracellular synaptic current in a large cohort of target neurons, these data indicate that PCs are depolarized by perisomatic GABAergic inputs. In contrast, PIIs in CA1 (Fig. 1B) produced positive uFields in the PCL, confirming the hyperpolarizing nature of perisomatic inhibition in CA1 (amplitude: 4.0 ± 0.9 μV; 7 cells; Fig. 2A) (Glickfeld et al., 2009). uFields reflected GABAA receptor-mediated events as gabazine (5 μm) abolished them (6 cells; Fig. 2B). Furthermore, uFields reversed polarity when the recording pipette was moved from the DG PCL to the ML (Fig. 2C), as expected from a current source located in the PCL. Finally, DG uFields had fast kinetic properties and showed multiple-pulse depression, characteristic for PII-mediated synaptic inhibition (Fig. 2D–F) (Kraushaar and Jonas, 2000). Depolarizing inhibition in the DG was observed at juvenile (∼3 weeks) and mature (>6 weeks; −2.4 ± 0.4 μV, 3 cells) stages, excluding a late developmental change to hyperpolarization in this circuit (Fig. 2G) (Banke and McBain, 2006). Thus, perisomatic inhibition is depolarizing in the DG but hyperpolarizing in the CA1 PC population.
Figure 1.

Identification of PIIs in the DG and CA1. A, Confocal image stack projection of a PII in the DG. Cells were filled with biocytin during whole-cell patch-clamp recordings and visualized with Alexa647-conjugated streptavidin. Note the dense axonal arbor in the PCL. Insets show the fast action potential firing response of the cell to 600 pA depolarizing current injection and the expression of PV in the cell's dendrite. Scale bar, 10 μm. B, A PII in CA1. Inset shows firing response to 600 pA current injection. sto, stratum oriens.
Figure 2.
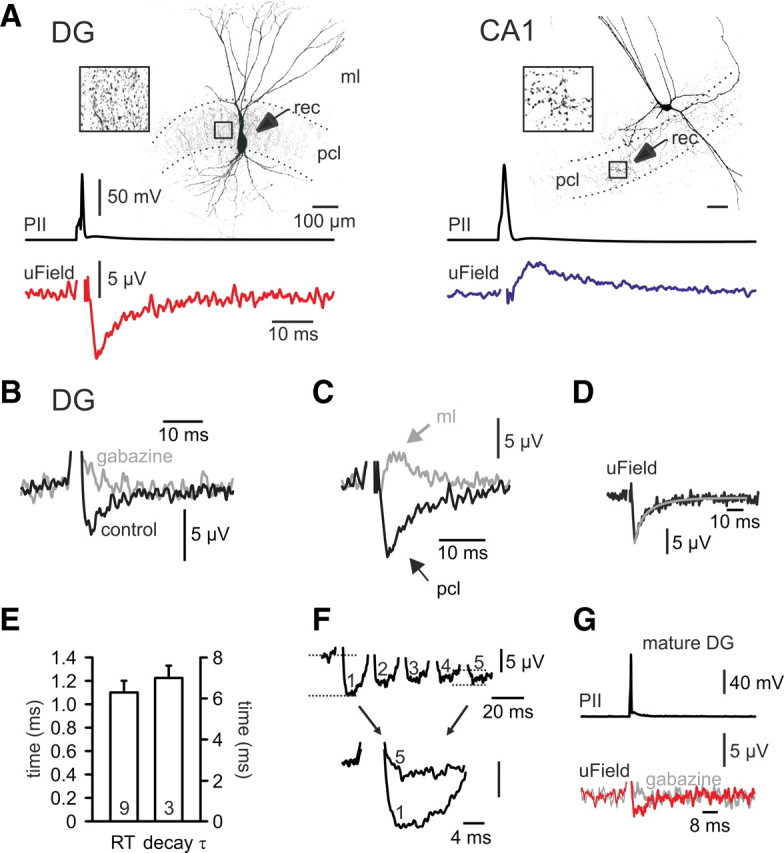
Depolarizing versus hyperpolarizing nature of perisomatic inhibition in the DG and CA1. A, Left, Single action potentials evoked in a DG PII generate negative uFields in the PCL. Right, Single action potentials evoked in a PII located in CA1 give rise to positive uFields. Boxes show the PII axon in the PCL at higher magnification. B, Gabazine (5 μm) blocks uFields, confirming their GABAA receptor-mediated nature. C, When the recording pipette (rec) is moved to the ML, uFields reverse their polarity. D, Biexponential fit (black) to the decay phase of an average uField recorded in the DG reveals its fast time course. E, Summary plot of the 20–80% rise time (RT; left scale) and the decay time constant (decay τ; right scale) of average uFields. F, Multiple-pulse depression of uFields in response to a presynaptic train of five action potentials at 50 Hz. Bottom, The first and the fifth uField of the train are superimposed. G, uFields in the DG of mature rats (P57–P61) are negative in amplitude and can be blocked by gabazine.
Distinct resting membrane potentials underlie circuit-specific effects of GABA
To determine whether the opposing nature of GABAergic inhibition in the DG and CA1 can be explained by different EGABA values, we performed gramicidin perforated-patch recordings from PCs (Fig. 3; see Material and Methods, above) (Kyrozis and Reichling, 1995). This technique allows electrical access to the neuron while leaving the intracellular Cl− concentration unchanged. Perisomatic GABAergic inputs were evoked by extracellular stimulation in the PCL during bath-application of the glutamate receptor antagonist kynurenic acid (Fig. 3A,E) and were blocked by gabazine, confirming their GABAA receptor-mediated nature (91 ± 5% block; 5 cells; Fig. 3H). IPSPs in DG PCs reversed polarity at −64.5 ± 2.4 mV (7 cells; Fig. 3A,D,G). Similarly, perisomatic EGABA on CA1 PCs was −67.8 ± 2.3 mV (10 cells), not significantly different from the values obtained in the DG (p = 0.348; Fig. 3D), indicating that EGABA is uniform across the two hippocampal regions. In contrast, the resting membrane potential of PCs differed significantly between DG and CA1 (−75.8 ± 1.1 mV vs −63.2 ± 1.0 mV; 30 and 19 cells, respectively; p < 0.001; Fig. 3D). In the DG, EGABA was between the resting potential and spike threshold (−41.3 ± 0.9 mV; 5 cells; p < 0.001), while it was more negative than the resting potential in CA1 (p = 0.036; Fig. 3G). Thus, different resting potentials underlie inverted directions of perisomatic GABAergic currents in the two areas.
Figure 3.

The different nature of inhibition in the DG and CA1 depends on the resting membrane potential. A, IPSPs are evoked in a DG PC at different Vhold (left) and IPSP amplitudes are plotted as a function of Vhold to reveal EGABA (right). B, Biocytin staining of the DG PC recorded in A. C, Top, Scheme of the recording configuration. Bottom, IR-DIC image of a PC during perforated-patch recording. Alexa488 in the pipette was used to monitor the integrity of the patch. D, Summary plots of EGABA and resting membrane potential (rest). E, F, Same as A and B, but data were obtained from a CA1 PC. G, Summary graphs of threshold potential (thres), EGABA, and rest. H, Evoked IPSPs are blocked by 5 μm gabazine, confirming their GABAA receptor-mediated nature. *p < 0.05; **p < 0.001. stim, stimulation.
Depolarizing inhibition is the general mode of GABAergic signaling in the DG
Previous results indicated a somatodendritic gradient of EGABA in DG PCs (Khirug et al., 2008). We therefore addressed whether dendrite-targeting GABAergic synapses in this brain region are also depolarizing in nature (Fig. 4). DIIs were identified on the basis of their axon distribution in the ML and their physiological properties (Fig. 4A,B; see Materials and Methods, above). Although we attempted to measure uFields in the ML elicited by DIIs, in 45 tested cells no signals could be recorded. This is probably due to the ∼2.5-fold lower density of DII compared with PII axons (normalized axon lengths in ROI: 1.0 ± 0.3 vs 2.5 ± 0.5 for DIIs and PIIs, 6 and 5 cells, respectively; p = 0.017; data not shown). We therefore performed perforated-patch recordings from PCs during extracellular stimulation of GABAergic fibers in the outer ML (Fig. 4C,D). As expected, IPSPs evoked in the ML had slower kinetics than PII-mediated IPSPs, both in the perforated-patch configuration (Fig. 4F; rise time: 6.9 ± 1.3 vs 3.4 ± 0.5 ms; 18 and 15 cells, respectively; p = 0.003) and in conventional whole-cell control recordings (rise time 3.6 ± 0.6 ms vs 2.0 ± 0.3 ms; 4 cells each group; p = 0.025, data not shown), supporting their dendritic origin. Dendritic IPSPs were furthermore blocked by gabazine (90 ± 5% block; 3 cells, data not shown). EGABA of dendritic IPSPs was indistinguishable from EGABA of perisomatic IPSPs (Fig. 4E; −64.0 ± 3.1 mV vs −64.5 ± 2.4 mV, 6 and 7 cells, respectively; p = 0.871). Thus, depolarizing inhibition is the general mode of GABAergic signaling on PCs in the DG.
Figure 4.

Dendritic GABA-signaling is depolarizing in the DG. A, Confocal image of a DII with axon in the ML (arrows). B, Top, Adapting action potential firing pattern in response to a 500 pA depolarizing current injection. Bottom, DIIs do not express PV (13 cells tested). C, Example of an EGABA measurement of DII-mediated IPSPs. Signals were recorded at various Vhold. D, IPSPs are plotted as a function of Vhold to reveal EGABA. E, Summary graph of dendritic and perisomatic EGABA in relation to action potential threshold (thres) and resting potential (rest). F, Stimulation in the DG ML (gray) elicits slower IPSPs than stimulation in the PCL (black), indicating that they are of dendritic origin. Traces are amplitude-scaled perforated-patch recordings from the same PC. **p < 0.001; n.s., not significant; stim, stimulation.
In contrast to the heterogeneous nature of GABAergic signaling on PCs, EGABA of perisomatic inputs onto hippocampal interneurons was always depolarizing or shunting. Perforated-patch recordings from DG interneurons during PCL stimulation revealed a mean EGABA of −53.0 ± 1.8 mV and an average resting potential of −69.1 ± 1.3 mV (10 cells; data not shown). Furthermore, CA1 interneurons were characterized by a mean perisomatic EGABA of −64.1 ± 3.2 and resting potential of −64.5 ± 1.5 mV (12 cells; data not shown), comparable to data obtained from interneuron recordings in CA3 (Banke and McBain, 2006). Thus, depolarizing or shunting soma-near inhibition on GABAergic cells seems to be a general principle applying to the entire hippocampus.
Discussion
We have determined the effect of GABA released from identified interneurons on the membrane potential of their target cells. Our data show that GABAA receptor-mediated IPSPs at PII output synapses are depolarizing in the DG and hyperpolarizing in CA1, indicating a circuit-specific nature of PII output signaling. This difference can be explained by region-specific membrane resting potentials rather than different Cl− homeostasis mechanisms (Fig. 3) because perforated-patch recordings demonstrated comparable EGABA of synaptically evoked IPSPs on PCs in both hippocampal areas. Likewise, uField recordings in the PCL of CA3 revealed hyperpolarizing signals generated by single CA3 interneurons including PIIs (Bazelot et al., 2010). Moreover, these data are consistent with perforated-patch recordings from CA3 PCs that identified an EGABA of perisomatically evoked IPSPs of ∼−73 mV, which is ∼10 mV more negative than the average resting membrane potential (Banke and McBain, 2006). The combination of uField and perforated-patch recordings in this study was a necessary step to examine the effect of identified interneurons on their postsynaptic target cells without perturbing the membrane potential or changing the Cl− gradient by strong extracellular stimulation (Staley et al., 1995) and to directly quantify EGABA. Both techniques point to a circuit-specific nature of PII output signaling on PCs.
Although GABAergic signaling is hyperpolarizing in mature CA3 PCs, it is well established that during early postnatal development, EGABA is much more depolarized than the resting membrane potential, rendering GABAergic transmission even excitatory (Ben-Ari, 2002). During the course of the second to third postnatal week, however, EGABA changes to more negative values, resulting in hyperpolarizing inhibition (Banke and McBain, 2006). This change can be largely explained by developmentally regulated expression of the Cl− transporters KCC2 and NKCC1 (Rivera et al., 1999; Yamada et al., 2004). EGABA undergoes a similar change in DG PCs. It is close to spike threshold in young neurons (∼−47 mV, P7) (Hollrigel et al., 1998) and changes to more negative values during the course of postnatal maturation (P17–P42) (this study; Overstreet Wadiche et al., 2005). Although the Cl− driving force declines postnatally (Ben-Ari, 2002), EGABA remains between rest and spike threshold. In consequence, inhibition on DG PCs is depolarizing at all postnatal times (this study; Staley and Mody, 1992; Hollrigel et al., 1998).
What could be the functional relevance of depolarizing versus hyperpolarizing PII output signaling onto PCs in the DG and CA1, respectively? Hippocampal PCs discharge precisely timed action potentials, for example, during explorative behavior as the animal crosses the place field of a place cell (Leutgeb et al., 2007; Moser et al., 2008). In CA1, precision in spike timing is realized by strong hyperpolarizing perisomatic inhibition (Pouille and Scanziani, 2001). However, DG PCs differ from CA1 PCs in their intrinsic characteristics, suggesting that the requirements for timed recruitment for DG PCs may be different. DG PCs receive excitatory inputs from the perforant path (PP) at their apical distal dendrites, electrotonically distant from the cell body. Thus, PP-mediated signals are strongly attenuated until they reach the soma (Krueppel et al., 2011). Furthermore, the voltage difference between the resting potential and spike threshold is large and has to be traversed to generate action potentials. How can efficient and precise recruitment of DG PCs be realized? Fast depolarizing inhibition among interneurons has been recently shown to act as a synchronizing signal in interneurons (Vida et al., 2006). A similar function may also hold for feedforward inhibition on DG PCs. The GABAA-mediated signal will keep the membrane potential close to EGABA (∼−65 mV) for a period defined by the time course of the conductance. Once released from the shunting conductance, PCs can rapidly discharge in response to the arriving excitatory PP inputs. Thus, depolarizing PII output and glutamatergic excitation may act synergistically to recruit DG PCs in a timed manner. In contrast, CA1 PC express more depolarized membrane resting potentials. Moreover, their dendritic properties differ substantially from DG PCs and support dendritic spikes, which can overcome dendritic attenuation and therefore can trigger somatic action potentials (Häusser et al., 2000). Thus, spike timing in CA1 PCs may favor hyperpolarizing rather than depolarizing perisomatic inhibition.
In summary, we propose that the combination of cellular and network properties may require depolarizing inhibition for timed recruitment of PCs in the DG but hyperpolarizing inhibition in CA1 PCs. This circuit-specific distribution of inhibitory properties may likewise mediate PC synchronization during fast network activity patterns in vivo.
Footnotes
This work was supported by the Lichtenberg-Professorship Award of the Volkswagen-Foundation (M.B.), the Schram-Foundation (M.B.), the Scottish Northern Research Partnership (J.-F.S.), the Excellence Initiative of the German Federal and State Governments (GSC-4, Spemann Graduate School) (M.S.), and Freiburg Institute for Advanced Studies of the University of Freiburg. We thank Jan Behrends and Massimo Scanziani for critical comments on the manuscript and Margit Northemann and Karin Winterhalter for technical assistance.
References
- Banke TG, McBain CJ. GABAergic input onto CA3 hippocampal interneurons remains shunting throughout development. J Neurosci. 2006;26:11720–11725. doi: 10.1523/JNEUROSCI.2887-06.2006. [DOI] [PMC free article] [PubMed] [Google Scholar]
- Bartos M, Vida I, Frotscher M, Meyer A, Monyer H, Geiger JR, Jonas P. Fast synaptic inhibition promotes synchronized gamma oscillations in hippocampal interneuron networks. Proc Natl Acad Sci U S A. 2002;99:13222–13227. doi: 10.1073/pnas.192233099. [DOI] [PMC free article] [PubMed] [Google Scholar]
- Bartos M, Vida I, Jonas P. Synaptic mechanisms of synchronized gamma oscillations in inhibitory interneuron networks. Nat Rev Neurosci. 2007;8:45–56. doi: 10.1038/nrn2044. [DOI] [PubMed] [Google Scholar]
- Bazelot M, Dinocourt C, Cohen I, Miles R. Unitary inhibitory field potentials in the CA3 region of rat hippocampus. J Physiol. 2010;588:2077–2090. doi: 10.1113/jphysiol.2009.185918. [DOI] [PMC free article] [PubMed] [Google Scholar]
- Ben-Ari Y. Excitatory actions of GABA during development: the nature of the nurture. Nat Rev Neurosci. 2002;3:728–739. doi: 10.1038/nrn920. [DOI] [PubMed] [Google Scholar]
- Buzsáki G. Rhythms of the brain. New York: Oxford UP; 2006. [Google Scholar]
- Chavas J, Marty A. Coexistence of excitatory and inhibitory GABA synapses in the cerebellar interneuron network. J Neurosci. 2003;23:2019–2031. doi: 10.1523/JNEUROSCI.23-06-02019.2003. [DOI] [PMC free article] [PubMed] [Google Scholar]
- Freund TF, Buzsáki G. Interneurons of the hippocampus. Hippocampus. 1996;6:347–470. doi: 10.1002/(SICI)1098-1063(1996)6:4<347::AID-HIPO1>3.0.CO;2-I. [DOI] [PubMed] [Google Scholar]
- Glickfeld LL, Roberts JD, Somogyi P, Scanziani M. Interneurons hyperpolarize pyramidal cells along their entire somatodendritic axis. Nat Neurosci. 2009;12:21–23. doi: 10.1038/nn.2230. [DOI] [PMC free article] [PubMed] [Google Scholar]
- Gulledge AT, Stuart GJ. Excitatory actions of GABA in the cortex. Neuron. 2003;37:299–309. doi: 10.1016/s0896-6273(02)01146-7. [DOI] [PubMed] [Google Scholar]
- Harvey CD, Collman F, Dombeck DA, Tank DW. Intracellular dynamics of hippocampal place cells during virtual navigation. Nature. 2009;461:941–946. doi: 10.1038/nature08499. [DOI] [PMC free article] [PubMed] [Google Scholar]
- Häusser M, Spruston N, Stuart GJ. Diversity and dynamics of dendritic signaling. Science. 2000;290:739–744. doi: 10.1126/science.290.5492.739. [DOI] [PubMed] [Google Scholar]
- Hollrigel GS, Ross ST, Soltesz I. Temporal patterns and depolarizing actions of spontaneous GABAA receptor activation in granule cells of the early postnatal dentate gyrus. J Neurophysiol. 1998;80:2340–2351. doi: 10.1152/jn.1998.80.5.2340. [DOI] [PubMed] [Google Scholar]
- Khirug S, Yamada J, Afzalov R, Voipio J, Khiroug L, Kaila K. GABAergic depolarization of the axon initial segment in cortical principal neurons is caused by the Na-K-2Cl cotransporter NKCC1. J Neurosci. 2008;28:4635–4639. doi: 10.1523/JNEUROSCI.0908-08.2008. [DOI] [PMC free article] [PubMed] [Google Scholar]
- Kraushaar U, Jonas P. Efficacy and stability of quantal GABA release at a hippocampal interneuron-principal neuron synapse. J Neurosci. 2000;20:5594–5607. doi: 10.1523/JNEUROSCI.20-15-05594.2000. [DOI] [PMC free article] [PubMed] [Google Scholar]
- Krueppel R, Remy S, Beck H. Dendritic integration in hippocampal dentate granule cells. Neuron. 2011;71:512–528. doi: 10.1016/j.neuron.2011.05.043. [DOI] [PubMed] [Google Scholar]
- Kyrozis A, Reichling DB. Perforated-patch recording with gramicidin avoids artifactual changes in intracellular chloride concentration. J Neurosci Methods. 1995;57:27–35. doi: 10.1016/0165-0270(94)00116-x. [DOI] [PubMed] [Google Scholar]
- Leutgeb JK, Leutgeb S, Moser MB, Moser EI. Pattern separation in the dentate gyrus and CA3 of the hippocampus. Science. 2007;315:961–966. doi: 10.1126/science.1135801. [DOI] [PubMed] [Google Scholar]
- Mann EO, Paulsen O. Role of GABAergic inhibition in hippocampal network oscillations. Trends Neurosci. 2007;30:343–349. doi: 10.1016/j.tins.2007.05.003. [DOI] [PubMed] [Google Scholar]
- Martina M, Royer S, Paré D. Cell-type-specific GABA responses and chloride homeostasis in the cortex and amygdala. J Neurophysiol. 2001;86:2887–2895. doi: 10.1152/jn.2001.86.6.2887. [DOI] [PubMed] [Google Scholar]
- Moser EI, Kropff E, Moser MB. Place cells, grid cells, and the brain's spatial representation system. Annu Rev Neurosci. 2008;31:69–89. doi: 10.1146/annurev.neuro.31.061307.090723. [DOI] [PubMed] [Google Scholar]
- Overstreet Wadiche L, Bromberg DA, Bensen AL, Westbrook GL. GABAergic signaling to newborn neurons in dentate gyrus. J Neurophysiol. 2005;94:4528–4532. doi: 10.1152/jn.00633.2005. [DOI] [PubMed] [Google Scholar]
- Pouille F, Scanziani M. Enforcement of temporal fidelity in pyramidal cells by somatic feed-forward inhibition. Science. 2001;293:1159–1163. doi: 10.1126/science.1060342. [DOI] [PubMed] [Google Scholar]
- Rivera C, Voipio J, Payne JA, Ruusuvuori E, Lahtinen H, Lamsa K, Pirvola U, Saarma M, Kaila K. The K+/Cl− co-transporter KCC2 renders GABA hyperpolarizing during neuronal maturation. Nature. 1999;397:251–255. doi: 10.1038/16697. [DOI] [PubMed] [Google Scholar]
- Sauer JF, Bartos M. Recruitment of early postnatal parvalbumin-positive hippocampal interneurons by GABAergic excitation. J Neurosci. 2010;30:110–115. doi: 10.1523/JNEUROSCI.4125-09.2010. [DOI] [PMC free article] [PubMed] [Google Scholar]
- Schmidt-Hieber C, Jonas P, Bischofberger J. Enhanced synaptic plasticity in newly generated granule cells of the adult hippocampus. Nature. 2004;429:184–187. doi: 10.1038/nature02553. [DOI] [PubMed] [Google Scholar]
- Staley KJ, Mody I. Shunting of excitatory input to dentate gyrus granule cells by a depolarizing GABAA receptor-mediated postsynaptic conductance. J Neurophysiol. 1992;68:197–212. doi: 10.1152/jn.1992.68.1.197. [DOI] [PubMed] [Google Scholar]
- Staley KJ, Soldo BL, Proctor WR. Ionic mechanisms of neuronal excitation by inhibitory GABAA receptors. Science. 1995;269:977–981. doi: 10.1126/science.7638623. [DOI] [PubMed] [Google Scholar]
- St John JL, Rosene DL, Luebke JI. Morphology and electrophysiology of dentate granule cells in the rhesus monkey: comparison with the rat. J Comp Neurol. 1997;387:136–147. doi: 10.1002/(sici)1096-9861(19971013)387:1<136::aid-cne11>3.0.co;2-s. [DOI] [PubMed] [Google Scholar]
- Szabadics J, Varga C, Molnár G, Oláh S, Barzó P, Tamás G. Excitatory effect of GABAergic axo-axonic cells in cortical microcircuits. Science. 2006;311:233–235. doi: 10.1126/science.1121325. [DOI] [PubMed] [Google Scholar]
- Vida I, Bartos M, Jonas P. Shunting inhibition improves robustness of gamma oscillations in hippocampal interneuron networks by homogenizing firing rates. Neuron. 2006;49:107–117. doi: 10.1016/j.neuron.2005.11.036. [DOI] [PubMed] [Google Scholar]
- Yamada J, Okabe A, Toyoda H, Kilb W, Luhmann HJ, Fukuda A. Cl− uptake promoting depolarizing GABA actions in immature rat neocortical neurons is mediated by NKCC1. J Physiol. 2004;557:829–841. doi: 10.1113/jphysiol.2004.062471. [DOI] [PMC free article] [PubMed] [Google Scholar]