

Abstract
The LIM domain only 4 (LMO4) transcription cofactor activates gene expression in neurons and regulates key aspects of network formation, but the mechanisms are poorly understood. Here, we show that LMO4 positively regulates ryanodine receptor type 2 (RyR2) expression, thereby suggesting that LMO4 regulates calcium-induced calcium release (CICR) in central neurons. We found that CICR modulation of the afterhyperpolarization in CA3 neurons from mice carrying a forebrain-specific deletion of LMO4 (LMO4 KO) was severely compromised but could be restored by single-cell overexpression of LMO4. In line with these findings, two-photon calcium imaging experiments showed that the potentiation of RyR-mediated calcium release from internal stores by caffeine was absent in LMO4 KO neurons. The overall facilitatory effect of CICR on glutamate release induced during trains of action potentials was likewise defective in LMO4 KO, confirming that CICR machinery is severely compromised in these neurons. Moreover, the magnitude of CA3-CA1 long-term potentiation was reduced in LMO4 KO mice, a defect that appears to be secondary to an overall reduced glutamate release probability. These cellular phenotypes in LMO4 KO mice were accompanied with deficits in hippocampus-dependent spatial learning as determined by the Morris water maze test. Thus, our results establish LMO4 as a key regulator of CICR in central neurons, providing a mechanism for LMO4 to modulate a wide range of neuronal functions and behavior.
Introduction
Neuronal and synaptic activity can encode and store information in the brain not only through changes in synaptic strength but also by long-lasting control of gene expression. Experience exerts this control in part by modulating the level and/or function of several calcium-dependent regulatory proteins involved in gene regulation (Flavell and Greenberg, 2008). A number of experimental approaches have been developed to screen for transcription factors regulating gene expression involved in many aspects of neuronal development, including dendritic branching, synapse maturation, and synapse elimination (for review, see Flavell and Greenberg, 2008). One corollary challenge becomes identifying the genes downstream of these activity-dependent gene regulatory proteins and ultimately to link these genetic programs with defined cellular and behavioral measures.
Using a transactivator trap screen, the LIM domain only 4 (LMO4) protein was identified as a calcium-responsive transactivator (Aizawa et al., 2004) that activates gene expression in an activity-dependent manner (Kashani et al., 2006). LMO4 is a small protein (165 aa) that contains two protein-interacting LIM domains. LMO4 serves not only as a cofactor of many transcription factors (Manetopoulos et al., 2003; Kashani et al., 2006; Schock et al., 2008), but also interacts with transmembrane receptors to modulate their signaling (Novotny-Diermayr et al., 2005; Bong et al., 2007). Whether LMO4 couples signals from membrane receptors to changes in gene expression is not known, although we showed that LMO4 is present in the cytoplasm and nucleus, and translocates from the cytoplasm to the nucleus in response to extracellular stimuli (Chen et al., 2007a).
LMO4 is expressed early during CNS development (Kenny et al., 1998; Chen et al., 2002). Mice with germline ablation of LMO4 die before birth with exencephaly (Hahm et al., 2004; Tse et al., 2004; Lee et al., 2005), whereas mice with conditional ablation of LMO4 in the cerebral cortex show defects in thalamocortical connections (Kashani et al., 2006). However, the cellular processes that might be responsible for this defect are ill defined, in part illustrating the relative paucity of experimental data on the functional roles played by this activity-regulated protein.
Here, following a lead from a microarray screen that identified downregulation of ryanodine receptor 2 (RyR2) in LMO4-null cortical neurons, we characterized the role of LMO4 as a regulator of both RyR2 expression and function. To this end, and to circumvent the lethality of the germline knockout, we generated mice with postnatal ablation of LMO4 by mating LMO4flox mice with mice expressing Cre-recombinase under the control of a CaMK2α minigene (Casanova et al., 2001). Electrophysiological recordings and calcium imaging showed that the calcium-induced calcium release (CICR) machinery was severely compromised in the hippocampus of CamK2αCre/LMO4flox (LMO4 KO) mice, which directly translated in altered excitability metrics of CA3 pyramidal neurons and synaptic plasticity in the hippocampus. These hippocampal cellular phenotypes were accompanied with learning deficits as determined in the Morris water maze test.
Materials and Methods
Camk2αCre/LMO4flox mice.
LMO4 KO and LMO4flox littermate mice were genotyped and maintained on a CD-1 background as described previously (Schock et al., 2008; Zhou et al., 2012). CamK2αCre/LMO4flox mice and age-matched CamK2αCre/(LMO4flox/−) (LMO4 Het) or LMO4flox/flox (WT) controls were used in all experiments. All procedures for animal use were approved by the University of Ottawa Animal Care and Veterinary Service, and were performed according to institutional guidelines and in accordance with those of the Canadian Council on Animal Care.
Cell culture and transfection.
F11 cells, a hybridoma between rat E12 dorsal root ganglion neurons and a mouse neuroblastoma line, were maintained as described previously (Chen et al., 2007a,b). For quantitative RT-PCR, F11 cells were seeded in 6-well plates and transfected 24 h later by using lipofectamine 2000 (Invitrogen).
RyR2 promoter construct and activity assay.
The RyR2 promoter region spanning from −765 to −104 (+1 being the putative transcription start site) was amplified by PCR from mouse tail genomic DNA as described previously (Pfeffer et al., 2009) using the following primers: forward, 5-TTctcgagCGCATTCAGTGATCG-3; reverse, 5-TTaagcttGACCTCAAGTCCAAGG-3 (lower cases represent XhoI and HindIII liner sequences). The RyR2 XhoI/HindIII fragment was cloned into the pGL4.10-Basic luciferase reporter vector (Promega) and verified by sequencing. For promoter activity assays, 1 μg of RyR2 luciferase promoter was cotransfected with 100 ng of CMV-β-galactosidase reporter in the presence of 400 ng of LMO4 expression vector or LMO4 shRNA into F11 cells in 6-well plates. Appropriate empty vector or scrambled shRNA was used as a control. Cells were harvested 24 h after transfection, and RyR2 promoter-driven luciferase activity was normalized to β-galactosidase to control for transfection efficiency, as described previously (Chen et al., 2007b; Gomez-Smith et al., 2010).
RNA extraction and quantitative RT-PCR.
Total mouse hippocampal RNA was extracted and purified from 30 mg samples (wet weight) dissected from 1-month-old mutant and control mice, while F11 cells were lysed 36 h post-transfection using TRIzol Reagent (Invitrogen). RNA was reconstituted in sterile nuclease-free water, and sample concentrations were determined spectrophotometrically at OD of 260 nm. After DNase treatment of 2 μg of total RNA (TURBO DNA-free kit, Ambion), deoxyribonucleotide triphosphate and random decamers were used for cDNA synthesis in a 20 μl reaction (Applied Biosystems). A 0.1 μl sample of the resulting cDNA products was evaluated using real-time PCR. Target genes were amplified and evaluated using the Rotor-Gene 3000 (Corbett Research) and SYBR green detection (DyNAmo SYBR Green qPCR kit, New England Biolabs). PCR cycling conditions were as follows: 10 min at 95°C, and then 40 cycles at 95°C for 10 s, followed by 56°C for 15 s and 72°C for 20 s. Cyclophilin A was used as an endogenous control (housekeeping) gene. Specific ryanodine receptor primer sequences described previously (Chakroborty et al., 2009) were as follows: RyR1: forward, 5-TCTTCCCTGCTGGAGACTGT-3; reverse, 5-GTGGAGAAGGCACTTGAGG-3; RyR2: forward, 5-TCAAACCACGAACACATTGAGG-3; reverse, 5-AGGCGGTAAAACATGATGTCAG-3; RyR3: forward, 5-CTGGCCATCATTCAAGGTCT-3; reverse, 5-GTCTCCATGTCTTCCCGTA-3; CycloA: forward, 5-GGCCGATGACGAGCCC-3; reverse, 5-TGTCTTTGGAACTTTGTCTGCAAAT-3; and LMO4: forward, 5-GGACCGCTTTCTGCTCTATG-3; reverse, 5-AGCACCGCTATTCCCAAAT-3. Each sample was evaluated in triplicate. Amplification data were analyzed using the comparative cycle threshold (ΔΔCt) method after normalization to cyclophilin A. A two-tailed t test was used to determine statistical significance at p < 0.05.
In situ hybridization.
Tissues were processed for in situ hybridization with digoxigenin-labeled antisense or sense riboprobes, as previously described (Duquette et al., 2010). For more reliable comparisons of gene expression patterns, wild-type and mutant tissues were processed on the same slides.
Western blot analysis.
Hippocampal protein extracts from 1-month-old mice were harvested and prepared for Western blot analysis as described previously (Chen et al., 2007b; Gomez-Smith et al., 2010). Primary mouse monoclonal antibodies to ryanodine receptor 2 (Affinity Bioreagents) (Stutzmann et al., 2006) and to GAPDH (Abcam) were used.
Electrophysiology.
Three- to 5-week-old transgenic mice (CamK2αCre/LMO4flox) and littermate controls (LMO4flox) were used in all experiments. As previously described (Béïque et al., 2006), mice were deeply anesthetized with isoflurane in an enclosed chamber and decapitated. The brain was quickly removed and immersed in ice-cold artificial CSF (aCSF) containing the following (in mm): 119 CholineCl, 2.5 KCl, 4.3 MgSO4, 1.0 NaH2PO4, 1.0 CaCl2, 11 glucose, and 26.2 NaHCO3, continuously bubbled with 95% O2 and 5% CO2, pH 7.4; 300-μm-thick coronal slices of the hippocampus were obtained with a vibratome. Brain sections were kept at 34°C for 30 min in oxygenated aCSF with the following composition (in mm): 119 NaCl, 2.5 KCl, 1.3 MgSO4 1.3, 1.0 NaH2PO4, 2.5 CaCl2, 11 glucose, and 26.2 NaHCO3, pH 7.4, and then at room temperature until recordings were performed.
Visualized whole-cell recordings were performed using infrared differential interference contrast optics. Slices were placed in a perfusion chamber mounted on a movable stage assembly on a fixed upright microscope (Nikon FN) and perfused with oxygenated aCSF (95% O2-5% CO2; 2 ml/min) at room temperature. Recording pipettes (3–5 MΩ) were pulled on a Narishige PC-10 from borosilicate glass capillaries (World Precision Instruments) and were filled with one of two intracellular solution containing the following (in mm): for voltage-clamp experiments: 115 CsMeSO4, 2.8 NaCl, 0.4 EGTA, 5 TEA-Cl, 20 HEPES, 3.0 MgATP, 0.5 Na2GTP, 10 Na-phosphocreatine, pH adjusted to 7.2 with CsOH; for current-clamp experiments: 115 K-gluconate, 20 KCl, 2 MgCl2, 10 HEPES, 10 Na-phosphocreatine, 4 NaATP, and 0.3 NaGTP, pH adjusted to 7.2 with KOH. The GABAA receptor antagonist bicuculline methobromide (20 μm) was included unless otherwise indicated. Whole-cell recordings were obtained from CA1 and CA3 pyramidal neurons of the hippocampus. In some experiments, the stimulation bipolar electrode was inserted into the stratum radiatum near the border of CA1 pyramidal layer under visual control to stimulate the Schaffer collateral fibers. Testing stimuli of 0.067 Hz and 10 μs duration were adjusted to evoke ∼50–100 pA amplitude EPSC [evoked EPSC (eEPSC)]. A Multiclamp 700B amplifier (Molecular Devices) was used for whole-cell recordings, which were analyzed using pClamp 10.0 and OriginPro 8. Recordings were filtered at 3 kHz, digitized at 10 kHz, and stored on a PC. Access resistance was continuously monitored by applying 75 ms, 5 mV hyperpolarizing pulses 250 ms before the eEPSCs, and cells were used for recording only if the access resistance was maintained at ≤10 MΩ. Spontaneous miniature EPSCs (mEPSCs) were acquired at −70 mV in control ACSF solution supplemented with 1 μm TTX. Only events of >7.5 pA, which corresponds to the event detection limit of the noisiest of the recordings included, were included in the analysis.
Probability of release was estimated by analyzing the variance of EPSC amplitudes (Malinow and Tsien, 1990; Martín and Buño, 2003). We estimated the effects of caffeine on release probability by plotting (mean squared/variance caffeine)/(mean squared/variance baseline) against (peak amplitude caffeine/peak amplitude baseline) and computed linear fits (Bekkers and Stevens, 1990; Faber and Korn, 1991; Manabe et al., 1993; Martín and Buño, 2003).
Organotypic slice culture.
Hippocampal slice cultures were prepared from 6- to 8-d-old mice as described previously (Stoppini et al., 1991; Béïque and Andrade, 2003; Béïque et al., 2007). Biolistic transfections were conducted 3–6 d later with the Helios Gene Gun (Bio-Rad), using 1.0 μm gold particles coated with DNA. Gold particles were coated with two cDNAs: dsRed and LMO4-EGFP. We have previously shown that neurons that are effectively transfected express both plasmids in >90% of cases (Béïque and Andrade, 2003).
Two-photon calcium imaging.
Simultaneous electrophysiological and optical recordings were performed from CA3 pyramidal cells using conditions similar to those described above in the Electrophysiology section (for current-clamp recordings), except that the intracellular pipette solution was supplemented with Alexa Fluor 594 (30 μm; to outline morphology) and with the calcium indicator Fluo-4FF (200 μm). We initially favored this low-affinity (and low-capacity) dye to avoid dye saturation following trains of action potentials in conditions of enhanced CICR. The imaging was obtained on an Olympus FV 1000 with a 40×/0.8 NA objective, and excitation was obtained with a Mai Tai Deep See Ti:Sapphire laser (Spectra-Physics) tuned at 810 nm. Analysis was performed off-line using ImageJ. ΔF/F0 values were calculated by averaging fluorescence intensities in two or three selected ROIs, located on the soma but excluding the nucleus, and were expressed as follows: ΔF/F0 = (F − Fbaseline)/(Fbaseline − Fbackground). Image acquisition was on neuronal soma and no particular efforts were devoted to adjust acquisition to focal planes encompassing proximal dendrites.
Morris water maze test.
The Morris water maze test was performed in the Faculty of Medicine Behavior Core Laboratory at the University of Ottawa. All testing was performed between 08:00 and 12:00 A.M., and animals received 1 h of habituation to the testing room daily. Each mouse was handled for 3–4 d before training. Mice 7–8 weeks old were trained for 9 d (four trials per day, intertrial interval of 1 h, random start location in one of four positions) to find a submerged platform at a fixed position. Distal cues in the testing room, such as patterned cardboard on a white wall, were provided as spatial references. Each trial lasted 1 min or until the mouse found the platform, and mice remained on the platform for 15 s before being removed to the home cage. If the mice did not find the platform within 1 min, on training the mice were guided to the platform by the experimenter. Latency to reach the platform, distance traveled to reach the platform, swim speed, and percentage of time in each quadrant were measured using Ethovision automated video tracking software from Noldus. On day 10, the platform was removed from the pole, the probe trial (trial length 1 min) was administered, and percentage of time spent in the target quadrant and numbers of platform crossings were measured using Noldus system.
Statistical analysis.
All data are presented as means ± SEM. N refers to the number of cells for voltage-clamp or current-clamp, and in all other outcomes refers to the number of mice. Differences between treatments were analyzed using Student's t test for paired data or one-way repeated-measures ANOVA followed by Bonferroni's post hoc test for comparisons. For water maze data, a two-way (genotype sex) ANOVA was completed followed by Bonferroni's post hoc test. Significance was accepted if p < 0.05.
Results
LMO4 modulates ryanodine receptor 2 expression in neurons
To begin examining the role of LMO4 in neuronal function, we first sought to screen for genes whose expression levels are modulated by ablation of LMO4. To this end, we performed a nonbiased, high-throughput microarray analysis. Total RNA was isolated from 2-week-old primary cultured cortical neurons derived from LMO4 germline-ablated (Chen et al., 2007b) and littermate control embryos, amplified, and hybridized to oligonucleotide microarrays to identify differentially expressed transcripts. Although the expression of several genes was altered in neurons with LMO4 ablated (data not shown), we were intrigued by the robust decrease (∼40%) in the expression of the RyR2 (p < 0.05). This effect showed some specificity since the expression of RyR1 and RyR3 was not significantly different between WT and LMO4 KO (data not shown).
Because germline ablation of LMO4 causes embryonic lethality, we generated a conditional LMO4 KO mouse line for functional studies of LMO4 in the CNS. In situ hybridization and quantitative RT-PCR LMO4 expression in the hippocampus confirmed effective gene deletion in the mice after the first postnatal month (Fig. 1A,B). Direct quantitative PCR (qPCR) showed that the mRNA level of RyR2, but not of RyR1 or RyR3, was significantly decreased in the brain of LMO4 KO (Fig. 2A) compared with littermate control mice, thereby confirming the microarray finding obtained in germline KO mice. This finding was further confirmed by Western blot analysis (Fig. 2B), which revealed reduced RyR2 protein levels in hippocampal protein extracts of LMO4 KO mice compared with littermate controls.
Figure 1.

LMO4 expression in the hippocampus is ablated in CamK2αCre/LMO4flox mice. A, In situ hybridization revealed high levels of LMO4 mRNA in the hippocampal neurons of wild-type littermate controls (WT) and is absent in CamK2αCre/LMO4flox mice (KO). Scale bar, 800 μm. B, Quantitative RT-PCR revealed 95% reduction of LMO4 mRNA in the hippocampus of KO compared with controls. n = 6 for WT and KO.
Figure 2.
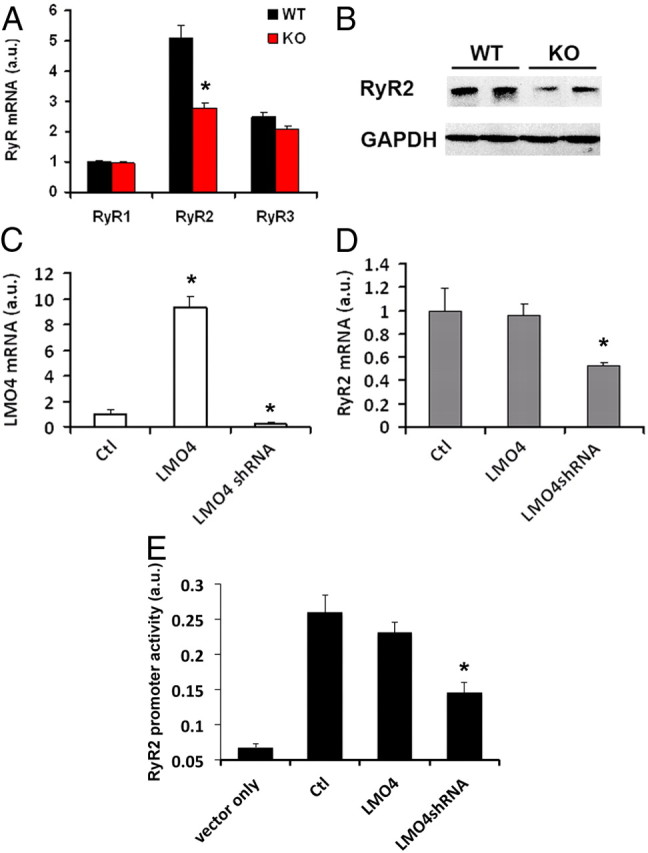
LMO4 regulates RyR2 expression. A, Quantitative PCR revealed a 50% reduction in RyR2 mRNA in the hippocampus of LMO4 KO mice (n = 6 for each genotype). B, Western blot of hippocampal protein revealed a reduction in RyR2 protein expression in LMO4 KO compared with littermate WT mice. C, Quantitative PCR determined the levels of LMO4 mRNA in F11 neuronal cells transfected with an LMO4 expression vector (LMO4) or an LMO4 shRNA expression vector. Following transfection of LMO4 expression or LMO4 shRNA vector, LMO4 levels were elevated to ninefold or reduced to 25% relative to control, respectively. Ctl, Control F11 cells transfected with empty expression vectors. D, Quantitative PCR of RyR2 in F11 neuronal cells overexpressing LMO4 or with LMO4 knockdown by shRNA. In C and D, the same RNA extracts were used for quantification. n = 6 for each condition. E, RyR2 promoter activity assay in F11 cells transfected with an LMO4 expression vector (LMO4) or an LMO4shRNA expression vector. n = 6.
To further examine the role of LMO4 in modulating the expression of RyR2, we determined the effects of direct manipulations of LMO4 expression by transient transfection in F11 neuronal cells on the level of RyR2 mRNA. First, we found that overexpression of LMO4 (approximately ninefold) (Fig. 2C) did not elevate RyR2 mRNA levels, as determined by quantitative PCR (Fig. 2D). However, knockdown of endogenous LMO4 expression with shRNA (Fig. 2C) robustly reduced RyR2 mRNA levels in these cells (Fig. 2D). To further investigate the modulation of RyR2 by LMO4, we next determined whether LMO4 regulated the activity of an RyR2 promoter fragment driving luciferase expression by transient transfection in F11 cells. Overexpression of LMO4 led to only a modest increase in promoter activity, although knockdown of LMO4 with shRNA markedly reduced the RyR2 promoter activity (Fig. 2E). Together, these results show that LMO4 regulates RyR2 expression.
CICR contribution to the AHP is abolished in LMO4 KO
RyRs are calcium-gated calcium channels that control the release of calcium from internal stores and as such contribute to CICR (Iino, 1989; Peng, 1996; Fill and Copello, 2002). The involvement of LMO4 in regulating mRNA and protein expression of RyR2 suggests that LMO4 may be a key and central modulator of CICR in central neurons. To test this hypothesis, we compared several cellular processes known to be directly influenced by CICR in wild-type and LMO4 KO neurons.
Pyramidal cells of the hippocampus exhibit large afterhyperpolarizations (AHPs) following action potential discharges (Alger and Nicoll, 1980; Hotson and Prince, 1980; Schwartzkroin and Stafstrom, 1980). These AHPs are mediated by calcium-activated potassium channels and contribute to spike frequency adaptation, a hallmark of this cell type. Although the calcium gating of these potassium conductances originates in large part from membrane voltage-gated calcium channels (Sah, 1996; Marrion and Tavalin, 1998; Pineda et al., 1998, 1999), CICR contributes a significant portion of the calcium responsible for the generation of the AHP (Kuba et al., 1983; Sah and McLachlan, 1991; Sah, 1996; Torres et al., 1996; Pineda et al., 1999; Akita and Kuba, 2000). We therefore reasoned that the AHP could serve as a reliable proxy to probe the function of CICR in wild-type and LMO4 KO neurons.
We performed whole-cell electrophysiological recordings from CA3 pyramidal neurons of the hippocampus in current-clamp mode. A brief current injection of increasing amplitude (500 ms, 50–400 pA) induced reliable action potential firing that was followed, upon cessation of the depolarizing current, by an AHP (Fig. 3). As shown in Figure 3, the amplitude of the AHP was dependent on the number of action potentials fired during the depolarizing step. Interestingly, the amplitude of the AHP was significantly smaller in CA3 neurons from LMO4 KO compared with WT mice (Fig. 3A,B). This is unlikely to result from differences in passive membrane properties since input resistance was indistinguishable between WT and KO neurons [WT: 109.7 ± 5.7 MΩ (n = 25); KO: 107.9 ± 6.9 MΩ (n = 24; p = 0.751)]. To determine whether compromised machinery of CICR in LMO4 KO neurons might be responsible for this effect, we analyzed the behavior of the AHP following manipulations of CICR. Blocking CICR with ryanodine (100 μm; >1 h treatment) significantly reduced the amplitude of the AHP in WT CA3 neurons (Fig. 3A1,A2), suggesting that, in keeping with previous reports (Kuba et al., 1983; Sah and McLachlan, 1991; Sah, 1996; Torres et al., 1996; Pineda et al., 1999; Akita and Kuba, 2000), internal stores contribute a significant portion of the calcium responsible for triggering the AHP in neurons. Interestingly, the same treatment of ryanodine to slices derived from LMO4 KO animals failed to reduce the amplitude of the AHP (compared with nontreated control sister slices) (Fig. 3B,C). Because the amplitude of the AHP in KO slices closely matches that observed in WT slices treated with ryanodine, these results suggest that the reduction of the AHP seen in LMO4 KO reflects compromised CICR machinery in these cells.
Figure 3.
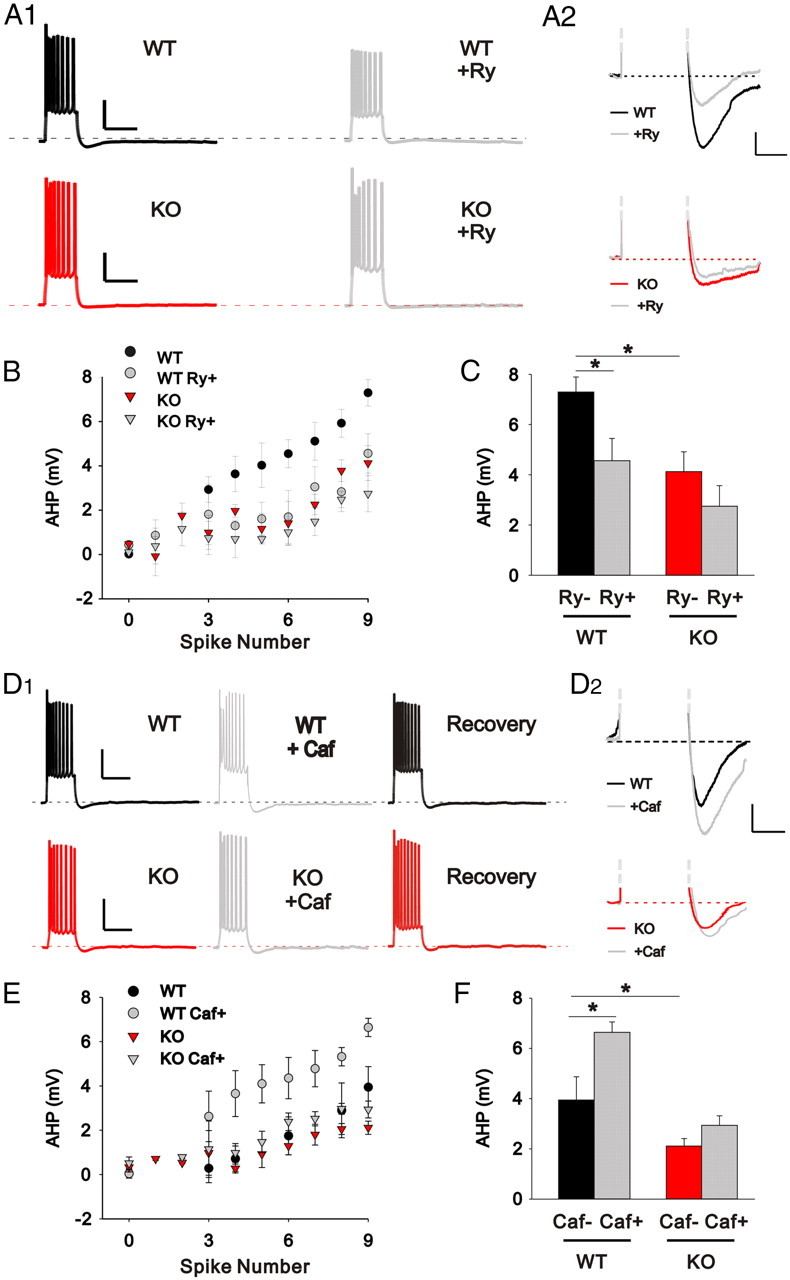
The afterhyperpolarization is reduced in LMO4 KO CA3 neurons. A1, Superimposed current traces showing the AHP measured in WT and LMO4 KO CA3 neurons in control and following ryanodine treatment. Calibration: 30 mV, 500 ms. A2, Enlarged traces of the AHP in A1 in control and in ryanodine-treated slices. Calibration: 2 mV, 250 ms. B, the amplitude of the AHP is expressed as a function of the spike number. C, A bar graph comparing the amplitudes of the AHP (WT, n = 9; LMO4, n = 9). Ryanodine significantly reduced the AHP in WT neurons (WT Ry+, n = 11) but had no effect on LMO4 KO neurons (KO Ry+, n = 12). *p < 0.05. D1, Superimposed traces of the AHP in control conditions, following caffeine administration and recovery from WT and LMO4 KO CA3 neurons. Calibration: 30 mV, 500 ms. D2, Enlarged traces of the AHP in D1 under control and caffeine treatment are combined. Calibration: 2 mV, 250 ms. E, The amplitude of the AHP is plotted as a function of the number of action potentials. F, Bar graph comparing the amplitudes of the AHP. Littermate control neurons (WT caf−, n = 7) had larger AHP compared with LMO4 KO neurons (KO caf−, n = 10). Caffeine significantly increased the AHP in littermate control (WT caf+, n = 7) but had little effect in LMO4 KO neurons (KO caf+, n = 10). *p < 0.05. Mice age: 4–5 weeks.
To further test this idea, we next tested the effect on the AHP of facilitating the CICR process by caffeine. As previously reported in CA1 neurons (Torres et al., 1996), we found that the acute administration of caffeine (10 mm) significantly enhanced the amplitude of the AHP in wild-type CA3 neurons (Fig. 3D1,D2,E,F). In addition to enhancing CICR, caffeine also blocks adenosine receptors and phosphodiesterase. However, these nonspecific actions likely do not contribute to the effect reported here on the AHP since adenosine antagonists has no effect on the AHP (Torres et al., 1996) and phosphodiesterase inhibitors reduce, rather than increase, the AHP (Madison and Nicoll, 1986; Andrade and Nicoll, 1987). Interestingly, we found that the same treatment of caffeine was devoid of any effect on the AHP of CA3 neurons from LMO4 KO slices (Fig. 3D1,D2,E,F). Together, these results attest to the presence of compromised CICR in LMO4 KO neurons.
We next determined whether the AHP observed in CA1 pyramidal neurons (Madison and Nicoll, 1984) was also reduced in LMO4 KO slices. Intriguingly, we found that the amplitude of the AHP in CA1 cells was of similar amplitude in WT and LMO4 KO animals (p = 0.368; data not shown). The reasons underlying this cellular subtype specificity are unclear at present. It may reflect, in principle, the differential contribution of KCNQ channel subtypes to the AHP in these two subregions of the hippocampus (Tzingounis et al., 2010) or simply stem from the lower density of LMO4 levels in CA1 than in CA3 neurons (Fig. 1A). Regardless of these possibilities, our analysis of the contribution of CICR to the generation of the AHP in hippocampal CA3 pyramidal neurons shows that the CICR machinery is severely compromised in LMO4 KO neurons. These effects are fully consistent with the robust reduction of RyR2 in LMO4 knock-out animals.
Rescue of AHP with LMO4 overexpression in LMO4 KO slices
We next sought to determine whether restoring the expression of LMO4 in LMO4 KO neurons would rescue the AHP deficit. To this end, we prepared organotypic slices from WT and LMO4 KO neurons. Whole-cell recordings from CA3 neurons in this preparation revealed that these neurons expressed an AHP in response to trains of action potentials, although it was somewhat smaller than that recorded in acute slices. Nevertheless, we observed that the amplitude of the AHP was significantly smaller in slices prepared from LMO4 KO, compared with WT (Fig. 4), thereby recapitulating in organotypic slices the overall phenotype observed in acute slices. We then overexpressed LMO4 (along with dsRed) by means of biolistic transfection. Whole-cell recordings from fluorescently labeled transfected CA3 neurons 24–48 h following transfection revealed that expression of LMO4 restored AHP in LMO4 neurons to a similar level as seen in WT neurons (Fig. 4), whereas KO cells transfected with dsRed alone showed no effect (data not shown). Together, these results show that the deficit of the AHP observed in LMO4 KO is rescued by single-cell overexpression of LMO4 and implies that this deficit reflects cell-autonomous mechanisms and does not reflect a broader anomaly in the KO.
Figure 4.

The afterhyperpolarization is rescued in LMO4 KO CA3 neurons by restoring LMO4 expression. A1, Schematic representation of transgene delivery into neurons of organotypic slices by gene gun. A2, Current traces showing the AHP measured in organotypic slice cultures of CA3 neurons from WT, KO, and KO transfected with LMO4-EGFP (KO + LMO4). Calibration: 20 mV, 250 ms. A3, Enlarged traces of the AHP in A1 in control and transfected neurons. Calibration: 2 mV, 500 ms. B, The amplitude of the AHP is plotted as a function of the spike number (WT, n = 12; KO, n = 12; KO + LMO4, n = 6). C, A bar graph comparing the amplitudes of the AHP when nine spikes were induced. The AHP was significantly reduced in KO compared with WT neurons but was rescued in LMO4-EGFP transfected KO neurons. *p < 0.05.
Caffeine facilitation of CICR during a train of action potentials is abolished in LMO4 KO slices
Our results thus far show that the changes in the behavior of the AHP in CA3 pyramidal neurons induced by acute pharmacological challenges to CICR machinery are abolished in LMO4 KO slices. The most straightforward interpretation of these results is that the RyR2-mediated calcium release induced by trains of action potentials is reduced in LMO4 KO. To further support this interpretation, we performed multiphoton calcium imaging experiments from CA3 neurons in WT and LMO4 KO slices. In current-clamp mode, action potential firing induced by direct current injection was accompanied by robust increases in intracellular calcium concentration (Fig. 5). This rise in intracellular calcium, and the amplitude of the AHP recorded from these same cells, was well correlated with the number of action potentials elicited during current injection (Fig. 5B–D). In WT neurons, bath administration of caffeine (10 mm; 10–15 min) led to an increase in the amplitude of the AHP, in keeping with our previous observations in acute slices (Fig. 3), along with a robust enhancement of intracellular calcium triggered by trains of action potentials (Fig. 5). Remarkably, the potentiating effect of caffeine on both the AHP and intracellular calcium was abolished in CA3 neurons from LMO4 KO slices. Together, these results support the notion that CICR is severely compromised in LMO4 KO.
Figure 5.
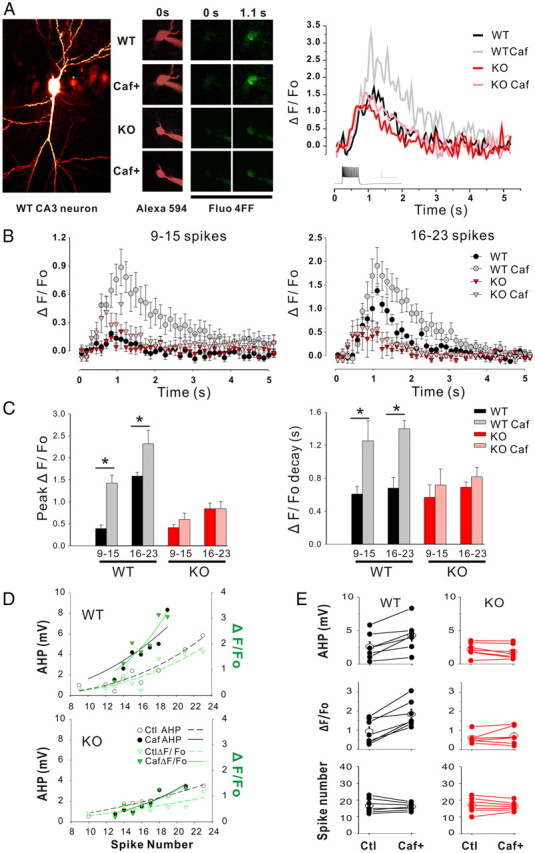
Imaging spike-evoked calcium signals in CA3 neurons. A, A representative CA3 neuron image is shown on the left. Right, Alexa Fluor 594 hydrazide images (left, 0 s) and Fluo-4FF images of spike-evoked calcium signals from WT and KO CA3 neurons before the onset (middle, 0 s) and at the end of an action potential train (right, 1.1 s) before and during caffeine administration (10 mm 10–15 min). Superimposed traces to the right show the time course of somatic fluorescence (ΔF/F0) evoked by 500 ms current injection (400 pA) before and during caffeine administration. Calcium signals were measured from the soma (excluding the nucleus) in WT and KO neurons before and during caffeine administration. B, Average time course traces of somatic fluorescence calcium signals (ΔF/F0) are shown. C, Peak values of ΔF/F0 (left) and the decay constant (tau, right) are shown from WT and KO CA3 neurons (9–15 and 16–23 spikes). Both the peak ΔF/F0 and the decay time constant were significantly increased in WT neurons before and during caffeine administration (n = 7) but not in KO neurons (n = 9). p < 0.01, paired Student's t test. D, The amplitude of the AHP (black dots; values refer to the left y-axis) and ΔF/F0 (green triangles; values refer to the right y-axis) with or without caffeine are plotted as a function of the spike numbers. Data points are fitted for AHP (black) and ΔF/F0 (green) with nonlinear regression power equation displayed by continued or dashed lines for caffeine treatment or control, respectively. E, Values of paired AHP, ΔF/F0, and spike numbers (top to bottom) are shown, and are connected by lines before and after caffeine treatment from the same set of CA3 neurons. Mice age: 3 weeks.
CICR-mediated facilitation of glutamatergic transmission in CA1 is impaired in LMO4 KO mice
Despite some controversies (Carter et al., 2002), a number of studies have shown that, at least under certain conditions, calcium from CICR contributes to neurotransmitter release (Peng, 1996; Llano et al., 2000; Emptage et al., 2001; Zhang et al., 2009). These studies prompted us to examine several determinants of glutamatergic synaptic transmission in LMO4 KO. As a first-pass test, we recorded AMPAR-mediated mEPSCs from CA1 pyramidal neurons whose main glutamatergic input originates from the CA3 region. Interestingly, we found that the frequency of mEPSCs was robustly reduced in LMO4 KO mice compared with littermate controls (Fig. 6A), whereas there was no difference in the amplitude of mEPSCs. Provisionally, we interpreted these results as indicating lower glutamate release probability in LMO4 KO mice.
Figure 6.
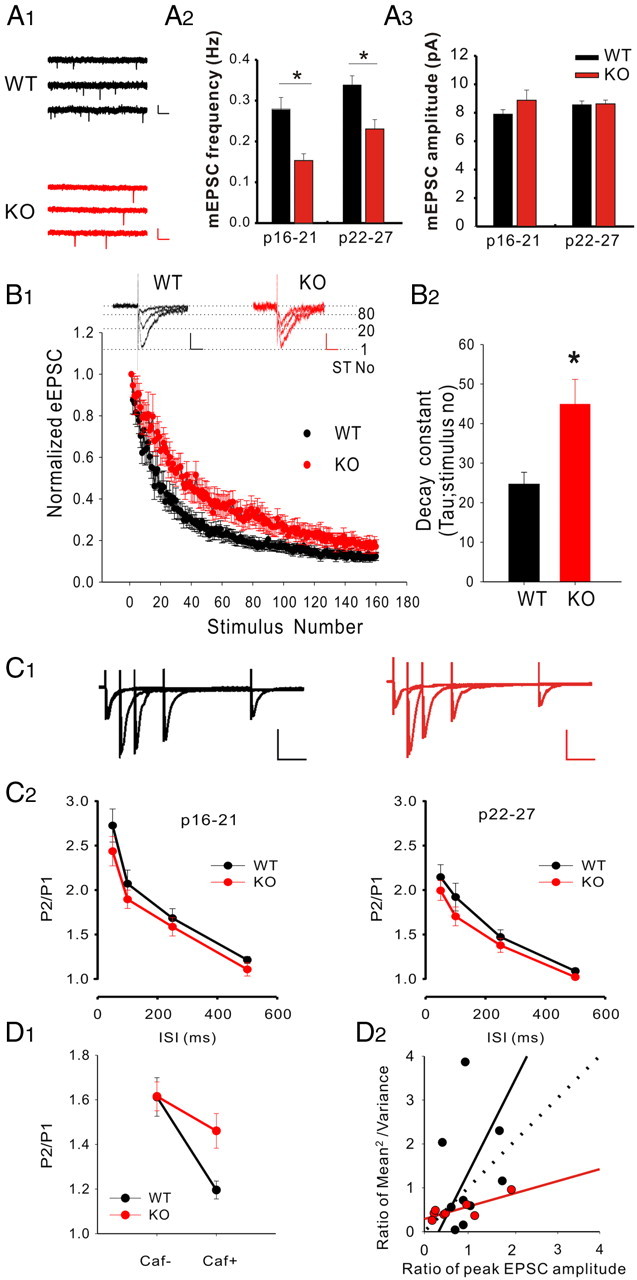
Release probability in LMO4 KO mice. A1, Current traces showing mEPSCs from WT and KO CA1 pyramidal neurons. Calibration: 10 pA, 2 s. Top: P16; middle: P22; bottom: P27. A2, A3, The frequency (A2) and amplitude (A3) of mEPSCs were binned according to the age of the animals. n = 7, WT; n = 9, KO at P16–P21; n = 23, WT; n = 27, KO at P22–P27. *p < 0.05. B1, The first, 20th, and 80th NMDAR-mediated EPSC current traces in the presence of the irreversible NMDAR inhibitor MK-801 are shown for a WT (left) and KO (right) CA1 neuron. Calibration: 50 pA, 50 ms. The progressive block of NMDAR-mediated EPSCs is plotted as a function of the pulse number and could be fitted by a monoexponential decay. B2, The decay constant was significantly increased in KO (44.97 ms; n = 7) compared with littermate control neurons (24.69 ms; n = 9; p < 0.01, unpaired Student's t test). C1, Current traces depicting AMPAR-mediated eEPSCs induced by paired pulses delivered at different interstimulus intervals (ISIs) obtained from a WT and a KO neuron are shown. Calibration: 50 pA, 50 ms. C2, The average ratios (P2/P1) of AMPAR-mediated eEPSCs obtained with different ISIs in WT mice (n = 13, P16–P21; n = 13, P22–P27) were not significantly different at each age group from those obtained in LMO4 KO mice (n = 12, P16–P21; n = 16, P22–P27). D1, Dot plots showing the average ratios (P2/P1) of AMPAR-mediated eEPSCs at 50 ms ISI before and after caffeine (10 mm) treatment. Caffeine significantly reduced the P2/P1 in WT (n = 10) but had little effect in LMO4 KO neurons (KO, n = 8). *p < 0.05. D2, Dot plots summarizing coefficient of variation analyses for the effects of caffeine (10 mm) on eEPSC in brain slices.
We next determined release probability using a more direct experimental approach by comparing the rate of blockade of NMDAR-mediated currents by the irreversible and use-dependent NMDAR blocker MK-801. This method is a reliable and widely used approach to evaluate release probability (Hessler et al., 1993; Rosenmund et al., 1993). As expected, bath administration of MK-801 (30 μm, during AMPAR blockade) induced a use-dependent, progressive block of NMDAR-mediated eEPSCs that could be fitted by a single exponential (Fig. 6B). We found that the rate of decline of NMDAR-mediated eEPSCs induced by MK-801 was close to twofold slower in LMO4 KO mice compared with WT littermate controls (τ = 44.97 vs 24.69) (Fig. 6B), indicating a marked decrease in glutamatergic release probability in LMO4 KO mice. As a last test to monitor release probability, we next performed paired-pulse ratio analysis (Dobrunz and Stevens, 1997). As expected for CA1 recordings, we found paired-pulse facilitation (PPF) of AMPAR-mediated eEPSCs in WT slices. Somewhat unexpectedly, we failed to observe any significant change in PPF in LMO4 KO slices (Fig. 6C). As such, our assessment of release probability in LMO4 KO yielding different approaches provides ambiguous results. Because the contribution of CICR to basal release probability is somewhat controversial, we did not further attempt to resolve this discrepancy. However, we did ask whether acutely increasing CICR by an acute caffeine treatment would enhance release probability, thereby providing another index to monitor CICR in LMO4 KO. As previously observed (Martín and Buño, 2003), bath administration of caffeine significantly enhanced the release probability of glutamate onto WT CA1 neurons, as inferred by both paired-pulse ratio analysis (Fig. 6D1) and coefficient of variation analysis (Fig. 6D2). Caffeine, however, did not modulate release probability in LMO4 KO (Fig. 6D). Altogether, these results indicate that the effectiveness of a pharmacological activation of RyR-mediated CICR was abolished in LMO4 KO slices.
CICR-mediated facilitation of glutamatergic transmission during trains of action potentials in CA1 is impaired in LMO4 KO mice
The contribution of CICR to synaptic release elicited by prolonged trains of action potentials has been well demonstrated (Zhang et al., 2009). We therefore investigated synaptic responses in CA1 to repetitive stimuli of increasing frequency in WT and LMO4 KO mice (Fig. 7A). As expected, low-frequency stimulation (1 Hz; 10 pulses) induced eEPSCs that showed neither facilitation nor depression in either littermate control or LMO4 KO neurons. At 10 Hz, eEPSCs exhibited facilitation in both WT and LMO4 KO mice. Interestingly, a robust reduction in the synaptic facilitation induced by a 20 Hz stimulation became manifest in LMO4 KO neurons, and this impairment was also present at the highest frequency tested (50 Hz). That altered calcium-dependent signaling was involved in this compromised synaptic facilitation in LMO4 KO animals was suggested by the rescue of this defect by increasing extracellular concentrations of calcium (to 5 and 7.5 mm) (Fig. 7B).
Figure 7.
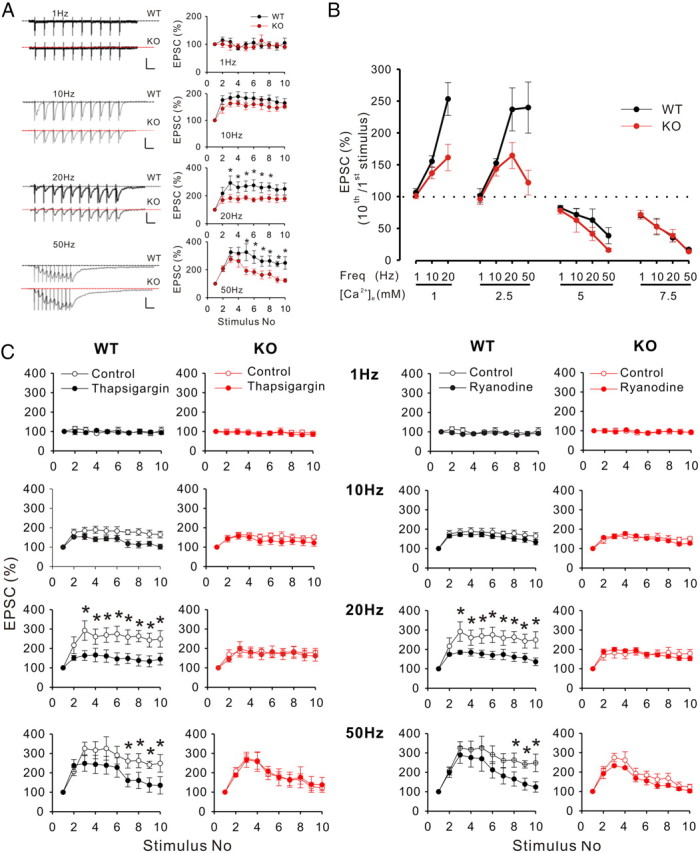
The facilitation of eEPSCs induced by high-frequency stimulation is impaired in LMO4 KO mice. A, Left, Current traces from CA1 recordings depicting synaptic facilitation elicited by trains of action potential of increasing frequency (1, 10, 20, and 50 Hz; n = 11 for both WT and KO). External calcium concentration = 2.5 mm. Calibration: for 1 Hz: 50 pA, 1 s; for 10 Hz: 50 pA, 100 ms; for 20 and 50 Hz: 100 pA, 50 ms. B, Percent change of EPSCs elicited by the 10th stimulus normalized to the response to the first stimulus at indicated external calcium concentrations. The synaptic facilitation deficits in KO neurons were compensated by elevating external calcium concentration. n = 11 for each genotype at each calcium concentration. *p < 0.05. C, The effects of thapsigargin and ryanodine treatments on synaptic facilitation were compared in WT (left) and LMO4 KO slices (right). The control trains are replotted here from A for clarity. All data points are presented as mean ± SEM. n = 11 for groups except n = 6 for ryanodine-treated KO group.
We reasoned that the altered behavior in short-term plasticity outlined above in LMO4 KO slices could reflect the putative generalized impairment of CICR in these mice. We analyzed this short-term plasticity following depletion of intracellular calcium stores by treating slices with thapsigargin (Treiman et al., 1998). In keeping with a previous report (Zhang et al., 2009), we found that a significant proportion of the facilitation of eEPSC by high-frequency trains was blocked by thapsigargin treatment in WT slices (Fig. 7C). Interestingly, thapsigargin had no effect on the behavior of trains of eEPSCs elicited in LMO4 KO slices. Similarly, treatment with ryanodine, at a concentration that blocks RyRs and prevents CICR, also suppressed synaptic facilitation at 20 Hz in WT neurons but had no effect in LMO4 KO neurons (Fig. 7D). Because the CICR-independent portion of facilitation observed in WT mice closely matched that observed in LMO4 KO, collectively, these results strongly support the notion that CICR contributes to the maintenance of facilitation during prolonged trains and that this process is severely compromised in LMO4 KO.
Hippocampal long-term potentiation is impaired in LMO4 KO mice
Having determined the effects of LMO4 deletion on short-term plasticity, we next asked whether ablation of LMO4 was accompanied with deficits of long-term potentiation (LTP). To address this possibility, we obtained whole-cell recordings from CA1 pyramidal neurons and applied a standard pairing LTP protocol (i.e., 100 pulses delivered at 1 Hz while holding the cell at 0 mV). This protocol induced a robust LTP in WT slices. Interestingly, the magnitude of the potentiation was markedly reduced in slices from littermate LMO4 KO mice (Fig. 8A). Although a plethora of mechanisms could in principle account for this defect in LTP, we wondered whether the reduction in release probability in LMO4 KO could underlie this defect simply by reducing the number of successful synaptic release events during the LTP-inducing protocol. To address this possibility, we reasoned that increasing the number of pulses during the LTP protocol would rescue the defect in LTP if it stemmed solely from a presynaptic release probability deficiency. We therefore repeated the experiments using a higher stimulus number during the protocol. However, these experiments were soon complicated by the fact that the magnitude of the LTP in these conditions was so strong that it elicited in several recordings the appearance of unclamped action potentials despite efforts to begin the recordings with small baseline eEPSCs (∼20–50 pA; data not shown). We thus repeated the entire series of LTP experiments with the intracellular recording solution supplemented with the cell-impermeant sodium channel blocker QX-314. Using a 100-pulse LTP protocol, inclusion of QX-314 did not induce any phenotypic changes since the magnitude of LTP was still severely compromised in LMO4 KO slices (Fig. 8, compare B1, A). However, this defect was no longer present when 300 and 600 pulses (at 1 Hz) were applied during the LTP induction protocol (Fig. 8B2,B3). Altogether, these results are consistent with the observation that glutamate release probability is lower in LMO4 KO slices and suggest that this defect translates in a shift in the induction rules of LTP in the hippocampus.
Figure 8.
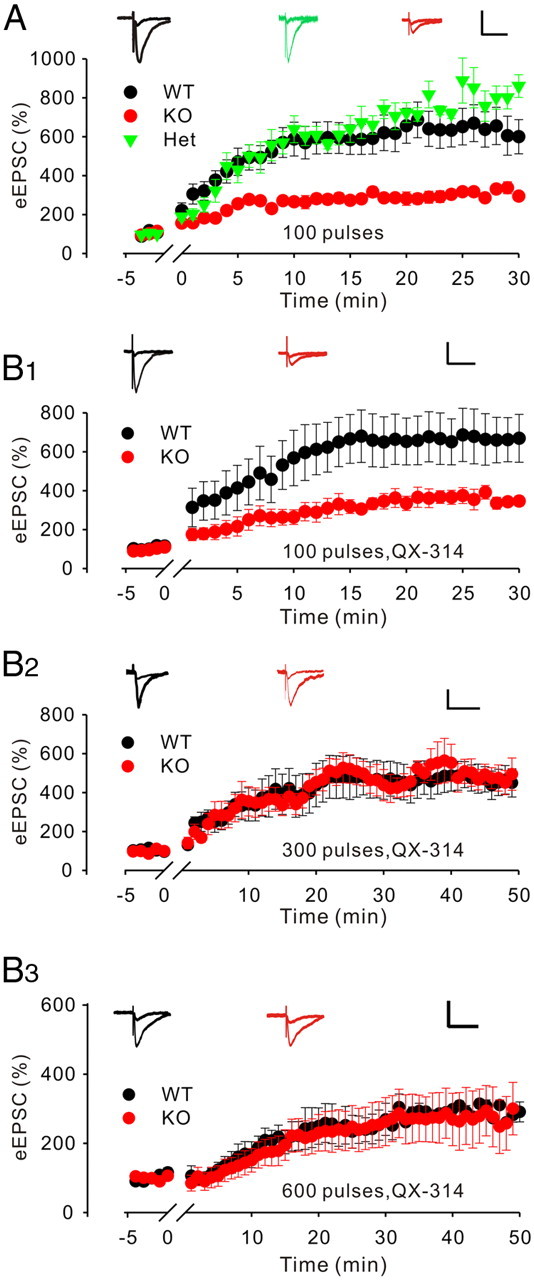
Impaired LTP in the CA1 neurons in LMO4 KO mice. A, Current traces of AMPAR-mediated eEPSCs from CA1 neurons at baseline and after LTP were induced by a pairing protocol (100 pulses delivered at 1 Hz at 0 mV). The magnitude of LTP was significantly reduced in LMO4 KO mice. n = 10, WT; n = 6, Het; n = 9, KO. Calibration: 100 pA, 50 ms. B, The effects of increasing the number of pulses delivered during the pairing protocol (i.e., 100, 300, and 600 pulses while holding the cell at 0 mV) were compared in WT and LMO4 KO slices. In B, the intracellular recording solution was supplemented with QX-314. In these conditions, the magnitude of LTP was significantly reduced in LMO4 KO mice following the 100 pulse LTP induction regimen (B1; n = 8, WT; n = 7, KO; calibration: 100 pA, 50 ms), but not following the 300 (B2; n = 6, WT; n = 4, KO; calibration: 100 pA, 50 ms) and 600 (B3; n = 11, WT; n = 11, KO; calibration: 100 pA, 50 ms) pulse regimens.
LMO4 KO mice exhibit spatial learning and memory deficits in a Morris water maze test
To determine whether the overall changes in release probability in the LMO4 KO animals were associated with a defect in a hippocampus-dependent spatial learning task we conducted a Morris water maze test. During 9 d of training, the escape latency (the time taken to get to a hidden platform) was significantly longer for LMO4 KO mice compared with their littermate controls, indicating a spatial learning deficit (Fig. 9A). In agreement with this interpretation, during the probe trial the LMO4 KO mice also spent less time in the back right quadrant where the escape hidden platform had been located during training (Fig. 9B). On the day of the probe test, LMO4 KO mice also took three times longer than littermate controls to first cross over where the hidden platform was previously located during training (Fig. 9C). This deficit is unlikely to reflect a generalized alteration in motor function since WT and KO mice displayed indistinguishable swimming speeds (Fig. 9D). These results suggest that spatial learning and memory are impaired in LMO4 KO mice.
Figure 9.
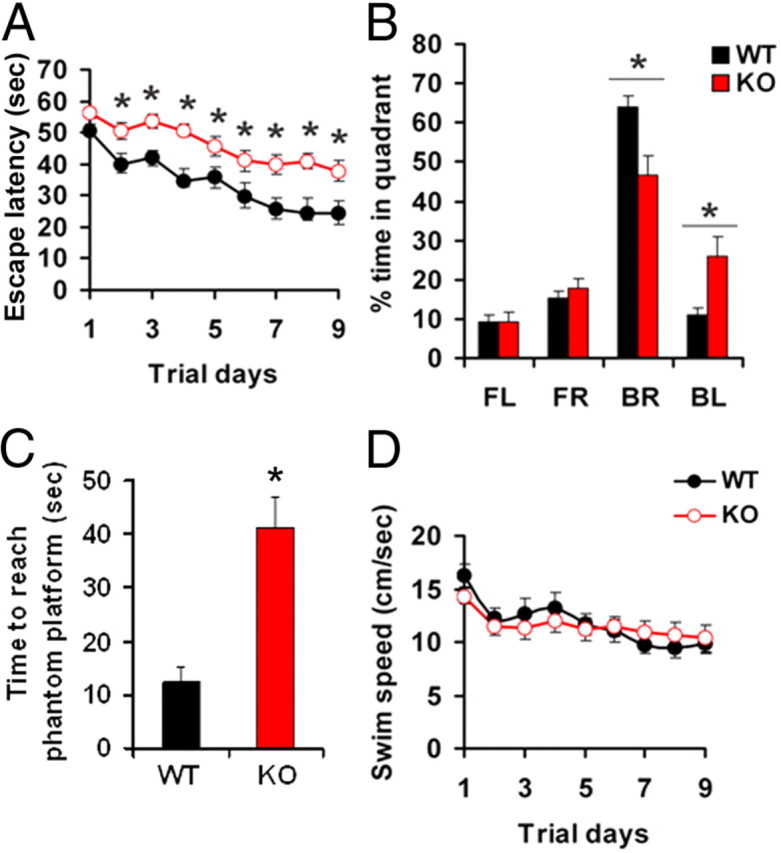
CamK2αCre/LMO4flox mice exhibit spatial learning and memory deficits in Morris water maze hidden platform test. A, During the 9 d of training LMO4 KO mice took a longer time to find the platform in the water maze task. Data represent means of four trials ± SEM. B, On probe trail (day 10) LMO4 KO mice spent significantly less time in the quadrant (BR) where the platform was previously located during training. FL, Front left; FR, front right; BL, back left (target quadrant); BR, back right. C, On probe test LMO4 KO mice took three times longer to first cross over where the platform was previously located during training. D, Swimming speeds were not different between WT and KO mice. *p < 0.05. n = 12, WT, n = 15, KO.
Discussion
In this study, we show that LMO4 is an important regulator of the molecular machinery controlling CICR in central neurons. First, we found that ablating LMO4 in neurons is associated with reduced RyR2 mRNA and protein expression. This reduction likely reflects a direct transcriptional function for LMO4 since we found that it positively regulates the RyR2 promoter in a luciferase assay. We next sought to functionally assess the role of LMO4 in controlling CICR in central neurons by monitoring in a forebrain-specific LMO4 KO a number of electrophysiological responses known to be modulated by CICR. We found that the CICR modulation of the AHP in hippocampus CA3 neurons was severely reduced in LMO4 KO and that this deficit likely reflected compromised release of calcium from internal stores, as determined in multiphoton calcium imaging experiments. Furthermore, the CICR-mediated modulation of glutamate release probability onto CA1 pyramidal neurons was abolished in recordings from LMO4 KO slices. These changes were accompanied with impaired hippocampal LTP and hippocampal-dependent behavioral tasks. Together, these results identify a key role of LMO4 in controlling central synapse and neuronal function, and that disruption of these functions results in important behavioral deficits.
The role of LMO4 in neuronal function is only beginning to be explored. A previous study described a key role of LMO4 in the patterning of thalamocortical connections, a function that was ascribed to its transcriptional role (Kashani et al., 2006). However, how this occurs is unclear, in part emphasizing our fragmentary understanding of the cellular roles played by this protein. To begin addressing this limitation, we performed a nonbiased, high-throughput screen to identify potential targets modulated by LMO4. This effort led us to the identification of RyR2 as a gene whose level of expression depends upon LMO4. Although direct DNA binding has not been demonstrated for LMO4, this protein interacts with the transcription factor CREB to regulate gene expression in response to synaptic activity and calcium influx through both L-type voltage-sensitive calcium channels and NMDA receptors (Kashani et al., 2006). CREB is known to activate the RyR2 promoter (Ziviani et al., 2011), and LMO4 may work through CREB to regulate the expression of RyR2. Thus, LMO4 is strategically positioned to tune the gain of CICR, a biologically powerful mechanism that modulates neuronal function, in a manner dependent on overall neuronal excitability.
Because it is well established that a significant portion of the calcium that triggers AHP originates from internal stores (Kuba et al., 1983; Sah and McLachlan, 1991; Sah, 1996; Torres et al., 1996; Pineda et al., 1999; Akita and Kuba, 2000), we reasoned that studying the behavior of the AHP in response to manipulations aimed either at increasing or blocking CICR would provide a valid approach to probe the CICR machinery in LMO4 KO. That the amplitude of the AHP in CA3 pyramidal neurons from LMO4 KO was smaller than littermate controls provided an indication that LMO4 might regulate CICR. This idea was further confirmed by the following observations: (1) that blocking CICR had no effect on the amplitude of the AHP in LMO4 KO neurons, while this same manipulation significantly reduced that in WT neurons and; (2) that the ability of caffeine to increase the AHP was severely curtailed in LMO4 KO neurons. Importantly, multiphoton calcium imaging experiments confirmed that the caffeine-induced potentiation of calcium release from internal stores during a train of action potentials was abolished in LMO4 KO slices. As such, these findings strongly argue that the CICR machinery is compromised in LMO4 KO mice and that this reduction likely stems from the reduced levels of RyR2.
There is mounting evidence suggesting that calcium from CICR is a powerful modulator of neurotransmitter release, at least under some conditions (Peng, 1996; Llano et al., 2000; Emptage et al., 2001; Zhang et al., 2009). These studies therefore prompted us to examine several determinants of synaptic release in LMO4 KO slices. As a first step, we assessed basal glutamate release probability in WT and KO slices. Intriguingly, the different, but complimentary, approaches used to estimate glutamate release probability yielded inconsistent outcomes. Indeed, whereas the frequency of mEPSCs and the rate of block of NMDAR-mediated current by the use-dependent blocker MK-801 both concurred in indicating that release probability was lower in CA1 synapses of LMO4 KO compared with WT slices, the paired-pulse ratio of eEPSCs was indistinguishable between WT and KO slices. The reasons underlying this discrepancy are unclear at present. Of relevance here, we failed to observe any changes in paired-pulse ratio in CA1 neurons following blockade of CICR (Fig. 7), in keeping with a previous study (Carter et al., 2002). Although the contributing role of CICR to setting basal release probability during low-frequency neurotransmission may be considered to be equivocal (Carter et al., 2002), it is clear that acute pharmacological challenges that enhance calcium release from internal stores can lead to a marked enhancement of release probability (Martín and Buño, 2003) (Fig. 6D). That this effect is severely abolished in LMO4 KO slices, regardless of the inconsistencies between the different experimental methods used to probe basal release probability, provides yet another line of evidence supporting the role of LMO4 as a key modulator of CICR.
As a means to provide alternative evidence supporting the role of LMO4 in controlling CICR, we reasoned that the recently described ability of CICR to modulate the facilitation of glutamate release induced by a burst of action potentials (Zhang et al., 2009) would provide a reliable index to further assess CICR function in LMO4 KO slices. As expected, a train of 10 pulses induced a robustly facilitating postsynaptic response when applied at frequencies of >10 Hz. Manipulations that altered CICR revealed that calcium from internal stores significantly contributed to maintain this synaptic facilitation during trains of action potentials (i.e., the CICR contribution begins to be apparent after the third to fourth stimulus of a high-stimulus train). In our hands, the maximal (and likely saturating) synaptic facilitation induced by high-frequency bursts was attained during the 20 Hz stimulation regimen, since a 50 Hz stimulation did not further facilitate the postsynaptic response (i.e., an approximately threefold potentiation). Altogether, we have recapitulated the findings of Zhang et al. (2009), which showed that CICR robustly and dynamically modulate release probability, in part in contributing to the maintenance of release fidelity during trains of action potentials.
Having established in our hands short-term plasticity regimens that are robustly modulated by CICR processes, we then analyzed the behavior of these trains in LMO4 KO slices. In keeping with the putative role of LMO4 in modulating CICR, the magnitude of the facilitation induced by high-frequency trains in slices from LMO4 KO CA1 neurons was markedly smaller than that observed in WT slices and, importantly, closely matched that obtained in WT slices treated with either thapsigargin or ryanodine. Importantly, these same treatments were devoid of any effect on high-frequency train responses induced in LMO4 KO slices. Altogether, these data add to and support those obtained on the behavior of the AHP in CA3 neurons and outline a robust deficit of CICR in neurons devoid of LMO4.
It is striking to note that synaptic release phenotypes highly analogous to those we show here in LMO4 KO mice have recently been reported to occur in presenilin 1 and 2 double knock-out mice (Zhang et al., 2009). A GeoProfile report (GDS787/98122_at/Lmo4/Mus musculus) indicates that the expression of LMO4 is dramatically reduced in the forebrain of these double knock-out mice (Beglopoulos et al., 2004) whereas our qPCR analysis, conversely, showed that presenilin 1 and 2 expression in hippocampus was not altered in LMO4 KO mice (data not shown). Although in need of formal support, these findings collectively raise the intriguing possibility that, at least in part, the deficiency associated with presenilin deletion might actually be secondary to reduced LMO4 expression and thereby implicate LMO4 in the etiopathology of Alzheimer's disease. Along this line, decreased expression of LMO4 in the entorhinal cortex and in the hippocampal region was reported in nonfamiliar Alzheimer's disease brains, and this reduction was correlated with the amount of neurofibrillary tangles, degenerating neurons, the severity of senile plaque deposition, and an increase in β-amyloid (Leuba et al., 2004). Altogether, our study shows that important neuronal and synaptic mechanisms relying on CICR are tightly controlled by LMO4 as early as 1 month of age. Because dysregulated calcium homeostasis and compromised synaptic function precede histopathological manifestations of neurodegeneration (Oddo et al., 2003; Rowan et al., 2003), it will be important to determine whether dysregulated LMO4 function or expression might contribute to the progression of Alzheimer's disease.
Footnotes
This work is supported by grants from the Ontario Research Fund & Canada Foundation for Innovation (H.-H.C., J.-C.B., D.C.L.), Heart and Stroke Foundation of Canada (HSFC) (NA6301 to H.-H.C. and NA7010 to J.-C.B.), the Canadian Institutes of Health Research (MOP-179197 to H.-H.C. and MOP-110927 to J.-C.B.), and the Natural Science and Engineering Research Council of Canada (NSERC) (J.-C.B.). H.-H.C. is also supported by the Henry J. M. Barnett Research Scholarship and New Investigator Award from the HSFC and by the Early Researcher Award (ERA) from the Ontario Ministry of Research and Innovation. J.-C.B. and D.C.L. are also supported by ERA. This work was also funded by the Heart and Stroke Foundation Centre for Stroke Recovery (salary and equipment). Z.Q. has been supported by scholarships from the Ontario Graduate Scholarship program, the NSERC, and University of Ottawa. We are grateful for Dr. Alexandre Stewart (University of Ottawa Heart Institute) for helpful discussions and reading the manuscript. We thank Cary Soares, Drs. Adrian Wong, and Richard Bergeron (Ottawa Hospital Research Institute, University of Ottawa) for their helpful comments.
The author's declare no competing financial interests.
References
- Aizawa H, Hu SC, Bobb K, Balakrishnan K, Ince G, Gurevich I, Cowan M, Ghosh A. Dendrite development regulated by CREST, a calcium-regulated transcriptional activator. Science. 2004;303:197–202. doi: 10.1126/science.1089845. [DOI] [PubMed] [Google Scholar]
- Akita T, Kuba K. Functional triads consisting of ryanodine receptors, Ca(2+) channels, and Ca(2+)-activated K(+) channels in bullfrog sympathetic neurons. Plastic modulation of action potential. J Gen Physiol. 2000;116:697–720. doi: 10.1085/jgp.116.5.697. [DOI] [PMC free article] [PubMed] [Google Scholar]
- Alger BE, Nicoll RA. Epileptiform burst afterhyperolarization: calcium-dependent potassium potential in hippocampal CA1 pyramidal cells. Science. 1980;210:1122–1124. doi: 10.1126/science.7444438. [DOI] [PubMed] [Google Scholar]
- Andrade R, Nicoll RA. Pharmacologically distinct actions of serotonin on single pyramidal neurones of the rat hippocampus recorded in vitro. J Physiol. 1987;394:99–124. doi: 10.1113/jphysiol.1987.sp016862. [DOI] [PMC free article] [PubMed] [Google Scholar]
- Beglopoulos V, Sun X, Saura CA, Lemere CA, Kim RD, Shen J. Reduced beta-amyloid production and increased inflammatory responses in presenilin conditional knock-out mice. J Biol Chem. 2004;279:46907–46914. doi: 10.1074/jbc.M409544200. [DOI] [PubMed] [Google Scholar]
- Béïque JC, Andrade R. PSD-95 regulates synaptic transmission and plasticity in rat cerebral cortex. J Physiol. 2003;546:859–867. doi: 10.1113/jphysiol.2002.031369. [DOI] [PMC free article] [PubMed] [Google Scholar]
- Béïque JC, Lin DT, Kang MG, Aizawa H, Takamiya K, Huganir RL. Synapse-specific regulation of AMPA receptor function by PSD-95. Proc Natl Acad Sci U S A. 2006;103:19535–19540. doi: 10.1073/pnas.0608492103. [DOI] [PMC free article] [PubMed] [Google Scholar]
- Béïque JC, Imad M, Mladenovic L, Gingrich JA, Andrade R. Mechanism of the 5-hydroxytryptamine 2A receptor-mediated facilitation of synaptic activity in prefrontal cortex. Proc Natl Acad Sci U S A. 2007;104:9870–9875. doi: 10.1073/pnas.0700436104. [DOI] [PMC free article] [PubMed] [Google Scholar]
- Bekkers JM, Stevens CF. Presynaptic mechanism for long-term potentiation in the hippocampus. Nature. 1990;346:724–729. doi: 10.1038/346724a0. [DOI] [PubMed] [Google Scholar]
- Bong YS, Lee HS, Carim-Todd L, Mood K, Nishanian TG, Tessarollo L, Daar IO. ephrinB1 signals from the cell surface to the nucleus by recruitment of STAT3. Proc Natl Acad Sci U S A. 2007;104:17305–17310. doi: 10.1073/pnas.0702337104. [DOI] [PMC free article] [PubMed] [Google Scholar]
- Carter AG, Vogt KE, Foster KA, Regehr WG. Assessing the role of calcium-induced calcium release in short-term presynaptic plasticity at excitatory central synapses. J Neurosci. 2002;22:21–28. doi: 10.1523/JNEUROSCI.22-01-00021.2002. [DOI] [PMC free article] [PubMed] [Google Scholar]
- Casanova E, Fehsenfeld S, Mantamadiotis T, Lemberger T, Greiner E, Stewart AF, Schütz G. A CamKIIalpha iCre BAC allows brain-specific gene inactivation. Genesis. 2001;31:37–42. doi: 10.1002/gene.1078. [DOI] [PubMed] [Google Scholar]
- Chakroborty S, Goussakov I, Miller MB, Stutzmann GE. Deviant ryanodine receptor-mediated calcium release resets synaptic homeostasis in presymptomatic 3xTg-AD mice. J Neurosci. 2009;29:9458–9470. doi: 10.1523/JNEUROSCI.2047-09.2009. [DOI] [PMC free article] [PubMed] [Google Scholar]
- Chen HH, Yip JW, Stewart AF, Frank E. Differential expression of a transcription regulatory factor, the LIM domain only 4 protein Lmo4, in muscle sensory neurons. Development. 2002;129:4879–4889. doi: 10.1242/dev.129.21.4879. [DOI] [PubMed] [Google Scholar]
- Chen HH, Xu J, Safarpour F, Stewart AF. LMO4 mRNA stability is regulated by extracellular ATP in F11 cells. Biochem Biophys Res Commun. 2007a;357:56–61. doi: 10.1016/j.bbrc.2007.03.113. [DOI] [PubMed] [Google Scholar]
- Chen HH, Schock SC, Xu J, Safarpour F, Thompson CS, Stewart AF. Extracellular ATP-dependent upregulation of the transcription cofactor LMO4 promotes neuron survival from hypoxia. Exp Cell Res. 2007b;313:3106–3116. doi: 10.1016/j.yexcr.2007.04.026. [DOI] [PubMed] [Google Scholar]
- Dobrunz LE, Stevens CF. Heterogeneity of release probability, facilitation, and depletion at central synapses. Neuron. 1997;18:995–1008. doi: 10.1016/s0896-6273(00)80338-4. [DOI] [PubMed] [Google Scholar]
- Duquette PM, Zhou X, Yap NL, MacLaren EJ, Lu JJ, Wallace VA, Chen HH. Loss of LMO4 in the retina leads to reduction of GABAergic amacrine cells and functional deficits. PLoS One. 2010;5:e13232. doi: 10.1371/journal.pone.0013232. [DOI] [PMC free article] [PubMed] [Google Scholar]
- Emptage NJ, Reid CA, Fine A. Calcium stores in hippocampal synaptic boutons mediate short-term plasticity, store-operated Ca2+ entry, and spontaneous transmitter release. Neuron. 2001;29:197–208. doi: 10.1016/s0896-6273(01)00190-8. [DOI] [PubMed] [Google Scholar]
- Faber DS, Korn H. Applicability of the coefficient of variation method for analyzing synaptic plasticity. Biophys J. 1991;60:1288–1294. doi: 10.1016/S0006-3495(91)82162-2. [DOI] [PMC free article] [PubMed] [Google Scholar]
- Fill M, Copello JA. Ryanodine receptor calcium release channels. Physiol Rev. 2002;82:893–922. doi: 10.1152/physrev.00013.2002. [DOI] [PubMed] [Google Scholar]
- Flavell SW, Greenberg ME. Signaling mechanisms linking neuronal activity to gene expression and plasticity of the nervous system. Annu Rev Neurosci. 2008;31:563–590. doi: 10.1146/annurev.neuro.31.060407.125631. [DOI] [PMC free article] [PubMed] [Google Scholar]
- Gomez-Smith M, Qin Z, Zhou X, Schock SC, Chen HH. LIM domain only 4 protein promotes granulocyte colony-stimulating factor-induced signaling in neurons. Cell Mol Life Sci. 2010;67:949–957. doi: 10.1007/s00018-009-0223-z. [DOI] [PMC free article] [PubMed] [Google Scholar]
- Hahm K, Sum EY, Fujiwara Y, Lindeman GJ, Visvader JE, Orkin SH. Defective neural tube closure and anteroposterior patterning in mice lacking the LIM protein LMO4 or its interacting partner Deaf-1. Mol Cell Biol. 2004;24:2074–2082. doi: 10.1128/MCB.24.5.2074-2082.2004. [DOI] [PMC free article] [PubMed] [Google Scholar]
- Hessler NA, Shirke AM, Malinow R. The probability of transmitter release at a mammalian central synapse. Nature. 1993;366:569–572. doi: 10.1038/366569a0. [DOI] [PubMed] [Google Scholar]
- Hotson JR, Prince DA. A calcium-activated hyperpolarization follows repetitive firing in hippocampal neurons. J Neurophysiol. 1980;43:409–419. doi: 10.1152/jn.1980.43.2.409. [DOI] [PubMed] [Google Scholar]
- Iino M. Calcium-induced calcium release mechanism in guinea pig taenia caeci. J Gen Physiol. 1989;94:363–383. doi: 10.1085/jgp.94.2.363. [DOI] [PMC free article] [PubMed] [Google Scholar]
- Kashani AH, Qiu Z, Jurata L, Lee SK, Pfaff S, Goebbels S, Nave KA, Ghosh A. Calcium activation of the LMO4 transcription complex and its role in the patterning of thalamocortical connections. J Neurosci. 2006;26:8398–8408. doi: 10.1523/JNEUROSCI.0618-06.2006. [DOI] [PMC free article] [PubMed] [Google Scholar]
- Kenny DA, Jurata LW, Saga Y, Gill GN. Identification and characterization of LMO4, an LMO gene with a novel pattern of expression during embryogenesis. Proc Natl Acad Sci U S A. 1998;95:11257–11262. doi: 10.1073/pnas.95.19.11257. [DOI] [PMC free article] [PubMed] [Google Scholar]
- Kuba K, Morita K, Nohmi M. Origin of calcium ions involved in the generation of a slow afterhyperpolarization in bullfrog sympathetic neurones. Pflugers Arch. 1983;399:194–202. doi: 10.1007/BF00656714. [DOI] [PubMed] [Google Scholar]
- Lee SK, Jurata LW, Nowak R, Lettieri K, Kenny DA, Pfaff SL, Gill GN. The LIM domain-only protein LMO4 is required for neural tube closure. Mol Cell Neurosci. 2005;28:205–214. doi: 10.1016/j.mcn.2004.04.010. [DOI] [PubMed] [Google Scholar]
- Leuba G, Vernay A, Vu D, Walzer C, Belloir B, Kraftsik R, Bouras C, Savioz A. Differential expression of LMO4 protein in Alzheimer's disease. Neuropathol Appl Neurobiol. 2004;30:57–69. doi: 10.1046/j.0305-1846.2003.00511.x. [DOI] [PubMed] [Google Scholar]
- Llano I, González J, Caputo C, Lai FA, Blayney LM, Tan YP, Marty A. Presynaptic calcium stores underlie large-amplitude miniature IPSCs and spontaneous calcium transients. Nat Neurosci. 2000;3:1256–1265. doi: 10.1038/81781. [DOI] [PubMed] [Google Scholar]
- Madison DV, Nicoll RA. Control of the repetitive discharge of rat CA 1 pyramidal neurones in vitro. J Physiol. 1984;354:319–331. doi: 10.1113/jphysiol.1984.sp015378. [DOI] [PMC free article] [PubMed] [Google Scholar]
- Madison DV, Nicoll RA. Cyclic adenosine 3′,5′-monophosphate mediates beta-receptor actions of noradrenaline in rat hippocampal pyramidal cells. J Physiol. 1986;372:245–259. doi: 10.1113/jphysiol.1986.sp016007. [DOI] [PMC free article] [PubMed] [Google Scholar]
- Malinow R, Tsien RW. Presynaptic enhancement shown by whole-cell recordings of long-term potentiation in hippocampal slices. Nature. 1990;346:177–180. doi: 10.1038/346177a0. [DOI] [PubMed] [Google Scholar]
- Manabe T, Wyllie DJ, Perkel DJ, Nicoll RA. Modulation of synaptic transmission and long-term potentiation: effects on paired pulse facilitation and EPSC variance in the CA1 region of the hippocampus. J Neurophysiol. 1993;70:1451–1459. doi: 10.1152/jn.1993.70.4.1451. [DOI] [PubMed] [Google Scholar]
- Manetopoulos C, Hansson A, Karlsson J, Jönsson JI, Axelson H. The LIM-only protein LMO4 modulates the transcriptional activity of HEN1. Biochem Biophys Res Commun. 2003;307:891–899. doi: 10.1016/s0006-291x(03)01298-1. [DOI] [PubMed] [Google Scholar]
- Marrion NV, Tavalin SJ. Selective activation of Ca2+-activated K+ channels by co-localized Ca2+ channels in hippocampal neurons. Nature. 1998;395:900–905. doi: 10.1038/27674. [DOI] [PubMed] [Google Scholar]
- Martín ED, Buño W. Caffeine-mediated presynaptic long-term potentiation in hippocampal CA1 pyramidal neurons. J Neurophysiol. 2003;89:3029–3038. doi: 10.1152/jn.00601.2002. [DOI] [PubMed] [Google Scholar]
- Novotny-Diermayr V, Lin B, Gu L, Cao X. Modulation of the interleukin-6 receptor subunit glycoprotein 130 complex and its signaling by LMO4 interaction. J Biol Chem. 2005;280:12747–12757. doi: 10.1074/jbc.M500175200. [DOI] [PubMed] [Google Scholar]
- Oddo S, Caccamo A, Shepherd JD, Murphy MP, Golde TE, Kayed R, Metherate R, Mattson MP, Akbari Y, LaFerla FM. Triple-transgenic model of Alzheimer's disease with plaques and tangles: intracellular Abeta and synaptic dysfunction. Neuron. 2003;39:409–421. doi: 10.1016/s0896-6273(03)00434-3. [DOI] [PubMed] [Google Scholar]
- Peng Y. Ryanodine-sensitive component of calcium transients evoked by nerve firing at presynaptic nerve terminals. J Neurosci. 1996;16:6703–6712. doi: 10.1523/JNEUROSCI.16-21-06703.1996. [DOI] [PMC free article] [PubMed] [Google Scholar]
- Pfeffer M, Müller CM, Mordel J, Meissl H, Ansari N, Deller T, Korf HW, von Gall C. The mammalian molecular clockwork controls rhythmic expression of its own input pathway components. J Neurosci. 2009;29:6114–6123. doi: 10.1523/JNEUROSCI.0275-09.2009. [DOI] [PMC free article] [PubMed] [Google Scholar]
- Pineda JC, Waters RS, Foehring RC. Specificity in the interaction of HVA Ca2+ channel types with Ca2+-dependent AHPs and firing behavior in neocortical pyramidal neurons. J Neurophysiol. 1998;79:2522–2534. doi: 10.1152/jn.1998.79.5.2522. [DOI] [PubMed] [Google Scholar]
- Pineda JC, Galarraga E, Foehring RC. Different Ca2+ source for slow AHP in completely adapting and repetitive firing pyramidal neurons. Neuroreport. 1999;10:1951–1956. doi: 10.1097/00001756-199906230-00029. [DOI] [PubMed] [Google Scholar]
- Rosenmund C, Clements JD, Westbrook GL. Nonuniform probability of glutamate release at a hippocampal synapse. Science. 1993;262:754–757. doi: 10.1126/science.7901909. [DOI] [PubMed] [Google Scholar]
- Rowan MJ, Klyubin I, Cullen WK, Anwyl R. Synaptic plasticity in animal models of early Alzheimer's disease. Philos Trans R Soc Lond B Biol Sci. 2003;358:821–828. doi: 10.1098/rstb.2002.1240. [DOI] [PMC free article] [PubMed] [Google Scholar]
- Sah P. Ca(2+)-activated K+ currents in neurones: types, physiological roles and modulation. Trends Neurosci. 1996;19:150–154. doi: 10.1016/s0166-2236(96)80026-9. [DOI] [PubMed] [Google Scholar]
- Sah P, McLachlan EM. Ca(2+)-activated K+ currents underlying the afterhyperpolarization in guinea pig vagal neurons: a role for Ca(2+)-activated Ca2+ release. Neuron. 1991;7:257–264. doi: 10.1016/0896-6273(91)90264-z. [DOI] [PubMed] [Google Scholar]
- Schock SC, Xu J, Duquette PM, Qin Z, Rai PS, Lewandowski AJ, Rai PS, Thompson CS, Seifert EL, Harper ME, Chen HH. Rescue of neurons from ischemic injury by PPARgamma requires a novel essential cofactor LMO4. J Neurosci. 2008;28:12433–12444. doi: 10.1523/JNEUROSCI.2897-08.2008. [DOI] [PMC free article] [PubMed] [Google Scholar]
- Schwartzkroin PA, Stafstrom CE. Effects of EGTA on the calcium-activated afterhyperpolarization in hippocampal CA3 pyramidal cells. Science. 1980;210:1125–1126. doi: 10.1126/science.6777871. [DOI] [PubMed] [Google Scholar]
- Stoppini L, Buchs PA, Muller D. A simple method for organotypic cultures of nervous tissue. J Neurosci Methods. 1991;37:173–182. doi: 10.1016/0165-0270(91)90128-m. [DOI] [PubMed] [Google Scholar]
- Stutzmann GE, Smith I, Caccamo A, Oddo S, Laferla FM, Parker I. Enhanced ryanodine receptor recruitment contributes to Ca2+ disruptions in young, adult, and aged Alzheimer's disease mice. J Neurosci. 2006;26:5180–5189. doi: 10.1523/JNEUROSCI.0739-06.2006. [DOI] [PMC free article] [PubMed] [Google Scholar]
- Torres GE, Arfken CL, Andrade R. 5-Hydroxytryptamine4 receptors reduce afterhyperpolarization in hippocampus by inhibiting calcium-induced calcium release. Mol Pharmacol. 1996;50:1316–1322. [PubMed] [Google Scholar]
- Treiman M, Caspersen C, Christensen SB. A tool coming of age: thapsigargin as an inhibitor of sarco-endoplasmic reticulum Ca(2+)-ATPases. Trends Pharmacol Sci. 1998;19:131–135. doi: 10.1016/s0165-6147(98)01184-5. [DOI] [PubMed] [Google Scholar]
- Tse E, Smith AJ, Hunt S, Lavenir I, Forster A, Warren AJ, Grutz G, Foroni L, Carlton MB, Colledge WH, Boehm T, Rabbitts TH. Null mutation of the Lmo4 gene or a combined null mutation of the Lmo1/Lmo3 genes causes perinatal lethality, and Lmo4 controls neural tube development in mice. Mol Cell Biol. 2004;24:2063–2073. doi: 10.1128/MCB.24.5.2063-2073.2004. [DOI] [PMC free article] [PubMed] [Google Scholar]
- Tzingounis AV, Heidenreich M, Kharkovets T, Spitzmaul G, Jensen HS, Nicoll RA, Jentsch TJ. The KCNQ5 potassium channel mediates a component of the afterhyperpolarization current in mouse hippocampus. Proc Natl Acad Sci U S A. 2010;107:10232–10237. doi: 10.1073/pnas.1004644107. [DOI] [PMC free article] [PubMed] [Google Scholar]
- Zhang C, Wu B, Beglopoulos V, Wines-Samuelson M, Zhang D, Dragatsis I, Südhof TC, Shen J. Presenilins are essential for regulating neurotransmitter release. Nature. 2009;460:632–636. doi: 10.1038/nature08177. [DOI] [PMC free article] [PubMed] [Google Scholar]
- Zhou X, Gomez-Smith M, Qin Z, Duquette PM, Cardenas-Blanco A, Rai PS, Harper ME, Tsai EC, Anisman H, Chen HH. Ablation of LMO4 in glutamatergic neurons impairs leptin control of fat metabolism. Cell Mol Life Sci. 2012;69:819–828. doi: 10.1007/s00018-011-0794-3. [DOI] [PMC free article] [PubMed] [Google Scholar]
- Ziviani E, Lippi G, Bano D, Munarriz E, Guiducci S, Zoli M, Young KW, Nicotera P. Ryanodine receptor-2 upregulation and nicotine-mediated plasticity. EMBO J. 2011;30:194–204. doi: 10.1038/emboj.2010.279. [DOI] [PMC free article] [PubMed] [Google Scholar]