

Abstract
To ensure operation of synaptic transmission within an appropriate dynamic range, neurons have evolved mechanisms of activity-dependent plasticity, including changes in presynaptic efficacy. The multidomain protein RIM1α is an integral component of the cytomatrix at the presynaptic active zone and has emerged as key mediator of presynaptically expressed forms of synaptic plasticity. We have therefore addressed the role of RIM1α in aberrant cellular plasticity and structural reorganization after an episode of synchronous neuronal activity pharmacologically induced in vivo [status epilepticus (SE)]. Post-SE, all animals developed spontaneous seizure events, but their frequency was dramatically increased in RIM1α-deficient mice (RIM1α−/−). We found that in wild-type mice (RIM1α+/+) SE caused an increase in paired-pulse facilitation in the CA1 region of the hippocampus to the level observed in RIM1α−/− mice before SE. In contrast, this form of short-term plasticity was not further enhanced in RIM1α-deficient mice after SE. Intriguingly, RIM1α−/− mice showed a unique pattern of selective hilar cell loss (i.e., endfolium sclerosis), which so far has not been observed in a genetic epilepsy animal model, as well as less severe astrogliosis and attenuated mossy fiber sprouting. These findings indicate that the decrease in release probability and altered short- and long-term plasticity as present in RIM1α−/− mice result in the formation of a hyperexcitable network but act in part neuroprotectively with regard to neuropathological alterations associated with epileptogenesis. In summary, our results suggest that presynaptic plasticity and proper function of RIM1α play an important part in a neuron's adaptive response to aberrant electrical activity.
Introduction
The functional properties of synapses that interconnect central neurons in a dense network are key determinants of normal brain function. To ensure operation of these synapses within a physiologically appropriate dynamic range, neurons are capable of regulating their strength in response to changing electrical activity patterns (Pozo and Goda, 2010). RIM proteins are multidomain molecules that constitute an integral component of the presynaptic cytomatrix at the active zone. They represent key players in the regulation of neurotransmitter release (Schoch et al., 2006) at both excitatory and inhibitory synapses in several brain areas (Kaeser and Südhof, 2005; Mittelstaedt et al., 2010). The RIM1 gene produces two independent isoforms, RIM1α and RIM1β, that differ only in their N-terminal composition, with RIM1β lacking the N-terminal α-helical Rab3 interacting domain present in α-RIMs (Kaeser et al., 2008a). Whereas RIM1α and RIM1β function redundantly in the basic processes of synaptic vesicle exocytosis, RIM1α is furthermore a key mediator of presynaptically expressed forms of synaptic plasticity at different CNS synapses (Castillo et al., 2002; Schoch et al., 2002; Lonart et al., 2003; Calakos et al., 2004; Fourcaudot et al., 2008; Kaeser et al., 2008a,b; Pelkey et al., 2008) (endocannabinoid-mediated long-term depression) (Chevaleyre et al., 2007). Interestingly, the amount of RIM1 present at a single synapse has been found to correlate with its activity (Jiang et al., 2010; Lazarevic et al., 2011), suggesting a potential role in the regulation of plasticity itself.
Brain disorders such as epilepsy, which are characterized by aberrant neuronal activity, engage homeostatic plasticity and substantially influence synaptic efficacy (Galvan et al., 2000; Bausch et al., 2006; Howard et al., 2007). Persistent elevation of network activity decreases the number of readily releasable synaptic vesicles and release-probability (Moulder et al., 2004, 2006; Branco et al., 2008), whereas chronic suppression of neural activity results in an increased number of docked vesicles, enlarged active zones, and an elevated frequency of mEPSCs (Murthy et al., 2001; Moulder et al., 2006; Han and Stevens, 2009). Recent evidence suggests a direct involvement of proteins involved in synaptic vesicle priming in these processes (Moulder et al., 2006). In particular, the activity-induced degradation of RIM1 has been suggested to contribute to persistent presynaptic silencing/muting (Jiang et al., 2010).
Even though the molecular mechanisms of presynaptic adaptation and plasticity have been studied in great detail, there are still many unanswered questions regarding their physiological role in vivo. For example, it has been postulated that presynaptic muting is neuroprotective or sets the threshold for damage during insults. To examine the role of presynaptic adaptation in vivo, we analyzed RIM1α KO mice in a model of episodic brain hyperexcitability, which resembles human temporal lobe epilepsy (TLE). In this model, an episode of intense, synchronized neuronal activity, termed status epilepticus (SE), is induced in vivo by the muscarinic agonist pilocarpine. A single episode of SE then leads to chronic epilepsy, associated with the selective degeneration of hippocampal neurons (Pitsch et al., 2007). Intriguingly, RIM1α-deficient mice show increased spontaneous seizure activity after SE, as well as a particular hippocampal damage pattern similar to a subset of human temporal lobe epilepsy patients. Our data are consistent with the loss of a homeostatic regulatory mechanism in RIM1α−/− mice.
Materials and Methods
Animals and induction of chronic epilepsy.
RIM1α−/− and RIM2α−/− mice were obtained and genotyped as previously described (Schoch et al., 2002, 2006). Only male mice (age, ≥60 d; weight, >21 g) were used for the analyses described below. For quantitative mRNA analysis after pilocarpine-induced SE, 60-d-old C57BL/6/N mice were used. All procedures were performed in accordance with the guidelines of the University of Bonn Medical Center Animal Care Committee. Sustained seizures were induced in experimental animals by the administration of pilocarpine using injection protocols derived from those described previously (Pitsch et al., 2007). Briefly, RIM1α knock-out and corresponding wild-type littermates were injected with 335 mg/kg pilocarpine subcutaneously and their behavior was monitored at least for 2 h afterwards. This dose of pilocarpine was chosen because it reliably induces status epilepticus in wild-type animals while keeping mortality as low as possible. Seizures were classified as described by Pitsch et al. (2007) and Becker et al. (2008), i.e., stage III (severe seizures with rearing without falling) and stage IV (severe seizures with rearing and falling/loss of righting ability). Continuous tonic–clonic seizures (status epilepticus) were classified as stage V. Of the pilocarpine-injected animals, only those that developed SE (SE-experienced) were used for further EEG analysis, electrophysiological in vitro and in vivo examinations, and histological analyses.
Telemetric EEG monitoring and seizure classification.
The electrographic features of SE and chronic seizures were analyzed with a telemetric EEG/video-monitoring system. The telemetric system (Data Science International), implantation procedure, and postoperative treatment were previously described in detail (Pitsch et al., 2007; Becker et al., 2008). To examine the features of SE, mice were implanted with EEG electrodes 7 d before induction of SE. To analyze the development of recurrent seizures after SE, we implanted SE-experienced mice after recovery from SE (day 7 after SE). EEG recording with a sampling rate of 1 kHz was started at day 9 after SE, when mice had recovered from transmitter implantation and stable EEG signals were obtained. Monitoring was performed until day 26 after SE. EEG recordings were analyzed using fast Fourier power spectral analysis. To perform a time-dependent analysis, we used a moving window approach, as described previously (Becker et al., 2008). Briefly, power was analyzed in five frequency bands: delta (0.5–3.99 Hz), theta (4–7.99 Hz), alpha (8–12.99 Hz), beta (13–29.99 Hz), and gamma (30–40 Hz). The duration of increased EEG activity in the different frequency bands was determined as the time during which band power was increased to >10% of maximal values. The intensity of electrographic activity during SE was quantified as the area under the band power curve for each frequency band from the initiation of continuous electrographic seizure activity until the time point of diazepam injection. The resulting values were normalized to the area under the band power curve obtained from baseline EEG recordings of identical duration obtained 24 h before SE. From concurrent video recordings, all spontaneous seizures in the chronic period were classified as previously described (see Animals and induction of chronic epilepsy, above) (Pitsch et al., 2007).
Histopathological and immunohistochemical analyses.
Mice were decapitated under deep isoflurane anesthesia (Forene; Abbott) at different time points after SE as indicated. Brains were quickly removed and tissue prepared as follows. One hemisphere was fixed by cryopreservation and stored at −80°C and the other hemisphere was cut into 400 μm slices that were used for Timm staining or RNA analysis. For hematoxylin and eosin stains as well as immunohistochemistry, we used horizontal hippocampal cryosections (20 μm). NeuN staining was done as described before (Blümcke et al., 2001; Becker et al., 2008). Neuronal densities within the pyramidal cell and dentate granule cell layers of the hippocampus were determined in at least two NeuN-stained sections per animal of the ventral hippocampus by an investigator blinded to the experimental group. All digital images were captured with a Mirax Scan and Mirax Viewer software (Carl Zeiss). Timm staining was done as previously described (Blümcke et al., 2001). After staining, we counted Timm granules in digital images captured. These counts were normalized to the corresponding area of the field of view and binned into four bins corresponding to an increasing severity of mossy fiber sprouting (bins corresponding to 0, 1–10, 10–20, and >20 granules per 2500 μm2) (Becker et al., 2008). For assessment of astrogliosis, a polyclonal antibody directed against glial fibrillary protein (GFAP; DAKO) was used in a dilution of 1:400. GFAP staining served as qualitative assessment of gliosis as described for human TLE (Blümcke et al., 2007). This staining was quantified in severity of 0–4 (0 = no reactive gliosis, 4 = strong gliosis) in the whole hippocampal formation.
Real-time RT-PCR.
CA1, CA3, and dentate gyrus (DG) regions were microdissected from hippocampal slices (400 μm) and mRNA was isolated with a Dynabeads mRNA Direct Micro Kit (Dynal) according to the manufacturer's protocol. RIM subunit transcript quantification was performed by real-time RT-PCR (ABI PRISM 9700HT; Applied Biosystems). Synaptophysin was used as endogenous, neuron-specific reference gene because it does not show expression changes after pilocarpine-induced SE (Becker et al., 2008). Primers for RIM2α, RIM1β subunits and synaptophysin were designed with Primer3Plus software (http://www.bioinformatics.nl/cgi-bin/primer3plus/primer3plus.cgi; Table 1). No significant homology of the amplicon sequences with other previously characterized genes has been found searching GenBank data bases by BLASTN program (PubMed, http://blast.ncbi.nlm.nih.gov/Blast.cgi). Real-time RT-PCR was performed as described previously (Becker et al., 2008). Reactions were performed at least in triplets. The SYBR green fluorescence signal was measured in each cycle. For the mRNA quantification of RIM1α, we used the TaqMan gene expression assays (RIM1α Mm01225731_m1) and corresponding synaptophysin (Mm01352661_m1; Life Technologies). After preincubation for 2 min at 50°C and 15 min at 95°C, we performed 40 PCR cycles (15 s at 95°C followed by 60 s at 60°C). Specificity of the primer and primer/probe pairs was assessed using respective knock-out mice.
Table 1.
Sequences of primers that were used for real-time RT-PCR
| Gene | Forward (f)/ reverse primer (r) | GenBank accession number |
|---|---|---|
| RIM1β | (f) 5′-CAGAAGCTGTCCCATTTTCC-3′ | FJ472653 |
| (r) 5′-GCTCAGAAAGCTCCAGAAGG-3′ | ||
| RIM2α | (f) 5′-TCACGGAAGAGGAGAGGAAA-3′ | NM_053271 |
| (r) 5′- AGCACGGACTGCTCCTTCT-3′ | ||
| Synaptophysin | (f) 5′- TTCAGGACTCAACACCTCGGT-3′ | NM_009305 |
| (r) 5′-CACGAACCATAGGTTGCCAAC-3′ |
Relative quantification of the starting mRNA copy numbers using multiple replicates for each reaction was performed according to the ΔΔCt-method (Fink et al., 1998). The signal threshold was set within the exponential phase of the reaction for determination of the threshold cycle (Ct).
Electrophysiological recordings.
Mice were decapitated under deep isoflurane anesthesia. The brain was quickly removed and immersed in ice-cold preparation solution of the following composition (in mm): NaCl 60, sucrose 100, KCl 2.5, CaCl2 1, MgCl2 5, NaH2PO4 1.25, d-glucose 20, NaHCO3 26 (pH 7.4 when saturated with 5% CO2/95% O2). Depending on the experiment, either 300- or 400-μm-thick horizontal brain slices containing the temporal part of the hippocampus were prepared with a vibratome (MicromHM650 V, Thermo Scientific). After warming the slices to 35°C in preparation solution for 20 min, slices were kept until recording at room temperature in ACSF of the following composition (in mm): NaCl 125, KCl3, CaCl22, MgCl22, NaH2PO4 1.25, d-glucose 15, NaHCO3 26 (pH 7.4 when saturated with 5% CO2/95% O2).
To assess paired-pulse facilitation of synaptic transmission, evoked field potentials were recorded in the CA1 region of 400-μm-thick hippocampal slices. Those were placed in an interface-type chamber at 33 ± 1°C and constantly superfused with ACSF at a flow rate of 2 ml/min. Two ACSF-filled glass microelectrodes with tip resistance of 1–2 MΩ were positioned in stratum radiatum. Schaffer collaterals were stimulated by pairs of brief current pulses (100 μs) delivered by a stimulus isolation unit (A365; WPI) via one of the glass microelectrodes. AC-coupled, amplified (100×), and low-pass filtered (3 kHz) signals were recorded via the other glass microelectrode and digitized with an InstruTECH ITC-1800 data acquisition system (HEKA). Paired-pulse facilitation was quantified at different interstimulus intervals as the amplitude ratio of fEPSP2/fEPSP1. Experiments were controlled with AxoGraphX software (AxoGraph Scientific) run on a G4 PowerMac computer and data were analyzed using IGOR Pro software (WaveMetrics).
Miniature EPSCs and IPSCs (mEPSCs and mIPSCs, respectively) were recorded in whole-cell voltage-clamp from CA1 pyramidal neurons in 300-μm-thick hippocampal slices prepared from mice 21–26 d after SE. Cells were visualized using an Eclipse FN1 upright microscope equipped with infrared difference interference contrast optics and a water-immersion lens (×60, 1.0 NA; Nikon). Somatic whole-cell voltage-clamp recordings were made with an AxoPatch 200B amplifier (Molecular Devices). Data were sampled at 10 kHz and filtered at 1 kHz with a Digidata 1322A interface controlled by pClamp software (Molecular Devices). Electrode resistance in the bath ranged from 3 to 5 MΩ, and series resistance ranged from 8 to 27 MΩ. The internal solution contained the following (in mm): cesiummethanesulfonate 110, tetraethylammonium chloride 10, 4-(2-hydroxyethyl)-1-piperazineethanesulfonic acid 10, ethylenglycole-bis(2-aminoethylether)-N,N,N′,N′-tetraacetic acid 11, CaCl2 2, Mg-ATP 2 (pH adjusted to 7.2 with CsOH, 290 mOsmol). The extracellular ACSF was identical to that used for slice storage and field potential recording (32°C). Holding potential was corrected offline for a liquid junction potential of 10 mV.
Electrophysiological analysis.
Offline detection and analysis of mEPSCs and mIPSCs was performed with a custom routine programmed in IGOR Pro. Detection of mEPSC events was performed by calculating the first derivative of current traces and selecting events for which the first derivative was larger than 5× the standard deviation of the current recording. Events were accepted for further analysis if their amplitude exceeded 5× the standard deviation of the pre-event baseline (3 ms). Furthermore, the time constant with which events decayed assessed with a monoexponential fit had to be within a range of 5 to 15 ms. mIPSCs were detected with two adjacent moving windows (0.5 ms duration each), with difference threshold between the mean current amplitudes in the two windows set to 5 pA. All detected postsynaptic currents were assessed by visual inspection and events due to spurious noise were rejected manually.
Statistics.
The χ2 test was used for statistical assessment of phenotypic differences between strains. Group comparisons were performed using the unpaired Student's t test or a Mann–Whitney U test. Comparisons between more than two groups were performed with a two-way ANOVA followed by Bonferroni's posttest where appropriate. The values were considered significantly different when p < 0.05. Results were expressed as mean ± SEM.
Results
Altered short-term plasticity in adult RIM1α−/− mice
Analyses of cultured hippocampal neurons and acute slices prepared from juvenile (3–8 weeks old) mice deficient for RIM1α have revealed alterations in basic synaptic transmission, e.g., a reduction in release probability and in certain forms of short- and long-term synaptic plasticity, whereas deletion of RIM2α alone did not result in any changes (Kaeser and Südhof, 2005; Mittelstaedt et al., 2010). To test whether this phenotype is affected by the maturation of the synaptic network, we measured paired-pulse facilitation (PPF) in the CA1 region of the hippocampus in acute slices from brains of adult mice (3–4 months old). RIM1α-deficient hippocampal slices showed an increase in PPF (fEPSP2/fEPSP1) compared with wild-type littermate controls (Fig. 1A, right, n = 5 for each group). Representative PPF signal in both strains is shown in Figure 1A, left. This finding indicates that release probability is reduced, similar to previous finding in younger animals.
Figure 1.

Adult RIM1α−/− mice exhibit altered short-term plasticity but no abnormalities in basal or pathophysiological electrographic activity. A, Adult RIM1α−/− mice show an increase in PPF in the CA1 region of the hippocampus. Facilitation was assessed by dividing the magnitude of the second of two closely spaced EPSPs by the first EPSP (n = 5 for each group, **p < 0.01, Mann–Whitney U test). B, No differences were observed in baseline EEG recordings between RIM1α+/+ (n = 6) and RIM1α−/− (n = 5) mice regarding the relative amplitude strength (Student's t test: alpha band, p = 0.66; beta band, p = 0.10; gamma band, p = 0.44; delta band, p = 0.31; theta band, p = 0.38). C, EEG recordings before and during pilocarpine-induced SE were subjected to Fourier transformation and the power in different frequency bands was analyzed in RIM1α+/+ and RIM1α−/− mice (left and right, respectively; animals identical to those shown in D). Representative analyses of band power in the alpha band are shown. The zero time point corresponds to the time of pilocarpine injection. Asterisks mark isolated behavioral seizures (at least stage III; see Materials and Methods) before animals entered continuous SE (see Materials and Methods). Dots mark the time points of the EEG recordings shown in D. Diazepam was administered to terminate SE, as indicated. D, Representative EEG recordings 5 min after pilocarpine application (when no signs of seizures are observed) and 20 and 40 min after the start of SE for one representative RIM1α+/+ and RIM1α−/− mouse. E, The intensity of electrographic activity during SE was quantified as the area under the band power curve for each frequency band from the initiation of continuous electrographic seizure activity until the time point of diazepam injection. The resultant values were normalized to the area under the band power curve obtained from baseline EEG recordings of identical duration obtained 24 h before SE. Compared to basal cortical EEG significant changes during SE were found in the delta, alpha, and beta frequency bands with respect to the relative increase. However, no difference between RIM1α+/+ and RIM1α−/− mice was detected by analyzing EEG power in different frequency bands. AU, Arbitrary units. Error bars indicate SEM.
We then examined whether RIM1α-deficient mice show signs of altered neuronal excitability. To this end, we implanted electrodes for telemetric EEG recording and obtained a prolonged period of baseline cortical EEG recording (representative EEG: baseline EEG 5 min after pilocarpine injection and during SE; Fig. 1D, left). We could not observe any signs of hyperexcitability or spontaneous seizure activity in these animals. Furthermore, no differences were detected in baseline EEG recordings between RIM1α+/+ and RIM1α−/− mice regarding the relative amplitude strength (Student's t test: alpha band, p = 0.66; beta band, p = 0.10; gamma band, p = 0.44; delta band, p = 0.31, theta band, p = 0.38; Fig. 1B). These results indicate that despite the marked disturbance in synaptic release dynamics, the excitability of the neuronal network as a whole is not strongly affected.
Acute response of RIM1α−/− mice to pilocarpine-induced status epilepticus
We next asked how RIM1α+/+ and RIM1α−/− mice respond in vivo to an episode of strong electrical activity. Therefore, we subjected RIM1α-deficient mice and wild-type littermates to SE induced by systemic administration of the muscarinic agonist pilocarpine. To test whether the severity of pilocarpine-induced SE was similar in RIM1α+/+ and RIM1α−/− mice, we implanted electrodes for telemetric recording at least 1 week before SE was induced and examined the EEG changes after pilocarpine injection (for a representative EEG recording of a RIM1α+/+ and a RIM1α−/− mouse before and during SE, see Fig. 1D). Approximately 40 min after injection, mice from both groups experienced SE, defined as a period of continuous tonic–clonic seizures without individual separable seizure events. SE was characterized by an increase in the band power in the alpha range, shown in representative RIM1α+/+ and RIM1α−/− mice for the band power in the alpha range (Fig. 1C, time point zero corresponds to the time of pilocarpine injection, stage III/IV seizures are marked with asterisks, and onset of SE is indicated by arrows; representative EEG examples shown in Fig. 1D taken at the time points indicated by dots in Fig. 1C). Significant changes in electrographic activity after SE were detected in the alpha, beta, and delta frequency bands (Fig. 1E). However, there was no significant difference with respect to the relative change in band power of cortical EEG during SE between both strains. In addition, we could find no differences between RIM1α−/− mice and littermate controls in the duration of SE, quantified as the time during which band power was increased to >10% of maximal values (e.g., alpha band RIM1α+/+ 42.1 min ± 2.9, RIM1α−/− 48.5 ± 2.8, Student's t test p = 0.4; data not shown).
Because RIM1α and RIM2α exhibit a complex pattern of redundancy, depending on the type of synapse being analyzed, and because RIM2α is strongly expressed in the dentate gyrus (Schoch et al., 2006), we also included RIM2α−/− mice in our subsequent analyses. As a further test for the susceptibility of the α-RIM-deficient mice to pilocarpine-induced seizures, we examined the response of the animals after pilocarpine injection. To this end, the mice were either categorized as sham without seizures, sham with at least one stage III seizure, died before reaching SE, experienced SE, or died during SE (Fig. 2A,B). The percentage of animals experiencing SE was similar between the respective RIM1α and RIM2α wild-type and knock-out animals. However, we observed differences with regard to mortality. Whereas no RIM1α−/− mice died before reaching SE, the mortality during SE was slightly increased in RIM1α−/− (Fig. 2A). Also the RIM2α−/− animals exhibited a significantly lower mortality before reaching SE and an increased mortality during SE (Fig. 2B). Together, compared with their wild-type littermates, both RIM1α−/− and RIM2α−/− show a significantly different response to pilocarpine-induced seizures (RIM1α+/+, n = 81; RIM1α−/−, n = 54; χ2 test, p < 0.001; RIM2α+/+, n = 33; RIM2α−/−, n = 34; χ2 test, p < 0.001).
Figure 2.

Susceptibility to pilocarpine-induced seizures in RIM1α−/− and RIM2α−/− animals. A, B, Behavioral classification of the mice after the injection of pilocarpine until the end of SE. Animals were categorized either as sham without seizures, sham with at least one stage III seizure, or SE (animals experiencing SE). Furthermore, mortality between the injection of pilocarpine and SE (died before SE) and during SE was quantified. The group of animals experiencing SE was similar in both RIM1α and RIM2α groups. However, both RIM1α−/− and RIM2α−/− showed less mortality in the acute phase but an increase during SE. Distribution of the different genotypes between the five groups was analyzed using the χ2 test. This analysis revealed a significant difference in the response to pilocarpine-induced seizures in both groups (RIM1α+/+, n = 81; RIM1α−/−, n = 54; RIM2α+/+, n = 33; RIM2α−/−, n = 34; ***p < 0.001, χ2 test). C, The latency to generalized seizure onset, defined as the first seizure, was significantly shorter in RIM1α−/− compared with RIM1α+/+ mice (26 ± 3 min in RIM1α−/− vs 33 ± 2 min in RIM1α+/+; *p < 0.05, Mann–Whitney U test). D, In contrast, no significant changes were observed regarding seizure onset in RIM2α−/− mice (31 ± 2 min in RIM2α−/− vs 32 ± 3 min in RIM2α+/+). C, D, Both strains did not show differences in the latency to the onset of status epilepticus. Error bars indicate mean ± SEM.
Next, we examined several parameters relevant to the acute phase using only the data of the group that experienced and survived SE. Whereas the latency to generalized seizure onset was significantly shorter in RIM1α−/− compared with RIM1α+/+ mice (Fig. 2C, left), RIM2α−/− mice did not exhibit an altered latency to the first seizure after pilocarpine injection (Fig. 2D, left). Neither RIM1α−/− nor RIM2α−/− animals showed significant changes regarding the latency to the start of SE (Fig. 2C,D, right) or in seizure frequency and severity during the acute stage (Table 2).
Table 2.
Seizure severity and frequency during the acute stage after pilocarpine injection
| Genotype | Seizure severity |
Seizure frequency (mean ± SD) | |
|---|---|---|---|
| Stage III | Stage IV | ||
| RIM1α+/+ (n = 29) | 25% | 75% | 3.1 ± 0.1 |
| RIM1α−/− (n = 23) | 31% | 69% | 3.2 ± 0.1 |
| RIM2α+/+ (n = 21) | 43% | 57% | 3.1 ± 0.2 |
| RIM2α−/− (n = 21) | 44% | 56% | 3.9 ± 0.3 |
In summary, these results indicate that the intensity of electrographic seizure activity experienced after pilocarpine injection is not affected by the ablation of RIM1α or RIM2α. However, in the absence of RIM1α, the susceptibility to the onset of the first pilocarpine-induced seizure is reduced.
Development of chronic seizures is strongly increased in RIM1α−/− mice
Having determined the immediate response of the network to a convulsant, we asked whether the long-term consequences of an episode of SE are altered by deletion of RIM1α. To determine the frequency and severity of spontaneous epileptic seizures after SE, we performed long-term telemetric EEG/video-monitoring in wild-type (RIM1α+/+/RIM2α+/+), RIM1α−/−, and RIM2α−/− mice 9 to 28 d after SE (for representative examples of EEG from control animals before SE and interictal EEG in SE-experienced animals, see Fig. 3A).
Figure 3.

Development of chronic seizures is strongly increased in RIM1α−/− mice. A, Representative interictal EEG recordings from control and SE-experienced RIM1α+/+ and RIM1α−/− mice, as indicated. Recordings were >11 d after treatment. B, Representative EEG recordings during stage III (top traces) and stage IV seizures (bottom traces) in RIM1α+/+ and RIM1α−/− mice. C, Left, Development of spontaneous seizure activity after SE in RIM1α+/+ versus RIM1α−/− mice. Seizures were quantified in intervals of 3 consecutive days, and the average seizure frequency per day is presented as “average seizures/day.” The frequency of spontaneous seizures is substantially increased in RIM1α−/− versus RIM1α+/+ mice (*p < 0.05, **p < 0.01, ***p < 0.001, Mann–Whitney U test). Seizures were more severe in SE-experienced RIM1α+/+ mice, with a higher fraction of generalized stage IV seizures. C, Right, ***p < 0.001, χ2 test. D, RIM1α−/− revealed shorter stage III seizures in the chronic period, whereas stage IV seizures did not differ regarding seizure duration (*p < 0.05, Student's t test). No significant differences with respect to seizure variance (right) were found between RIM1α−/− and RIM1α+/+ mice. E, In contrast, no significant differences regarding frequency (left) or severity (right) were found in RIM2α−/− mice compared with RIM2α+/+ mice after SE. In C–E, n = 6 for RIM1α−/− and n = 14 for RIM1α+/+; n = 9 for RIM2α−/− and n = 8 for RIM2α+/+. Error bars indicate mean ± SEM.
We observed spontaneous seizures in all SE-experienced RIM1α+/+ mice (n = 14) and RIM1α−/− mice (n = 6; for representative EEG recordings of seizures in all analyzed genotypes, see Fig. 3B). However, spontaneous stage III/IV seizures were much more frequent in RIM1α−/− mice compared with RIM1α+/+ (Fig. 3C, left). When considering spontaneous stage III and IV seizures separately, the ratio was shifted toward stage III seizures in SE-experienced RIM1α−/− mice (group comparison χ2 test p < 0.001; Fig. 3C, right). The duration of individual seizure episodes (Fig. 3D, left) was significantly reduced in chronic stage III seizures, but not different in stage IV seizures. The average amplitude of the EEG activity during the seizures (Fig. 3D, right), was not significantly different when comparing SE-experienced RIM1α+/+ and RIM1α−/− mice. Spontaneous seizures also occurred in all SE-experienced RIM2α−/− mice (n = 9) and wild-type littermates (n = 8). However, in accordance with the lack of a synaptic phenotype in the RIM2α−/− mice, the properties of the individual seizure episodes and the development of chronic epilepsy was unaltered in the RIM2α−/− mice compared with RIM2α+/+ littermates (Fig. 3E). Thus, deletion of RIM1α, but not RIM2α, resulted in a dramatic increase in the number of chronic seizures, but the severity of the seizures was lower.
Following SE, RIM1α-deficient mice exhibit a distinct neuropathological structural reorganization corresponding to endfolium sclerosis
Epileptogenesis goes along with fundamental neuropathological alterations in the hippocampal formation, in particular segmental neuronal cell loss and axonal reorganization. The changes observed in animal models after induced SE resemble those described in human TLE with mesial temporal sclerosis (Wyler et al., 1992; Blümcke et al., 1999; Wieser, 2004). In native conditions, genetic deletion of either RIM1α−/− or RIM2α−/− did not reveal obvious neuropathological changes in the hippocampal formation (for representative hippocampal slices of RIM1α mice, see Fig. 4C, left; RIM2α data not shown). To address structural alterations after induction of SE, we performed a detailed neuropathological analysis at the stage of chronic recurrent seizure activity.
Figure 4.
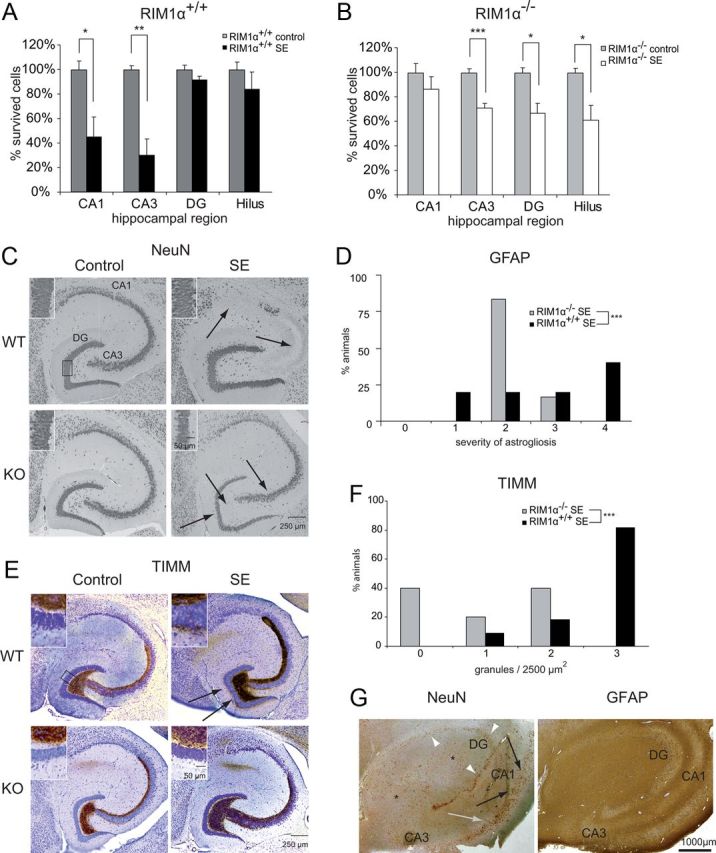
RIM1α−/− mice show an endfolium sclerosis as well as a decrease in astrogliosis and mossy fiber sprouting in the chronic period. A, RIM1α−/− mice revealed substantial neuronal cell loss restricted to the areas CA3 (RIM1α−/− control, 25.6 cells/10,000 μm2; RIM1α−/− after SE, 18.3 cells/10,000 μm2; **p < 0.01, Student's t test), dentate gyrus (RIM1α−/− control, 98.7 cells/10,000 μm2; RIM1α−/− after SE, 65.9 cells/10,000 μm2; *p < 0.05, Student's t test) and the hilar region of the hippocampus (RIM1α−/− control, 3.1 cells/10,000 μm2; RIM1α−/− after SE, 1.9 cells/10,000 μm2; *p < 0.05, Student's t test), which resembles a lesion of so-called endfolium sclerosis. B, In contrast, RIM1α+/+ showed a classical hippocampal sclerosis, which is characterized by pronounced segmental neuronal damage in CA3 (RIM1α+/+ control, 24.1 cells/10,000 μm2; RIM1α+/+ after SE, 7.2 cells/10,000 μm2; *p < 0.05, Student's t test) and CA1 (RIM1α+/+ control, 38.4 cells/10,000 μm2; RIM1α+/+ after SE, 17.3 cells/10,000 μm2; ***p < 0.01, Student's t test), which reflects the classical pattern of Ammon's horn aclerosis. C, Representative hippocampal sections stained with an antibody directed against NeuN. Note the specific neuronal cell loss in areas CA3, DG, and hilus after SE in RIM1α−/− mice (endfolium sclerosis) but not a classical Ammon's horn sclerosis in RIM1α+/+ mice (CA1 and CA3). Arrows point to regions with cell loss, which is quantified in Figure 4, A and B. RIM1α deficiency causes granule cell dispersion in the dentate gyrus after SE (bottom right, inset), which is absent in corresponding littermate controls (top right, inset). D, Assessment of the severity of astrogliosis with a semiquantitative measure in animals after SE. RIM1α−/− animals revealed less severe reactive astrogliosis (χ2 test, ***p < 0.001). E, Mossy fiber sprouting is visualized by Timm staining. SE-experienced RIM1α+/+ mice display mossy fiber sprouting with an increased density of Timm-stained terminals in the supragranular layer after SE (top right), whereas control mice did not (top left). In contrast, SE-induced mossy fiber sprouting is virtually absent in SE-experienced RIM1α−/− mice (bottom right). F, Assessment of the severity of mossy fiber sprouting with a semiquantitative measure in animals after SE. Mossy fiber sprouting is strongly reduced in RIM1α−/− mice (***p < 0.001, χ2 test). G, Representative hippocampal sections from a patient with TLE with the pattern of endfolium sclerosis stained with antibodies against NeuN (left) and GFAP (right). Asterisks depict the areas of the hilar region/CA4 and CA3 that show the characteristic Ammon's horn sclerosis-associated neuronal cell loss. A significant reduction of granule cells is also present in the dentate gyrus (white arrowheads). However, significant neuronal cell loss is not present in areas CA2 (gray arrow) and CA1 (black arrows). This neuronal cell loss pattern fulfils the criteria of endfolium sclerosis. Correspondingly, the representative GFAP immunohistochemistry demonstrates a pronounced fibrillary astrogliosis in the hilar region/CA4 and CA3 (asterisks), whereas more subtle combined fibrillary and cellular astrogliosis is present in the other hippocampal subfields. In A and B, n = 5 for all groups. Error bars indicate mean ± SEM. In C, n = 10 for RIM1α+/+ control and n = 11 for RIM1α+/+ SE; n = 6 for RIM1α−/− control and n = 5 for RIM1α−/− SE.
RIM1α+/+ mice showed a pronounced segmental neuronal damage of 70% in the CA3 after SE (Student's t test, p < 0.05) and of 55% in CA1 region (Student's t test, p < 0.01; Fig. 4A), while the cell numbers in the dentate gyrus (Student's t test, p = 0.16) and the hilar regions were not significantly altered (Student's t test, p = 0.39). This pattern generally reflects the classical hippocampal sclerosis of type Ia according to Blümcke and colleagues (2007) (both RIM1α+/+ groups, n = 5; Fig. 4C, top right). In contrast, RIM1α−/− mice revealed substantial neuronal cell loss in the CA3 (29%; Student's t test, p < 0.001) as well as the hilar region (39%; Student's t test, p < 0.05), but not in the CA1 area (Student's t test, p = 0.38; Fig. 4B, Fig. 4C, bottom right). RIM1α deficiency causes granule cell dispersion and cell loss of 33% in the dentate gyrus after SE (Student's t test, p < 0.05; RIM1α−/− control, n = 5; RIM1α−/− SE, n = 6; Fig. 4C, bottom right, inset). These neuropathological alterations resemble the pattern of endfolium sclerosis/mesial temporal sclerosis type 3, as observed in biopsy specimens of patients with pharmacoresistant TLE (Fig. 4G, left) (Blümcke et al., 2007). To the best of our knowledge, the hippocampal lesion pattern of endfolium sclerosis has not been described in animal models of epilepsy before. This strain of mice apparently has a particularly low resistance against seizure-induced neuronal degeneration in the dentate gyrus and hilar area. Our data suggest RIM1α represents a factor that protects neurons of the hilar areas as well as dentate gyrus granule cells from degeneration.
A second neuropathological hallmark of Ammon's horn sclerosis is reactive astrogliosis, which is also seen in hippocampi from human with TLE (Fig. 4G, right). After immunolabelings with the glial-specific marker protein GFAP, animals were grouped into categories depending on their staining intensity in the whole hippocampal formation (stratum moleculare, radiatum, oriens, and hilar region). Whereas almost 50% of wild-type animals after SE showed strong astrogliosis (category 4), >75% of RIM1α−/− mice fell into the group of mild astrogliosis (category 2) and none were labeled as category 4 (χ2 test, p < 0.001, same animals as for cell count were used; Fig. 4D), indicating that RIM1α−/− animals exhibit a less severe reactive astrogliosis.
Mossy fiber sprouting is substantially attenuated in RIM1α−/− mice
A major phenomenon of structural reorganization in experimental and human TLE is the sprouting of mossy fibers into the supragranular layer of the dentate gyrus monitored by Timm staining (Houser, 1992; Cavazos et al., 2003). A prominent staining was seen 28 d after SE in RIM1α+/+ animals (Fig. 4E, top right). In contrast, mossy fiber sprouting after SE was strongly reduced in RIM1α−/− compared with RIM1α+/+ mice (Fig. 4E, bottom right). A semiquantitative analysis of Timm granules in the inner molecular layer according to a quantification system (Becker et al., 2008) confirmed these results (RIM1α+/+ control, n = 10; RIM1α+/+ SE, n = 11; RIM1α−/− control, n = 6; RIM1α−/− SE, n = 5; Fig. 4F). We observed a significant increase in supragranular Timm staining in RIM1α+/+ mice at later stages (χ2 test, p < 0.001; Fig. 4F, black bars), whereas this increase was strongly reduced in RIM1α−/− mice (Fig. 4F, gray bars). In all control animals, the molecular layer of the dentate gyrus was completely devoid of Timm staining. These results show that mossy fibers deficient for RIM1α exhibit less SE-induced sprouting.
SE-induced changes of presynaptic function in RIM1α−/− versus RIM1α+/+ mice
We had confirmed an increased PPF indicative of decreased release probability in RIM1α−/− mice (Fig. 1A) (Schoch et al., 2002; Calakos et al., 2004). We now examined how this form of presynaptic short-term plasticity is altered by SE in both groups of mice. We found that SE caused a significant increase in PPF over a range of interstimulus intervals in wild-type mice (one-way ANOVA with Dunnett's posttest, p < 0.05; Fig. 5A). In contrast, in RIM1α−/− mice, no further increase in PPF after SE was observed (Fig. 5B). This may indicate that RIM1α+/+ mice react to an episode of SE with a homeostatic reduction in synaptic release, while RIM1α−/− mice are not capable of further decreasing release probability, thus lacking such post-SE homeostasis.
Figure 5.

SE-induced functional changes in RIM1α−/− versus RIM1α+/+ mice. A, B, Analysis of PPF at Schaffer collateral CA1 pyramidal neuron synapses. Representative recordings of field EPSPs with an interpulse interval of 40 ms are shown above the graphs. PPF was quantified as the ratio of field EPSP amplitudes (EPSP2/EPSP1) and plotted against the interstimulus interval. A significant increase in PPF was observed after SE in RIM1α+/+ (*p < 0.05, one-way ANOVA with Dunnett's posttest; A) but not in RIM1α−/− animals (B). n = 5 for all groups. C–G, Properties of mEPSCs. C, Representative traces of mEPSCs in CA1 pyramidal neurons from RIM1α+/+ and RIM1α−/− mice with and without previous SE (as indicated on top). RIM1α+/+ control and SE, n = 8; RIM1α−/− control, n = 9; and SE, n = 10. D, Analysis of mEPSC frequency. A significant effect of genotype, but not of previous SE, was observed (p = 0.0004 and p = 0.42, respectively; two-way ANOVA). *Significance in Bonferroni posttest, p < 0.05. E–G, Analysis of mEPSC amplitude. Both cumulative amplitude distribution histograms (E, F) and mean mEPSC amplitude ± SEM (G) are shown. For mean mEPSC amplitudes, a significant effect of previous SE, but not genotype, was observed (p = 0.036 and p = 0.75, respectively; two-way ANOVA). Bonferroni posttests were not significant. H–L, Properties of mIPSCs. H, Representative traces of mIPSCs in CA1 pyramidal neurons from RIM1α+/+ and RIM1α−/− mice with and without previous SE (as indicated on top). Numbers for the different groups are as for mEPSC recordings. I, Analysis of mEPSC frequency. A significant effect of genotype, but not of previous SE, was observed (p = 0.0021 and p = 0.4, respectively; two-way ANOVA). *Significance in Bonferroni posttest, p < 0.05. J–L, Analysis of mIPSC amplitude. Both cumulative amplitude distribution histograms (J, K) and mean mIPSC amplitude ± SEM (L) are shown. For mean mIPSC amplitudes, a significant effect of previous SE, but not genotype, was observed (p = 0.0087 and p = 0.087, respectively; two-way ANOVA). Bonferroni posttests were not significant.
We next examined the properties of mEPSCs (see Materials and Methods, above). Representative mEPSC traces are shown in Figure 5C. The frequency of mEPSCs is determined by the number and release probability of excitatory synapses. SE caused no change of mEPSC frequency in RIM1α+/+ mice (Fig. 5D), possibly because of an aggregate effect of synaptic sprouting and synaptogenesis (Fig. 4) and decreased release probability. Likewise, no changes in mEPSC frequency were observed in RIM1α−/− mice after SE (Fig. 5D), in which release probability was unchanged and synaptic sprouting was severely reduced. A two-way ANOVA with Bonferroni posttest confirmed a lack of effect of previous SE, but revealed a significant effect of genotype on mEPSC frequency (p = 0.0004; p < 0.05 in Bonferroni posttest; Fig. 5D). An analysis of mean mEPSC amplitude revealed small but significant effects of previous SE (p < 0.036), but not of genotype, without significant individual group differences (Fig. 5E–G). A similar picture was observed when mIPSCs were examined (for representative mIPSC traces shown, see Fig. 5H). Significant effects of genotype were observed on mIPSC frequency (p = 0.0021; p < 0.05 in Bonferroni posttest; Fig. 5I) and significant effects of previous SE on mIPSC amplitude (p = 0.0087, two-way ANOVA; Fig. 5J–L).
SE-induced alterations in the expression level of RIM1α at the chronic epileptic stage
The observed increase in paired-pulse facilitation in the chronic phase after SE could be the consequence of a decrease in RIM1α levels. To address this hypothesis, we subjected mice to pilocarpine-induced SE and microdissected the hippocampal DG, CA3, and CA1 subregions at three timepoints after SE: the acute phase (6 h after SE), the beginning of the latency stage (24 h after SE), and the chronic phase (28 d after SE). We quantified mRNA levels of RIM1α, RIM2α, and RIM1β by quantitative real-time RT-PCR with synaptophysin as a reference gene to account for neuronal cell loss (n = 5 in all groups, n = 4 chronic controls). Whereas we did not detect any changes in RIM1α mRNA expression levels early after SE (6 and 24 h; Fig. 6A), we observed a significant reduction of mRNA expression in the DG (25%, Mann–Whitney U test, p < 0.05) and CA1 (30%, Mann–Whitney U test, p < 0.05) regions but not in CA3 28 d after SE. RIM2α was expressed throughout the hippocampus at much lower levels than RIM1α. After SE, the expression levels of RIM2α were not altered except for 24 h after SE in the CA3 region, where a 1.4-fold increase was measured (Mann–Whitney U test, p < 0.01; Fig. 6B). RIM1β mRNA levels were very low in control and in SE-experienced mice and did not exhibit any SE-induced changes (data not shown). These results reveal a subregion-specific reduced expression of RIM1α in the chronic period after pilocarpine-induced SE.
Figure 6.

SE-induced changes in the expression level of RIM1α in the chronic phase. A, B, Expression levels of the α-RIM subunits after pilocarpine-induced SE was examined by quantitative real-time RT-PCR using the synaptic vesicle protein synaptophysin as reference gene (n = 5 for all groups; chronic control, n = 4). Hippocampal subregions CA1, CA3, and DG were microdissected 6 h, 24 h, and 28 d after SE. A, A significant decrease in RIM1α mRNA levels was observed on day 28 after SE in DG and CA1 region (*p < 0.05, Mann–Whitney U test). B, An upregulation of RIM2α was determined 24 h after SE in the CA3 region (**p < 0.05, Mann–Whitney U test). Error bars indicate mean ± SEM.
Discussion
Homeostatic synaptic plasticity is an intriguing phenomenon that has been mainly observed in in vitro systems. Conceptually, it is thought to be a prerequisite for maintaining the activity of a neuronal network within a physiological range. In many systems, homeostatic adaptations to long-term modifications of neuronal activity can be achieved by modulation of both presynaptic and postsynaptic functions (Vitureira et al., 2012). For example, presynaptic terminals in networks of cultured primary neurons responds to strong depolarization or ongoing neuronal activity with a form of adaptive plasticity called persistent presynaptic silencing/muting (Jiang et al., 2010). However, unequivocal evidence for in vivo homeostatic plasticity is still lacking.
At the molecular level, the presynaptic active zone protein RIM1α has emerged as one downstream target of presynaptic silencing and as a central player in multiple forms of presynaptically mediated forms of plasticity (for review, see Mittelstaedt et al., 2010). Here, we have examined the in vivo effects of intense neuronal activity induced by application of pilocarpine on a Rim1α-deficient neuronal network with compromised synaptic vesicle priming and deficits in presynaptically mediated forms of plasticity. The results of our study reveal that even though the ablation of RIM1α does not cause changes in basal EEG, RIM1α deficiency results in a dramatically increased frequency of spontaneous recurrent seizures in the chronic phase after SE. This development of a hyperexcitable network is accompanied by neuropathological alterations that resemble human endfolium sclerosis and, surprisingly, a decrease in mossy fiber sprouting and astrogliosis. In wild-type mice, SE induces a significant subregion-specific downregulation of RIM1α mRNA in the dentate gyrus and the CA1 region.
The markedly increased frequency of seizures in RIM1α-deficient mice is consistent with the loss of a homeostatic dampening mechanism that is normally recruited during epileptogenesis. Such an effect has been observed for other genetically altered mouse lines that exhibit more seizures in the chronic phase, e.g., mice overexpressing mGluR1, but compared with the dramatic effects observed in the present study, the increase is rather modest (Pitsch et al., 2007). In our case, the functional results have revealed that paired-pulse facilitation is increased after SE in wild-type mice, consistent with a homeostatic reduction in release probability and similar to the increase in PPF observed in RIM1α−/− mice (Schoch et al., 2002). Interestingly, SE cannot induce a further increase in PPF in RIM1α−/− mice. SE-induced changes have also been observed at other hippocampal synapses. At the mossy fiber-CA3 synapse, kainate-induced SE results in marked loss of paired-pulse facilitation and long-term potentiation (LTP) and a significant increase in the size of the readily releasable pool at excitatory synapses in the chronic phase (Goussakov et al., 2000). Intriguingly, the status-induced changes on mossy fiber LTP occur downstream of protein kinase A (PKA) (Goussakov et al., 2000) and RIM1α has been shown to be both a direct substrate of PKA and required for PKA-mediated forms of presynaptic long-term potentiation (Castillo et al., 2002; Lonart et al., 2003; Fourcaudot et al., 2008). Thus, RIM1α may be a key to different adaptive changes within the hippocampal network.
We detected a significant reduction in the mRNA levels of RIM1α specifically in the dentate gyrus and the CA1 region during the chronic phase after SE in wild-type mice. This finding could support the idea that pathologically increased activity may cause homeostatic reductions in glutamate release via reduction of RIM1α levels (Crawford and Mennerick, 2012), as for example shown in primary neuronal cultures after depolarization with high concentrations of potassium chloride (Jiang et al., 2010). In accordance with the SE-induced change in PPF observed in wild-type mice, this finding suggests that in response to SE, specific regions in the wild-type brain react with adaptive responses that cannot be engaged in the RIM1α knock-out brain. Interestingly, both regions with reduced RIM1α mRNA levels, the DG and the CA1 region, exhibit aberrant neuronal connectivity in the chronic phase after pilocarpine treatment, in particular retrograde sprouting of the mossy fibers, CA1 neurons into area CA3, subicular neurons into area CA1, and increased connectivity between CA1 neurons and between the subicular and hilar cells (Lehmann et al., 2001).
Surprisingly, chronic EEG recordings revealed that the acute pilocarpine-induced SE was largely not different when comparing RIM1α−/− and wild-type mice, even though there are manifold changes in the properties of different synapses. These results suggest that a network with a globally reduced synaptic vesicle priming rate does not show in itself an altered excitability, most likely due to counteracting effects in different elements of the neuronal network. Thus, our studies of RIM1α yield a complex picture, in which the loss of RIM1α is compensated within the network but leaves it incapable of mediating adaptive changes to strong neuronal activity. As a consequence, in RIM1α−/− mice, a markedly increased propensity to generate seizures is observed.
How could changes in RIM1α levels contribute to presynaptic homeostasis? RIM1α has been shown to directly regulate synaptic vesicle priming by activating Munc13-1 and to control presynaptic Ca2+-channel density and Ca2+-channel synaptic vesicle coupling (Deng et al., 2011; Han et al., 2011; Kaeser et al., 2011). In cell culture, a period of increased activity has been shown to result in presynaptic silencing caused by the targeted degradation of the synaptic vesicle priming proteins RIM1α and Munc13-1 (Jiang et al., 2010). One open question in this regard was whether in vivo depolarizing insults can induce presynaptic silencing rapidly and strongly enough to provide endogenous neuroprotection. The observation that SE is unchanged could be explained if wild-type synapses are presynaptically silenced in response to pilocarpine to the same degree as the constitutively silenced RIM1α-deficient synapses. However, the inability to further decrease glutamate release in response to increased activity in the RIM1α-deficient neuronal network might result in the shortened latency to the onset of the first seizure.
Unexpectedly, the very large increase in seizure frequency observed in RIM1α−/− mice does not result in more severe neuropathological alterations but rather manifests itself in a pattern resembling endfolium sclerosis in human TLE patients, which has not been previously described in genetic mouse models of epilepsy. Endfolium sclerosis is characterized by restricted hilar neuronal cell loss and granule cell dispersion in the DG but lack of substantial neuronal degeneration in other hippocampal subfields (Margerison and Corsellis, 1966; Thom et al., 2005). Atypical patterns of mesial temporal sclerosis have been discussed as the correlate of potentially variable rates of hippocampal neuronal maturation, which reflect individual vulnerability and cell-protective mechanisms in different hippocampal subfields (Van Paesschen et al., 1997; Blümcke et al., 2007). Indeed, our present data suggest a region-specific role of presynaptic molecules, i.e., RIM1α−/−, in setting the vulnerability of specific hippocampal neurons for degeneration. Even though previous analyses of the structural organization of RIM1α-deficient brains did not reveal any overt alterations (Castillo et al., 2002; Schoch et al., 2002), we cannot exclude that the different patterns and the severity of structural changes observed in the chronic phase after SE in the RIM1α−/− hippocampus compared with wild-type controls may reflect an aberrant network connectivity in the RIM1α mutants that developed during ontogenesis. It could be hypothesized that in the constitutive RIM1α knock-out glutamate release is decreased in most neurons, as in situ hybridization experiments revealed a ubiquitous expression of RIM1α throughout the brain (Schoch et al., 2006). However, we did not detect a concomitant reduction in global excitability, suggesting that the system adapts to the constitutive lack of RIM1α. At the same time, a complete lack of RIM1α in constitutive knock-outs would entail a loss of the RIM1α-dependent homeostatic mechanism that would normally act to curtail hyperexcitability. This loss of adaptive potential in turn might explain why the strong pathophysiological stimulation induced by pilocarpine results in such a dramatic increase in seizure frequency. However, it was recently shown that region-specific deletion of RIM1 reproduces a subset of the behavioral abnormalities observed in the constitutive RIM1α−/− mice (Haws et al., 2012), indicating that these phenotypes are not the consequence of a widespread aberrant network but of the absence of RIM1α in a subset of neurons.
Recently, presynaptic proteins have emerged as potential antiepileptic drug targets, e.g., the synaptic vesicle protein SV2A as the high-affinity binding site for levetiracetam (Lynch et al., 2004). Like RIM1α, SV2A has been implied to be involved in the molecular mechanisms underlying both priming—by rendering primed synaptic vesicles competent for Ca2+-induced exocytosis (Chang and Südhof, 2009) and by enhancing release probability at quiescent synapses (Custer et al., 2006)—and presynaptic homeostatic plasticity as a target of miR-485 (Cohen et al., 2011). Blocking of miR-485 in turn reverses the homeostatic reduction in synaptic connectivity after incubation of neuronal cultures for 5 d with BiC/4-AP. Furthermore, mice deficient for SV2A exhibit spontaneous epileptic seizures (Crowder et al., 1999; Janz et al., 1999), as do knock-out mice for the synaptic vesicle protein synapsin (Li et al., 1995; Rosahl et al., 1995) and the active zone protein Bassoon (Altrock et al., 2003). In this respect, it will be critical to determine in detail how the presynaptic release machinery contributes to or is affected by the development of epileptogenesis.
Due to the multiple alterations in synaptic properties in the RIM1α−/− mice, it is currently difficult to attribute the proepileptic phenotype to a specific form of synaptic plasticity at a defined synapse. Rather, the observed phenotype could be the consequence of the concomitant failure of multiple forms of synaptic plasticity to be correctly induced. Further analyses using mice, in which RIM1α is selectively ablated in defined subsets of neurons, e.g., excitatory versus inhibitory, will be required to resolve these open questions.
Footnotes
This work was supported by grants from the Deutsche Forschungsgemeinschaft (EmmyNoether Program to S.S.; SFB/TR3 to H.B., S.S. and A.J.B.), the Bundesministerium fur Bildung und Forschung (NGFNplus to H.B., S.S., and A.J.B.; Unabhängige Forschergruppen in den Neurowissenschaften to S.S.), Neuron ERANET EpiNet (to H.B.), EuroEpinomics (to A.J.B.), Else Kröner Fresenius Foundation (to A.J.B.), German Israeli Foundation (to A.J.B.), and BONFOR (to S.S., H.B., and A.J.B.). We thank A. Alfter, S. Bauerkämper, M. Gerards, M. Reitze, S. Stellbogen, and E. Stüttgen for excellent technical assistance and K.M.J. van Loo for continuous support and critical discussions.
References
- Altrock WD, tom Dieck S, Sokolov M, Meyer AC, Sigler A, Brakebusch C, Fässler R, Richter K, Boeckers TM, Potschka H, Brandt C, Löscher W, Grimberg D, Dresbach T, Hempelmann A, Hassan H, Balschun D, Frey JU, Brandstätter JH, Garner CC, et al. Functional inactivation of a fraction of excitatory synapses in mice deficient for the active zone protein bassoon. Neuron. 2003;37:787–800. doi: 10.1016/s0896-6273(03)00088-6. [DOI] [PubMed] [Google Scholar]
- Bausch SB, He S, Petrova Y, Wang XM, McNamara JO. Plasticity of both excitatory and inhibitory synapses is associated with seizures induced by removal of chronic blockade of activity in cultured hippocampus. J Neurophysiol. 2006;96:2151–2167. doi: 10.1152/jn.00355.2006. [DOI] [PubMed] [Google Scholar]
- Becker AJ, Pitsch J, Sochivko D, Opitz T, Staniek M, Chen CC, Campbell KP, Schoch S, Yaari Y, Beck H. Transcriptional upregulation of Cav3.2 mediates epileptogenesis in the pilocarpine model of epilepsy. J Neurosci. 2008;28:13341–13353. doi: 10.1523/JNEUROSCI.1421-08.2008. [DOI] [PMC free article] [PubMed] [Google Scholar]
- Blümcke I, Beck H, Lie AA, Wiestler OD. Molecular neuropathology of human mesial temporal lobe epilepsy. Epilepsy Res. 1999;36:205–223. doi: 10.1016/s0920-1211(99)00052-2. [DOI] [PubMed] [Google Scholar]
- Blümcke I, Schewe JC, Normann S, Brüstle O, Schramm J, Elger CE, Wiestler OD. Increase of nestin-immunoreactive neural precursor cells in the dentate gyrus of pediatric patients with early-onset temporal lobe epilepsy. Hippocampus. 2001;11:311–321. doi: 10.1002/hipo.1045. [DOI] [PubMed] [Google Scholar]
- Blümcke I, Pauli E, Clusmann H, Schramm J, Becker A, Elger C, Merschhemke M, Meencke HJ, Lehmann T, von Deimling A, Scheiwe C, Zentner J, Volk B, Romstöck J, Stefan H, Hildebrandt M. A new clinico-pathological classification system for mesial temporal sclerosis. Acta Neuropathol. 2007;113:235–244. doi: 10.1007/s00401-006-0187-0. [DOI] [PMC free article] [PubMed] [Google Scholar]
- Branco T, Staras K, Darcy KJ, Goda Y. Local dendritic activity sets release probability at hippocampal synapses. Neuron. 2008;59:475–485. doi: 10.1016/j.neuron.2008.07.006. [DOI] [PMC free article] [PubMed] [Google Scholar]
- Calakos N, Schoch S, Südhof TC, Malenka RC. Multiple roles for the active zone protein RIM1alpha in late stages of neurotransmitter release. Neuron. 2004;42:889–896. doi: 10.1016/j.neuron.2004.05.014. [DOI] [PubMed] [Google Scholar]
- Castillo PE, Schoch S, Schmitz F, Südhof TC, Malenka RC. RIM1alpha is required for presynaptic long-term potentiation. Nature. 2002;415:327–330. doi: 10.1038/415327a. [DOI] [PubMed] [Google Scholar]
- Cavazos JE, Zhang P, Qazi R, Sutula TP. Ultrastructural features of sprouted mossy fiber synapses in kindled and kainic acid-treated rats. J Comp Neurol. 2003;458:272–292. doi: 10.1002/cne.10581. [DOI] [PubMed] [Google Scholar]
- Chang WP, Südhof TC. SV2 renders primed synaptic vesicles competent for Ca2+-induced exocytosis. J Neurosci. 2009;29:883–897. doi: 10.1523/JNEUROSCI.4521-08.2009. [DOI] [PMC free article] [PubMed] [Google Scholar]
- Chevaleyre V, Heifets BD, Kaeser PS, Südhof TC, Purpura DP, Castillo PE. Endocannabinoid-mediated long-term plasticity requires cAMP/PKA signaling and RIM1alpha. Neuron. 2007;54:801–812. doi: 10.1016/j.neuron.2007.05.020. [DOI] [PMC free article] [PubMed] [Google Scholar]
- Cohen JE, Lee PR, Chen S, Li W, Fields RD. MicroRNA regulation of homeostatic synaptic plasticity. Proc Natl Acad Sci U S A. 2011;108:11650–11655. doi: 10.1073/pnas.1017576108. [DOI] [PMC free article] [PubMed] [Google Scholar]
- Crawford DC, Mennerick S. Presynaptically silent synapses: dormancy and awakening of presynaptic vesicle release. Neuroscientist. 2012;18:216–223. doi: 10.1177/1073858411418525. [DOI] [PMC free article] [PubMed] [Google Scholar]
- Crowder KM, Gunther JM, Jones TA, Hale BD, Zhang HZ, Peterson MR, Scheller RH, Chavkin C, Bajjalieh SM. Abnormal neurotransmission in mice lacking synaptic vesicle protein 2A (SV2A) Proc Natl Acad Sci U S A. 1999;96:15268–15273. doi: 10.1073/pnas.96.26.15268. [DOI] [PMC free article] [PubMed] [Google Scholar]
- Custer KL, Austin NS, Sullivan JM, Bajjalieh SM. Synaptic vesicle protein 2 enhances release probability at quiescent synapses. J Neurosci. 2006;26:1303–1313. doi: 10.1523/JNEUROSCI.2699-05.2006. [DOI] [PMC free article] [PubMed] [Google Scholar]
- Deng L, Kaeser PS, Xu W, Südhof TC. RIM proteins activate vesicle priming by reversing autoinhibitory homodimerization of Munc13. Neuron. 2011;69:317–331. doi: 10.1016/j.neuron.2011.01.005. [DOI] [PMC free article] [PubMed] [Google Scholar]
- Fink L, Seeger W, Ermert L, Hänze J, Stahl U, Grimminger F, Kummer W, Bohle RM. Real-time quantitative RT-PCR after laser-assisted cell picking. Nat Med. 1998;4:1329–1333. doi: 10.1038/3327. [DOI] [PubMed] [Google Scholar]
- Fourcaudot E, Gambino F, Humeau Y, Casassus G, Shaban H, Poulain B, Lüthi A. cAMP/PKA signaling and RIM1alpha mediate presynaptic LTP in the lateral amygdala. Proc Natl Acad Sci U S A. 2008;105:15130–15135. doi: 10.1073/pnas.0806938105. [DOI] [PMC free article] [PubMed] [Google Scholar]
- Galvan CD, Hrachovy RA, Smith KL, Swann JW. Blockade of neuronal activity during hippocampal development produces a chronic focal epilepsy in the rat. J Neurosci. 2000;20:2904–2916. doi: 10.1523/JNEUROSCI.20-08-02904.2000. [DOI] [PMC free article] [PubMed] [Google Scholar]
- Goussakov IV, Fink K, Elger CE, Beck H. Metaplasticity of mossy fiber synaptic transmission involves altered release probability. J Neurosci. 2000;20:3434–3441. doi: 10.1523/JNEUROSCI.20-09-03434.2000. [DOI] [PMC free article] [PubMed] [Google Scholar]
- Han EB, Stevens CF. Development regulates a switch between post- and presynaptic strengthening in response to activity deprivation. Proc Natl Acad Sci U S A. 2009;106:10817–10822. doi: 10.1073/pnas.0903603106. [DOI] [PMC free article] [PubMed] [Google Scholar]
- Han Y, Kaeser PS, Südhof TC, Schneggenburger R. RIM determines Ca(2)+ channel density and vesicle docking at the presynaptic active zone. Neuron. 2011;69:304–316. doi: 10.1016/j.neuron.2010.12.014. [DOI] [PMC free article] [PubMed] [Google Scholar]
- Haws ME, Kaeser PS, Jarvis DL, Südhof TC, Powell CM. Region-specific deletions of RIM1 reproduce a subset of global RIM1alpha(−/−) phenotypes. Genes Brain Behav. 2012;11:201–213. doi: 10.1111/j.1601-183X.2011.00755.x. [DOI] [PMC free article] [PubMed] [Google Scholar]
- Houser CR. Morphological changes in the dentate gyrus in human temporal lobe epilepsy. Epilepsy Res Suppl. 1992;7:223–234. [PubMed] [Google Scholar]
- Howard AL, Neu A, Morgan RJ, Echegoyen JC, Soltesz I. Opposing modifications in intrinsic currents and synaptic inputs in post-traumatic mossy cells: evidence for single-cell homeostasis in a hyperexcitable network. J Neurophysiol. 2007;97:2394–2409. doi: 10.1152/jn.00509.2006. [DOI] [PubMed] [Google Scholar]
- Janz R, Goda Y, Geppert M, Missler M, Südhof TC. SV2A and SV2B function as redundant Ca2+ regulators in neurotransmitter release. Neuron. 1999;24:1003–1016. doi: 10.1016/s0896-6273(00)81046-6. [DOI] [PubMed] [Google Scholar]
- Jiang X, Litkowski PE, Taylor AA, Lin Y, Snider BJ, Moulder KL. A role for the ubiquitin-proteasome system in activity-dependent presynaptic silencing. J Neurosci. 2010;30:1798–1809. doi: 10.1523/JNEUROSCI.4965-09.2010. [DOI] [PMC free article] [PubMed] [Google Scholar]
- Kaeser PS, Südhof TC. RIM function in short- and long-term synaptic plasticity. Biochem Soc Trans. 2005;33:1345–1349. doi: 10.1042/BST0331345. [DOI] [PubMed] [Google Scholar]
- Kaeser PS, Kwon HB, Chiu CQ, Deng L, Castillo PE, Südhof TC. RIM1alpha and RIM1beta are synthesized from distinct promoters of the RIM1 gene to mediate differential but overlapping synaptic functions. J Neurosci. 2008a;28:13435–13447. doi: 10.1523/JNEUROSCI.3235-08.2008. [DOI] [PMC free article] [PubMed] [Google Scholar]
- Kaeser PS, Kwon HB, Blundell J, Chevaleyre V, Morishita W, Malenka RC, Powell CM, Castillo PE, Südhof TC. RIM1alpha phosphorylation at serine-413 by protein kinase A is not required for presynaptic long-term plasticity or learning. Proc Natl Acad Sci U S A. 2008b;105:14680–14685. doi: 10.1073/pnas.0806679105. [DOI] [PMC free article] [PubMed] [Google Scholar]
- Kaeser PS, Deng L, Wang Y, Dulubova I, Liu X, Rizo J, Südhof TC. RIM proteins tether Ca2+ channels to presynaptic active zones via a direct PDZ-domain interaction. Cell. 2011;144:282–295. doi: 10.1016/j.cell.2010.12.029. [DOI] [PMC free article] [PubMed] [Google Scholar]
- Lazarevic V, Schöne C, Heine M, Gundelfinger ED, Fejtova A. Extensive remodeling of the presynaptic cytomatrix upon homeostatic adaptation to network activity silencing. J Neurosci. 2011;31:10189–10200. doi: 10.1523/JNEUROSCI.2088-11.2011. [DOI] [PMC free article] [PubMed] [Google Scholar]
- Lehmann TN, Gabriel S, Eilers A, Njunting M, Kovacs R, Schulze K, Lanksch WR, Heinemann U. Fluorescent tracer in pilocarpine-treated rats shows widespread aberrant hippocampal neuronal connectivity. Eur J Neurosci. 2001;14:83–95. doi: 10.1046/j.0953-816x.2001.01632.x. [DOI] [PubMed] [Google Scholar]
- Li L, Chin LS, Greengard P, Copeland NG, Gilbert DJ, Jenkins NA. Localization of the synapsin II (SYN2) gene to human chromosome 3 and mouse chromosome 6. Genomics. 1995;28:365–366. doi: 10.1006/geno.1995.1162. [DOI] [PubMed] [Google Scholar]
- Lonart G, Schoch S, Kaeser PS, Larkin CJ, Südhof TC, Linden DJ. Phosphorylation of RIM1alpha by PKA triggers presynaptic long-term potentiation at cerebellar parallel fiber synapses. Cell. 2003;115:49–60. doi: 10.1016/s0092-8674(03)00727-x. [DOI] [PubMed] [Google Scholar]
- Lynch BA, Lambeng N, Nocka K, Kensel-Hammes P, Bajjalieh SM, Matagne A, Fuks B. The synaptic vesicle protein SV2A is the binding site for the antiepileptic drug levetiracetam. Proc Natl Acad Sci U S A. 2004;101:9861–9866. doi: 10.1073/pnas.0308208101. [DOI] [PMC free article] [PubMed] [Google Scholar]
- Margerison JH, Corsellis JA. Epilepsy and the temporal lobes: a clinical, electroencephalographic and neuropathological study of the brain in epilepsy, with particular reference to the temporal lobes. Brain. 1966;89:499–530. doi: 10.1093/brain/89.3.499. [DOI] [PubMed] [Google Scholar]
- Mittelstaedt T, Alvaréz-Baron E, Schoch S. RIM proteins and their role in synapse function. Biol Chem. 2010;391:599–606. doi: 10.1515/BC.2010.064. [DOI] [PubMed] [Google Scholar]
- Moulder KL, Meeks JP, Shute AA, Hamilton CK, de Erausquin G, Mennerick S. Plastic elimination of functional glutamate release sites by depolarization. Neuron. 2004;42:423–435. doi: 10.1016/s0896-6273(04)00184-9. [DOI] [PubMed] [Google Scholar]
- Moulder KL, Jiang X, Taylor AA, Olney JW, Mennerick S. Physiological activity depresses synaptic function through an effect on vesicle priming. J Neurosci. 2006;26:6618–6626. doi: 10.1523/JNEUROSCI.5498-05.2006. [DOI] [PMC free article] [PubMed] [Google Scholar]
- Murthy VN, Schikorski T, Stevens CF, Zhu Y. Inactivity produces increases in neurotransmitter release and synapse size. Neuron. 2001;32:673–682. doi: 10.1016/s0896-6273(01)00500-1. [DOI] [PubMed] [Google Scholar]
- Pelkey KA, Topolnik L, Yuan XQ, Lacaille JC, McBain CJ. State-dependent cAMP sensitivity of presynaptic function underlies metaplasticity in a hippocampal feedforward inhibitory circuit. Neuron. 2008;60:980–987. doi: 10.1016/j.neuron.2008.11.018. [DOI] [PMC free article] [PubMed] [Google Scholar]
- Pitsch J, Schoch S, Gueler N, Flor PJ, van der Putten H, Becker AJ. Functional role of mGluR1 and mGluR4 in pilocarpine-induced temporal lobe epilepsy. Neurobiol Dis. 2007;26:623–633. doi: 10.1016/j.nbd.2007.03.003. [DOI] [PubMed] [Google Scholar]
- Pozo K, Goda Y. Unraveling mechanisms of homeostatic synaptic plasticity. Neuron. 2010;66:337–351. doi: 10.1016/j.neuron.2010.04.028. [DOI] [PMC free article] [PubMed] [Google Scholar]
- Rosahl TW, Spillane D, Missler M, Herz J, Selig DK, Wolff JR, Hammer RE, Malenka RC, Südhof TC. Essential functions of synapsins I and II in synaptic vesicle regulation. Nature. 1995;375:488–493. doi: 10.1038/375488a0. [DOI] [PubMed] [Google Scholar]
- Schoch S, Castillo PE, Jo T, Mukherjee K, Geppert M, Wang Y, Schmitz F, Malenka RC, Südhof TC. RIM1alpha forms a protein scaffold for regulating neurotransmitter release at the active zone. Nature. 2002;415:321–326. doi: 10.1038/415321a. [DOI] [PubMed] [Google Scholar]
- Schoch S, Mittelstaedt T, Kaeser PS, Padgett D, Feldmann N, Chevaleyre V, Castillo PE, Hammer RE, Han W, Schmitz F, Lin W, Südhof TC. Redundant functions of RIM1alpha and RIM2alpha in Ca(2+)-triggered neurotransmitter release. EMBO J. 2006;25:5852–5863. doi: 10.1038/sj.emboj.7601425. [DOI] [PMC free article] [PubMed] [Google Scholar]
- Thom M, Zhou J, Martinian L, Sisodiya S. Quantitative post-mortem study of the hippocampus in chronic epilepsy: seizures do not inevitably cause neuronal loss. Brain. 2005;128:1344–1357. doi: 10.1093/brain/awh475. [DOI] [PubMed] [Google Scholar]
- Van Paesschen W, Revesz T, Duncan JS, King MD, Connelly A. Quantitative neuropathology and quantitative magnetic resonance imaging of the hippocampus in temporal lobe epilepsy. Ann Neurol. 1997;42:756–766. doi: 10.1002/ana.410420512. [DOI] [PubMed] [Google Scholar]
- Vitureira N, Letellier M, Goda Y. Homeostatic synaptic plasticity: from single synapses to neural circuits. Curr Opin Neurobiol. 2012;22:516–521. doi: 10.1016/j.conb.2011.09.006. [DOI] [PMC free article] [PubMed] [Google Scholar]
- Wieser HG. ILAE commission report: mesial temporal lobe epilepsy with hippocampal sclerosis. Epilepsia. 2004;45:695–714. doi: 10.1111/j.0013-9580.2004.09004.x. [DOI] [PubMed] [Google Scholar]
- Wyler AR, Dohan FC, Schweitzer JB, Berry AD. A grading system for mesial temporal pathology (hippocampal sclerosis) from anterior temporal lobectomy. J Epilepsy. 1992;5:220–225. [Google Scholar]