

Abstract
Several studies about noise-enhanced balance control in humans support the hypothesis that stochastic resonance can enhance the detection and transmission in sensorimotor system during a motor task. The purpose of the present study was to extend these findings in a simpler and controlled task. We explored whether a particular level of a mechanical Gaussian noise (0–15 Hz) applied on the index finger can improve the performance during compensation for a static force generated by a manipulandum. The finger position was displayed on a monitor as a small white point in the center of a gray circle. We considered a good performance when the subjects exhibited a low deviation from the center of this circle and when the performance had less variation over time. Several levels of mechanical noise were applied on the manipulandum. We compared the performance between zero noise (ZN), optimal noise (ON), and high noise (HN). In all subjects (8 of 8) the data disclosed an inverted U-like graph between the inverse of the mean variation in position and the input noise level. In other words, the mean variation was significantly smaller during ON than during ZN or HN. The findings suggest that the application of a tactile-proprioceptive noise can improve the stability in sensorimotor performance via stochastic resonance. Possible explanations for this improvement in motor precision are an increase of the peripheral receptors sensitivity and of the internal stochastic resonance, causing a better sensorimotor integration and an increase in corticomuscular synchronization.
Introduction
Stochastic resonance (SR) is a phenomenon in nonlinear systems characterized by a response increase of the system induced by a particular level of input noise (Moss et al., 2004; for review, see McDonnell and Ward, 2011). In the nervous system the first description of SR effects was by Douglass et al. (1993) in the crayfish mechanoreceptors, followed by Levin and Miller (1996) in the cricket cercal sensory system. Collins et al. (1996a) and Ivey et al. (1998) demonstrated SR effects in the rat cutaneous mechanoreceptors, thus showing that SR also plays a role in the mammal nervous system. In humans, a first psychophysical study showed that application of noise increased the sensitivity to detect subthreshold tactile stimuli (Collins et al., 1996b). These reports motivated the analysis of SR on tactile evoked potentials in humans and cats (Manjarrez et al., 2002a,b, 2003). SR effects were shown not only in the somatosensory, but also in visual and auditory systems (Simonotto et al., 1997; Jaramillo and Wiesenfeld, 1998; Volgushev and Eysel, 2000; Manjarrez et al., 2007; Aihara et al., 2010). In the motor system, Fallon et al. (2004) demonstrated that broadband (0–300 Hz) noise improved the afferents sensitivity from Golgi tendon organs, primary and secondary muscle spindles in cat, in line with an earlier study on humans muscle spindle receptors (Cordo et al., 1996). Martínez et al. (2007) recently demonstrated that SR increased the monosynaptic reflex amplitude in the cat spinal cord.
However, little is known about SR in sensorimotor coordination when cutaneous mechanoreceptors, muscle spindles, tendon organs, and motoneurons are involved. In this context, Priplata et al. (2002) and Collins et al. (2003) provided the first evidence that mechanical noise applied to the feet via vibrating insoles improved balance in standing position. Subsequent studies in patients with diabetes and stroke and in elderly subjects reported similar improvement (Harry et al., 2005; Priplata et al., 2006). In elderly subjects, a SR-based therapy reduced gait variability (Galica et al., 2009), and enhanced postural dynamical complexity (Costa et al., 2007). Tactile noise applied on the fingertip (Magalhães and Kohn, 2011) as well as stochastic electrical stimulation applied of the vestibular organs (Mulavara et al., 2011) also improved balance.
The present study was aimed at investigating whether mechanical Gaussian noise in a narrow frequency range (0–15 Hz) improves sensorimotor performance. In contrast to balance control and gait, both multijoint/muscle performances, we used an index finger motor task, mainly involving the metacarpophalangeal joint, requiring isometric static force compensation. This visuomotor tracking task is well understood in terms of its oscillatory cortical and spinal control and better performance is associated with higher corticospinal coherence (Baker, 2007; Kristeva et al., 2007). This may allow building a bridge between the results of the present study and existing findings on the oscillatory mechanisms. Thus, we expect that this investigation will provide the basis to address additional psychophysical questions, such as the most effective frequency range, and to design experiments focused on the SR physiological mechanisms.
Materials and Methods
Subjects
Eight healthy right-handed subjects (five females and three males, mean age 35.0 ± 15.7 years) without any history of neurological disease took part in the study. The handedness was tested according to the Oldfield questionnaire (Oldfield, 1971). Three of the subjects had already participated in similar experiments but their data did not differ from the other naive subjects. All subjects participated according to the declaration of Helsinki, established by the World Medical Association in 1964, with understanding and informed consent of each subject and approval of the local ethics committee.
Experimental paradigm
During the experimental session, the subject sat in an electrically shielded, dimly lit room. The right arm was supported by a splint and the subject was instructed to place the hand over a sphere and the right index finger in the ring of a custom-built manipulandum (Fig. 1A) which was designed to apply vertical forces on the finger at the level of the metacarpophalangeal joint. A computer-controlled tooth belt drive, with two sensors to measure vertical forces and displacements, produced a defined force on the ring. This force was the target static force which the subject had to compensate and maintain quasi-isometrically (Fig. 1D–F).
Figure 1.

Experimental setup. A, Top, Home-made manipulandum producing a target static force at 8% of individual maximum voluntary contraction (MVC) on which various levels of noise are superimposed. The profile of the target static force is shown in D (without a superimposed noise, i.e., with ZN), in E (with superimposed ON), and in F (with superimposed HN). Bottom, Visual feedback of the ring position is displayed on a monitor in front of the subject. The position values of the borders of the outer fixed gray circle are at ±6.1 mm. B, Wavetek (frequency generator) noise: Gaussian histogram (top) and spectral power (bottom) of the noise. C, Manipulandum noise: Gaussian histogram (top) and spectral power (bottom) of the noise of the manipulandum in arbitrary units (au). Note that the manipulandum generates noise up to 15 Hz only. D, Original curves for target force and position recorded during the experiment, for three different levels of noise: ZN, ON, and HN, respectively. Note that the variation in position is much higher for ZN and HN than for ON. The better performance for ON, compared with ZN and HN, is also shown in the magnifications of the position.
Visual feedback about the position of the ring was provided to the subject on a 19 inch monitor placed 100 cm in front of her/him displaying two concentric circles (Fig. 1A). Thus the task is a “position” 1, because the feedback displayed and measured was the finger position, although it represented (proportional to) the force applied by the subject. The gray outer circle (radius 6 mm including the thickness of 2 mm) was fixed and represented the ring's reference position while the inner solid white point (radius 2 mm) moved according to the index finger position. The subject had to maintain the small white circle inside the gray one. When a target force was applied to the ring, the subject had to compensate the displacement of the white point by applying a quasi-isometric force in the opposite direction (here flexion) to keep it in its central position. A finger displacement of 1 mm corresponded to 2.85 mm visual feedback. The tolerance for the positional errors was the gray circle. In each trial, segments in which the white point exited the gray circle were excluded from further analysis. They were only ∼1% of the segments for each noise level.
During the experiment, the manipulandum generated a target force at 8% of the maximum voluntary contraction, which was determined for each subject before the experiment (Fig. 1D–F). We used low force as it has been shown that the motor cortical neurons are most sensitive to forces within a low force range (Hepp-Reymond et al., 1989). Each trial had three phases: a 1 s ramp phase (rising cosine function to ensure a smooth start) followed by a 12 s period of static force, followed by a downward ramp phase (again cosine function) to ensure a smooth end of the generated force.
To investigate the effect of SR on the performance, a Gaussian noise (see the histograms in the top of Fig. 1B,C) in the range of 0–15 Hz was added to the target force. This noise was generated by a waveform generator (Wavetek 395, 100 MHz) with different levels of intensity, beginning with zero noise (ZN) to high noise (HN) in a range from 0 to 200 mN (Fig. 1B). Actually, the Wavetek generated a noise up to 200 Hz (Fig. 1B, bottom), but the manipulandum was only able to produce frequencies up to 15 Hz (Fig. 1C, bottom).
Before the experiment the subjects performed a few trials to get familiarized with the task and to learn “what” to do and “how” to do it. The experiment started after the task was learned.
As no data exist in the literature about the noise levels inducing SR in an index finger task, we defined for each subject a priori the noise levels which could be considered as optimum noise (ON) with the best performance and HN with a clear worsening of the performance. This selection was done by online observation of the position trace during several noise levels. This a priori selection was done for each subject by at least two investigators simultaneously. In addition, two noise levels between the ZN and the ON and between the ON and the HN were chosen, to avoid missing the ON.
During the experimental session, two recording series of five trials each were collected for each noise level, thus reaching 10 trials per noise level. The five noise levels were presented in a pseudo-randomized fashion. To avoid letting the subjects know which noise level was added to the manipulandum, the five noise levels were presented in a randomized fashion. Furthermore, to avoid muscle fatigue, rest intervals of 5–10 s were included between the trials and ∼5 min between the series.
To test the reproducibility of the findings we performed the same experimental protocol in 7 of 8 subjects on two consecutive days.
The subjects were instructed to avoid any other movements and to fix their gaze on the visual feedback during the experiment.
Recordings
The set-point of the force and displacement of the finger were recorded (bandpass DC—200 Hz, sampling rate of 1000 Hz). Data were analyzed off-line.
Data analysis
Mean variation of position and mean absolute deviation.
To estimate the stochastic resonance phenomenon, we calculated the mean variation (MV) of the finger position magnitude. A global measure was obtained by computing the mean of variation over all sampling points. The mean variation over time of the performance was computed using the formula:
 |
The mean absolute deviation (MAD) was computed on the basis of the formula:
 |
where xi is the value of finger position relative to the applied force at the sampling point i. MAD measures the deviation amplitude of the dot within the ring relative to the zero reference in both directions of the applied force.
Statistical analysis of the mean variation and of the mean absolute deviation.
The performance was measured as the inverse of the mean variation of the finger position. ON referred to the noise level that yielded the smallest value of MV (equivalently the largest values of its inverse 1/MV). HN referred to the noise that produced the largest values of MV (equivalently the smallest 1/MV) compared with the ZN condition. In most of the cases this a posteriori analysis confirmed the a priori analysis. Because we wanted to know the contrast between ON and ZN on one side, and between ON and HN on the other, we have done statistical analysis on these three noise levels. To detect differences in performance among these three conditions, the nonparametric Friedman test was used. Where the differences were significant we performed the post hoc Wilcoxon signed-rank test.
Return maps
To display the quality of the performance during the various noise levels we used return maps of the time series of the finger displacement (Shenker, 1982). A return map is a graph of the displacement xi+1 versus the previous displacement xi where i is the sampling point. According to the return maps a bad performance will have a large dispersion of the points in the graph. However, a good performance will show that all the points in the map are concentrated near to its center (xi, xi).
Results
No subjects reported any fatigue or anxiety during the experimental sessions.
Effects of stochastic resonance on the mean variation over time
All the subjects (8 of 8) exhibited an inverted U-like function of the 1/mean variation of position (1/MV) versus the input noise level. Figure 2 (day 1) displays results from four subjects (Subjects 1, 3, 4, and 7) on the two experimental days and clearly shows interindividual differences. The subjects can be divided in 3 groups, depending on the range of noise level (low, middle, and high) at which the best performance occurred. Two subjects (Subject 3 in Fig. 2 being one of them) exhibited a peak in the low range of noise (0–25 mN), two other subjects (Subject 1 being one of them) peaked in the middle range (0–80 mN), while the other four (Subject 4 and Subject 7 in Fig. 2 being two of them) peaked in the high range (0–200 mN). Figure 2 also reveals a similar behavior with only small differences in the profile of the inverted U-like graphs for Day 1 and Day 2.
Figure 2.
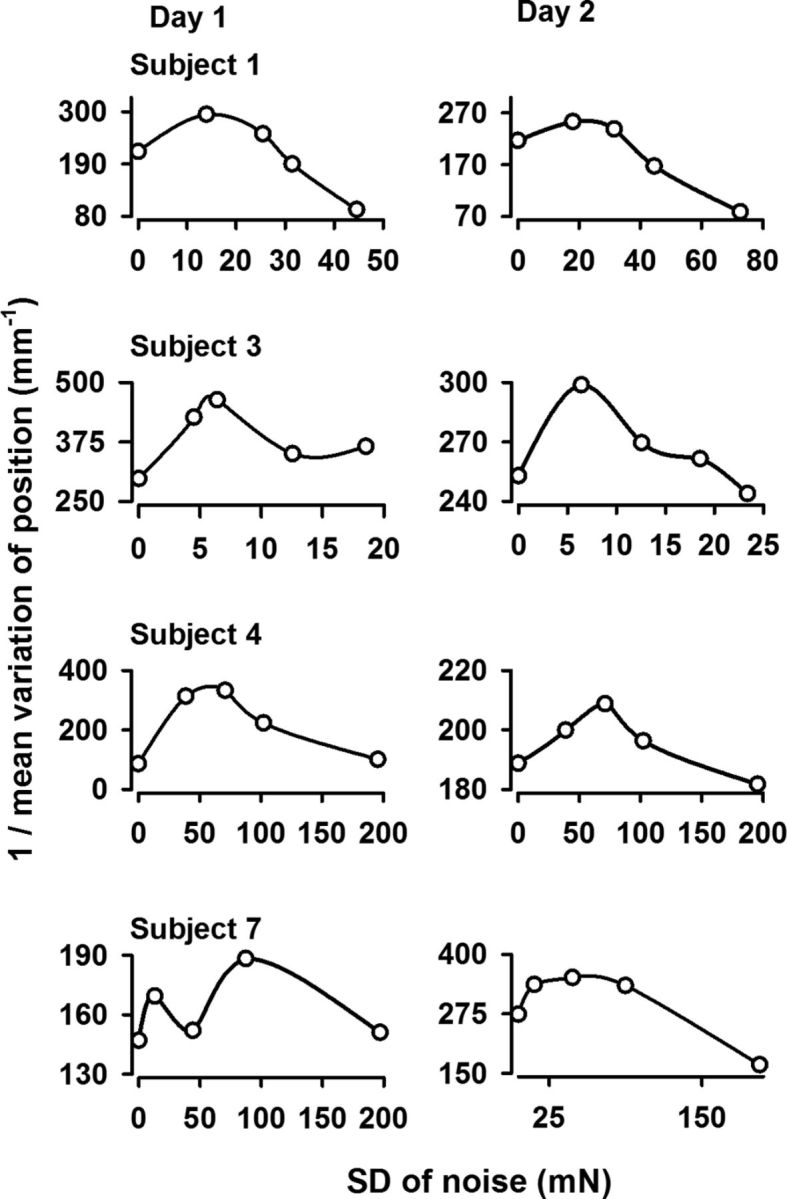
Effect of stochastic resonance on the motor performance on 2 d. Performance of four subjects for various levels of noise on Day 1 (left) and Day 2 (right). x-axis: SD of noise (mN). The performance on the y-axis was computed as the inverse of the mean variation of the finger position. Note that the performance is characterized by inverted U-shape like curve for all four subjects. Similar curves were obtained for the other four subjects. Note also the similar behavior of the performance Days 1 and 2 and the interindividual differences in noise levels.
Therefore, the data suggest the existence of an ON level for which the best performance occurred. These graphs serve for illustrative purposes only, but the statistical analysis of the significance of performance in the ON condition versus the ZN and HN conditions is the subject of the following section.
Performance differences between ZN, ON, and HN
Stability of the finger position
One traditional way to visualize the behavior of time series signals is with the Poincaré maps or return maps (see Materials and Methods). Figure 3 displays return maps of four subjects (Subjects 2, 6, 7, and 8) in the three conditions: ZN, ON, and HN. The dispersion of the points in the maps is tight for the ON condition, meaning that the stability and the performance were better compared with the ZN and HN conditions. This illustrates in a qualitative way the stochastic resonance effects. The gray circle in each return map illustrates the gray circle (with a radius of 6 mm) displayed on the monitor for the visual feedback, as indicated in Figure 1A. For clarity, we used black lines to join consecutive points in the return maps of Figure 3.
Figure 3.

Return maps of the finger position for four subjects for ZN, ON, and HN. Graph of the displacement xi+1 versus the previous displacement xi where i is the sampling point. The gray circle corresponds to the gray outer circle on the monitor. For a good performance, as during ON, all the points in the map are concentrated near the center of the gray circle (xi+1, xi) and their dispersion is very small, indicating higher stability.
Mean variation and mean absolute deviation of finger position
To test the statistical significance between the three conditions (ON, LN, and HN) for all eight subjects, we took two parameters as indicators of a good performance: the mean variation and the mean absolute deviation. Both are displayed in Figure 4.
Figure 4.
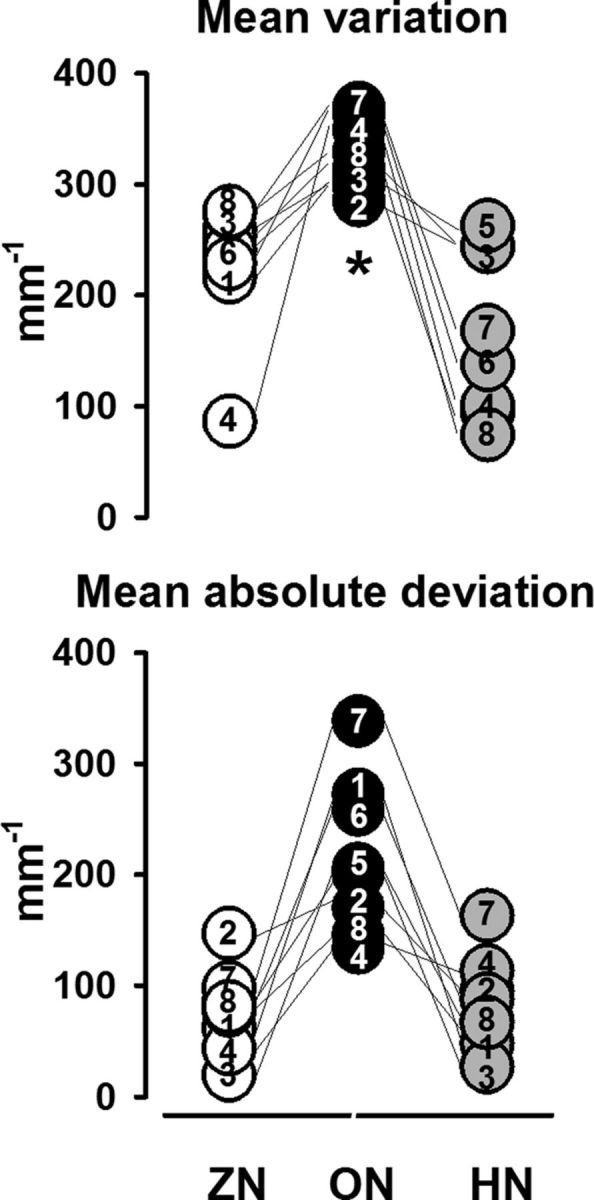
Pooled data for mean variation and mean absolute deviation of the finger position (negative values up). The numbers inside the circles correspond to the subjects. Top, Individual values for the Mean variation of finger position for ZN (white circles), ON (black circles) and HN (gray circles). Note the significantly (asterisk) lower variation for ON than for ZN and HN. Bottom, Same display for the Mean absolute deviation. The mean absolute deviation is again better for ON than for ZN and HN, although statistically nonsignificant.
For the mean variation, the Friedman test first showed significant differences between the three conditions (p = 0.002, df 2). The Wilcoxon test revealed statistically significant differences between ZN and ON (p = 0.01) and between ON and HN (p = 0.01). In contrast, no statistically significant differences were found for the mean absolute deviation, although those shown in Figure 4 were obviously better. Thus the findings indicate that the performance is better and more stable during the ON.
Discussion
In the present study we show for the first time that an individually determined optimal level of mechanical Gaussian noise in a narrow frequency range, from 0 to 15 Hz, improves the performance in a sensorimotor index finger task. The noise levels inducing SR varied between 0 and 200 mN. The data suggest that the ON level enhances the sensitivity of cutaneous mechanoreceptors and of proprioceptors, increasing the internal SR of the system. This in turn increases the neuronal synchronization between motor areas and muscles and thus improves motor control by increasing the stability of the performance.
Comparison with earlier studies
Our results support the previous reports on improved balance control in humans (Collins et al., 2003; Priplata et al., 2003, 2006; Harry et al., 2005; Costa et al., 2007; Galica et al., 2009). We can qualitatively compare our return maps visualizing the improvement in performance with the stabilograms (plots of mediolateral and anterioposterior shoulder displacements during postural sway) of Priplata et al. (2003) and Magalhães and Kohn (2011), which display the balance improvement. Both types of graphs show that, although both sensorimotor tasks (compensation of a static finger force and postural balance) have different levels of complexity and involve different receptors, a decrease in variation in the performances occurred when an optimal level of mechanical noise is applied. With respect to the hand, our results are also consistent with a recent report on a device called “wearable sensorimotor enhancer” which, by adding tactile noise on the finger, improved grasping in healthy subjects (Kurita et al., 2011).
Possible role of the physiological tremor
Muscular voluntary contraction is often accompanied by a tremor in the form of continuous oscillations with a dominant peak in the frequency range from 8 to 12 Hz (Lippold, 1970). Several lines of evidence support the hypothesis that this “physiological tremor” is generated by a loop in the spinal reflex pathways.
In our experiment one explanation for the improvement with ON could be the cancelling of the physiological tremor in the finger at the spinal level caused by the noise applied in exact antiphase with the physiological tremor. However, this is quite unlikely as the stochastic nature of the noise makes it impossible to synchronize in antiphase the tremor oscillations.
Another possible explanation for the better performance during ON is the suppression or reduction of the physiological tremor by supraspinal centers shown to be involved in the generation of 10 Hz tremor, such as the pontomedullary reticular formation and the deep cerebellar nuclei (Williams and Baker, 2009; Williams et al., 2010). These authors reported in monkeys that these supraspinal centers exhibit oscillations in neuronal activity at a tremor frequency occurring in antiphase with the oscillations generated by the spinal interneuron circuits. This suggests that descending inputs can reduce the tremor oscillations and thereby improve movement precision. In our subjects, the spectral power of the position trace did not show any changes in physiological tremor with ON. Therefore, motor improvement through physiological tremor reduction has to be excluded, at least in healthy subjects. But we cannot exclude that in tremor patients the application of noise would induce “boosting the strength of peripheral input and could push the spinal and cortical systems closer to anti-phase firing and hence reduce the tremor” (S. N. Baker, personal communication). Data from two tremor patients whose tremor was reduced by noise favor this prediction.
The role of the peripheral cutaneous receptors and of muscle afferents
In the fingers the many mechanoreceptors are classified according to their morphology, location, receptive fields, and adaptation to tactile stimuli. The slow-adapting mechanoreceptors are Merkel disks and Ruffini endings, and the fast-adapting mechanoreceptors are Meissner and Pacinian corpuscles (Johansson and Flanagan, 2009). The Pacinian corpuscles have a low threshold, but only for high frequencies (60–400 Hz). At frequencies <60 Hz, or >400 Hz, their activation requires mechanical stimuli of larger amplitude with skin indentation up to 1 mm (Mountcastle et al., 1972).
Since the amplitude of the noise applied in our study was very low (from 0 to 200 mN) and the frequency of the noise only reached 15 Hz, we can exclude the participation of Pacinian corpuscles in the performance improvement. In contrast, it is well known that Merkel disk receptors are most responsive to very low frequencies in the range from 5 to 15 Hz (Gardner et al., 2000). Thus it is tempting to speculate that the noise increases the sensitivity mainly of the Merkel disk receptors located in the pulp of the index finger. It is very probable that the noise enhances the sensitivity, as well, of the fast-adapting Meissner receptors and slow-adapting type II Ruffini receptors, which are sensitive to static force and sense tension in dermal and subcutaneous collagenous fiber strands (Johansson and Flanagan, 2009).
In our task the involvement of proprioceptors cannot be excluded due to isometric force compensation at the metacarpophalangeal joint. Fallon et al. (2004) described for the first time the SR phenomenon in muscle afferents of cats. Since, in this study, the cats were anesthetized and thus the fusimotor system was inactive, their results suggest that the proprioceptive afferent input is involved in the stochastic resonance, in line with the results by Cordo et al. (1996) in humans. Furthermore, Martínez et al. (2007) demonstrated that in anesthetized cats the SR phenomenon is exhibited by the motor final pathway (the motoneurons), supporting the idea that at the spinal level both afferent pathways and efferent motor responses can produce SR.
However, only the recording of sensory afferents by microneurography could give precise indication on the receptors participating in our task (Vallbo, 1970; Burke et al., 1976; Roll and Vedel, 1982; Johansson and Valbo, 1983; Roll et al., 1989; Johansson and Birznieks, 2004). Microneurography during a similar protocol as used in the present study could also disclose peripheral mechanisms underlying the SR phenomenon. By changing the frequency range of the Gaussian noise, this technique would enable us to find out the best ON frequency and underlying receptors.
The interindividual and intraindividual differences in ON level revealed in the present study can be related to dissimilarities in the configuration and orientation of the multiple “hotspots” in the cutaneous receptive fields, the various receptor densities and afferent thresholds, and differences in skin elasticity. Differences can also occur with extremely slight changes in the orientation of force on the fingertip. We cannot exclude the possibility that other nonspecific factors such as fatigue, fluctuations in attention level, and top-down effects on the fusimotor drive can also play a role.
Effect of the stochastic resonance on the corticomuscular synchronization
A likely explanation of the improved performance during ON is an enhancement in neuronal synchronization at the spinal, cortical, and corticospinal level. Synchronization subserves the selective and effective transmission of information in neuronal networks involved in sensorimotor integration (Fell and Axmacher, 2011; Siegel et al., 2012). The effects of noise on synchronization have also been explored in Hodgkin-Huxley neuronal networks (Wang et al., 2010) and other theoretical small-world networks (Perc, 2007, 2008). In the somatosensory system, using afferent stimulation and simultaneously recording spinal and cortical evoked potentials in anesthetized cats, we reported that an intermediate level of tactile noise can enhance the coherence between the spinal and cortical evoked activity (Manjarrez et al., 2002b). In the visual system, Kitajo et al. (2007) showed that the addition of noise can produce a significant phase synchronization of EEG signals from widely separated cortical areas. Also, in the humans auditory system, Ward et al. (2010) provided the evidence that intraregional and interregional EEG neuronal synchronizations are facilitated by the addition of moderate amounts of random noise.
During static force control, as in our task, the oscillatory activities of cortical motor areas and contralateral spinal motoneuron are synchronized in the beta range (∼20 Hz). This is reflected in corticomuscular (EEG-MEG/EMG) coherence (Conway et al., 1995; Brown, 2000; Baker et al., 2006; Baker, 2007; Omlor et al., 2007, 2011; Mendez-Balbuena et al., 2012). Baker et al. (2006) provided direct evidence that sustained afferent discharge from muscle receptors is coherent with central oscillations involved with sensorimotor processing. As shown by Fisher et al. (2002), cutaneous input also enhances oscillatory synchrony in the motor system. And using directed coherence, Witham et al. (2011) have demonstrated that both descending and ascending pathways contribute to corticomuscular coherence. Hence, one can postulate that the ON applied in our study enhances the sensitivity of cutaneous receptors, muscle spindle afferents, and Golgi tendon organs. Therefore, the internal SR in the system increases and the sensorimotor integration at cortical level improves. This would lead to a stronger cortical motor synchrony and a stronger motor cortex drive to the muscles. Stronger beta-range cortical motor synchrony, as reflected in higher beta-range spectral power, and higher corticospinal beta-range coherence have been shown to be associated with better performance (Baker, 2007; Kristeva et al., 2007; Pogosyan et al., 2009; Mendez-Balbuena et al., 2012). We thus expect that the addition of ON will increase cortical motor and corticomuscular synchrony. Pilot studies in our laboratory favor this prediction.
Footnotes
This work was supported by a Deutsche Forschungsgemeinschaft grant (Kr 1392/11-1) and Cátedra Marcos Moshinski (E.M.). We thank E. Cheema-Bösch for technical help.
References
- Aihara T, Kitajo K, Nozaki D, Yamamoto Y. How does stochastic resonance work within the human brain?—psychophysics of internal and external noise. Chem Phys. 2010;375:616–624. [Google Scholar]
- Baker SN. Oscillatory interactions between sensorimotor cortex and the periphery. Curr Opin Neurobiol. 2007;17:649–655. doi: 10.1016/j.conb.2008.01.007. [DOI] [PMC free article] [PubMed] [Google Scholar]
- Baker SN, Chiu M, Fetz EE. Afferent encoding of central oscillations in the monkey arm. J Neurophysiol. 2006;95:3904–3910. doi: 10.1152/jn.01106.2005. [DOI] [PubMed] [Google Scholar]
- Brown P. Cortical drives to human muscle: the Piper and related rhythms. Prog Neurobiol. 2000;60:97–108. doi: 10.1016/s0301-0082(99)00029-5. [DOI] [PubMed] [Google Scholar]
- Burke D, Hagbarth KE, Löfstedt L, Wallin BG. The responses of human muscle spindle endings to vibration of non-contracting muscles. J Physiol. 1976;261:673–693. doi: 10.1113/jphysiol.1976.sp011580. [DOI] [PMC free article] [PubMed] [Google Scholar]
- Collins JJ, Imhoff TT, Grigg P. Noise-enhanced information transmission in rat SA1 cutaneous mechanoreceptors via aperiodic stochastic resonance. J Neurophysiol. 1996a;76:642–645. doi: 10.1152/jn.1996.76.1.642. [DOI] [PubMed] [Google Scholar]
- Collins JJ, Imhoff TT, Grigg P. Noise-enhanced tactile sensation. Nature. 1996b;383:770. doi: 10.1038/383770a0. [DOI] [PubMed] [Google Scholar]
- Collins JJ, Priplata AA, Gravelle DC, Niemi JB, Harry J, Lipsitz LA. Noise-enhanced human sensorimotor function. IEEE Eng Med Biol Mag. 2003;22:76–83. doi: 10.1109/memb.2003.1195700. [DOI] [PubMed] [Google Scholar]
- Conway BA, Halliday DM, Farmer SF, Shahani U, Maas P, Weir AI, Rosenberg JR. Synchronization between motor cortex and spinal motoneuronal pool during the performance of a maintained motor task in man. J Physiol. 1995;489:917–924. doi: 10.1113/jphysiol.1995.sp021104. [DOI] [PMC free article] [PubMed] [Google Scholar]
- Cordo P, Inglis JT, Verschueren S, Collins JJ, Merfeld DM, Rosenblum S, Buckley S, Moss F. Noise in human muscle spindles. Nature. 1996;383:769–770. doi: 10.1038/383769a0. [DOI] [PubMed] [Google Scholar]
- Costa M, Priplata AA, Lipsitz LA, Wu Z, Huang NE, Goldberger AL, Peng CK. Noise and poise: Enhancement of postural complexity in elderly with a stochastic-resonance-based therapy. Europhys Lett. 2007;77:68008. doi: 10.1209/0295-5075/77/68008. [DOI] [PMC free article] [PubMed] [Google Scholar]
- Douglass JK, Wilkens L, Pantazelou E, Moss F. Noise enhancement of information transfer in crayfish mechanoreceptors by stochastic resonance. Nature. 1993;365:337–340. doi: 10.1038/365337a0. [DOI] [PubMed] [Google Scholar]
- Fallon JB, Carr RW, Morgan DL. Stochastic resonance in muscle receptors. J Neurophysiol. 2004;91:2429–2436. doi: 10.1152/jn.00928.2003. [DOI] [PubMed] [Google Scholar]
- Fell J, Axmacher N. The role of phase synchronization in memory processes. Nat Rev Neurosci. 2011;12:105–118. doi: 10.1038/nrn2979. [DOI] [PubMed] [Google Scholar]
- Fisher RJ, Galea MP, Brown P, Lemon RN. Digital nerve anaesthesia decreases EMG-EMG coherence in a human precision grip task. Exp Brain Res. 2002;145:207–214. doi: 10.1007/s00221-002-1113-x. [DOI] [PubMed] [Google Scholar]
- Galica AM, Kang HG, Priplata AA, D'Andrea SE, Starobinets OV, Sorond FA, Cupples LA, Lipsitz LA. Subsensory vibrations to the feet reduce gait variability in elderly fallers. Gait Posture. 2009;30:383–387. doi: 10.1016/j.gaitpost.2009.07.005. [DOI] [PMC free article] [PubMed] [Google Scholar]
- Gardner EP, Martin JH, Jessell TM. The bodily senses. In: Kandel ER, Schwartz JH, Jessell TM, editors. Principles of neural science. New York: Elsevier; 2000. pp. 430–450. [Google Scholar]
- Harry JD, Niemi JB, Priplata AA, Collins JJ. Balancing act. IEEE Spectrum. 2005;42:36–41. [Google Scholar]
- Hepp-Reymond MC, Wannier TM, Maier MA, Rufener EA. Sensorimotor cortical control of isometric force in the monkey. Prog Brain Res. 1989;80:451–463. doi: 10.1016/s0079-6123(08)62242-6. [DOI] [PubMed] [Google Scholar]
- Ivey C, Apkarian AV, Chialvo DR. Noise-induced tuning curve changes in mechanoreceptors. J Neurophysiol. 1998;79:1879–1890. doi: 10.1152/jn.1998.79.4.1879. [DOI] [PubMed] [Google Scholar]
- Jaramillo F, Wiesenfeld K. Mechanoelectrical transduction assisted by Brownian motion: a role for noise in the auditory system. Nat Neurosci. 1998;1:384–388. doi: 10.1038/1597. [DOI] [PubMed] [Google Scholar]
- Johansson RS, Birznieks I. First spikes in ensembles of human tactile afferents code complex spatial fingertip events. Nat Neurosci. 2004;7:170–177. doi: 10.1038/nn1177. [DOI] [PubMed] [Google Scholar]
- Johansson RS, Flanagan JR. Coding and use of tactile signals from the fingertips in object manipulation tasks. Nat Rev Neurosci. 2009;10:345–359. doi: 10.1038/nrn2621. [DOI] [PubMed] [Google Scholar]
- Johansson RS, Valbo AB. Tactile sensory coding in the glabrous skin of the human hand. Trends Neurosci. 1983;6:27–31. [Google Scholar]
- Kitajo K, Doesburg SM, Yamanaka K, Nozaki D, Ward LM, Yamamoto Y. Noise-induced large-scale phase synchronization of human-brain activity associated with behavioral stochastic resonance. Europhys Lett. 2007;80:40009p1–40009p6. [Google Scholar]
- Kristeva R, Patino L, Omlor W. Beta-range cortical motor spectral power and corticomuscular coherence as a mechanism for effective corticospinal interaction during steady-state motor output. Neuroimage. 2007;36:785–792. doi: 10.1016/j.neuroimage.2007.03.025. [DOI] [PubMed] [Google Scholar]
- Kurita Y, Shinohara M, Ueda J. Wearable sensorimotor enhancer for a fingertip based on stochastic resonance. 2011:3790–3795. IEEE ICRA May 9–13, 2011. [Google Scholar]
- Levin JE, Miller JP. Broadband neural encoding in the cricket cercal sensory system enhanced by stochastic resonance. Nature. 1996;380:165–168. doi: 10.1038/380165a0. [DOI] [PubMed] [Google Scholar]
- Lippold OC. Oscillation in the stretch reflex arc and the origin of the rhythmical, 8–12 C-S component of physiological tremor. J Physiol. 1970;206:359–382. doi: 10.1113/jphysiol.1970.sp009018. [DOI] [PMC free article] [PubMed] [Google Scholar]
- Magalhães FH, Kohn AF. Vibratory noise to the fingertip enhances balance improvement associated with light touch. Exp Brain Res. 2011;209:139–151. doi: 10.1007/s00221-010-2529-3. [DOI] [PubMed] [Google Scholar]
- Manjarrez E, Diez-Martínez O, Méndez I, Flores A. Stochastic resonance in human electroencephalographic activity elicited by mechanical tactile stimuli. Neurosci Lett. 2002a;324:213–216. doi: 10.1016/s0304-3940(02)00212-4. [DOI] [PubMed] [Google Scholar]
- Manjarrez E, Rojas-Piloni JG, Méndez I, Martínez L, Vélez D, Vázquez D, Flores A. Internal stochastic resonance in the coherence between spinal and cortical neuronal ensembles in the cat. Neurosci Lett. 2002b;326:93–96. doi: 10.1016/s0304-3940(02)00318-x. [DOI] [PubMed] [Google Scholar]
- Manjarrez E, Rojas-Piloni G, Méndez I, Flores A. Stochastic resonance within the somatosensory system: effects of noise on evoked field potentials elicited by tactile stimuli. J Neurosci. 2003;23:1997–2001. doi: 10.1523/JNEUROSCI.23-06-01997.2003. [DOI] [PMC free article] [PubMed] [Google Scholar]
- Manjarrez E, Mendez I, Martinez L, Flores A, Mirasso CR. Effects of auditory noise on the psychophysical detection of visual signals: cross-modal stochastic resonance. Neurosci Lett. 2007;415:231–236. doi: 10.1016/j.neulet.2007.01.030. [DOI] [PubMed] [Google Scholar]
- Martínez L, Pérez T, Mirasso CR, Manjarrez E. Stochastic resonance in the motor system: Effects of noise on the monosynaptic reflex pathway of the cat spinal cord. J Neurophysiol. 2007;97:4007–4016. doi: 10.1152/jn.01164.2006. [DOI] [PubMed] [Google Scholar]
- McDonnell MD, Ward LM. The benefits of noise in neural systems: bridging theory and experiment. Nat Rev Neurosci. 2011;12:415–426. doi: 10.1038/nrn3061. [DOI] [PubMed] [Google Scholar]
- Mendez-Balbuena I, Huethe F, Schulte-Mönting J, Leonhart R, Manjarrez E, Kristeva R. Corticomuscular coherence reflects interindividual differences in the state of the corticomuscular network during low-level static and dynamic forces. Cereb Cortex. 2012;22:628–638. doi: 10.1093/cercor/bhr147. [DOI] [PubMed] [Google Scholar]
- Moss F, Ward LM, Sannita WG. Stochastic resonance and sensory information processing: a tutorial and review of application. Clin Neurophysiol. 2004;115:267–281. doi: 10.1016/j.clinph.2003.09.014. [DOI] [PubMed] [Google Scholar]
- Mountcastle VB, LaMotte RH, Carli G. Detection thresholds for stimuli in humans and monkeys: comparison with threshold events in mechanoreceptive afferent nerve fibers innervating the monkey hand. J Neurophysiol. 1972;35:122–136. doi: 10.1152/jn.1972.35.1.122. [DOI] [PubMed] [Google Scholar]
- Mulavara AP, Fiedler MJ, Kofman IS, Wood SJ, Serrador JM, Peters B, Cohen HS, Reschke MF, Bloomberg JJ. Improving balance function using vestibular stochastic resonance: optimizing stimulus characteristics. Exp Brain Res. 2011;210:303–312. doi: 10.1007/s00221-011-2633-z. [DOI] [PubMed] [Google Scholar]
- Oldfield RC. The assessment and analysis of handedness: the Edinburgh inventory. Neuropsychologia. 1971;9:97–113. doi: 10.1016/0028-3932(71)90067-4. [DOI] [PubMed] [Google Scholar]
- Omlor W, Patino L, Hepp-Reymond MC, Kristeva R. Gamma-range corticomuscular coherence during dynamic force output. Neuroimage. 2007;34:1191–1198. doi: 10.1016/j.neuroimage.2006.10.018. [DOI] [PubMed] [Google Scholar]
- Omlor W, Patino L, Mendez-Balbuena I, Schulte-Mönting J, Kristeva R. Corticospinal beta-range coherence is highly dependent on the pre-stationary motor state. J Neurosci. 2011;31:8037–8045. doi: 10.1523/JNEUROSCI.4153-10.2011. [DOI] [PMC free article] [PubMed] [Google Scholar]
- Perc M. Stochastic resonance on excitable small-world networks via a pacemaker. Phys Rev E Stat Nonlin Soft Matter Phys. 2007;76 doi: 10.1103/PhysRevE.76.066203. 066203. [DOI] [PubMed] [Google Scholar]
- Perc M. Stochastic resonance on weakly paced scale-free networks. Phys Rev E Stat Nonlin Soft Matter Phys. 2008;78 doi: 10.1103/PhysRevE.78.036105. 036105. [DOI] [PubMed] [Google Scholar]
- Pogosyan A, Gaynor LD, Eusebio A, Brown P. Boosting cortical activity at Beta-band frequencies slows movement in humans. Curr Biol. 2009;19:1637–1641. doi: 10.1016/j.cub.2009.07.074. [DOI] [PMC free article] [PubMed] [Google Scholar]
- Priplata AA, Niemi JB, Harry JD, Lipsitz LA, Collins JJ. Noise-enhanced human balance control. Phys Rev Lett. 2002;89:238101. doi: 10.1103/PhysRevLett.89.238101. [DOI] [PubMed] [Google Scholar]
- Priplata AA, Niemi JB, Harry JD, Lipsitz LA, Collins JJ. Vibrating insoles and balance control in elderly people. Lancet. 2003;362:1123–1124. doi: 10.1016/S0140-6736(03)14470-4. [DOI] [PubMed] [Google Scholar]
- Priplata AA, Patritti BL, Niemi JB, Hughes R, Gravelle DC, Lipsitz LA, Veves A, Stein J, Bonato P, Collins JJ. Noise-enhanced balance control in patients with diabetes and patients with stroke. Ann Neurol. 2006;59:4–12. doi: 10.1002/ana.20670. [DOI] [PubMed] [Google Scholar]
- Roll JP, Vedel JP. Kinaesthetic role of muscle afferents in man, studied by tendon vibration and microneurography. Exp Brain Res. 1982;47:177–190. doi: 10.1007/BF00239377. [DOI] [PubMed] [Google Scholar]
- Roll JP, Vedel JP, Ribot E. Alteration of proprioceptive messager induced by tendon vibration in man: a microneurographic study. Exp Brain Res. 1989;76:213–222. doi: 10.1007/BF00253639. [DOI] [PubMed] [Google Scholar]
- Shenker SJ. Scaling behavior in a map of a circle onto itself: empirical results. Physica D. 1982;5:405–411. [Google Scholar]
- Siegel M, Donner TH, Engel AK. Spectral fingerprints of large-scale neuronal interactions. Nat Rev Neurosci. 2012;13:121–134. doi: 10.1038/nrn3137. [DOI] [PubMed] [Google Scholar]
- Simonotto E, Riani M, Seife C, Roberts M, Twitty J, Moss F. Visual perception of stochastic resonance. Phys Rev Lett. 1997;78:1186–1189. [Google Scholar]
- Vallbo AB. Slowly adapting muscle receptors in man. Acta Physiol Scand. 1970;78:315–333. doi: 10.1111/j.1748-1716.1970.tb04667.x. [DOI] [PubMed] [Google Scholar]
- Volgushev M, Eysel UT. Neuroscience. Noise makes sense in neuronal computing. Science. 2000;290:1908–1909. doi: 10.1126/science.290.5498.1908. [DOI] [PubMed] [Google Scholar]
- Wang QY, Perc M, Duan ZS, Chen GR. Spatial coherence resonance in delayed Hodgkin-Huxley neuronal networks. Int J Mod Phys B. 2010;24:1201–1213. [Google Scholar]
- Ward LM, MacLean SE, Kirschner A. Stochastic resonance modulates neural synchronization within and between cortical sources. PLoS One. 2010;5:e14371. doi: 10.1371/journal.pone.0014371. [DOI] [PMC free article] [PubMed] [Google Scholar]
- Williams ER, Baker SN. Renshaw cell recurrent inhibition improves physiological tremor by reducing corticomuscular coupling at 10 Hz. J Neurosci. 2009;29:6616–6624. doi: 10.1523/JNEUROSCI.0272-09.2009. [DOI] [PMC free article] [PubMed] [Google Scholar]
- Williams ER, Soteropoulos DS, Baker SN. Spinal interneuron circuits reduce approximately 10 Hz movement discontinuities by phase cancellation. Proc Natl Acad Sci U S A. 2010;107:11098–11103. doi: 10.1073/pnas.0913373107. [DOI] [PMC free article] [PubMed] [Google Scholar]
- Witham CL, Riddle CN, Baker MR, Baker SN. Contribution of descending and ascending pathways to corticomuscular coherens in humans. J Physiol. 2011;589:3789–3800. doi: 10.1113/jphysiol.2011.211045. [DOI] [PMC free article] [PubMed] [Google Scholar]