

Abstract
Successful use of rodents as models for studying object vision crucially depends on the ability of their visual system to construct representations of visual objects that tolerate (i.e., remain relatively unchanged with respect to) the tremendous changes in object appearance produced, for instance, by size and viewpoint variation. Whether this is the case is still controversial, despite some recent demonstration of transformation-tolerant object recognition in rats. In fact, it remains unknown to what extent such a tolerant recognition has a spontaneous, perceptual basis, or, alternatively, mainly reflects learning of arbitrary associative relations among trained object appearances. In this study, we addressed this question by training rats to categorize a continuum of morph objects resulting from blending two object prototypes. The resulting psychometric curve (reporting the proportion of responses to one prototype along the morph line) served as a reference when, in a second phase of the experiment, either prototype was briefly presented as a prime, immediately before a test morph object. The resulting shift of the psychometric curve showed that recognition became biased toward the identity of the prime. Critically, this bias was observed also when the primes were transformed along a variety of dimensions (i.e., size, position, viewpoint, and their combination) that the animals had never experienced before. These results indicate that rats spontaneously perceive different views/appearances of an object as similar (i.e., as instances of the same object) and argue for the existence of neuronal substrates underlying formation of transformation-tolerant object representations in rats.
Introduction
The visual system of humans and other primates has the remarkable ability to recognize objects despite tremendous variation in their appearance, due to changes in size, position, background, and viewpoint (Logothetis and Sheinberg, 1996; Ashbridge and Perrett, 1998; Tarr and Bülthoff, 1998; Edelman, 1999; Lawson, 1999; Wang et al., 2005; Kravitz et al., 2008). While this ability is central to human visual perception, the underlying brain mechanisms are poorly understood, and transformation-tolerant recognition remains a major challenge in the development of artificial vision systems (Riesenhuber and Poggio, 2000; Ullman, 2000; DiCarlo and Cox, 2007; Pinto et al., 2008). Arguably, this is a consequence of the formidable complexity of the primate visual system (Felleman and Van Essen, 1991; Tanaka, 1996; Rolls, 2000; Orban, 2008) and the relatively narrow range of experimental approaches that human and nonhuman primate studies allow. This has led some investigators to inquire whether the simpler and more experimentally accessible visual systems of rodents may serve as complementary models to nonhuman primates in the study of object vision (Minini and Jeffery, 2006; Zoccolan et al., 2009) and, more generally, of cortical processing of visual information (Niell and Stryker, 2008; Sawinski et al., 2009; Smith and Hausser, 2010; Gao et al., 2010; Niell and Stryker, 2010; Meier et al., 2011).
Evidence in favor of rodent-based approaches to the investigation of object vision has come from a recent study (Zoccolan et al., 2009), showing that pigmented rats can recognize objects despite size, viewpoint, and lighting variation. However, it remains unclear to what extent different views of an object appear perceptually similar to rats (as expected, if their visual system provided a truly transformation-tolerant representation of visual features) or, rather, are arbitrarily stored into the same category because of task demands. In the former case, the rat visual system would represent a general-purpose dictionary of visual features that is rich enough, and tolerant enough to variation, to support transformation-tolerant object recognition along several transformation axes (Riesenhuber and Poggio, 1999) (e.g., size and position), without the need of previously experiencing each object along each axis of variation. In the latter case, a set of perceptually unrelated (for the rats) object appearances would need to be artificially associated, in memory, to the same category (Miyashita, 1993), with some generalization of recognition obtained by extrapolating/interpolating around/between the trained views.
In this study, similarly to what has been done in human aftereffect and priming studies (Biederman and Cooper, 1992; Bar and Biederman, 1998; Suzuki and Cavanagh, 1998; Leopold et al., 2001; Afraz and Cavanagh, 2008; Kravitz et al., 2010), we used a priming paradigm to probe whether previously unseen appearances (or views) of two objects are perceived by rats as similar to the default object views learned previously by the animals. This paradigm revealed that rat recognition of visual objects is remarkably stable across a variety of transformation axes and variation ranges. This suggests that the rat visual system may serve as an excellent model to uncover the key computations underlying transformation-tolerant representation of visual objects.
Materials and Methods
Subjects
Twelve adult male Long–Evans rats (Charles River Laboratories) were used for behavioral testing. Animals weighted ∼250 g at the onset of training and grew to over 600 g. Rats were water restricted throughout the experiments, with each animal receiving 4–8 ml of pear juice as a reward during each training/testing session (ad libitum water was additionally available for 1 h after each session). All animal procedures were conducted in accordance with the National Institutes of Health, international, and institutional standards for the care and use of animals in research and after consulting with a veterinarian.
Behavioral rig and task
The training/testing apparatus consisted of an operant box that was equipped with: (1) a 21.5 inch LCD monitor (Samsung 2243SN) for presentation of visual stimuli, (2) an array of three stainless-steel feeding needles (Cadence Science) connected to three capacitive touch sensors (Phidgets 1110) for initiation of behavioral trials and collection of responses, and (3) two computer-controlled syringe pumps (New Era Pump Systems NE-500), connected to the left and right feeding needles, for automatic liquid reward delivery. A 3 cm diameter hole in one wall of the box allowed the animal to extend its head outside the box and frontally face the monitor, ∼30 cm in front of the rat's eyes.
Rats were trained in a visual object recognition task, whose structure slightly varied according to the experimental phases (see a detailed description in the following sections). In its most basic form (Phase 1), the task required the animals to discriminate between two target objects. Rats were divided in two groups of six, and each group was trained to discriminate a specific object pair (both object pairs are shown in Fig. 1a). As shown in Figure 1c, rats learned to interact with the sensors' array to trigger stimulus presentation (by licking the central sensor), to then wait for the stimulus to be displayed on the monitor, and finally to report the identity of the presented object (by licking either the left or right sensor). In the case of correct response, reward was delivered, and a reinforcement tone was played. An incorrect choice yielded no reward and a 1–3 s time-out (during which a failure tone sounded and the monitor flickered from black to middle gray at a rate of 15 Hz).
Figure 1.

Visual stimuli and behavioral tasks. a, The default views of the two pairs of visual object prototypes that rats in our two experimental groups (A and B) were trained to discriminate during Phase 1 of the experiment. b, The two sets of morph objects (resulting from linearly interpolating each pair of object prototypes) that the two groups of rats were required to categorize during experimental Phases 2 and 3. c, Schematic of the object discrimination task in which rats were trained during Phase 1 of the experiment. By licking the central touch sensor, rats prompted presentation of one of the object prototypes (a) and learned to lick either the left or the right feeding needle to obtain reward, depending on the identity of the prototype. When, in Phase 2 of the experiment, rats were trained to categorize the morph objects (b), the task was the same, but the test objects were randomly sampled along the morph line. Rats also performed this task in regular trials of experimental Phase 3. d, Schematic of the object discrimination task that rats performed in prime trials of experimental Phase 3. By licking the central touch sensor, rats prompted presentation of the prime object, which was followed by a blank screen and then by a test morph object. Rats had to categorize the test object and never received any feedback about the identity of the prime. e, The five trial types rats were presented with during Phase 3 of the experiment. In each trial the animal had to report the identity of the test morph object.
In later phases of the experiment (see Experimental design, below), the regular trials described above were interleaved with prime trials, in which, after triggering stimulus presentation, rats were presented with a briefly flashed prime object (for ∼50 ms), followed by a blank interstimulus interval (ISI) and then by a test object (Fig. 1d). Rats had to correctly identify the test object and received reward and feedback only for responses given after presentation of the test. Responses given after presentation of the prime object (i.e., before the test was presented) aborted the trial, with no feedback ever provided to the animal about the identity of the prime itself.
Visual stimuli
Each rat was trained to discriminate a pair of four-lobed or five-lobed visual objects (named “object prototypes” in the following). These objects were renderings of three-dimensional models that were built using the ray tracer POV-Ray (http://www.povray.org/). Two pairs of object prototypes were built (see Fig. 1a). Rats were divided in two groups of six (named Groups A and B in the following) and, during Phase I of our experiment, each group was trained to discriminate one of the object pairs. Object prototypes within each pair were built so that, when rendered at the same in-depth rotation (Fig. 1a, default, frontal views), their images were approximately equal in height, width, and area. All objects were rendered against a black background.
To test rats' discrimination abilities along a continuum of smoothly varying shapes (Phase 2 of our experiment), the object prototypes within each pair were blended in different proportions to obtain two morph lines, i.e., continua of morph objects (see Fig. 1b). Each morph line was built by linearly interpolating the parameters defining the lobes of the first prototype with the parameters defining the corresponding lobes of the second prototype.
Each object's default (initial) size (during Phases 1 and 2 of the experiment) was 35° of visual angle, and its default position was the center of the monitor (which was horizontally aligned to the position of the rat's head). Stimuli were presented on a 21.5 inch Samsung 2243SN monitor (1920 × 1080 pixel resolution; 60 Hz refresh rate; 5 ms response time; 300 cd/m2 maximal brightness; 1000:1 contrast ratio).
Experimental design
Phase 1
Initially, the two groups of six rats were trained to discriminate the default views of the two object prototypes that were assigned to each group (see Fig. 1a). Rats that, within 4 weeks from the start of the training, achieved >70% correct discrimination were admitted to the next phase.
Phase 2
Rats in the two groups were trained to categorize the objects along the morph line that was assigned to each group (see Fig. 1b), based on whether a morph object was closer to one morph line extreme or to the other (i.e., to one prototype or to the other). The totally ambiguous object resulting from blending the two prototypes in equal proportions (i.e., the 50% morph object in the middle of the morph line) was randomly assigned, in each trial, to either prototype. The animals were gradually exposed to morph objects that were increasingly dissimilar from the prototypes they had learned in Phase 1 (i.e., further away from the extremes of the morph line) by using an adaptive staircase procedure. If the rat performance in the last 10 trials was >70% correct, the range of morph levels presented to the animal was extended toward the center of the morph line (in steps of 5%), making the task harder. Vice versa, if the performance was <60%, such a range was reduced, making the task easier. At the end of the staircase training, the animals' performance was assessed over the course of two to four additional sessions by uniformly sampling objects along the morph line (see Fig. 2). Rats that achieved >70% correct discrimination on both morph line extremes were admitted to the next phase.
Figure 2.

Object categorization along continuous shape dimensions. a, The black dots show the psychometric curves (i.e., the fraction of times a morph object was classified as being more similar to the 100% morph prototype) that were obtained for two example rats (one for each experimental group) at the end of experimental Phase 2 (see Materials nad Methods). The solid lines show the corresponding psychometric functions (i.e., the best fits to the measured fractions of 100% morph responses using modified error functions; see Material and Methods). b, Psychometric functions obtained for all the rats of both experimental groups that were tested at the end of experimental Phase 2. Black and gray lines indicate, respectively, rats that did and did not achieve >70% correct discrimination on both morph line extremes.
Phase 3
This was the main experimental phase, in which rats were tested with both regular trials (see Fig. 1c) and prime trials (see Fig. 1d). Different kinds of prime trials were built and randomly interleaved with the regular trials; namely, after triggering the stimulus presentation rats could be presented with the following conditions (see Fig. 1e).
For regular trials (no prime), a test morph object was presented for 800 ms after a blank interval of 115.5 ms (see Fig. 1e, left). These trial types represented 6% of the trials shown in each daily session during the whole duration of Phase 3.
For prime trials, an image (acting as a prime) was shown for 49.5 ms, followed by a blank interstimulus interval (for 66 ms), and then by a test morph object (for 800 ms; see Fig. 1e, second to fourth subpanels). Four different kinds of prime trials were built, depending on the identity of the prime.
Default primes.
The default view of one of the object prototypes (i.e., either the 0% or the 100% morph object) was used as a prime. These trial types represented 14% of the trials shown in each daily session during the whole duration of Phase 3.
Transformed primes.
A novel appearance of the object prototypes (e.g., a rotated version of the 0% prototype) was used as a prime. Sixteen different appearances of the prototypes were tested sequentially over the course of 4 months. Each appearance was tested for 1 week (5–6 d), before switching to the next one. During each week, 70% of the trials shown in each daily session were used to test a given novel appearance of the two prototypes.
Fifty percent morph prime.
The totally ambiguous 50% morph object (at the center of the morph line) was used as a prime. These trial types represented 5% of the trials shown in each daily session during the whole duration of Phase 3.
Noise mask prime.
A noise mask was used as a prime. The mask was either a scrambled version of the 50% morph object or a white noise patch. These trial types represented 5% of the trials shown in each daily session during the whole duration of Phase 3.
The regular trials, as well as the 50% morph and noise mask prime trials, served as control trials; that is, they were used to obtain reference psychometric curves, against which the effect of using the default or transformed prototypes as primes could be measured. Given that each of such control trials represented only 5–6% of the total number of trials recorded in each daily session, trials from 3 consecutive weeks were pooled to build reference psychometric curves (Fig. 4a, black dots). Such curves were compared to the psychometric curves obtained from the transformed prime trials (see above) collected in the middle week (Fig. 4a, colored dots). All the default prime trials and control trials collected during the whole duration of Phase 3 were used to assess the effect of priming produced by the default views of the object prototypes (i.e., to obtain the data shown in Figs. 3, 6a).
Figure 4.
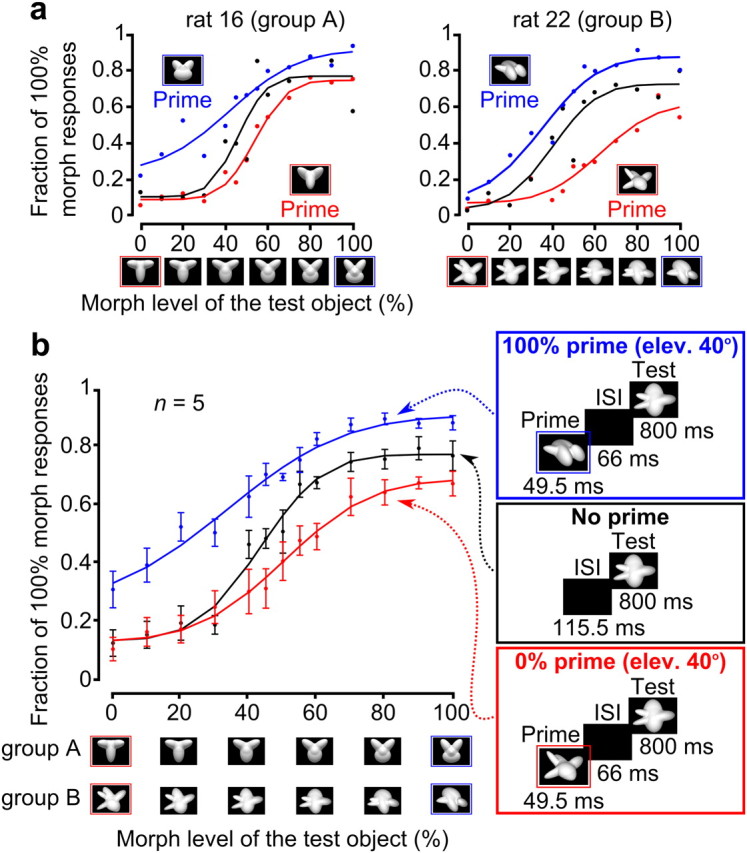
Priming produced by novel views of the object prototypes. a, Psychometric curves (dots) and best fits through the data (lines) for the same two example rats shown in Figure 3a, obtained from control trials (black) and prime trials (blue/red), in which 40° elevation-rotated views of the prototypes were used as primes (insets; same color code as in Fig. 3). b, Group average psychometric curves (dots) of the five rats included in the group analysis (error bars indicate SEM) and best fits through the data (lines) obtained when 40° elevation-rotated views of the prototypes were used as primes. Same color code as in a. The insets show the regular (black frame) and prime (red/blue frames) trials from which the psychometric curves were obtained. The blue/red prime curves significantly differed from the black control curve according to a two-way ANOVA (main effect of prime vs regular trials; p < 0.001).
Figure 3.

Priming produced by the default views of the object prototypes. a, Psychometric curves (i.e., fraction of 100% morph responses) obtained for two example rats when no primes were used (black) and when the default views of the 0% (red) and 100% (blue) morph prototypes (shown in the red/blue framed insets) were used as primes. Data points (dots) are fitted by modified error functions (lines with corresponding colors). To quantify in a compact way the magnitude of priming, the difference between the psychometric curves obtained in regular and prime trials was computed (right, red and blue shaded areas). Such a difference was divided by the number of morph levels to yield the morph line average variation in the fraction of 100% morph responses shown in the inset (red and blue bars). b, Magnitude of priming (computed as in a) produced, for each individual rat, by the default views of the 0% (red bars) and 100% (blue bars) morph prototypes. Asterisks indicate whether the overall fraction of 100% morph responses was different in prime and regular trials, according to a binomial test (***p < 0.001; for details, see Material and Methods). The numbers above the bars indicate the identity of the rats that were tested in Phase 3. Thick-framed bars indicate rats for which a significant priming was produced by both object prototypes and which were therefore included in our group analysis.
Figure 6.

Magnitude of priming measured using different control conditions. a, b, The group average psychometric curves obtained when either the default views (a) or the 40° elevation-rotated versions (b) of the prototypes were used as primes (in red and blue) are compared to the control curves (in black) obtained when the noise mask was used as a prime. Insets, Prime trials from which each curve was obtained. c, d, The bars show the group average magnitude of priming produced by all tested prototype appearances (as in Fig. 5c) when the psychometric curves obtained from noise mask (c) or 50% morph (d) prime trials were used as control curves. Symbols, asterisks, and error bars have the same meaning as in Figure 5c.
Phase 4
In this phase, rats were trained/tested at invariantly recognizing the 16 transformed views of object prototypes that had been used as primes during Phase 3. Each prototype appearance was presented in regular trials, and the animals were rewarded for correctly reporting the identity of the prototype (as shown in Fig. 1c,e, left, but with the transformed views of the prototypes used as test objects). Trials with different prototype appearances were randomly interleaved.
All experimental protocols (from visual stimuli presentation to collection of behavioral responses) were implemented using the freeware software package MWorks (http://mworks-project.org/).
Data analysis
To quantify rat recognition behavior, we built psychometric curves reporting the fraction of times a subject classified any tested morph object as being more similar to the prototype corresponding to the 100% morph level. To help visualizing the shape of such curves, they were fitted (using the least square method) by the following modified error function:
 |
where erf is the error function, θ is a vertical bias parameter, λ is a squeeze factor, μ is a threshold, and σ is a slope parameter. Such a fitting function was used only to help visually compare the psychometric curves obtained in the regular and prime conditions (Figs. 3, 4, 6, compare black, red/blue lines). However, every quantitative analysis and statistical test presented in this study was performed over the measured fractions of 100% morph responses of the psychometric curves (Figs. 3, 4, 6, black dots, colored dots) and not on the fitting error functions.
To test whether the psychometric curves obtained in regular and prime trials were significantly different, we performed two kinds of analysis. At the level of individual rats (Figs. 3, 5a,b), to achieve maximal sensitivity, responses obtained for different morph levels were pooled, and the overall fraction of 100% morph responses was computed for both regular and prime trials. Then, a binomial test was run to assess whether the overall fraction of 100% morph responses in prime trials was significantly higher (100% morph used as a prime) or lower (0% morph used as a prime) than what expected given the overall probability of responding “100% morph” in regular trials. The significance of the difference between the group average psychometric curves (Figs. 4b, 6a,b) obtained for regular and prime trials was assessed by running a two-way ANOVA with the morph level and the trial type as factors and testing for a main effect of the latter. Analyses were run separately for the 0 and 100% morph primes; i.e., in the ANOVA, the factor corresponding to the trial type had two levels: regular versus either the 0 or 100% prime. Finally, the significance of the group average variation in the fraction of 100% morph responses (Figs. 5c, 6c,d) was assessed by a one-tailed unpaired t test.
Figure 5.

Magnitude of priming produced by all tested appearances of the object prototypes. a, The bars show the morph line average variation in the fraction of 100% morph responses (i.e., as in Fig. 3b) for each tested transformation of both object prototypes used for Group A (red and blue bars refer, respectively, to the 0% and 100% morph prototypes). Data for the two rats of Group A included in the group analysis are shown. b, Same as in a, but with data referring to the three rats of Group B included in the group analysis. In both a and b, the picture above/below each bar shows the prototype appearance that produced the priming indicated by the bar. Asterisks indicate whether the overall fraction of 100% morph responses was different in prime and regular trials, according to a binomial test (*p < 0.05; **p < 0.01; ***p < 0.001; for details, see Material and Methods). Note that for one of the rats in Group A (Rat 23; b, bottom), three transformations could not be tested (these are marked by a cross). c, Group average variation in the fraction of 100% morph responses. For each transformation, data were averaged across all five rats and across both prototype identities (i.e., each gray bar in c resulted from averaging all the red and blue bars in the corresponding positions of the plots shown in a and b). Therefore, each bar shows the average of n = 5 × 2 = 10 data points, with the exception of the bars marked with the diamond symbol, in which n = 8 (since no data from Rat 23 were available for those conditions; b, bottom plot). Error bars indicate SEM. Asterisks indicate whether the average variation in the fraction of 100% morph responses was significantly higher than zero, according to a one-tailed unpaired t test (*p < 0.05; **p < 0.01; ***p < 0.001).
Stimulus analysis
To investigate whether rat invariant recognition could be explained by some low-level visual properties of the tested objects, we quantified the similarity between the different appearances of each object prototype in three different ways.
(1) To rule out that the different appearances of a given object prototype could be perceived as similar (and distinguished from the appearances of the other prototype) simply based on their overall brightness (Minini and Jeffery, 2006), we computed the normalized luminosity of the images produced by each appearance of both object prototypes (see Fig. 9a,b). This was achieved by computing the ratio between the sum of all the pixel intensities of a given object appearance and the sum of all the pixels intensities of an isoluminant monitor at full brightness. This metric is a measure of what fraction of the maximal luminosity obtainable from the monitor is produced by a given object appearance.
Figure 9.

Quantification of the image-level similarity between the prototype appearances in our stimulus sets. a, b, Normalized luminosity of the images (for details, see Materials and Methods) produced by all tested appearances/views of the two object prototypes in both stimulus sets (dark and light gray bars refer, respectively, to the prototypes with corresponding frame shown in the insets). The horizontal dashed lines indicate the luminosity of the least bright of the default views in each prototype pair. c, e, Average within- and between-prototype pixel-level differences for the prototype appearances of each stimulus set (for details, see Materials and Methods). d, f, Average within- and between-prototype image differences computed over the responses of a population of simulated V1 simple cells (i.e., Gabor filters) to our sets of prototype appearances (for details, see Materials and Methods). Error bars indicate SEM. The p values report the significance of the difference between each pair of distances according to a two-tailed paired t test. The left and right halves of the figure (separated by the vertical dotted line) refer to the stimulus sets used, respectively, for rat's experimental Groups A and B.
(2) Similarly to what done in a previous study (Zoccolan et al., 2009), we assessed how much image variation was obtained, at the pixel level, by either changing the appearance of a given object prototype (e.g., changing its size, position, rotation, etc.) or, instead, by comparing matching views of the two prototypes (e.g., same size, position, azimuth, etc.). This was achieved by computing the following metrics. Given a prototype in a particular appearance (e.g., a size–azimuth conjunction), we computed (1) the within-prototype image distance, i.e., the average of the pixelwise Euclidean distances between this prototype appearance (image) and all other appearances of the same prototype that were used in our priming experiment, and (2) the between-prototype image distance, i.e., the pixelwise Euclidean distance between this prototype appearance and the matching appearance of the other prototype (i.e., the other prototype at the same size and azimuth). Both metrics were computed for every object appearance to obtain two sets of values that could be compared pairwise using a paired t test (see Fig. 9c,e).
(3) Similarly to what done in a previous study (Zoccolan et al., 2009), we measured the within-prototype and between-prototype image distances (see above) in the representational space of a population of simulated V1 simple cells. The V1 simple cells were simulated using a bank of Gabor filters with orientations, spatial frequencies, and receptive field (RF) sizes matching those reported for rat primary visual cortex (Girman et al., 1999) and RF centers tiling the visual field. More precisely, we built an array of Gabor filters resulting from all possible combinations of three RF sizes (10, 20, and 30°), 12 orientations (evenly spaced around the clock); two phases (0 and π), and 10 spatial frequencies, ranging from 1 to 10 cycles per RF size and resulting in a range of 0.03–1 cycles per degree. This array of Gabor filters was replicated every 5° in both the vertical and horizontal directions over the 60 × 40° span of visual field occupied by our image stimuli. The response of a Gabor filter to a given image was computed as the dot product of the filter and the image patch with the same visual field location and size. To simulate the nonlinear response properties of V1 simple cells (i.e., saturation, luminance and contrast normalization, and nonnegative firing rates), both the filter and the image patch were normalized to 1 before computing their dot product, and negative responses were clipped to 0. For each prototype appearance, we computed its representation in the space of the simulated V1 population, and we obtained the within-object and the between-object image differences in this space, using the same rationale described in point 2 above. This gave two sets of values that could be compared pairwise using a paired t test (see Fig. 9d,f).
Results
The goal of this study was to investigate to what extent different appearances (or views) of a visual object are spontaneously perceived by rats as similar, i.e., as instances of the same object. This required devising a behavioral paradigm in which rats would report the degree of similarity between different views of an object only indirectly (i.e., without being explicitly required to do so and without receiving any feedback about the correctness of their judgment). To this aim, we trained two groups of rats in a visual object recognition task that consisted of four phases. During the initial phase, each group was trained to discriminate between the default views of two object prototypes (Fig. 1a). During the second phase, each group was required to categorize a continuum of morph objects resulting from blending the two object prototypes (Fig. 1b). During the third (and main) phase, an object prototype (either the default or a novel view) was briefly presented as a prime (for 49.5 ms), immediately before a test morph object (Fig. 1d). This allowed us to estimate the perceived similarity between the prototype and the morph objects by measuring whether (and how much) the recognition of the morph objects was affected (e.g., biased) by the presentation of the prototype/prime. Finally, in the last phase of the experiment, the rats were explicitly required to recognize the transformed views of the prototypes that had been used as primes during the previous phase.
Object categorization along continuous shape dimensions
During the initial experimental phase, 12 Long-Evans rats were divided into two groups of six (Groups A and B in the following), and each group was trained to discriminate a pair of visual object prototypes (Fig. 1a). Details about the training/testing apparatus and the behavioral task are provided in Material and Methods and Figure 1c. Rats were trained for 4–8 weeks until most of them (four of six in Group A and three of six in Group B) achieved >70% correct discrimination. These animals entered experimental Phase 2 (see below). Rats that did not meet this performance but nevertheless achieved >50% correct discrimination (one of six in Group A and two of six in Group B) were also admitted to the next experimental phase in the hope that further training could improve their performance.
The animals admitted to the second experimental phase were trained to categorize a continuous shape dimension (or morph line) that was specific for each group (Fig. 1b) and was obtained by blending in different proportions the two object prototypes that each animal had learned to discriminate during Phase 1 (see Material and Methods). Specifically, the animals had to indicate what prototype (i.e., morph line extreme) was closer (i.e., more similar) to the morph object that was presented in any given trial. The rats were gradually exposed to morph objects that were increasingly dissimilar from the prototypes using an adaptive staircase procedure (see Material and Methods).
After ∼20 d of training, most rats succeeded at reaching the center of the morph line (i.e., the totally ambiguous 50% morph level resulting from blending the two prototypes in equal proportions). Consequently, the staircase training was stopped and the animals' performance was assessed over the course of two to four additional sessions by uniformly sampling the objects along each morph line. This yielded the psychometric curves shown in Figure 2a (black dots), which report, for two example rats, the fraction of times a morph object was classified as being more similar to the prototype corresponding to the 100% morph level. These curves were fitted by sigmoid functions (see Materials and Methods) to help visualize their shape along the morph axis (Fig. 2a, solid lines). Most of the rats (four of six in Group A and three of six in Group B) achieved >70% correct discrimination on both morph line extremes, with a smooth, sigmoid-shaped psychometric function along the morph axis (Fig. 2b, black lines). These animals were admitted to the next experimental phase. The remaining rats, which did not achieve >70% correct discrimination on both morph line extremes and had a flat, or extremely asymmetric, psychometric function (Fig. 2b, gray lines) were excluded.
Priming produced by the default appearances of the object prototypes
Rats admitted to the third (and main) experimental phase were tested in a visual task in which, after triggering the stimulus presentation, an animal could be presented with either (1) a regular trial, i.e., a blank screen followed by a test morph object (i.e., an object that was randomly sampled along the morph line; Fig. 1e, first subpanel), or (2) a prime trial, i.e., a briefly flashed image acting as a prime, followed by a blank, and then by a test morph object (Fig. 1e, second to fourth). In prime trials, rats had to correctly identify the test object and received reward and feedback only for responses given after presentation of the test (Fig. 1d). Responses given to the prime (i.e., before the test was presented) aborted the trial, with no feedback ever provided to the animal about the identity of the prime.
Four different kinds of prime trials were built and randomly interleaved with the regular trials (Fig. 1e; for details, see Materials and Methods). In this section, we are concerned with default prime trials, in which the default appearances of the object prototypes (i.e., the morph line extremes; Fig. 1a,b) were used as primes (Fig. 1e, default prime). As done in the previous section (Fig. 2), rat responses were quantified by building psychometric curves for the fraction of 100% morph responses, i.e., by measuring the fraction of times a rat classified any tested morph object as being more similar to the prototype corresponding to the 100% morph level. Comparing the psychometric curves obtained for regular and default prime trials allowed us to assess whether rats' classification of the morph objects was primed by previous exposure to the default views of the object prototypes.
Typically, the default views of both object prototypes, when shown as primes, biased the animals' responses toward the identity of the prototypes themselves; that is, as shown for two example rats in Figure 3a, the psychometric curve shifted/compressed upward when the prototype corresponding to the 100% morph level was used as a prime (compare blue and black curves), while it shifted/compressed downward when the prime was the 0% morph prototype (compare red and black curves). Such a bias to classify the morph objects according to the identity of the prime was widespread across the morph line, with a distinctive trend that was preserved across most rats and is likely consistent with a form of response priming (see Discussion); namely, the more dissimilar a morph object was from the prime, the larger was the observed priming. For instance, when the prototype corresponding to the 0% morph level was used as a prime, the magnitude of the priming was maximal for objects near the 100% morph level and minimal (but typically still larger than zero) for objects near the 0% morph level (Fig. 3a, compare red, black curves). Given that the priming was observed along the whole morph line, to quantify in a compact way its magnitude, we computed the difference between the psychometric curves obtained in prime and regular trials (Fig. 3a, right, red and blue shaded areas) and then averaged across all morph conditions. The resulting morph line average variation in the fraction of 100% morph responses (Fig. 3a, inset, red and blue bars) provided a measure of how effective a prototype default view was at biasing a rat's response toward the identity of the prototype itself.
As shown in Figure 3b (thick-framed bars), for most rats (two of four in Group A and three of three in Group B, for a total of five of seven animals), the default views of both object prototypes, when shown as primes, strongly and significantly altered the proportion of 100% morph responses in a direction that was consistent with the identity of the primes (p < 0.001, binomial test; see Materials and Methods); that is, when the prototype corresponding to the 100% morph level was used as a prime, the fraction of 100% morph responses increased (thick-framed blue bars), while it decreased when the prime was the 0% morph prototype (thick-framed red bars). All of the group analyses shown in the following sections (Figs. 4b, 5) are based on these five rats.
For the two remaining rats in Group A (Fig. 3b, thin-framed bars), the priming was observed only for the prototype corresponding to the 0% morph level (red bars), while the 100% morph prototype was either not effective at altering the fraction of 100% morph responses (rat 18) or changed it in the same direction as the 0% morph prototype did (Rat 15). These animals were excluded from further analysis, since the goal of measuring the priming produced by the default views of the prototypes was to establish a baseline against which to compare the priming produced by novel prototypes' appearances (see the following section).
Priming produced by novel appearances of the object prototypes
Trials in which the default views of the prototypes were used as primes (Fig. 3) served to establish the baseline amount of priming produced by object appearances that the rats had been explicitly trained to recognize. Our main goal, however, was to assess whether any priming would be produced (and how large) by transformed versions of the prototypes (e.g., scaled, translated, in-depth rotated, etc.) that rats had never experienced before and were never required to recognize. To this aim, in a large fraction of prime trials, novel appearances/views of the prototypes were used as primes (Fig. 1e, transformed prime trials). A total of 16 different views were tested over the course of 4 months, approximately one new view per week (for details, see Materials and Methods). For instance, when 40° elevation-rotated versions of the two prototypes were used as primes (Fig. 4, red/blue framed insets), a strong and significant priming was still observed both at the level of single rats (p < 0.001, binomial test; Fig. 4a) and group averaged psychometric curves (p < 0.001, main effect of prime vs regular trials in a two-way ANOVA; Fig. 4b).
To provide a complete overview of the priming produced by the transformed object prototypes, we report in Figure 5, a and b, the morph line average variation in the fraction of 100% morph responses (i.e., the same as Fig. 3b, red and blue bars) for each tested prototype appearance and each rat included in the group analysis (i.e., two rats in Group A and three rats in Group B; see previous section; Fig. 3b). Remarkably, for each rat, a significant priming was observed for most prototype appearances (p < 0.05, binomial test). Moreover, for most transformations, both the 0% and the 100% object prototypes typically succeeded at producing an observable (often significant) priming (i.e., a positive blue and a negative red bar were obtained), although, in some cases, with a quite different magnitude. Such a different priming magnitude produced by equally transformed prototypes, or by the same prototype appearance in different animals (e.g., compare the blue bars obtained for the position changes in Rats 21 and 22), is not surprising. In fact, the amount of priming is a measure of the perceived similarity between the transformed and the default prototype appearances (see Discussion), and such a similarity will strongly depend on both the shape/structure of the prototypes and the object recognition strategy of each rat (e.g., what object features each rat will rely upon to correctly recognize the default prototype views). This makes all the more remarkable the fact that, in the large majority of cases (Fig. 5a,b, 112 of 154 bars), the transformed object prototypes produced a significant priming. This means that, despite the shape differences among the four tested prototypes and the potentially different recognition strategies used by the animals, the transformed and default prototype appearances were, in general, robustly and consistently perceived as similar.
To obtain a group average measure of the priming pattern across the tested transformations and better highlight potential trends in the data, the variation in the fraction of 100% morph responses obtained for each transformation was averaged across all five rats and across both prototype identities (i.e., all red and blue bars corresponding to a given position in the plots of Fig. 5a,b were averaged). Consistently with the priming pattern observed at the level the individual rats/prototypes (Fig. 5a,b), a significant priming (p < 0.05, one-tailed unpaired t test) was found for almost all tested transformations (Fig. 5c), often with a magnitude comparable to that produced by the prototypes' default views (Fig. 5c, compare the first bar with the other bars). In particular, although the priming magnitude was a decreasing function of the transformation amplitude (e.g., the larger the azimuth rotation, the smaller, but still significant, the observed priming), the prototypes resulted effective at biasing rats' response when undergoing relative extreme in-depth rotations (e.g., +60° and +90° azimuth rotations), large size changes (i.e., from 35° to 15° of visual angle), and combinations of both transformations (e.g., prototypes scaled down to 25° of visual angle and azimuth rotated +40° or +60°). This indicates that rats spontaneously perceived such transformed versions of the object prototypes as similar to the prototypes' default views (although to a different extent, depending on the transformation amplitude) without the need of any explicit training (see Discussion). And this happened despite the large variation in the prototypes' appearance that some such transformations produced, at the level of overall luminosity, pixelwise similarity, and Gabor-wise (i.e., simulated V1-wise) similarity (see Fig. 9). On the other hand, transformations that involved combinations of position changes (or in-plane rotation) and size changes produced a smaller priming, in some cases not significant (Fig. 5c, three rightmost bars), indicating that some of these appearances were not consistently perceived by the rats as instances of the prototypes.
These findings were confirmed when the priming produced by the default and transformed views of the prototypes was measured against control curves obtained from 50% prime and mask prime trials (i.e., trials in which either the totally ambiguous object in the middle of the morph line or a noise mask were used as primes; Fig. 1e, 50% prime and Mask prime; see also Materials and Methods). Again, a robust priming was observed both at the level of group average psychometric curves (Fig. 6a,b) and group average variation in the fraction of 100% morph responses (Fig. 6c,d). More crucially, the priming measured against control curves obtained from regular trials and 50% prime or mask prime trials was very similar across the tested prototype appearances (compare Figs. 5c, 6c,d).
Effect of priming on the reaction time
It is well known that priming can affect reaction times of behavioral responses besides altering recognition performance (Biederman and Cooper, 1991, 1992; Schmidt, 2002; Vorberg et al., 2003). In particular, in the case of response priming, subjects are typically slower to respond to a test stimulus when the prime and test stimuli are incongruent (i.e., require competing motor actions), compared to the case in which they are congruent (i.e., require the same motor action) (Schmidt, 2002; Vorberg et al., 2003). Such a trend was found in our data, when reaction times in congruent prime trials (i.e., trials in which the prime and the test belonged to the same half of the morph line) were compared to reaction times in incongruent prime trials (i.e., trials in which the prime and the test belonged to opposite halves of the morph line). As shown in Figure 7a for the case of the default prime trials, despite a relatively large intersubject variability in the reaction time magnitude, reaction times in incongruent trails were systematically higher than in congruent trials, and such a difference was highly significant at the group level (p < 0.001, main effect of congruent vs incongruent trials in a two-way ANOVA). Moreover, the group average reaction time computed for control trials in which the noise mask was used as a prime (Fig. 7b, light gray bar) sat halfway between the average reaction times of congruent and incongruent prime trials (Fig. 7b, white and dark gray bars), thus showing a trend that is suggestive of a form of response priming (Schmidt, 2002).
Figure 7.

Effect of priming on the reaction time. a, Reaction times for the rats included in the group analysis. Reaction times were computed for correct trials only, when the default views of the object prototypes were used as primes. Trials were divided into congruent (squares) and incongruent (circles), depending on whether the prime and the test belonged to the same or to opposite halves of the morph line (only morph objects located at the extreme at the morph line, i.e., corresponding to morph levels 0, 10, 90, and 100%, were taken into account). Symbols report the trial average reaction time for each rat (error bars indicate SEM). Reaction times in incongruent trials were significantly higher than reaction times in congruent trials (p < 0.001, main effect of congruent vs incongruent trials in a two-way ANOVA). b, The group average reaction time computed for congruent, incongruent, and control trials in which the noise mask was used as a prime. c, The magnitude of priming (i.e., the group average variation in the fraction of 100% morph responses shown in in Fig. 5c) was significantly correlated (r = 0.8; p < 0.001, two-tailed t test) with the reaction time difference between congruent and incongruent trials. The scatter plot shows data referring to all 16 tested appearances of the object prototypes (empty circles highlight data for the default and 40° elevation-rotated prototype appearances).
This difference between the reaction times in congruent and incongruent trials was also observed for every prototype appearance that was used as a prime in the transformed prime trials. Crucially, such a difference was positively and significantly correlated (r = 0.8; p < 0.001, two-tailed t test; Fig. 7c) with the magnitude of priming observed in the recognition behavior (i.e., with the group average variation in the fraction of 100% morph responses shown in Fig. 5c). This consistency between the patterns of priming observed at the level of reaction time and recognition behavior adds robustness to our assessment of the perceived similarity between the default and transformed views of the object prototypes.
Relationship between priming magnitude and recognition performance
In the fourth and last phase of the study, rats' capability to recognize the transformed appearances of the prototypes was explicitly tested. Each prototype appearance that had been used as a prime in the priming experiment (Fig. 5) was presented in regular trials, and the animals were rewarded for correctly reporting the identity of the prototype (as shown in Fig. 1c,e, first subpanel, but with the transformed views of the prototypes used as test objects). Only three rats of the five that had been included in the group analyses of the priming effect (Fig. 3b) could be tested in this last experimental phase (the remaining two had to be killed).
The goal of this experiment was twofold. On the one hand, we wanted to measure the relationship between the magnitude of priming produced by the tested prototype appearances and the performance of the rats at recognizing them. On the other hand, we wanted to assess whether such a relationship was preserved over the course of testing the animals in the invariant recognition task, to understand whether learning could significantly enhance rats' performance. To this aim, rats' group average performance at recognizing every transformed prototype appearance was measured in consecutive blocks of 10 trials.
As shown in Figure 8a, when the first 10 trials were considered (early trials in the following), rats' performance varied considerably across the tested prototype appearances, ranging from being barely above chance for some transformed prototype views (light green and blue curves) to being 90% correct for some others (red curve). More remarkably, a trend could be observed, with the performance increasing as a function of the number of trials performed by the animals, especially for those prototype appearances that were the hardest to be correctly recognized in early trials (Fig. 8a, light green and blue curves). Visually, the spread of the performance values became much narrower over the course of the training (Fig. 8a, compare the initial and final values of the curves). As a result, rats' performance in the last block of 10 trials available for each prototype appearance (i.e., either the eight or ninth block; late trials in the following) was similarly high across most of the tested appearances.
Figure 8.

Relationship between priming magnitude and recognition performance. a, Group average performance of three rats (of the 5 animals originally included in the group analysis) at recognizing the prototype appearances that had been used as primes in the priming experiment. The plot shows the trend of the performances as a function of the number of trials performed by the animals (performances were computed in consecutive blocks of 10 trials). Colors highlight the performances obtained for five example prototype appearances. b, Bars show rats' group average recognition performance obtained in early trials (i.e., the first block of 10 trials; gray) and late trials (i.e., either the eighth or ninth block of 10 trials, depending on the tested prototype appearance; black). The asterisks indicate whether the performances were significantly above chance according to a one-tailed unpaired t test (*p < 0.05; **p < 0.01; ***p < 0.001). c, Relationship between rats' recognition performance and priming magnitude (i.e., the group average variation in the fraction of 100% morph responses shown in Fig. 5c, but including only the three rats that entered in the calculation of the group average performances) in early (gray circles) and late (black circles) trials (data refer to all 16 tested appearances of the object prototypes). In cases in which a black and gray circle overlapped, they were slightly displaced to make both of them visible. Performance and priming magnitude were significantly correlated in early trials (r = 0.58; p = 0.02, two-tailed t test) but not in late trials (r = −0.05; p = 0.86, two-tailed t test). Error bars indicate SEM.
A more quantitative comparison between performances observed in early and late trials is provided in Figure 8b. In early trials, most group average performances (gray bars) were ∼70% correct, although many did not reach significance according to a one-tailed t test with significance level set to 0.05. However, it should be considered that only three rats contributed to the group averages, thus reducing the statistical power to detect significance (e.g., p values corresponding to the first four gray bars in Fig. 8b were borderline with the significance level, ranging between 0.059 and 0.091). Other prototype appearances (typically those that were among the least effective at inducing priming; compare with Fig. 5c) were recognized with lower performances (close to 60% or lower), while still other appearances (typically those that were among the most effective at inducing priming; compare Fig. 5c) were recognized with a performance that was ∼80–90% correct and was typically significantly higher than chance. In late trials, such a variability of the performance values across the tested prototype appearances was not observed, since almost all performances (Fig. 8b, black bars) were close to 90% correct and significantly above chance, with no obvious relationship with the effectiveness of the prototype appearances at inducing priming. Overall, performances in late and early trials were significantly different according to a two-way ANOVA having as factors the transformation type and the trial type (p < 0.001, main effect of early vs late trials).
Finally, recognition performance and priming magnitude were directly compared by measuring their correlation, when performance was computed in early versus late trials. Rats' group average performance in early trials was positively and significantly correlated (r = 0.58; p = 0.02, two-tailed t test; Fig. 8c, gray circles) with the magnitude of priming observed in the previous experimental phase (i.e., with the group average variation in the fraction of 100% morph responses shown in Fig. 5c, but taking into account only the three rats that contributed to the group average performances), while no correlation was found when performance in late trials was considered (r = −0.05; p = 0.86, two-tailed t test; Fig. 8c, black circles).
Overall, these results indicate that rats, when faced with the challenge of recognizing previously unseen appearances of the prototypes, relied initially on the spontaneously perceived similarity between such appearances and the default ones they had originally learned (hence the correlation between recognition performance and priming magnitude in early trials). This enabled the animals to recognize most of the novel appearances, although with a performance that was significantly lower than what they achieved in late trials (after a considerable amount of training in the invariant recognition task), thus showing a significant impact of learning on enhancing rats' transformation-tolerant recognition (for a deeper analysis of the implications of this finding, see Discussion).
Quantification of the similarity among the prototype appearances in terms of low-level visual properties
The priming produced by the transformed views of an object prototype (Figs. 4–7) indicates that rats spontaneously perceived such views as similar to each other and to the previously learned prototype default view. To investigate whether this finding could be accounted for by some low-level visual properties of our stimulus set, we quantified the similarity between the tested views/appearances of each object prototype using different metrics.
First, to rule out that the different appearances of a given prototype could be perceived as similar (and distinguished from the appearances of the other prototype) simply based on their overall brightness (Minini and Jeffery, 2006), we computed the normalized luminosity of the images produced by each view of both object prototypes (see Materials and Methods). As shown in Figure 9, a and b, although the luminosity of the default views in a prototypes' pair is different (especially for Group A; Fig. 9a, leftmost bars), such a difference, in general, cannot explain the priming produced by the transformed views of the prototypes. In fact, in most cases, a given transformation of the prototypes (e.g., a given rotation or size change) generates appearances that, for both prototypes, are less bright than the least bright of their default views (i.e., cases in which both the dark and light gray bars in a pair are below the dotted line in Fig. 9a,b). Therefore, if rats judged object similarity simply based on their brightness, such appearances would both be perceived as similar to the same default prototype view (the least bright) and would alter rats' reaction time and recognition behavior in the same direction (e.g., red and blue bars in Fig. 5a,b would consistently go in the same direction, which is obviously not the case). In addition, in the case of Group B, the difference in the brightness of the prototypes is very small, and the identity of the brightest prototype in a pair is not preserved across the tested transformations. Overall, this rules out that rats could simply perceive the transformed views of the prototypes as similar to the default views, based on such a low-level visual property as overall image luminance.
Next, we checked whether the observed priming could be explained by the similarity among the tested prototype appearances at the level of pixel or Gabor filter representations (simulating, respectively, neuronal representations in rat retina and primary visual cortex). To this aim, we measured the average pixelwise distance between different appearances of each prototype (i.e., the within-prototype distance shown in Fig. 9c,e), and we compared it to the average pixelwise distance between matching appearances (e.g., same size, position, azimuth, etc.) of the two prototypes (i.e., the between-prototype distance shown in Fig. 9c,e). Similarly, we computed the within- and between-prototype image distances over the outputs of a bank of Gabor filters (spanning the typical spatial frequency and orientation sensitivity ranges found in rat V1) that were applied to the prototype appearances (see Fig. 9d,f). Details about the computations of these metrics are provided in Materials and Methods. As shown in Figure 9c–f, for both stimulus sets, in both the pixel and V1-like representations, the average image variation produced by changing the appearance of a given object prototype (within-prototype distance) was significantly larger (two-tailed paired t test) than the average image distance between matching views of the two prototypes (between-prototype distance). This shows that the similarity among the different appearances of a given prototype (as observed at the level of priming produced by such appearances) cannot easily be accounted for by their similarity in a simulated retina-like or V1-like neuronal representation. Rather, it is consistent with the existence of more transformation-tolerant object representations that are typical of higher-level cortical visual areas.
Discussion
This study investigated whether rat recognition of visual objects is tolerant with respect to the changes in object appearance produced by variation in object size, position, viewpoint, in-plane rotation, and their combination. By exploiting a priming paradigm, we measured to what extent novel appearances of two object prototypes (produced by the above-mentioned transformations) were spontaneously perceived by rats as similar to the prototypes' default views that the animals had learned previously. Our results show that most of the tested prototype appearances, when shown as primes, significantly altered rat recognition at the levels of both performance (Figs. 4–6) and reaction time (Fig. 7). This means that, in most cases, rats perceived the transformed and default prototype appearances as similar. This finding cannot simply be explained by some low-level visual properties of our stimulus sets. In fact, the tested prototype appearances were quite dissimilar in terms of their low-level visual features (Fig. 9). Therefore, rats did not trivially perceive the various views of a prototype as similar (or even identical) because of the lack of variation in the retinal images they produced. Rather, it is reasonable to assume that the different views of a prototype appeared to rats quite different in terms of their lower-level visual properties, but, critically, quite similar (as revealed by the observed priming) in terms of their higher-order, object-defining features (upon which rats spontaneously relied in the object discrimination task they performed). Overall, this strongly suggests that, along the hierarchy of rat visual areas (Espinoza and Thomas, 1983; Coogan and Burkhalter, 1993), a processing stage exists, in which different appearances of a visual object are represented by largely overlapping neuronal populations (see below), thus providing a robust substrate for transformation-tolerant object recognition.
Validity and implications of our findings
Psychophysics protocols relying on priming or adaptation aftereffects are powerful approaches that have been used extensively to investigate the nature of visual processing in the human brain (Wiggs and Martin, 1998; Clifford and Rhodes, 2005), including the neuronal substrates of invariant object recognition (Biederman and Cooper, 1991, 1992; Suzuki and Cavanagh, 1998; Bar and Biederman, 1998, 1999; Leopold et al., 2001; Afraz and Cavanagh, 2008, 2009; Kravitz et al., 2008, 2010). This is because, by measuring the effectiveness of a prime (or adapter) at altering the recognition of a test stimulus, it is possible to infer whether (and to what extent) the prime/adapter and the test are spontaneously perceived as similar. This, in turn, provides a measure of the overlapping between the neuronal representations of the prime/adapter and the test. Therefore, priming and adaptation aftereffect studies can disentangle the component of transformation-tolerant recognition that relies on spontaneously perceiving as similar different appearances of an object from the contribution of explicitly learning the associative relations among such object appearances. Mechanistically, this provides useful insight into the capability of visual object representations to support generalization of recognition to fully novel, never-before-experienced object appearances, which is the major computational feat that any biological or artificial recognition system has to face (Ullman and Soloviev, 1999; Riesenhuber and Poggio, 2000; Ullman, 2000). As an example, two recent studies (Afraz and Cavanagh, 2008; Kravitz et al., 2010) exploited adaptation and aftereffect paradigms to show that translation tolerance of face and object representations in human visual cortex is far more limited than commonly assumed.
Despite their widespread use in human vision studies (see previous paragraph) and in both behavioral and electrophysiological studies of monkey vision (Li et al., 1993; Kohn and Movshon, 2004; Leopold et al., 2006; Sawamura et al., 2006; McMahon and Olson, 2007; Verhoef et al., 2008; Liu et al., 2009; Müller et al., 2009; Kaliukhovich and Vogels, 2011), priming and adaptation aftereffect paradigms have rarely been used to study visual behavior of other species. This is unfortunate, because it is especially challenging, in animals, to dissociate the spontaneous generalization of recognition to previously unseen object appearances from the effect of learning such appearances over the course of probing recognition performance. To our knowledge, the present study is the first to overcome this issue by testing in a visual priming paradigm a rodent species. As such, our manuscript provides the most complete and robust evidence to date of the spontaneous generalization of recognition to novel object appearances in a nonprimate species. The implication of this finding is that the rat visual system must contain general-purpose banks of feature detectors that are tolerant to a wide range of image-level variations and automatically support transformation-tolerant object recognition along several transformation axes, without the need for explicitly learning the associative relations among all object appearances. However, this does not imply that, in general, visual associative learning mechanisms do not contribute to rat transformation-tolerant recognition.
As a matter of fact, our results, while showing that a significant priming (i.e., a bias in rat recognition) was produced by most of the transformed prototype views we tested, also show a strong modulation of the priming magnitude as a function of the magnitude of the tested transformations (Fig. 5c); namely, the largest is the variation in object appearance along a given transformation axis, and the smaller is the observed priming (Fig. 5c, compare the priming produced by increasing azimuth or size changes). Moreover, while relatively large viewpoint and size variations appear to be well tolerated by the rat visual system, tolerance to position changes is more limited, in agreement with some recent human studies (Afraz and Cavanagh, 2008, 2009; Kravitz et al., 2008, 2010).
In summary, the rat visual system, while spontaneously achieving an impressive amount of tolerance along a variety of transformation axes, is far from attaining complete invariance. On the other hand, when rats were explicitly required to recognize the transformed appearances of the prototypes, their performance increased significantly as a function of the number of performed trials (Fig. 8a,b). Moreover, in early trials, rats' performance over the tested prototype appearances was positively and significantly correlated with the magnitude of priming that such appearances produced during the priming experiment (Fig. 8c). This indicates that, in early trials, rat performance was mainly accounted for by the degree of spontaneously perceived similarity between the novel and the default prototype appearances, while, during the course of training, a fuller tolerance was gradually achieved by explicitly learning the associative relations among the different appearances of each prototype (Miyashita, 1993). This suggests that also for rats, as proposed for primates (Logothetis et al., 1994; Bülthoff et al., 1995; Tarr and Bülthoff, 1998; Lawson, 1999; Afraz and Cavanagh, 2008; Kravitz et al., 2008, 2010) and successfully implemented in many leading artificial vision systems (Poggio and Edelman, 1990; Riesenhuber and Poggio, 1999; Ullman and Soloviev, 1999; Ullman, 2007), transformation-tolerant recognition is achieved by combining the limited (but automatic) tolerance granted by banks of partially tolerant feature detectors with the fuller tolerance obtained by interpolating between stored representations of multiple, independently learned object views.
Finally, it is worth emphasizing that the strength of our conclusions does not depend on knowing what neuronal/cognitive processes underlie the observed priming. The variation in the fraction of 100% morph responses produced by the prime objects in our experiments (Figs. 4–6) could alternatively be a form of perceptual priming (Wiggs and Martin, 1998) [in which the neuronal representation of a test morph object is affected by previous exposure to the prime through neuronal firing adaptation or repetition suppression mechanisms (Sawamura et al., 2006; McMahon and Olson, 2007; Kaliukhovich and Vogels, 2011)] or, more likely, a form of response priming (Schmidt, 2002; Vorberg et al., 2003) (in which the behavioral/motor response implicitly associated to the prime competes with the response associated to the test morph object in executive brain areas). In either case, no priming could have taken place if the transformed views of the object prototypes were not perceived as similar to the default views learned by the animals, i.e., if the neuronal representations of the transformed views would not automatically (i.e., without the need of training/learning) and largely overlap with the representations of the default views.
Overall, our study provides robust evidence of transformation-tolerant object recognition in rats, while, at the same time, probing its limitations and assessing its enhancement through learning. The agreement between our findings and those of several primate studies is striking: rats and primates appear similarly good at spontaneously tolerating viewpoint variations [at least when required to discriminate objects that are not too similar (Logothetis et al., 1994; Yamashita et al., 2010)] and similarly limited in their spontaneous tolerance to position changes (Afraz and Cavanagh, 2008; Kravitz et al., 2008, 2010), with both species showing a similar enhancement of recognition when explicitly trained with multiples views of the target objects (Logothetis et al., 1994). Given the powerful array of experimental approaches available in rats [e.g., two-photon imaging (Sawinski et al., 2009) and patch-clamp recordings (Lee et al., 2006) in freely moving animals], our findings suggest that the rat can become a valuable model system (possibly complementary to the nonhuman primate) in the invasive investigation of the neuronal mechanisms underlying transformation-tolerant recognition.
Footnotes
This work was supported by an Accademia Nazionale dei Lincei–Compagnia di San Paolo grant and by a Programma Neuroscienze grant from the Compagnia di San Paolo. We thank A. Afraz, A. Akrami, A. Benucci, M. E. Diamond, and H. Op de Beeck for helpful discussion or comments on our manuscript. We also thank F. Pulecchi and R. Tomizza for technical support.
References
- Afraz A, Cavanagh P. The gender-specific face aftereffect is based in retinotopic not spatiotopic coordinates across several natural image transformations. J Vis. 2009;9:10, 1–17. doi: 10.1167/9.10.10. [DOI] [PMC free article] [PubMed] [Google Scholar]
- Afraz SR, Cavanagh P. Retinotopy of the face aftereffect. Vision Res. 2008;48:42–54. doi: 10.1016/j.visres.2007.10.028. [DOI] [PMC free article] [PubMed] [Google Scholar]
- Ashbridge E, Perrett DI. Generalizing across object orientation and size. In: Walsh V, Kulikowski J, editors. Perceptual constancy. Cambridge, UK: Cambridge UP; 1998. pp. 192–209. [Google Scholar]
- Bar M, Biederman I. Subliminal visual priming. Psychol Sci. 1998;9:464–468. [Google Scholar]
- Bar M, Biederman I. Localizing the cortical region mediating visual awareness of object identity. Proc Natl Acad Sci U S A. 1999;96:1790–1793. doi: 10.1073/pnas.96.4.1790. [DOI] [PMC free article] [PubMed] [Google Scholar]
- Biederman I, Cooper EE. Evidence for complete translational and reflectional invariance in visual object priming. Perception. 1991;20:585–593. doi: 10.1068/p200585. [DOI] [PubMed] [Google Scholar]
- Biederman I, Cooper EE. Size invariance in visual object priming. J Exp Psychol Hum Percept Perform. 1992;18:121–133. [Google Scholar]
- Bülthoff HH, Edelman SY, Tarr MJ. How are three-dimensional objects represented in the brain? Cereb Cortex. 1995;5:247–260. doi: 10.1093/cercor/5.3.247. [DOI] [PubMed] [Google Scholar]
- Clifford CWG, Rhodes G. Fitting the mind to the world: adaptation and after-effects in high-level vision. New York: Oxford UP; 2005. [Google Scholar]
- Coogan TA, Burkhalter A. Hierarchical organization of areas in rat visual cortex. J Neurosci. 1993;13:3749–3772. doi: 10.1523/JNEUROSCI.13-09-03749.1993. [DOI] [PMC free article] [PubMed] [Google Scholar]
- DiCarlo JJ, Cox DD. Untangling invariant object recognition. Trends Cogn Sci. 2007;11:333–341. doi: 10.1016/j.tics.2007.06.010. [DOI] [PubMed] [Google Scholar]
- Edelman S. Representation and recognition in vision. Cambridge, MA: MIT; 1999. [Google Scholar]
- Espinoza SG, Thomas HC. Retinotopic organization of striate and extrastriate visual cortex in the hooded rat. Brain Res. 1983;272:137–144. doi: 10.1016/0006-8993(83)90370-0. [DOI] [PubMed] [Google Scholar]
- Felleman DJ, Van Essen DC. Distributed hierarchical processing in the primate cerebral cortex. Cereb Cortex. 1991;1:1–47. doi: 10.1093/cercor/1.1.1-a. [DOI] [PubMed] [Google Scholar]
- Gao E, DeAngelis GC, Burkhalter A. Parallel input channels to mouse primary visual cortex. J Neurosci. 2010;30:5912–5926. doi: 10.1523/JNEUROSCI.6456-09.2010. [DOI] [PMC free article] [PubMed] [Google Scholar]
- Girman SV, Sauve Y, Lund RD. Receptive field properties of single neurons in rat primary visual cortex. J Neurophysiol. 1999;82:301–311. doi: 10.1152/jn.1999.82.1.301. [DOI] [PubMed] [Google Scholar]
- Kaliukhovich DA, Vogels R. Stimulus repetition probability does not affect repetition suppression in macaque inferior temporal cortex. Cereb Cortex. 2011;21:1547–1558. doi: 10.1093/cercor/bhq207. [DOI] [PubMed] [Google Scholar]
- Kohn A, Movshon JA. Adaptation changes the direction tuning of macaque MT neurons. Nat Neurosci. 2004;7:764–772. doi: 10.1038/nn1267. [DOI] [PubMed] [Google Scholar]
- Kravitz DJ, Vinson LD, Baker CI. How position dependent is visual object recognition? Trends Cogn Sci. 2008;12:114–122. doi: 10.1016/j.tics.2007.12.006. [DOI] [PubMed] [Google Scholar]
- Kravitz DJ, Kriegeskorte N, Baker CI. High-level visual object representations are constrained by position. Cereb Cortex. 2010;20:2916–2925. doi: 10.1093/cercor/bhq042. [DOI] [PMC free article] [PubMed] [Google Scholar]
- Lawson R. Achieving visual object constancy across plane rotation and depth rotation. Acta Psychol (Amst) 1999;102:221–245. doi: 10.1016/s0001-6918(98)00052-3. [DOI] [PubMed] [Google Scholar]
- Lee AK, Manns ID, Sakmann B, Brecht M. Whole-cell recordings in freely moving rats. Neuron. 2006;51:399–407. doi: 10.1016/j.neuron.2006.07.004. [DOI] [PubMed] [Google Scholar]
- Leopold DA, O'Toole AJ, Vetter T, Blanz V. Prototype-referenced shape encoding revealed by high-level aftereffects. Nat Neurosci. 2001;4:89–94. doi: 10.1038/82947. [DOI] [PubMed] [Google Scholar]
- Leopold DA, Bondar IV, Giese MA. Norm-based face encoding by single neurons in the monkey inferotemporal cortex. Nature. 2006;442:572–575. doi: 10.1038/nature04951. [DOI] [PubMed] [Google Scholar]
- Li L, Miller EK, Desimone R. The representation of stimulus familiarity in anterior inferior temporal cortex. J Neurophysiol. 1993;69:1918–1929. doi: 10.1152/jn.1993.69.6.1918. [DOI] [PubMed] [Google Scholar]
- Liu Y, Murray SO, Jagadeesh B. Time course and stimulus Dependence of repetition-induced response suppression in inferotemporal cortex. J Neurophysiol. 2009;101:418–436. doi: 10.1152/jn.90960.2008. [DOI] [PMC free article] [PubMed] [Google Scholar]
- Logothetis NK, Sheinberg DL. Visual object recognition. Annu Rev Neurosci. 1996;19:577–621. doi: 10.1146/annurev.ne.19.030196.003045. [DOI] [PubMed] [Google Scholar]
- Logothetis NK, Pauls J, Bulthoff HH, Poggio T. View-dependent object recognition by monkeys. Curr Biol. 1994;4:401–414. doi: 10.1016/s0960-9822(00)00089-0. [DOI] [PubMed] [Google Scholar]
- McMahon DBT, Olson CR. Repetition suppression in monkey inferotemporal cortex: relation to behavioral priming. J Neurophysiol. 2007;97:3532–3543. doi: 10.1152/jn.01042.2006. [DOI] [PubMed] [Google Scholar]
- Meier P, Flister E, Reinagel P. Collinear features impair visual detection by rats. J Vis. 2011;11:22, 1–16. doi: 10.1167/11.3.22. [DOI] [PubMed] [Google Scholar]
- Minini L, Jeffery KJ. Do rats use shape to solve “shape discriminations”? Learn Mem. 2006;13:287–297. doi: 10.1101/lm.84406. [DOI] [PMC free article] [PubMed] [Google Scholar]
- Miyashita Y. Inferior temporal cortex: where visual perception meets memory. Annu Rev Neurosci. 1993;16:245–263. doi: 10.1146/annurev.ne.16.030193.001333. [DOI] [PubMed] [Google Scholar]
- Müller K-M, Wilke M, Leopold DA. Visual adaptation to convexity in macaque area V4. Neuroscience. 2009;161:655–662. doi: 10.1016/j.neuroscience.2009.03.070. [DOI] [PMC free article] [PubMed] [Google Scholar]
- Niell CM, Stryker MP. Highly selective receptive fields in mouse visual cortex. J Neurosci. 2008;28:7520–7536. doi: 10.1523/JNEUROSCI.0623-08.2008. [DOI] [PMC free article] [PubMed] [Google Scholar]
- Niell CM, Stryker MP. Modulation of visual responses by behavioral state in mouse visual cortex. Neuron. 2010;65:472–479. doi: 10.1016/j.neuron.2010.01.033. [DOI] [PMC free article] [PubMed] [Google Scholar]
- Orban GA. Higher order visual processing in macaque extrastriate cortex. Physiol Rev. 2008;88:59–89. doi: 10.1152/physrev.00008.2007. [DOI] [PubMed] [Google Scholar]
- Pinto N, Cox DD, DiCarlo JJ. Why is real-world visual object recognition hard? PLoS Comput Biol. 2008;4:e27. doi: 10.1371/journal.pcbi.0040027. [DOI] [PMC free article] [PubMed] [Google Scholar]
- Poggio T, Edelman S. A network that learns to recognize three-dimensional objects. Nature. 1990;343:263–266. doi: 10.1038/343263a0. [DOI] [PubMed] [Google Scholar]
- Riesenhuber M, Poggio T. Hierarchical models of object recognition in cortex. Nat Neurosci. 1999;2:1019–1025. doi: 10.1038/14819. [DOI] [PubMed] [Google Scholar]
- Riesenhuber M, Poggio T. Models of object recognition. Nat Neurosci. 2000;3(Suppl):1199–1204. doi: 10.1038/81479. [DOI] [PubMed] [Google Scholar]
- Rolls ET. Functions of the primate temporal lobe cortical visual areas in invariant visual object and face recognition. Neuron. 2000;27:205–218. doi: 10.1016/s0896-6273(00)00030-1. [DOI] [PubMed] [Google Scholar]
- Sawamura H, Orban GA, Vogels R. Selectivity of neuronal adaptation does not match response selectivity: a single-cell study of the fMRI adaptation paradigm. Neuron. 2006;49:307–318. doi: 10.1016/j.neuron.2005.11.028. [DOI] [PubMed] [Google Scholar]
- Sawinski J, Wallace DJ, Greenberg DS, Grossmann S, Denk W, Kerr JND. Visually evoked activity in cortical cells imaged in freely moving animals. Proc Natl Acad Sci U S A. 2009;106:19557–19562. doi: 10.1073/pnas.0903680106. [DOI] [PMC free article] [PubMed] [Google Scholar]
- Schmidt T. The finger in flight: real-time motor control by visually masked color stimuli. Psychol Sci. 2002;13:112–118. doi: 10.1111/1467-9280.00421. [DOI] [PubMed] [Google Scholar]
- Smith SL, Hausser M. Parallel processing of visual space by neighboring neurons in mouse visual cortex. Nat Neurosci. 2010;13:1144–1149. doi: 10.1038/nn.2620. [DOI] [PMC free article] [PubMed] [Google Scholar]
- Suzuki S, Cavanagh P. A shape-contrast effect for briefly presented stimuli. J Exp Psychol Hum Percept Perform. 1998;24:1315–1341. doi: 10.1037//0096-1523.24.5.1315. [DOI] [PubMed] [Google Scholar]
- Tanaka K. Inferotemporal cortex and object vision. Annu Rev Neurosci. 1996;19:109–139. doi: 10.1146/annurev.ne.19.030196.000545. [DOI] [PubMed] [Google Scholar]
- Tarr MJ, Bülthoff HH. Image-based object recognition in man, monkey and machine. Cognition. 1998;67:1–20. doi: 10.1016/s0010-0277(98)00026-2. [DOI] [PubMed] [Google Scholar]
- Ullman S. High-level vision: object recognition and visual cognition. Cambridge, MA: MIT; 2000. [Google Scholar]
- Ullman S. Object recognition and segmentation by a fragment-based hierarchy. Trends Cogn Sci. 2007;11:58–64. doi: 10.1016/j.tics.2006.11.009. [DOI] [PubMed] [Google Scholar]
- Ullman S, Soloviev S. Computation of pattern invariance in brain-like structures. Neural Netw. 1999;12:1021–1036. doi: 10.1016/s0893-6080(99)00048-9. [DOI] [PubMed] [Google Scholar]
- Verhoef BE, Kayaert G, Franko E, Vangeneugden J, Vogels R. Stimulus similarity-contingent neural adaptation can be time and cortical area dependent. J Neurosci. 2008;28:10631–10640. doi: 10.1523/JNEUROSCI.3333-08.2008. [DOI] [PMC free article] [PubMed] [Google Scholar]
- Vorberg D, Mattler U, Heinecke A, Schmidt T, Schwarzbach J. Different time courses for visual perception and action priming. Proc Natl Acad Sci U S A. 2003;100:6275–6280. doi: 10.1073/pnas.0931489100. [DOI] [PMC free article] [PubMed] [Google Scholar]
- Wang G, Obama S, Yamashita W, Sugihara T, Tanaka K. Prior experience of rotation is not required for recognizing objects seen from different angles. Nat Neurosci. 2005;8:1768–1775. doi: 10.1038/nn1600. [DOI] [PubMed] [Google Scholar]
- Wiggs CL, Martin A. Properties and mechanisms of perceptual priming. Curr Opin Neurobiol. 1998;8:227–233. doi: 10.1016/s0959-4388(98)80144-x. [DOI] [PubMed] [Google Scholar]
- Yamashita W, Wang G, Tanaka K. View-invariant object recognition ability develops after discrimination, not mere exposure, at several viewing angles. European J Neurosci. 2010;31:327–335. doi: 10.1111/j.1460-9568.2009.07057.x. [DOI] [PubMed] [Google Scholar]
- Zoccolan D, Oertelt N, DiCarlo JJ, Cox DD. A rodent model for the study of invariant visual object recognition. Proc Natl Acad Sci U S A. 2009;106:8748–8753. doi: 10.1073/pnas.0811583106. [DOI] [PMC free article] [PubMed] [Google Scholar]