

Abstract
A simple, specific, accurate, precise, and robust reverse-phase high-performance liquid chromatographic method has been developed and validated for the estimation of allyl isothiocyanate (AITC) in phytosomes of black mustard extract (Brassica nigra). The method was validated with respect to specificity, linearity, accuracy, precision, and robustness. The linearity was achieved over a range of 10–18 μg/mL and regression coefficient was obtained 0.9961. Accuracy of chromatographic method was evaluated by standard addition method; percentage recovery attained was 97.07 ± 0.008–103.66 ± 0.013. Relative standard deviation for intraday and interday precision was 0.02% and 0.22%, respectively. The limit of detection and limit of quantification of the AITC were found to be 0.0043 μg/mL and 0.01324 μg/mL, respectively. This result shows that the method was well validated. In the present study, the AITC content was found 0.0009% ± 0.014% in black mustard. This study reveals that the proposed high-performance thin-layer chromatography method is accurate, fast, and cost-effective for the routine estimation of AITC in the phytosome formulation.
Key words: Allyl isothiocyanate, Brassica nigra, phytosome analysis, reversed-phase high-performance liquid chromatographic method development
INTRODUCTION
Brassica nigra L. (belonging to family Brassicaceae) most commonly known as “Black mustard” is used in food for various beneficial physiological effects in humans.[1,2] The seeds are used with warm water as an emetic in narcotic and other forms. They are credited with stimulant and stomachic properties and are used in neuralgia and rheumatism.[2,3] Grows from May–June to June–October season and is native to the Mediterranean region.[4,5] The ground seeds of the plant are generally used as spice. These are very well known in Indian cuisine. The shoot and leaves are used as a vegetable in Ethiopia. The plant grows up to two to eight feet tall.[6,7]
Black mustard consists of about 1% sinigrin, allylglucosinolate, a thioglycoside-like compound of allyl isothiocyanate (AITC) with glucose.[8] Under normal conditions, glucosinolates (GSLs) are stable; the enzyme myrosinase stored in myrosinase cells is required for hydrolysis of GSL.[6,9] When the integrity of the plant is compromised, for example, during chewing and chopping, the enzyme and GSLs comes in contact and the hydrolysis reaction takes place, resulting in breakage of glucoside bond.[7,10,11]
The principal component of black mustard is AITC, which is an organosulfur compound with the formula CH2 CHCH2 NCS as shown in Figure 1.[12,13,14] It is a colorless to pale-yellow liquid with an irritating odor with flash point of 135°F and boiling point 300°F. Zhang suggested that AITC may be most effective in the bladder as a cancer chemopreventive compound. It exhibits a low degree of cytotoxicity and genotoxicity in animal studies at high-dose levels, but such adverse effects are implausible in humans exposed to dietary levels of AITC.[15] It emits toxic fumes when heated to high temperature and used to make other chemicals and as a fumigant.[16,17,18]
Figure 1.
Chemical structure of allyl isothiocyanate
An attempt has been made to develop the method, which can resolve the spectra for AITC from other herbal compounds and can easily quantify for routine quality control analysis. The high-performance liquid chromatographic (HPLC) analysis method was fully validated according to the guidelines of the International Conference on Harmonization (ICH) Q2A and Q2B.[19,20,21] The method was validated for linearity, precision (repeatability and intermediate precision), specificity, detection limits, and robustness.[22,23,24,25,26,27,28]
MATERIALS AND METHODS
Instrument and apparatus
Perkin Elmer chromatographic system series 200-HPLC with total Chrome Navigator workstation as software. Chromatography was performed using BDS HYPERSIL C18 column. Ultraviolet-visible spectrophotometer double beam (Shimadzu, model 1800); Perkin Elmer FTIR instrument; Electronic analytical balance, Shimadzu.
Reagents and materials
Black mustard was purchased from the local market. AITC standard (99% pure) was purchased from RD chemicals. Purity and structure of standard compound were confirmed by HPLC and infrared spectral analysis. Analytical reagent grade solvents, i.e., methanol, ethyl acetate, and toluene, were obtained from Merck Specialties Pvt. Ltd., Mumbai, India.
Preparation of standard stock solution
Accurately weighed AITC (10 mg) was taken in 10 ml volumetric flask and approximately 8 ml methanol was added and sonicated for 5 min. The volume was made up to 10 ml with the same to obtain 1000 μg/mL standard stock solution.
Preparation of working standard for calibration curve
Aliquots of 0.1, 0.12, 0.14, 0.16, and 0.18 of 1000 μg/mL standard stock solution were transferred to 10 ml of volumetric flasks and made up to the mark with methanol to get concentration of 10, 12, 14, 16, and 18 μg/mL.
Chromatographic condition
The reversed-phase (RP)-HPLC chromatographic analysis was carried out by an isocratic elution of water: methanol (30:70 v/v). All solvents were filtered through a 0.45 μm millipore filter. Chromatography was performed as BDS HYPERSIL C18 column. Volumes of 20 μL of the solutions and samples prepared were injected into the column. A flow rate of 0.5 mL/min and a detection wavelength of 246 nm were used. AITC was identified according to the retention time of its peak, which was determined from AITC standard with appropriate specificity and selectivity.
Preparation of phytosomal dispersion
A thin-film hydration method was used to prepare phytosome. Soya lecithin (0.8 g) and extract (0.8 g) was dissolved in methanol and acetone in 9:1 concentration. Cholesterol (0.4 g) was separately dissolved in 5 mL of chloroform. These two solutions were mixed in the round-bottom flask (RBF) and a thin film was formed by evaporating the chloroform and methanol using rotary evaporator. When the solvents were completely evaporated, the RBF was kept for air drying for 24 h. Then, distilled water (20 ml) was added, and RBF was kept in orbital shaker for 24 h.
Sample preparation
Accurately weighed 10 mL phytosome dispersion was taken into the volumetric flask and 10 mL of chloroform was added. The flask was kept on a rotary shaker for 15 min to rupture the phytosomes and then 10 mL water was added to the resultant suspension. The mixing was continued for 30 min. The aqueous layer was separated using separating funnel. It was kept on a water bath for about 30 min to remove residual chloroform. The mixture was filtered and 1 mL was transferred to 10 mL volumetric flask and made up to mark with methanol, and this was used as a test solution.
Validation of the method
The method validation according to the guidelines of ICH Q2A and Q2B was performed for the developed RP-HPLC analysis.[6] The method was validated for linearity, precision (repeatability and intermediate precision), accuracy, specificity, detection limits, and robustness (detection wavelength and the flow rate of the mobile phase).[7]
Forced degradation studies
AITC (standard) and extract were subjected to 1N HCL, 1N NaOH, and 3% H2O2. AITC (standard) and extract were treated with 1N HCL, 1N NaOH for 30 min at 80°C, and 3% hydrogen peroxide for 24 h. Further dilutions were made with respect to the standard solution.
RESULTS AND DISCUSSION
Mobile phase optimization
Different solvent systems in varying ratios of solvents such as methanol, water, and acetonitrile were used to optimize the mobile phase for better resolution. From these, combination of water and methanol gave good results (30:70 v/v). Chromatogram of AITC (Rf: 8.30 ± 0.02) and extract (Rf: 8.33 ± 0.02) is shown in Figures 2 and 3, respectively.
Figure 2.

High-performance liquid chromatographic chromatogram of allyl isothiocyanate standard (10 ppm)
Figure 3.

High-performance liquid chromatographic chromatogram of allyl isothiocyanate in phytosomal extract
Method validation[21,22,23,24,25,26,27]
Linearity was determined by analysis of five linear curves in the concentration range of 10–18 μg/mL for AITC. The calibration curves for AITC were plotted, and the regression equations were computed from these plots [Figure 4]. The calibration curves showed good linearity (r2 ≥ 0.996 for AITC) as shown in Table 1. The standard addition method was applied to determine accuracy. The proposed method was applied for the estimation of AITC in the extract. The recovery study was carried out by spiking previously analyzed sample with different concentration of AITC at 80%, 100%, and 120% and repeated in triplicate. The percentage recovery of AITC was calculated at each level. The drug recovery obtained was 97.07%–103.66% for AITC as listed in Table 1.
Figure 4.
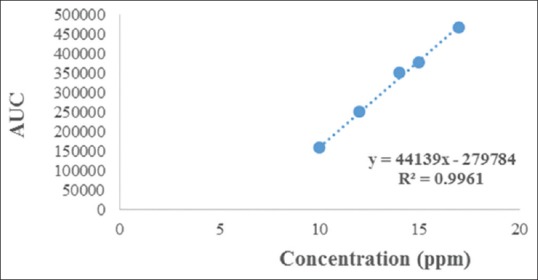
Linearity graph between concentrations versus peak area of allyl isothiocyanate
Table 1.
Parameters and results for allyl isothiocyanate
| Parameters | Observations |
|---|---|
| Wavelength | 246 nm |
| Concentration range (µg/mL) | 10-18 |
| RT values | 8.30±0.02 |
| Correlation coefficient | 0.9961 |
| Specificity | Specific |
| Accuracy (percentage recovery) | 97.07-103.66 |
| LOD (ng/mL) 3.3 s/S | 0.0043 |
| LOQ (ng/mL) 10 s/S | 0.01324 |
| Phytosome assay for allyl isothiocyanate | 0.0009% |
| Precision (percentage CV) | |
| Repeatability of sample application (n=6) | 0.28% |
| Interday (n=3) at Level 3 | 0.02% |
| Intraday (n=3) at Level 3 | 0.20% |
RT: Retention time, SD: Standard deviation, RSD: Relative standard deviation, n: Number of replicates, LOD: Limit of detection, LOQ: Limit of quantification, CV: Coefficient of variation
Specificity is defined as the ability to measure accurately and specifically the defined analyte without interferences from blank. Specificity study was performed by spotting placebo sample, mobile phase, and extract separately. The method specificity was performed, and the method was found specific. The limit of detection and limit of quantification for the analytes were calculated using the formula as per the ICH guidelines. The results are summarized in Table 1.
To study the intraday (repeatability) and interday precision (intermediate precision) of the method, six replicates of the standard of AITC at 1.5/1.5 μg/mL were analyzed on the day and on different consecutive days, respectively. The intra- and inter-day precision (% relative standard deviation) was 0.02% and 0.20% for AITC [Table 1], respectively.
Mobile phase composition, chamber saturation time, and mobile phase volume were considered as parameters of interest for robustness study. The results shown in Table 2 establish that alteration of the analytical conditions does not affect the performance of the method significantly, as evident from the precision values in the measurement of peak area of the analytes. This confirms the robustness of the analytical method.
Table 2.
Results for robustness of the method (n=6)
| Change in conditions | Number of injection | Concentration | Average area | Relative standard deviation |
|---|---|---|---|---|
| Temp 28°C | 3 | 10 ppm | 157,150.06±40.41 | 0.02% |
| Temp 32°C | 3 | 10 ppm | 155,866.1±152.69 | 1.18% |
The stability of the AITC was checked for short-term and long-term stability at room temperature and at 5°C, respectively. The samples at room temperature were stable for a minimum period of 45 h, whereas the samples at 5°C were stable for at least 60 days.
Forced degradation studies
Forced degradation was performed in acidic, alkaline, and oxidative conditions. All degradants peaks were well resolved from peaks of drugs for all stressed samples. The acid, alkaline, and oxidative degradation showed 98%–100% [Figures 5 and 6] and 6.48%–7% [Figure 7] drug degradation, respectively. The degradation pattern in all three conditions was found similar resulting in generation of new peak at 4.8 min. Liquid chromatography/mass spectrometry (LC/MS) MS studies are in progress to understand the mechanism for the same.
Figure 5.

Chromatogram for acid degradation of allyl isothiocyanate
Figure 6.

Chromatogram for alkaline degradation of allyl isothiocyanate
Figure 7.

Chromatogram for oxidative degradation of allyl isothiocyanate
The results for stress studies of AITC showed the highest degradation of 100% in the acidic and alkaline medium as shown in Table 3.
Table 3.
Forced degradation data of allyl isothiocyanate
| Method of degradation | Percentage of degradation |
|---|---|
| Alkaline degradation | 100 |
| Acid degradation | 100 |
| Hydrogen peroxide degradation | 6.49 |
CONCLUSION
A simple method was developed for the estimation of AITC in aqueous extract of B. nigra. Validation was done as per ICH guidelines. The result showed that the developed method is simple, fast, sensitive, suitable, and specific for the determination of AITC from the extract of B. nigra seeds and formulations.
Financial support and sponsorship
Nil.
Conflicts of interest
There are no conflicts of interest.
Acknowledgments
The authors are thankful to Mrs. Geeta Pai, Lecturer at SPPSPTM, SVKM'S NMIMS, for helping in HPLC method development.
REFERENCES
- 1.Khan J, Alexander A, Saraf S, Saraf S. Recent advances and future prospects of phyto-phospholipid complexation technique for improving pharmacokinetic profile of plant actives. Journal of controlled release. 2013;168:50–60. doi: 10.1016/j.jconrel.2013.02.025. [DOI] [PubMed] [Google Scholar]
- 2.Asfaw Z. Traditional African Vegetables: Proceedings of the IPGRI International Workshop on Genetic Resources of TraditionalVegetables in Africa. Conservation and Use. ICRAF-HQ, Nairobi. Rome: Institute of Plant Genetic and Crop Plant Research; 1997. Conservation and use of traditional vegetables in Ethiopia; pp. 57–65. [Google Scholar]
- 3.Lim TK. Edible Medicinal and Non-Medicinal Plants. Netherlands: Springer; 2014. Muscari neglectum; pp. 122–5. [Google Scholar]
- 4.Morris TN. Microscopic analysis of cattle-foods. Chicago: Cambridge University Press; 2015. [Google Scholar]
- 5.Krishnaveni M, Saranya S. Gas chromatography-mass spectrophotometry analysis of phytochemicals in Brassica hirta seeds. Int J Adv Life Sci. 2016;9:243–8. [Google Scholar]
- 6.Bellostas N, Sørensen JC, Sørensen H. Qualitative and quantitative evaluation of glucosinolates in cruciferous plants during their life cycles. Agroindustria. 2004;3:5–10. [Google Scholar]
- 7.Aljubory I, Jasiem T, Baderden S, Nasser N. Cultivation and comparison study of pharmacognostical and phytochemical properties of white and black mustard plants grown under semi-arid conditions in Iraq. Int J Adv Res. 2015;3:1045–8. [Google Scholar]
- 8.Zhang J, Tang Q, Xu X, Li N. Development and evaluation of a novel phytosome-loaded chitosan microsphere system for curcumin delivery. Int J Pharm. 2013;448:168–74. doi: 10.1016/j.ijpharm.2013.03.021. [DOI] [PubMed] [Google Scholar]
- 9.Satyamsetti R. Combined Chemopreventive Efficacy of Conventional Chemotherapeutic Drug with Dietary Phytochemicals on Human Cancer Cell Lines. 2013 [Google Scholar]
- 10.Obi RK, Nwanebu FC, Ndubuisi UU, Orji NM. Antibacterial qualities and phytochemical screening of the oils of Cucurbita pepo and Brassica nigra. J Med Plants Rese. 2009;3:429–32. [Google Scholar]
- 11.Jadhav VD, Bhanuwanshe SM, Patil SP, Chaudhari DV, Adke MB. Antibacterial activity of different plant and callus extracts a comparative study. Int J Sci & Technol Res. 2013;2:285–88. [Google Scholar]
- 12.Tomar RS, Shrivastava V. Efficacy evaluation of ethanolic extract of Brassica nigra as potential antimicrobial agent against selected microorganisms. Int J Pharm Sci Health Care. 2014;3:117–23. [Google Scholar]
- 13.Zamir T, Farooqui R, Rajput MA, Mustafa K. In vitro assessment of antibacterial activity of methanol extract of Brassica oleracea against selected bacterias. JLUMHS. 2013;12:177–81. [Google Scholar]
- 14.Amare A, Hadush A, Aregawi H, Kide N. Antibacterial activity of oil extracts of black mustard (Brassica nigra) seeds against bacteria isolated from fresh juice in selected areas of Axum town. Int J Integr Sci Innov Technol. 2015;4:15–8. [Google Scholar]
- 15.Zhang Y. Allyl isothiocyanate as a cancer chemopreventive phytochemical. Mol Nutr Food Res. 2010;54:127–35. doi: 10.1002/mnfr.200900323. [DOI] [PMC free article] [PubMed] [Google Scholar]
- 16.Tomar RS, Shrivastava V. In vitro efficacy evaluation of ethanolic extract of Cinnamomum zeylanicum (cinnamon) as potential antimicrobial agent against clinical isolates. Int J Pharm Sci Res. 2015;6:2201. [Google Scholar]
- 17.Bhatia M, Sharma A. Brassica nigra and Cuminum cyminum: Inhibitors of food borne pathogens. Int J Appl Biol Pharm Biotechnol. 2012;3:114–20. [Google Scholar]
- 18.Shrivastava V, Tomar RS, Mishra RK, Jyoti A, Kaushik S. Medicinal potential of some mythologically important plants of India: A review. Int J Multidiscip Curr Res. 2014;2:99–103. [Google Scholar]
- 19.International Conference on Harmonisation. Guideline on “text on validation of analytical procedures”. Federal Register. 1995;60:11260–3. [Google Scholar]
- 20.International Conference on Harmonisation. Guideline on “validation of analytical procedures: Methodology”. Federal Register. 1997;62:27463–7. [Google Scholar]
- 21.Chen WC, Lai YS, Lu KH, Lin SH, Liao LY, Ho CT, et al. Method development and validation for the high-performance liquid chromatography assay of gastrodin in water extracts from different sources of Gastrodia elata blume. J Food Drug Anal. 2015;23:803–10. doi: 10.1016/j.jfda.2015.02.006. [DOI] [PMC free article] [PubMed] [Google Scholar]
- 22.Shabir GA. Validation of high-performance liquid chromatography methods for pharmaceutical analysis. Understanding the differences and similarities between validation requirements of the US food and drug administration, the US pharmacopeia and the international conference on harmonization. J Chromatogr A. 2003;987:57–66. doi: 10.1016/s0021-9673(02)01536-4. [DOI] [PubMed] [Google Scholar]
- 23.Lu KH, Chen CY, Shih RL, Chin FS, Chien CS. Method development and validation for the GC-FID assay of ethanol in reservoir-type fentanyl transdermal patches. J Food Drug Anal. 2008;16:1–7. [Google Scholar]
- 24.Karakuş S, Küçükgüzel I, Küçükgüzel SG. Development and validation of a rapid RP-HPLC method for the determination of cetirizine or fexofenadine with pseudoephedrine in binary pharmaceutical dosage forms. J Pharm Biomed Anal. 2008;46:295–302. doi: 10.1016/j.jpba.2007.10.018. [DOI] [PubMed] [Google Scholar]
- 25.Validation of Analytical Procedures: Text and Methodology, Q2 (R1). International Conference on Harmonisation of Technical Requirements for Registration of Pharmaceuticals for Human Use. ICH Harmonised Tripartite Guideline. Current Step 4 Version. Parent Guideline. 1994 Oct 27; [Google Scholar]
- 26.Shah VP, Midha KK, Dighe S, McGilveray IJ, Skelly JP, Yacobi A, et al. Analytical methods validation: Bioavailability, bioequivalence, and pharmacokinetic studies. J Pharm Sci. 1992;81:309–12. doi: 10.1007/BF03189968. [DOI] [PubMed] [Google Scholar]
- 27.Krull I, Szulc M. Detection sensitivity and selectivity. In: Snyder LR, Kirkland JJ, Glajch JL, editors. Practical HPLC Method Development. Canada: John Wile and Sons Inc; 1997. [Google Scholar]
- 28.Sinha VR, Monika, Trehan A, Kumar M, Singh S, Bhinge JR. Stress studies on acyclovir. J Chromatogr Sci. 2007;45:319–24. doi: 10.1093/chromsci/45.6.319. [DOI] [PubMed] [Google Scholar]