

Abstract
Repetition of a stimulus, as well as valid expectation that a stimulus will occur, both attenuate the neural response to it. These effects, repetition suppression and expectation suppression, are typically confounded in paradigms in which the nonrepeated stimulus is also relatively rare (e.g., in oddball blocks of mismatch negativity paradigms, or in repetition suppression paradigms with multiple repetitions before an alternation). However, recent hierarchical models of sensory processing inspire the hypothesis that the two might be separable in time, with repetition suppression occurring earlier, as a consequence of local transition probabilities, and suppression by expectation occurring later, as a consequence of learnt statistical regularities. Here we test this hypothesis in an auditory experiment by orthogonally manipulating stimulus repetition and stimulus expectation and, using magnetoencephalography, measuring the neural response over time in human subjects. We found that stimulus repetition (but not stimulus expectation) attenuates the early auditory response (40–60 ms), while stimulus expectation (but not stimulus repetition) attenuates the subsequent, intermediate stage of auditory processing (100–200 ms). These findings are well in line with hierarchical predictive coding models, which posit sequential stages of prediction error resolution, contingent on the level at which the hypothesis is generated.
Introduction
Repeating a stimulus leads to reduced neural activity, a phenomenon known as repetition suppression (RS). RS is robustly present in many signatures of neural activity: it has been observed in different sensory modalities in humans and animals, awake or asleep, and is visible in single-unit recordings, in EEG/magnetoencephalography (MEG) data, as well as in hemodynamic signals obtained with fMRI (for review, see Grill-Spector et al., 2006). Similarly, valid expectation of a stimulus also leads to reduced neural activity (Summerfield et al., 2008; Alink et al., 2010; Den Ouden et al., 2010; Todorovic et al., 2011; Kok et al., 2012a), a phenomenon that we will refer to as expectation suppression (ES).
Given the repetitive and predictable nature of RS paradigms, it has been suggested that neuronal suppression to repeated stimuli may in fact be partly driven by ES (Summerfield et al., 2008). RS appears most noticeably present when stimulus repetitions are expected, and attenuated when they are infrequent (Summerfield et al., 2008; Todorovic et al., 2011). Conversely, other studies have found that RS can exist in the absence of ES (Kaliukhovich and Vogels, 2011), suggesting potentially separable neural signatures of these effects. Crucially, in many paradigms it is difficult to tease RS and ES apart. For example, in some mismatch negativity (MMN) paradigms, recurrent standard tones are interspersed with sporadic deviant tones, precluding a conclusive distinction between the effects of repetition and expectation on the sensory response (Friston, 2005; Garrido et al., 2007; Kiebel et al., 2008; Wacongne et al., 2012). Other MMN paradigms (Schröger and Wolff, 1996; Grimm et al., 2011) did demonstrate ES when controlling for RS, but they did not directly test whether and when these factors interact on the sensory response. Similarly, repetition suppression paradigms often involve series of predictable tone repetitions (Rosburg et al., 2004), rendering ES a viable alternative explanation for the observed RS.
Recent theoretical models of sensory processing inspire the hypothesis that RS and ES may be manifestations of prediction errors on different time scales (Friston, 2005; Kiebel et al., 2008; Garrido et al., 2009; Wacongne et al., 2012). According to these models, the cortex generates predictions at different, hierarchically nested, levels. A first, low-level expectation based on local transition probabilities may generate larger neuronal responses when a stimulus is different from its directly preceding neighbor (Hosoya et al., 2005; Wacongne et al., 2011). This may generate RS, independently from ES, during the first stages of auditory processing. Higher-order expectations, based on more complex statistical regularities within the environment, may then shape subsequent neural processing to the sound, giving rise to ES. Here we empirically test these predictions by orthogonally manipulating stimulus repetition and stimulus expectation in an auditory cue–target paradigm and measuring the neural response to the auditory stimulus using MEG. We presented participants with pairs of tones, consisting either of a pitch repetition or of a pitch alternation (allowing us to investigate RS), which could either be expected or unexpected (allowing us to investigate ES). In line with the models described above, we observed RS (but no ES) in early (40–60 ms following tone onset) auditory processing, while we observed ES (but no RS) during an intermediate (100–200 ms) stage of auditory processing. This provides compelling support for a hierarchy of predictions in auditory processing.
Materials and Methods
Participants.
Twenty-four healthy participants took part in the experiment. Two participants were excluded because of a technical error with the equipment, and two participants were excluded because of excessive measurement noise. The analyses were performed on the remaining 20 participants (9 female; age, 24.5 ± 4.47 years; mean ± SD). All participants had normal hearing and no history of neurological or psychiatric disorders. The study was approved by the regional ethics committee, and a written informed consent was obtained from the participants according to the Declaration of Helsinki.
Stimuli and experimental design.
Participants were presented with pairs of pure tones (20 ms, ∼75 dB). Tone pitch could be either low (1046 Hz), medium (1174 Hz), or high (1318 Hz). The tones were presented using a PC running Presentation software (Neurobehavioral Systems) binaurally via MEG-compatible air tubes.
Each trial started with the presentation of a small central fixation cross on the screen for 2–4 s. On each trial, a pair of tones, separated by 500 ms, was presented. The two tones in a pair could be identical (repetition trials) or different (alternation trials), allowing us to investigate the neural consequences of repetition. Orthogonally to this, the first tone predicted the repetition or alternation of the second tone with a probability of 0.75. Therefore, the second tone could be validly predicted by the first tone (expected trials) or not (unexpected trials), allowing us to investigate the neural consequence of stimulus expectation. There were also omission trials, where the first tone was followed by silence, which could either be expected or unexpected (Table 1). The tone pair (or single tone) was followed by a short period, during which the fixation cross remained on the screen (0.5–1 s), and a rest period, during which the participants could freely move their eyes and blink (1.5–2 s), resulting in a 4–6 s interval between the last tone (or tone omission) of the current trial and the first tone of the following trial. The first tone of each pair was always unpredictable in onset time and pitch. Once the first tone was heard, a prediction could be formed about the onset and pitch of the second tone.
Table 1.
Transition probability diagram
| First tone Neutral (p = 0.33) | Second tone |
|
|---|---|---|
| Expected (p = 0.75) | Unexpected (p = 0.25) | |
| Stimulus 1 (N = 200) | Repetition (stimulus 1) (N = 150) | Omission (no stimulus) (N = 50) |
| Stimulus 2 (N = 200) | Omission (no stimulus) (N = 150) | Repetition (stimulus 2) (N = 50) |
| Stimulus 3 (N = 200) | Alternation (stimulus 2) (N = 150) | Alternation (stimulus 1) (N = 50) |
The pitch of the first tone could be one of three stimuli with equal probability. The second tone followed the first tone with a probability of 0.75 (expected trials) or 0.25 (unexpected trials), and was of the same pitch (repetition trials), of a different pitch (alternation trials), or omitted (omission trials).
Alternation trials always began with high tones, while repetition and omission trials could begin either with a low or medium tone (counterbalanced across subjects). The statistical regularities between the first tone and the frequency/omission of the second tone were counterbalanced across participants. To control for overall differences in auditory processing due to pitch, we balanced pitch across trials in such a way that there was an equal number of trials beginning with low, medium, and high tones, and an equal number of trials ending with low and medium tones and tone omissions. The experiment consisted of 600 trials, which were randomly intermixed and presented in four sessions of 12 min each. The experiment contained 50 trials of each type of “unexpected” tone pair, and 150 trials of each type of “expected” tone pair. Before the actual experiment, we provided participants with 8 min of 72 practice trials, which contained the same tone contingencies as in the experiment. During the practice, participants were also explicitly notified about the tone contingencies.
On 25% of trials in each condition (“catch trials”), participants were asked which of the three tones they heard on the first position of the tone pair. Participants received feedback by means of a brief color change of the fixation cross. This task kept participants focused, while ensuring that attention was similar between the different conditions. Participants answered by pressing one of three buttons with their right hand. To prevent eventual response preparation, the stimulus–response mapping was withheld until the response screen appeared.
MEG measurements.
Ongoing brain activity was recorded using a whole-head MEG with 275 axial gradiometers (MEG International Services) in a magnetically shielded room. Head localization was monitored continuously during the experiment using coils placed at the cardinal points of the head (nasion and left and right ear canals). As an aid for eye blink and heartbeat artifact rejection, an electro-oculogram was recorded from the supraorbital and infraorbital ridge of the left eye, and an electrocardiogram was recorded as well, both using 10-mm-diameter Ag–AgCl surface electrodes.
MEG data analysis.
The data were prepared for analyses using the FieldTrip toolbox developed at Donders Institute for Brain, Cognition, and Behavior (Oostenveld et al., 2011) in Matlab 7 (MathWorks). Epochs of interest were checked for artifacts using a semiautomatic routine that helped detect and reject trials containing muscle artifacts and jumps in the MEG signal caused by the superconducting quantum interference device electronics. Subsequently, independent component analysis (Bell and Sejnowski, 1995) was used to remove any remaining variance attributable to eye blinks and heartbeat artifacts (Jung et al., 2000). The data were then visually inspected and any remaining trials with artifacts were removed manually. For the purpose of trial-by-trial analyses, the data from the head localization coils was used to remove variance in the signal related to head motion (A. Stolk, A. Todorovic, J.M. Schoffelen, R. Oostenveld, unpublished observation). Finally, to remove any differences in data analysis that may arise from having an unequal number of trials per condition, a random sample of trials, equal to the number of trials in the smallest condition, was taken from each condition before averaging. This resulted in an average of 46.15 trials (SD, 2.44) per condition. Data were low-pass filtered using a two-pass Butterworth filter with a filter order of six and a frequency cutoff of 40 Hz. We calculated a planar gradient transform to position the maximal signal above the sources of neural activation (Hämäläinen et al., 1993), which simplifies the interpretation of the sensor-level data (Bastiaansen and Knosche, 2000). Event-related fields were then baseline corrected by subtracting the mean signal in the 0–100 ms interval before each tone.
Loci of auditory activation were defined by identifying the 10 left and right hemisphere sensors that showed maximal activity in the 50–150 ms period following the tone presentation (Fig. 1A). The average evoked activity of this set of sensors over time (Fig. 1B) constituted the measure of auditory activation that served as the dependent variable for all subsequent analyses.
Figure 1.
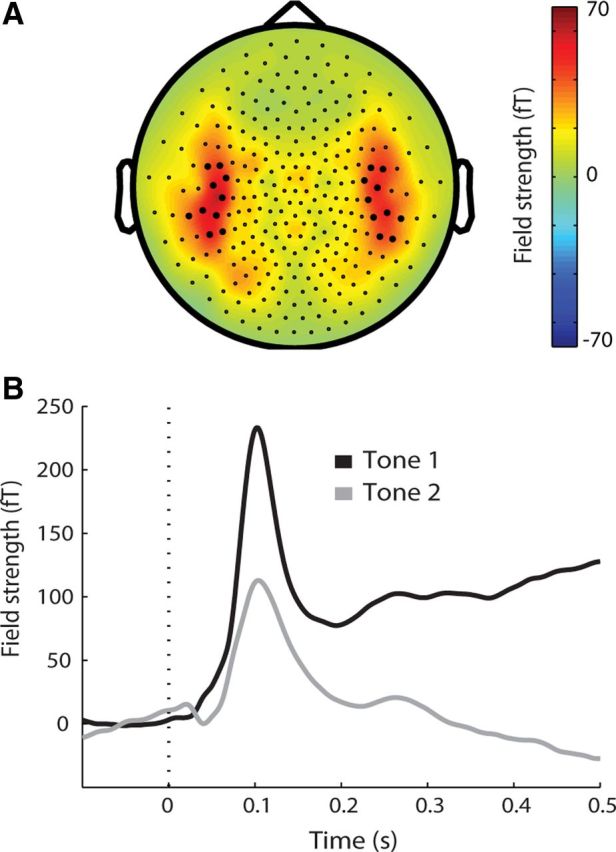
Localization of auditory activation. A, Topographic representation of average MEG channel activation for all tones in the 50–150 ms interval after tone onset (dashed line). The 10 maximally activated channels in each hemisphere are highlighted. B, Average auditory evoked field for all tones in selected channels highlighted in A. The two tones occurred in succession, but are displayed in the same time window here to highlight neuronal suppression for the second tone.
Statistical analyses.
Statistical comparisons were performed using SPSS Statistics v16 (IBM). Our factorial design allowed us to independently assess the neural consequences of repetition (RS), and expectation (ES), as well as their interaction. To test for specific differences in different stages of auditory processing, we focused on three prespecified time windows of tone processing: 40–60 ms (early), 100–200 ms (intermediate), and 200–500 ms poststimulus (late). We based the choice of these three time windows on previously found effects of repetition (Rosburg, 2004; White and Yee, 2006) and expectation (Grimm et al., 2011; Todorovic et al., 2011) in the auditory domain. More specifically, for the early time window, we chose to focus on the P50 component, which peaks ∼50 ms after tone onset. Because it is a brief component, we averaged over a small time window around it (±10 ms). For intermediate processing, we focused on processing in the N1/P2 complex. The beginning of the intermediate time window corresponds to the beginning of the MMN and ends with its peak. The remaining activity, in the late time window, includes all processing after the peak of the MMN (Näätänen, 1990). In each of these time windows, we investigated the effects of RS and ES on auditory activity, as well as their interaction, using a repeated-measures ANOVA with the factors repetition (repeated, alternating) and expectation (expected, unexpected).
To assess whether effects of expectation were stable or developed across the experiment, we also examined trial-by-trial auditory activity. The activity corresponding to each tone was binned into blocks of 10 trials. For each participant and each condition, we estimated the slope and intercept of auditory activity as a function of time. The intercepts and slopes of the regression lines in the different conditions were compared using a paired samples t test.
Results
Behavioral results
On a proportion of trials, participants were asked about the identity of the first tone of the tone pair. Participants performed this task with high accuracy (90 ± 8%, mean ± SD), demonstrating that they successfully attended to and processed the auditory stimuli. There were no differences in accuracy depending on whether the first tone was part of an expected or unexpected tone pair (t(19) = 0.94, p = 0.35). Tones that were part of an alternation tone pair were more accurately recognized than tones in a repetition pair (t(19) = 3.2, p = 0.004).
Auditory event-related activity
Tones elicited strong neural activity over bilateral temporal sensors (Fig. 1A). The second tone of the tone pairs elicited a smaller evoked field than the first tone (Fig. 1B). As would be expected, there were no differences in evoked activity between the different conditions for the first tone of the tone pairs in any of the three temporal windows of auditory processing (p > 0.10 in all cases). The subsequent sections will focus on activity differences elicited by the second tone in different stimulus pairs, as a function of the tone being a repetition/alternation and/or expected/unexpected.
Selective RS during early auditory processing
During early auditory processing (40–60 ms following stimulus onset), there was reduced neural activity for repeated tones, compared with nonrepeated tones, in the auditory evoked fields (i.e., RS: F(1,19) = 4.7, p = 0.042), while there was no significant difference between expected and unexpected tones (i.e., no ES: F(1,19) = 0.18, p = 0.70; Fig. 2). RS was also not different in magnitude for expected versus unexpected tones during early processing, as indicated by the absence of an interaction (F(1,19) = 0.63, p = 0.44). The topographical distribution of the early RS effect was similar to the topographical distribution of the activity elicited by the tones (Fig. 2B).
Figure 2.
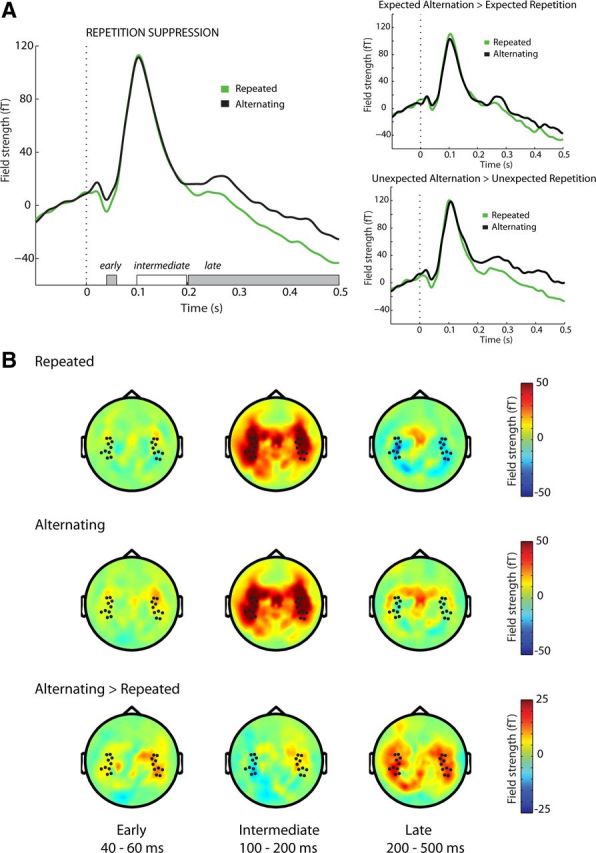
Effect of pitch repetition on neuronal suppression. A, Auditory evoked fields for repeated (green) and alternating (black) tones. Temporal windows are denoted on the x-axis. Significant effects are in gray. Dashed line represents tone onset. B, Average topography over time for repeated tones (top), alternating tones (middle), and their difference (bottom). Dots represent analyzed channels.
Selective ES during intermediate auditory processing
In the intermediate auditory processing interval (100–200 ms following stimulus onset), there was reduced neural activity for expected tones, compared with unexpected tones, in the auditory evoked fields (i.e., ES: F(1,19) = 23.2, p < 0.001; Fig. 3). Interestingly, during this interval, there was no difference between auditory evoked responses to repeated and nonrepeated tones (RS: F(1,19) = 0.12, p = 0.73). Also, ES was not different in magnitude for repeated versus nonrepeated tones during intermediate processing, as indicated by the absence of an interaction (F(1,19) = 2.76, p = 0.11). Again, the topographical distribution of the middle-latency ES effect was similar to the topographical distribution of the activity elicited by the tones (Fig. 3B).
Figure 3.
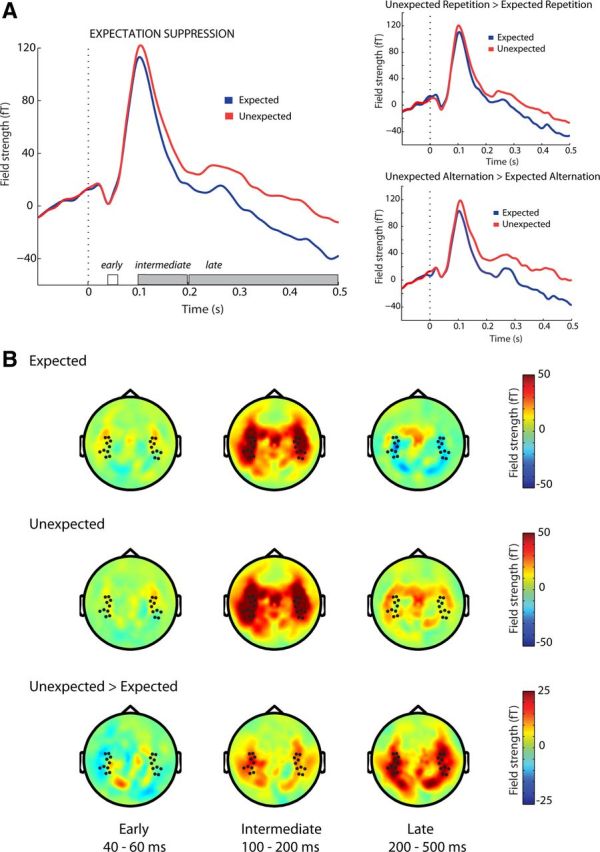
Effect of pitch expectation on neuronal suppression. A, Auditory evoked fields for expected (blue) and unexpected (red) tones. Temporal windows are denoted on the x-axis. Significant effects are in gray. Dashed line represents tone onset. B, Average topography over time for expected tones (top), unexpected tones (middle), and their difference (bottom). Dots represent analyzed channels.
Interactive effects of repetition and expectation during late auditory processing
In the late auditory processing interval (200–500 ms after stimulus onset), we observed both RS (F(1,19) = 11.1, p = 0.004,) and ES (F(1,19) = 31.3, p < 0.001). Also, there was a trend of ES being stronger for nonrepeated trials, compared with repeated trials (F(1,19) = 3.1, p = 0.094). In this temporal window, ES was also evident following tone omissions: there was more activity following unexpected tone omissions than after expected omissions (t(19) = 2.88, p = 0.009). Topographical distributions of late RS and ES effects show slightly broader activity distributions. However, clear peaks are evident over temporal sensors, overlying the topographical distribution of tone-induced neural activity (Figs. 2B, 3B).
In sum, the data show distinct, noninteracting contributions of RS and ES on neuronal suppression during early (RS) and intermediate (ES) tone processing, and overlapping (and somewhat interacting) effects during late tone processing.
We next examined the stability of ES over the course of the experiment. On the one hand, ES may develop slowly, given that the statistical regularities may be learned and strengthened over time. On the other hand, subjects received training before the start of the experiment, and the statistical regularities were of low complexity (i.e., first-order statistical regularities). To establish the time course of ES throughout the experiment, we looked at how neural activity elicited by the auditory tones evolved over time, for expected and unexpected tones. For this analysis, we restricted the time of interest to 100–200 ms poststimulus (i.e., the intermediate stage where ES was selectively present). We then compared the intercepts and slopes of regression lines fitted through data corresponding to expected and unexpected tones, plotted (in bins of 10 trials) against time (Fig. 4). We found that the difference between unexpected and expected tones was present and stable throughout the experiment, as indicated by the larger intercept for unexpected than for expected tones (t(19) = 2.43, p = 0.02) and lack of difference in the slopes of these regression lines (t(19) = 0.71, p = 0.47).
Figure 4.

Stability of expectation suppression throughout the experiment. Average evoked fields 100–200 ms after tone onset for expected trials (blue) and unexpected trials (red). Each point represents an average of 10 successive trials.
Discussion
We presented participants with pairs of tones, of which the pitch of the second tone was either a repetition or not, and was either expected or unexpected. This allowed us to independently evaluate the effects of tone repetition (RS) and tone expectation (ES) on neural activity in auditory evoked fields. Our results suggest that while repetition and expectation both attenuate neural activity, the time course of their attenuation is distinct: repetition leads to an early (40–60 ms) reduction in neural activity, whereas valid expectation reduces neural activity during an intermediate stage of auditory processing (100–200 ms). After 200 ms, there were interactive effects of both factors, with larger ES for nonrepeated than for repeated tones. The topographies of the effects suggest that ES and RS are occurring within the same cortical regions that are processing the auditory stimuli (rather than being related to general arousal, for example). Below we will discuss and interpret these findings within recent neuronal models of deviance detection in auditory processing (Wacongne et al., 2012).
The early attenuation to repeated tones (i.e., suppression of auditory activity in the 40–60 ms interval for the second tone relative to the first tone) is well in line with a comprehensively researched auditory phenomenon called P50 suppression (Yee and White, 2001; Rosburg et al., 2004). This phenomenon is often viewed as automatic inhibitory gating or filtering (Freedman et al., 1987). Our results show stronger activity suppression for repeated than for nonrepeated sounds, suggesting that the sensory filtering is sensitive to the pitch of the immediately preceding tone. This stimulus adaptation for identical tones could be the result of neuronal fatigue or sharpening of sensory representations (Grill-Spector et al., 2006). Note that they are, however, also compatible with hierarchical neuronal models of auditory processing (Garrido et al., 2007; Kiebel et al., 2008; Wacongne et al., 2011) in which “predictions” at the earliest stage are based on local transition probabilities only.
Within the context of these hierarchical models, the early (local) auditory prediction is followed by higher-order auditory predictions based on contextual regularities in the environment. Indeed, we observed that tones that were expected (on the basis of the tone transition probability structure) were marked by suppressed auditory activity in the subsequent 100–200 ms interval. Neuronal suppression at this latency has also been researched in considerable detail, and its mechanisms are hotly debated (Näätänen et al., 2005; Wacongne et al., 2011). A large body of literature has documented that when an unexpected deviant sound is introduced within a sequence of repeated frequent sounds, larger neural activity is observed within this time window: the MMN (Näätänen et al., 2007). The MMN can be robustly observed to deviants in pitch, duration, tone onset, or amplitude. This has led researchers to suggest that the MMN is driven by differences in tone features between the standard and deviant stimulus (Näätänen et al., 2007). However, as argued earlier, expectation and repetition can be confounded in oddball blocks of a number of MMN paradigms, where unexpected tones are at the same time nonrepeated tones. Although other studies have provided compelling support for the MMN as resulting from an expectation violation (Schröger and Wolff, 1996), it is not clear from these studies whether the MMN is driven purely by ES, or additionally (and potentially, in interaction with) by RS. Our results provide unequivocal support for the auditory modulation to reflect ES, and not RS, in the 100–200 ms time window. ES was highly significant in this temporal window (p < 0.001), while there was no significant influence of repetition on the response amplitude (p = 0.73). This rules out a simple adaptation account for the MMN (May and Tiitinen, 2010). This fits with recent theoretical frameworks that have reinterpreted the MMN as a prediction error response (Baldeweg, 2006; Garrido et al., 2009). The observed cascade of prediction error responses (early RS, followed by ES) is well in line with hierarchical predictive coding models (Wacongne et al., 2012) that posit distinct stages of auditory novelty detection based on temporal integration mechanisms that operate on intervals of increasing length (Kiebel et al., 2008).
A recent EEG study found that even early tone processing may be influenced by expectation of tone pitch (Grimm et al., 2011), while we only see RS in this time window. There are several potential reasons for this apparent discrepancy. First, the Grimm et al. (2011) study manipulated expectation by making a particular stimulus overall less likely (i.e., a base rate manipulation), whereas in our design stimuli were expected or unexpected due to their transition probabilities. Second, stimulus probabilities in the Grimm et al. (2011) study were blocked, allowing for expectation of an upcoming stimulus to form and strengthen over a period of several minutes. In contrast, in our study expectations could only be formed after hearing the first tone of each tone pair, as the prediction was contingent on the (unpredictable) first stimulus in the trial. Therefore, expectations in the study by Grimm et al. could be more automatic, which could explain why the signature of their violation may also be evident earlier (Wacongne et al., 2011). Finally, the Grimm et al. (2011) study had a shorter stimulus onset asynchrony than ours (293 vs 500 ms). It is possible that decay times are shorter for early effects of expectation on tone processing, and that they are therefore not evident in our study.
It has been put forward that both RS and ES are influenced by, and partly depend on, the attentional state of the observer (Murray and Wojciulik, 2004; Yi and Chun, 2005; Larsson and Smith, 2012). The finding that RS modulates neural activity at an early, potentially preattentive (Kho et al., 2003; Rosburg et al., 2004; White and Yee, 2006) temporal window, whereas ES is visible in a later window where attentional effects are more prevalent (Näätänen, 1990) is consistent with the notion that RS is less dependent on attentional state than ES (Larsson and Smith, 2012). Nevertheless, although ES may depend on the attentional state of the participant, the ES observed in our experiment is not likely to be a simple reflection of attentional differences between conditions for several reasons. First, all analyses focused on the second tone of each tone pair, while subjects attended to the first tone of the pair. Therefore, the tones for which we observed RS and ES were task irrelevant and, as such, tone contingencies did not help participants, making differences in selective attention unlikely. It is nevertheless possible that the violation of a statistical regularity generates a bottom-up attentional signal, and that ES represents attentional enhancement of surprising input. Although this chicken-or-egg problem seems hard to resolve, a recent study (Meyer and Olson, 2011) suggests that ES may be a cause of, rather than consequence of, attentional capture. These authors observed ES in single-neuron responses in the inferotemporal cortex during the presentation of expected versus unexpected visual stimuli. Interestingly, the time course of ES was indistinguishable from the time course of the visual response itself, which would not have been expected if ES reflects later attentional modulations from areas beyond the inferotemporal cortex.
The current results fit in a growing body of literature that show how sensory responses are subject to different modulatory effects over the time course of neural processing (Lee et al., 1998). This temporally ordered neuronal suppression can be explained by hierarchical predictive coding models (Rao and Ballard, 1999; Friston, 2005, 2009; Kiebel et al., 2008; Wacongne et al., 2011). These models posit two functionally distinct subpopulations of neurons, which encode the conditional expectations of perceptual causes, and the prediction error, respectively. Predictions at different levels of the processing hierarchy try to explain away prediction error on preceding levels, thus silencing their error neurons. Concurrently, neurons encoding sensory causes rapidly converge on the (correctly) predicted causes, yielding a relatively sharp population response. Further empirical support for this scheme is provided by a recent study that showed that expected visual stimuli lead to attenuated neural activity, yet improve the fidelity (sharpness) of the sensory representation in the primary visual cortex (Kok et al., 2012a). In line with the idea that the formation and updating of predictions may be fundamentally related to the coding scheme of the brain, ES has been observed in numerous studies using different sensory modalities, levels of processing, and tasks. In vision, researchers have found suppressed neural activity in area V1, in connection with expected, simple visual stimuli (den Ouden et al., 2008; Alink et al., 2010; Kok et al., 2011); in the fusiform face area, in connection with faces; and in the parahippocampal place area, in connection with houses (Den Ouden et al., 2010; Egner et al., 2010). Higher-order speech areas also show less neural activity when a syllable can be predicted from a visual cue (Arnal et al., 2011). Importantly, this may have implications for the interpretation of some experimental tasks in cognitive neuroscience where frequency and expectancy are comanipulated. Repetitive aspects of experimental designs may lead to expectations regarding different features of the stimulus, which, unless controlled for, may be an important factor in studies that aim to investigate stimulus-related phenomena, such as RS.
Footnotes
This work was supported by the Netherlands Organisation for Scientific Research (NWO VENI) (F.P.d.L.).
References
- Alink A, Schwiedrzik CM, Kohler A, Singer W, Muckli L. Stimulus predictability reduces responses in primary visual cortex. J Neurosci. 2010;30:2960–2966. doi: 10.1523/JNEUROSCI.3730-10.2010. [DOI] [PMC free article] [PubMed] [Google Scholar]
- Arnal LH, Wyart V, Giraud AL. Transitions in neural oscillations reflect prediction errors generated in audiovisual speech. Nat Neurosci. 2011;14:797–801. doi: 10.1038/nn.2810. [DOI] [PubMed] [Google Scholar]
- Baldeweg T. Repetition effects to sounds: evidence for predictive coding in the auditory system. Trends Cogn Sci. 2006;10:93–94. doi: 10.1016/j.tics.2006.01.010. [DOI] [PubMed] [Google Scholar]
- Bastiaansen MC, Knösche TR. Tangential derivative mapping of axial MEG applied to event-related desynchronization research. Clin Neurophysiol. 2000;111:1300–1305. doi: 10.1016/s1388-2457(00)00272-8. [DOI] [PubMed] [Google Scholar]
- Bell AJ, Sejnowski TJ. An information-maximization approach to blind separation and blind deconvolution. Neural Comput. 1995;7:1129–1159. doi: 10.1162/neco.1995.7.6.1129. [DOI] [PubMed] [Google Scholar]
- den Ouden HE, Friston KJ, Daw ND, McIntosh AR, Stephan KE. A dual role for prediction error in associative learning. Cereb Cortex. 2009;19:1175–1185. doi: 10.1093/cercor/bhn161. [DOI] [PMC free article] [PubMed] [Google Scholar]
- den Ouden HE, Daunizeau J, Roiser J, Friston KJ, Stephan KE. Striatal prediction error modulates cortical coupling. J Neurosci. 2010;30:3210–3219. doi: 10.1523/JNEUROSCI.4458-09.2010. [DOI] [PMC free article] [PubMed] [Google Scholar]
- Egner T, Monti JM, Summerfield C. Expectation and surprise determine neural population responses in the ventral visual stream. J Neurosci. 2010;30:16601–16608. doi: 10.1523/JNEUROSCI.2770-10.2010. [DOI] [PMC free article] [PubMed] [Google Scholar]
- Freedman R, Adler LE, Gerhardt GA, Waldo M, Baker N, Rose GM, Drebing C, Nagamoto H, Bickford-Wimer P, Franks R. Neurobiological studies of sensory gating in schizophrenia. Schizophr Bull. 1987;13:669–678. doi: 10.1093/schbul/13.4.669. [DOI] [PubMed] [Google Scholar]
- Friston K. A theory of cortical responses. Philos Trans R Soc Lond B Biol Sci. 2005;360:815–836. doi: 10.1098/rstb.2005.1622. [DOI] [PMC free article] [PubMed] [Google Scholar]
- Friston K. The free-energy principle: a rough guide to the brain? Trends Cogn Sci. 2009;13:293–301. doi: 10.1016/j.tics.2009.04.005. [DOI] [PubMed] [Google Scholar]
- Garrido MI, Kilner JM, Kiebel SJ, Friston KJ. Evoked brain responses are generated by feedback loops. Proc Natl Acad Sci U S A. 2007;104:20961–20966. doi: 10.1073/pnas.0706274105. [DOI] [PMC free article] [PubMed] [Google Scholar]
- Garrido MI, Kilner JM, Stephan KE, Friston KJ. The mismatch negativity: a review of underlying mechanisms. Clin Neurophysiol. 2009;120:453–463. doi: 10.1016/j.clinph.2008.11.029. [DOI] [PMC free article] [PubMed] [Google Scholar]
- Grill-Spector K, Henson R, Martin A. Repetition and the brain: neural models of stimulus-specific effects. Trends Cogn Sci. 2006;10:14–23. doi: 10.1016/j.tics.2005.11.006. [DOI] [PubMed] [Google Scholar]
- Grimm S, Escera C, Slabu L, Costa-Faidella J. Electrophysiological evidence for the hierarchical organization of auditory change detection in the human brain. Psychophysiology. 2011;48:377–384. doi: 10.1111/j.1469-8986.2010.01073.x. [DOI] [PubMed] [Google Scholar]
- Hämäläinen MS, Hari RI, R. J., Knuutila J, Lounasmaa J. Magnetoencephalography. Theory, instrumentation and applications to the noninvasive study of brain function. Rev Mod Phys. 1993;65:413–497. [Google Scholar]
- Hosoya T, Baccus SA, Meister M. Dynamic predictive coding by the retina. Nature. 2005;436:71–77. doi: 10.1038/nature03689. [DOI] [PubMed] [Google Scholar]
- Jung TP, Makeig S, Westerfield M, Townsend J, Courchesne E, Sejnowski TJ. Removal of eye activity artifacts from visual event-related potentials in normal and clinical subjects. Clin Neurophysiol. 2000;111:1745–1758. doi: 10.1016/s1388-2457(00)00386-2. [DOI] [PubMed] [Google Scholar]
- Kaliukhovich DA, Vogels R. Stimulus repetition probability does not affect repetition suppression in macaque inferior temporal cortex. Cereb Cortex. 2011;21:1547–1558. doi: 10.1093/cercor/bhq207. [DOI] [PubMed] [Google Scholar]
- Kho KH, Verkes RJ, Eling P, Zwarts MJ, Ellenbroek B, van Luijtelaar G. P50 gating is not affected by selective attention. J Psychophysiol. 2003;17:23–29. [Google Scholar]
- Kiebel SJ, Daunizeau J, Friston KJ. A hierarchy of time-scales and the brain. PLoS Comput Biol. 2008;4:e1000209–e1000209. doi: 10.1371/journal.pcbi.1000209. [DOI] [PMC free article] [PubMed] [Google Scholar]
- Kok P, Jehee JF, de Lange FP. Less is more: Expectation sharpens representations in the primary visual cortex. Neuron. 2012a;75:265–270. doi: 10.1016/j.neuron.2012.04.034. [DOI] [PubMed] [Google Scholar]
- Kok P, Rahnev D, Jehee JF, Lau HC, de Lange FP. Attention reverses the effect of prediction in silencing sensory signals. Cereb Cortex. 2012b;22:2197–2206. doi: 10.1093/cercor/bhr310. [DOI] [PubMed] [Google Scholar]
- Larsson J, Smith AT. fMRI repetition suppression: neuronal adaptation or stimulus expectation? Cereb Cortex. 2012;22:567–576. doi: 10.1093/cercor/bhr119. [DOI] [PMC free article] [PubMed] [Google Scholar]
- Lee TS, Mumford D, Romero R, Lamme VA. The role of the primary visual cortex in higher level vision. Vision Res. 1998;38:2429–2454. doi: 10.1016/s0042-6989(97)00464-1. [DOI] [PubMed] [Google Scholar]
- May PJ, Tiitinen H. Mismatch negativity (MMN), the deviance-elicited auditory deflection, explained. Psychophysiology. 2010;47:66–122. doi: 10.1111/j.1469-8986.2009.00856.x. [DOI] [PubMed] [Google Scholar]
- Meyer T, Olson CR. Statistical learning of visual transitions in monkey inferotemporal cortex. Proc Natl Acad Sci U S A. 2011;108:19401–19406. doi: 10.1073/pnas.1112895108. [DOI] [PMC free article] [PubMed] [Google Scholar]
- Murray SO, Wojciulik E. Attention increases neural selectivity in the human lateral occipital complex. Nat Neurosci. 2004;7:70–74. doi: 10.1038/nn1161. [DOI] [PubMed] [Google Scholar]
- Näätänen R. The role of attention in auditory information processing as revealed by event-related potentials and other brain measures of cognitive function. Behav Brain Sci. 1990;13:201–233. [Google Scholar]
- Näätänen R, Jacobsen T, Winkler I. Memory-based or afferent processes in mismatch negativity (MMN): a review of the evidence. Psychophysiology. 2005;42:25–32. doi: 10.1111/j.1469-8986.2005.00256.x. [DOI] [PubMed] [Google Scholar]
- Näätänen R, Paavilainen P, Rinne T, Alho K. The mismatch negativity (MMN) in basic research of central auditory processing: A review. Clin Neurophysiol. 2007;118:2544–2590. doi: 10.1016/j.clinph.2007.04.026. [DOI] [PubMed] [Google Scholar]
- Oostenveld R, Fries P, Maris E, Schoffelen JM. FieldTrip: open source software for advanced analysis of MEG, EEG, and invasive electrophysiological data. Comput Intell Neurosci. 2011;2011:156869. doi: 10.1155/2011/156869. [DOI] [PMC free article] [PubMed] [Google Scholar]
- Rao RP, Ballard DH. Predictive coding in the visual cortex: a functional interpretation of some extra-classical receptive-field effects. Nat Neurosci. 1999;2:79–87. doi: 10.1038/4580. [DOI] [PubMed] [Google Scholar]
- Rosburg T. Effects of tone repetition on auditory evoked neuromagnetic fields. Clin Neurophysiol. 2004;115:898–905. doi: 10.1016/j.clinph.2003.11.011. [DOI] [PubMed] [Google Scholar]
- Rosburg T, Trautner P, Korzyukov OA, Boutros NN, Schaller C, Elger CE, Kurthen M. Short-term habituation of the intracranially recorded auditory evoked potentials P50 and N100. Neurosci Lett. 2004;372:245–249. doi: 10.1016/j.neulet.2004.09.047. [DOI] [PubMed] [Google Scholar]
- Schröger E, Wolff C. Mismatch response of the human brain to changes in sound location. Neuroreport. 1996;7:3005–3008. doi: 10.1097/00001756-199611250-00041. [DOI] [PubMed] [Google Scholar]
- Summerfield C, Trittschuh EH, Monti JM, Mesulam MM, Egner T. Neural repetition suppression reflects fulfilled perceptual expectations. Nat Neurosci. 2008;11:1004–1006. doi: 10.1038/nn.2163. [DOI] [PMC free article] [PubMed] [Google Scholar]
- Todorovic A, van Ede F, Maris E, de Lange FP. Prior expectation mediates neural adaptation to repeated sounds in the auditory cortex: an MEG study. J Neurosci. 2011;31:9118–9123. doi: 10.1523/JNEUROSCI.1425-11.2011. [DOI] [PMC free article] [PubMed] [Google Scholar]
- Wacongne C, Labyt E, van Wassenhove V, Bekinschtein T, Naccache L, Dehaene S. Evidence for a hierarchy of predictions and prediction errors in human cortex. Proc Natl Acad Sci U S A. 2011;108:20754–20759. doi: 10.1073/pnas.1117807108. [DOI] [PMC free article] [PubMed] [Google Scholar]
- Wacongne C, Changeux JP, Dehaene S. A neuronal model of predictive coding accounting for the mismatch negativity. J Neurosci. 2012;32:3665–3678. doi: 10.1523/JNEUROSCI.5003-11.2012. [DOI] [PMC free article] [PubMed] [Google Scholar]
- White PM, Yee CM. P50 sensitivity to physical and psychological state influences. Psychophysiology. 2006;43:320–328. doi: 10.1111/j.1469-8986.2006.00408.x. [DOI] [PubMed] [Google Scholar]
- Yee CM, White PM. Experimental modification of P50 suppression. Psychophysiology. 2001;38:531–539. doi: 10.1017/s0048577201981454. [DOI] [PubMed] [Google Scholar]
- Yi DJ, Chun MM. Attentional modulation of learning-related repetition attenuation effects in human parahippocampal cortex. J Neurosci. 2005;25:3593–3600. doi: 10.1523/JNEUROSCI.4677-04.2005. [DOI] [PMC free article] [PubMed] [Google Scholar]