

Abstract
Motion perception is qualitatively invariant across different objects and forms, namely, the same motion information can be conveyed by many different physical carriers, and it requires the processing of motion signals consisting of direction, speed, and axis or trajectory of motion defined by a moving object. Compared with the representation of orientation, the cortical processing of these different motion signals within the early ventral visual pathway of the primate remains poorly understood. Using drifting full-field noise stimuli and intrinsic optical imaging, along with cytochrome-oxidase staining, we found that the orientation domains in macaque V1, V2, and V4 that processed orientation signals also served to process motion signals associated with the axis and speed of motion. In contrast, direction domains within the thick stripes of V2 demonstrated preferences that were independent of motion speed. The population responses encoding the orientation and motion axis could be precisely reproduced by a spatiotemporal energy model. Thus, our observation of orientation domains with dual functions in V1, V2, and V4 directly support the notion that the linear representation of the temporal series of retinotopic activations may serve as another motion processing strategy in primate ventral visual pathway, contributing directly to fine form and motion analysis. Our findings further reveal that different types of motion information are differentially processed in parallel and segregated compartments within primate early visual cortices, before these motion features are fully combined in high-tier visual areas.
Introduction
Motion perception requires the processing of motion signals consisting of direction, speed, and the axis or trajectory of a moving object. Unlike direction-selective neurons with low spatial resolution in the macaque middle temporal (MT) area, those in the early visual pathway have small receptive fields that permit only a limited view of a moving object, and most frequently misrepresent the motion direction and speed, a phenomenon known as the “aperture problem” (Marr and Ullman, 1981; Pack and Born, 2001; Bradley and Goyal, 2008). Because of this aperture problem, many models have been proposed that combine an initial linear processing stage followed by a second nonlinear stage to overcome the ambiguities of local motion signals (Clifford and Ibbotson, 2002; Bradley and Goyal, 2008), for example, the well known “intersection of constraints” model (Adelson and Movshon, 1982; Simoncelli and Heeger, 1998; Rust et al., 2006). Most of these approaches make use of the “spatiotemporal energy detector” in V1 (Adelson and Bergen, 1985) as a model of the first linear processing stage. As the motion of an object generates a series of retinotopic activations, another possibility recently proposed in human psychophysical studies is that the axis or trajectory of motion can provide a spatial code, either perpendicular or parallel to the direction of motion depending on motion speed (Geisler, 1999; Burr and Ross, 2002). These psychophysical observations, known as “motion-streak” or “speed-lines,” are supported directly by single-cell recordings from macaque V1 and cat area 17 (Judge et al., 1980; Jancke, 2000; Geisler et al., 2001). However, although speed tuning is a common property of direction-selective neurons in MT (Maunsell and Van Essen, 1983a; Mikami et al., 1986; Rodman and Albright, 1987; Lagae et al., 1993; Perrone and Thiele, 2001; Priebe et al., 2003), it is not ubiquitous in V1 and V2 (Foster et al., 1985; Orban et al., 1986; Priebe et al., 2006). Furthermore, direction domains have only recently been demonstrated in V2 thick/pale stripes, but not in V1 where only weak motion signals corresponding to axes of moving dots at 1°/s were mapped (Lu et al., 2010). As the ventral visual pathway in primates is believed to encode mainly form information (Van Essen and Gallant, 1994), how V1, V2, and V4 within the macaque ventral pathway are functionally organized to process direction, speed, and axis of motion remains largely unclear.
Here we found that orientation domains in V1, V2, and V4 that processed orientation signals also served to process motion signals associated with the axis and speed of motion. Direction signals were processed independently of motion speed by separate neuronal populations within the thick stripes of V2. The speed-dependent population responses encoding motion axes were precisely predicted by a spatiotemporal energy model. Thus, the population responses within orientation columns of V1, V2, and V4 provide a precise representation of the spatiotemporal integration of retinotopic activations generated by a moving object. Our results also offer new insights into the parallel and segregated processing of different motion signals within the primate early visual cortices.
Materials and Methods
Animal preparation and maintenance for optical imaging.
All experimental procedures for primate research were approved by the Institute of Neuroscience Institutional Animal Care and Use Committee and by the local ethical review committee of the Shanghai Institutes for Biological Sciences. Six adult rhesus macaques (five male and one female) (Macaca mulatta) weighing 3.0–4.5 kg were prepared and maintained for optical imaging as previously described (Schiessl et al., 2008; Pan et al., 2012), except that the general anesthesia was maintained by propofol (4–5 mg · kg−1 · h−1, i.v.) in five of the six macaques studied. One macaque was maintained under sodium thiopental (∼2 mg · kg−1 · h−1, i.v.) as previously reported (Schiessl et al., 2008; Lu et al., 2010; Pan et al., 2012). The lunate sulcus (LS) and superior temporal sulcus were used as the cortical landmarks for imaging (Ts'o et al., 1990; Blasdel, 1992; Ghose and Ts'o, 1997; Lu et al., 2010; Tanigawa et al., 2010; Pan et al., 2012).
Visual stimuli.
For optical imaging experiments, a gamma-corrected CRT monitor (Sony G520, 21 inches, 1280 × 960 pixels, 100 Hz, covering 40 × 30 degrees of visual angle) was placed 57 cm appropriately in front of the animal. Full-screen visual stimuli were computer generated using custom-written software based on MATLAB and Psychtoolbox-3, and were presented binocularly. The spatial frequency (SF) and temporal frequency (TF) of sine-wave gratings was 1.5 cycles per degree (cpd) and 5 Hz. To maximally diminish the interferences of global luminance changes and orientation form cues from the motion processing system, a full-field noise stimulus (FNS) was employed (Fig. 1A). In addition, there was no clear perceptible motion streak on the CRT monitor for moving FNS as assessed by human observers because, on average, the dark and bright noise elements were balanced within moving FNS and tended to cancel each other out along the axis of motion within the speed range we used. To generate a full screen noise texture we started out by creating a noise figure that spanned 20 × 15 deg as our initial noise texture. Each individual pixel within this figure spanned ∼1.8 arcmin and was chosen randomly from a uniform grayscale distribution from 0.2 to 87 candela per meter squared (cd · m−2) with the mean luminance being ∼45 cd · m−2. The initial noise texture was then magnified once to fill the full screen by bilinear interpolation to form our standard FNS (Fig. 1A) except where otherwise stated. Unlike sine-wave gratings, the Fourier power spectrum of this standard static FNS shows uniform distribution in orientation dimension (Fig. 1B) and the majority of power (85%) is within 7.41 cpd in SF dimension (Fig. 1C). The drifting speeds tested for the noise stimuli ranged from 1–20°/s.
Figure 1.
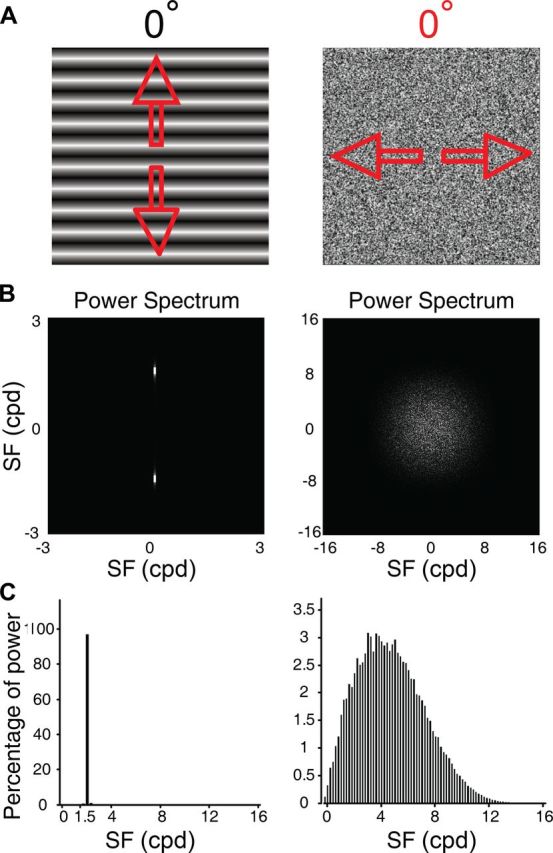
The visual stimuli and their Fourier spectra. A, Stimulus diagrams of the sine-wave grating (0° orientation) at SF 1.5 cpd and the standard FNS moving along 0° motion axis. Arrows indicate the directions of motion. B, The Fourier power spectra. For the sine-wave grating, two bright spots demonstrate that most stimulus power is presented at a single spatial frequency and orientation. Note that the Fourier power spectrum of the static FNS shows uniform distribution in orientation dimension. C, Percentage of Fourier power along the SF dimension. The majority of power (85%) for FNS resides below SF 7.41 cpd.
Intrinsic optical imaging and data analysis.
All the equipment and recording procedures used in our customized optical imaging system have been described earlier (Pan et al., 2012), using two Dalsa Pantera 1M60 CCD cameras combined with two telecentric 55 mm f2.8 video lenses for simultaneous recording from two chambers, one on each side of the skull. Within each trial there were two stimulus conditions, a pair of complementary visual stimuli, for example, the right and left eye stimulus pair or the 0 and 90° orientation pair. Visual responses were recorded at 16 frames per second for a period of 8 s, including 1 s before stimulus onset under 630 ± 10 nm red light illumination. The interstimulus interval was 13 s. For stimuli of drifting sine-wave gratings, data were typically averaged over 32 or 64 trials, while for drifting FNS, the data were obtained for at least 64 trials. The boundary of V1 and V2 was defined classically using either retinotopic space mapping or ocular dominance mapping, which produced stripe-like compartments perpendicular to the border between V1 and V2 (Ts'o et al., 1990; Blasdel, 1992; Lu et al., 2010).
For each trial, frames taken after the stimulus was on for 3–7 s were averaged and then a blank frame (the averaged response for the 1 s interval before the stimulus onset) was subtracted and divided to generate a single-condition map of reflectance change (ΔR/R). Differential orientation and motion-axis maps were created by pixelwise subtraction of single-condition maps activated by a stimulus pair with orthogonal orientations (e.g., 0–90°). To obtain a differential direction map, we subtracted two single-condition maps produced by a stimulus pair with opposing directions (e.g., 0–180°). Orientation and direction preference maps were classically constructed using a vector summation algorithm (Blasdel and Salama, 1986; Ts'o et al., 1990; Bonhoeffer and Grinvald, 1996; Pan et al., 2012). A variability map was obtained to find pixels with large cross-trial variability (e.g., blood vessels and other noisy regions) and a mask was generated, based on an objectively chosen threshold (Zhan and Baker, 2006; Pan et al., 2012). Pixels covered by the mask in differential and preference maps were interpolated only for the purpose of display and were never used in further quantitative analysis. The images were then highpass filtered (1.1–1.2 mm in diameter) and smoothed (85–323 μm in diameter) by circular averaging filters to suppress low- and high-frequency noise while avoiding signal distortion. Angular differences between different pairs of orientation, motion-axis, and direction preference maps were calculated and histograms were constructed to display the results. For the quantification of the response amplitude, absolute values of ΔR/R in each responsive patch of a differential map (including patches preferring the first and the second condition), were averaged, and this averaged intensity was taken as the response amplitude. Response profile analysis (Basole et al., 2003; Zhan and Baker, 2006; Pan et al., 2012) was performed to extract the orientations best represented by the differential orientation and motion-axis maps. In brief, the cortical area to be analyzed was divided up into 12 equally spaced bins (from 0 to 180° in 15° steps) according to the orientation preference map derived from the responses to drifting sine-wave gratings. Each orientation bin contains all the cortical locations tuned to the corresponding orientation. The signs of ΔR/R values in the differential map were reversed, so that pixels responsive to the first stimulus condition of a trial had positive values while pixels responsive to the second stimulus obtained negative values, and then the mean was subtracted from each pixel. To calculate the response profile, the ΔR/R values within each of the orientation bins were averaged to give a measurement of response strength for that orientation before a response profile, across all bins, was produced. The response profile was also fitted with a full cycle of a cosine function, R(θ) = A × cos[2π(θ + θb)/180], where R is the response strength as a function of θ, the equally spaced orientations. A and θb are the parameters to be fitted, corresponding to response strength and orientation best represented by the differential map, respectively. The best-fitting cosine function was represented as the green broken line in figures where needed for a clear illustration of orientation response profiles.
Histological cytochrome-oxidase staining of V1 and V2.
Animal perfusion and conventional histological processing were performed after each optical-imaging experiment. V2, also called prestriate cortex, is the second major visual cortex located in the occipital lobe of the primate brain. Unlike V1, which is largely exposed on the cortical surface, the majority of V2 is embedded under LS in old world monkeys such as macaques. After flattening V2, the cytochrome-oxidase (CO) staining of V1 and V2 revealed CO-stained blobs and stripes (thin, thick, and pale) as characteristic patterns of V1 and V2, respectively (Sincich and Horton, 2005). The procedures for flattening V2 and the CO staining protocol were adopted from published methods (Sincich and Horton, 2003, 2005), with special attention paid to the flattening of the region between V1 and V2. Postfixation was performed with brain tissues sunk in 1.5% paraformaldehyde in phosphate buffer (PB) plus 30% sucrose. The tissues were cut parallel to the pial surface at 50 μm by a vibrating slicer and the slices were dried by air on gelatin-coated slides. Each section was reacted 4–8 h for CO staining in a solution containing 50 mg diaminobenzidine, 30 mg cytochrome, and 20 mg catalase per 100 ml of 0.1 m PB, pH 7.4. Each type of V2 stripes was defined classically as thin, pale, or thick by its physical appearance in CO-stained sections and by its spatial alignment perpendicular to the border of V1 and V2. Lesions made after optical-imaging experiments were reconstructed after histological processing. The boundary of the recording area marked under the recording chamber, together with the location of LS, was also used as a landmark for histological reconstruction. To further clarify the relationship between different functional domains recorded optically and CO-stained stripes in V2, we compared the pixel intensity profile of functional domains with that of corresponding histological sections along the direction of LS. Briefly, we took the absolute value of each pixel in a differential map of intrinsic signals, making pixels in the responsive domains all positive before selecting a rectangular part from each differential map that encoded orientation/axis of motion, color, and direction, respectively, in recorded area V2. The length of selected rectangle was equal to that of the differential map of optical imaging and the change of pixel intensities was calculated as a function of spatial positions along the axis of LS. For a histological section, we smoothed the slice image with a median-filtering kernel (117 × 117 μm2). A rectangular part very close to LS, with a width of 1.16–3.11 mm and the same length as optically recorded maps, was also selected to determine changes in pixel intensity of the CO-staining image. The mean value of the curve was plotted to classify different V2 stripes (Heider et al., 2000). Finally we compared the pixel intensity profile derived from the histological section with that from different functional maps to further identify the overlap between different CO-stained stripes and distinct functional domains, mainly based on the corresponding locations of peaks and troughs of the compared curves (see Fig. 3).
Figure 3.
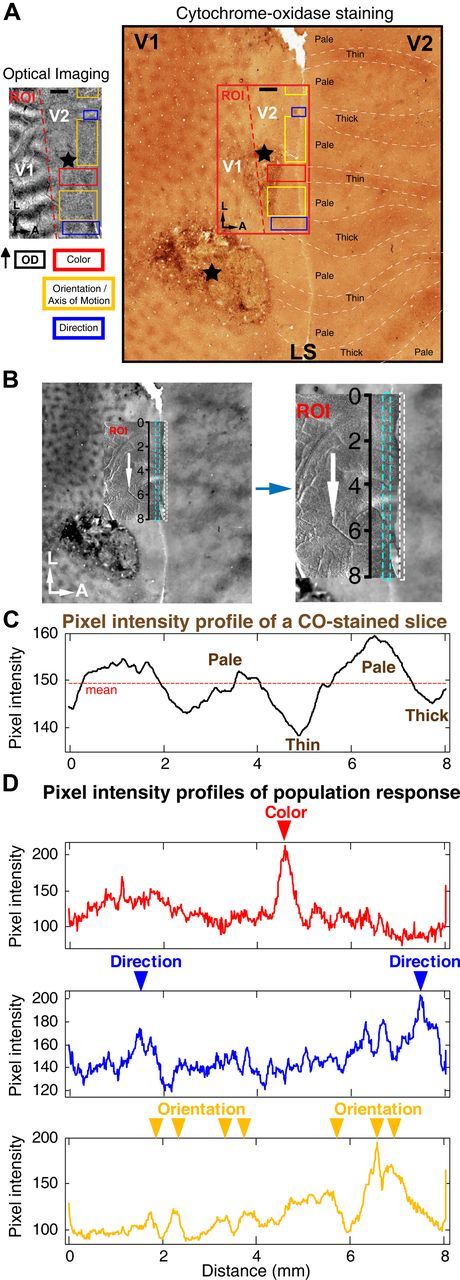
Spatial alignment of cortical functional domains and CO stained stripes of a flattened V2 in the left hemisphere of macaque M06275. A, Differential OD map as shown in Figure 2B. CO staining revealed clear blobs in V1 and the pale, thin, and thick stripes in V2. Colored boxes within ROI represent the different functional domains activated by different visual stimuli (Fig. 2C–F), and were aligned with the histological section containing the same region of V1 and V2. Optical-imaging recordings were performed on the ROI before the histological study. Note that areas of V2 situated to the right of LS were unfolded for CO straining to show the full cycles of pale, thin, pale, and thick stripes. Black stars, Two lesions made after optical-imaging experiment. A, Anterior; L, lateral. Scale bar, 1 mm. B, The rectangular area selected for pixel intensity analysis along LS. C, Pixel intensity profile of a slice of CO-stained V2 stripes. Averaged pixel intensity was plotted as the dashed red line. D, Pixel intensity profiles of a rectangular area of each differential map coding different visual features.
A linear energy model simulation for motion-axis responses.
To model the motion-axis responses of V1 and V2 neuronal populations, we used a combination of the three linear filters described in previous studies (Baker and Issa, 2005; Mante and Carandini, 2005) that had been used to successfully explain population responses of both ferret and cat area 17. In this simple energy model, the receptive fields (RFs) of V1 and V2 neurons were represented in a 3D spatiotemporal frequency space as log-scaled Gaussian functions (Eqs. 1 and 2) as follows:
 |
 |
where p and ρ were the spatial and temporal frequency coordinates; Sp and Tρ were the preferred spatial and temporal frequencies; σs and σT were proportional to the spatial and temporal bandwidth in octaves.
The orientation tuning curve (Eq. 3) was defined as a wrapped Gaussian, with a peak orientation of φ̃ and a characteristic width σΩ.
 |
For the model simulation, we adopted the RF characteristics of V1 mainly from Foster et al. (1985), but with the value of orientation bandwidth from De Valois et al. (1982). V1 SF was set to 3.0 cpd that not only optimally elicited V1 population responses in our experiments tested with sine-wave grating stimuli but also was within V1 SF range of 0.5–8 cpd (mean 2.2 cpd) from single-cell recordings in Foster et al. (1985). All RF parameters of V2 were taken from Levitt et al. (1994a) (Table 1).
Table 1.
Receptive field parameters used for the model simulation
| Visual cortex | Preferred SF (cpd) | Bandwidth SF (octave) | Preferred TF (Hz) | Bandwidth TF (octave) | Bandwidth orientation (degree) |
|---|---|---|---|---|---|
| V1 | 3.0 | 1.8 | 3.7 | 2.9 | 40.7 |
| V2 | 1.4 | 2.4 | 3.2 | 3.2 | 28.8 |
SF, spatial frequency; TF, temporal frequency.
For a given stimulus A, population response R within a functional domain was modeled as the integral over all spatiotemporal frequencies and orientations of the stimulus (Eq. 4). Thus, the population responses of V1 and V2 could be quantitatively described by the multiplication of Fourier-transformed stimulus with Gaussian filters of orientation, spatial frequency, and temporal frequency as follows:
 |
Using this simple energy model, the simulated responses to two orthogonal stimuli were subtracted in an identical manner to our methods for generating differential orientation maps in the optical imaging experiments. Thus, the population responses activated by motion axes of FNS moving at different speeds were simulated. We also simulated V1 and V2 population neurons in response to different noise sizes and to different FNS generated with different sampling distributions of noise intensity (Gaussian vs uniform grayscale distribution). It should be noted that, unlike V1 and V2, the lack of ubiquitous tuning properties of TF, SF, and orientation for V4 neurons in the literature prevented us from using the simple energy model to simulate V4 population responses.
Results
Drifting sine-wave gratings are the most popular visual stimuli used to map cortical orientation domains (Grinvald et al., 1986; Ts'o et al., 1990; Blasdel, 1992; Khaytin et al., 2008; Ts'o et al., 2009; Lu et al., 2010; Pan et al., 2012), whereas stimuli such as visual noise and dots are widely used to dissect the motion processing system (Mackay, 1965; Nakayama and Tyler, 1981; Britten et al., 1992; Snowden et al., 1992). In this study, to maximally remove non-motion related cues, we employed lowpass filtered FNS, whose global translation was varied only in the direction, speed, and axis of motion. In contrast to the sine-wave grating, this visual noise stimulus contained no global luminance changes and had isotropic orientation components as shown by its Fourier transform (Fig. 1) (Chubb and Sperling, 1988). Data were collected from a total of six anesthetized adult macaques.
FNS robustly activated orientation domains in V1 and V2 but direction domains in V2 only
Within a region of interest (ROI) (Fig. 2A), classical differential maps were acquired by subtracting intrinsic optical signals elicited by a pair of complementary visual stimuli. In this manner, ocular dominance (OD) maps were generated by alternating visual stimulation of the right and left eye (Fig. 2B), and differential orientation maps were produced by presenting a pair of bidirectional drifting full-field sine-wave gratings with orthogonal orientations (Fig. 2C). Dark and bright regions within such maps indicate locations that prefer the first and second stimuli, respectively, with gray regions representing no preference. These classical functional maps obtained were consistent with previous reports (Ts'o et al., 1990, 2009; Blasdel, 1992; Lu et al., 2010; Pan et al., 2012). When FNS drifted bidirectionally (back and forth) along vertical (90°) and horizontal (0°) motion axes (at a speed of 7°/s), we found robust responsive cortical domains within both V1 and V2 (Fig. 2D). More strikingly, the functional domains activated by FNS were inverted with respect to those activated by drifting gratings of 0 and 90° orientations that had the same motion axes as the FNS (Fig. 2C,D).
Figure 2.

Distinct functional domains within V1 and V2 in the left hemisphere of macaque M06275. A, Cortical surface of V1 and V2 taken under 550 nm green-light illumination. The recorded ROI is indicated by the red box. A, Anterior; L, lateral. Scale bar, 1 mm. B, Differential OD map. Note that OD stripes run approximately perpendicular to V1/V2 border and are absent in V2. C, Differential orientation map obtained using stimuli of sine-wave gratings (0° vs 90°). Dark and bright areas correspond to orientation domains preferring 0 and 90°, respectively. Diagrams of the actual stimuli are displayed above the map. D, Differential motion-axis map. FNS drifted along motion axes of 90 and 0° in the experiment. Note that the pattern of motion-axis domains mirrors that activated by the gratings in C in an inverted fashion. E, Differential direction map. The diagrams of stimuli depict a pair of FNS moving in opposite directions (0° vs 180°). Note that direction-responsive domains were only found in V2 and spatially segregated from orientation domains. F, Color domain in V2 obtained using a drifting red-green of iso-luminance versus a drifting black–white sine-wave grating. The colored boxes indicate different functional domains corresponding to different visual features as described underneath each map.
Another critical element of motion perception is motion direction. By subtracting responses evoked by FNS drifting in opposite directions (0° vs 180°), we found direction-selective functional domains in V2 but not in V1 (Fig. 2E), confirming a recent finding (Lu et al., 2010). In addition, the direction-selective domains we observed were segregated from those encoding grating orientation and from the motion-axis domains activated by FNS in V2 (Fig. 2C–E). The differential maps of the same ROI for the 135 and 45° pair of motion axes and for the 45 and 225° pair of motion directions showed similar results (data not shown).
We also mapped the color domains in V2 by using red–green of iso-luminance versus white–black sine-wave gratings of the same orientation (Fig. 2F). The color domain in V2 was spatially segregated from those encoding form and motion information, consistent with previous findings (Livingstone and Hubel, 1984, 1988; Tootell and Hamilton, 1989; Ts'o et al., 1990; Roe and Ts'o, 1995; Gegenfurtner and Kiper, 2003; Xiao et al., 2003; Lu et al., 2010). Thus, distinct functional domains for processing the axis and direction of motion are spatially segregated, with only motion-axis domains overlapping with the classical orientation domains in both V1 and V2 (Fig. 2C–E).
Histological identification of V2 stripes for encoding motion direction and axis
A recent study has mapped direction domains in V2 from both anesthetized and awake macaques using random-dots stimuli (Lu et al., 2010). This study found that the majority of these domains (9 of 12 clusters) were spatially aligned with the center of orientation domains activated by luminance gratings and subsequently suggested that the direction domains were located in the thick/pale stripes of V2 (Lu et al., 2010). Without histological verification, it is impossible to identify the precise location for direction-selective responses as previous studies using extracellular recordings in macaque V2 have shown that orientation-selective neurons are present also in the thick stripes (DeYoe and Van Essen, 1985; Shipp and Zeki, 1985; Peterhans and von der Heydt, 1993; Hegdé and Felleman, 2007). In fact, early electrophysiological single-cell recordings in macaque V2 have demonstrated that the majority of direction-selective neurons are clustered in the thick stripes rather than the pale and thin stripes (DeYoe and Van Essen, 1985; Shipp and Zeki, 1985, 2002; Hubel and Livingstone, 1987; Peterhans and von der Heydt, 1993; Levitt et al., 1994a; Gegenfurtner et al., 1996). These findings from single-unit recordings are supported by early intrinsic optical imaging studies that showed orientation-selective responses are mainly located in the pale stripes of V2 while the color-selective responses are in the thin stripes (Ts'o et al., 1990, 2001; Roe and Ts'o, 1995; Xiao et al., 2003). In the current study, most direction domains that were mapped in macaque V2 were spatially separated from the functional domains encoding either grating orientation or chromatic information and only motion-axis domains were precisely in register with the orientation domains in V2. Thus, we performed CO staining of V1 and V2 for all macaques studied after imaging experiments to identify the anatomical relationship between these distinct functional domains. In a flattened section of V2 taken from a representative example of macaques (Fig. 3A), the cycle of three different CO compartments—the pale, thick and thin stripes—was clearly revealed, as previously reported (Horton and Hubel, 1981; Livingstone and Hubel, 1983; Tootell et al., 1983; DeYoe and Van Essen, 1985; Shipp and Zeki, 1985; Levitt et al., 1994b; Malach et al., 1994; Xiao and Felleman, 2004; Sincich and Horton, 2005; Federer et al., 2009; Lim et al., 2009). We spatially aligned the functional domains mapped with optical imaging for different visual features with those CO-stained stripes in V2 after reconstruction of lesions. Additionally, to further confirm the alignment, we adopted the method for the acquisition of changes in pixel intensities of the CO-staining image to classify different V2 stripes (Heider et al., 2000) (Fig. 3B–D; see Material and Methods), regardless of the fact that most CO-staining of V2 stripes shows more irregular patterns than V1 blobs (Sincich and Horton, 2005). The layout of these functional domains clearly revealed that the processing of the direction and chromatic information occurred in the regions corresponding to the thick and thin stripes in V2, respectively, while domains encoding the orientation and the axis of motion mainly took place in the pale stripes.
Relationship between motion-axis domains and motion speeds in V1, V2, and V4
For spot stimuli moving above some critical speeds, the orientation preferences of a subgroup of V1 neurons of both macaques and cats are shifted by 90°, becoming parallel to the direction of the moving spot (Jancke, 2000; Geisler et al., 2001; Jancke and Grinvald, 2007), supporting the motion streak or speed-lines phenomenon (Geisler, 1999; Burr and Ross, 2002; Burr and Thompson, 2011). In fact, an earlier V1 study in awake macaque had already noted that fast-moving dots along the axis of preferred orientation were more effective for activating neurons across all V1 laminae (Judge et al., 1980). As V1 is the primary gateway to both dorsal and ventral visual pathways in primates (Ungerleider and Mishkin, 1982; Felleman and Van Essen, 1991; Goodale and Milner, 1992; Van Essen and Gallant, 1994; Born and Bradley, 2005; Sincich and Horton, 2005; Nassi and Callaway, 2009), it is still not clear if the ventral visual pathway could directly contribute to the motion streak or speed-lines phenomenon. Further studies were thus performed specifically to examine the orientation preference of the motion-axis domains activated by FNS moving at different speeds, not only in V1, but also in V2 and V4. FNS moving at four different speeds (1, 2, 4, and 7°/s) all activated cortical domains in both V1 and V2 (Fig. 4A,B). The responsive regions from V1 and V2 were superimposed with colored iso-orientation contours derived from the orientation preference map generated using sine-wave gratings (Fig. 4C,D). The same way of presenting differential maps with colored iso-orientation contours superimposed was applied to the other example maps. Surprisingly, the motion-axis domains activated by FNS moving at 1°/s appeared very similar to those activated by drifting gratings in both V1 (ROI 1) and two pale stripes of V2 (ROI 2 and ROI 3), whereas those activated by FNS with moving speeds at and above 2°/s were completely inverted, with increased response strength for higher motion speeds (Fig. 4C,D). To quantitatively describe the orientation preference of the functional domains activated by sine-wave gratings and FNS, we performed response profile analysis using previously described methods (Basole et al., 2003; Zhan and Baker, 2006; Pan et al., 2012). The resulting orientation response profiles for drifting gratings and FNS moving at 1°/s were closely in register with each other in both V1 and V2 (Fig. 4E,F), indicating that the FNS-activated domains were actually the same domains activated by drifting gratings, with an orientation preference orthogonal to the axis of moving noise. However, the orientation response profiles, derived from FNS with moving speeds at and above 2°/s, were completely flipped for both V1 and V2 when compared with those derived from both gratings and FNS with 1°/s speed (Fig. 4E,F). This flip in preference demonstrated that FNS-activated domains had an orientation preference parallel to the direction of moving noise at speeds above 2°/s. Similar findings were observed in a total of 9 and 11 hemispheres examined for V1 and V2, respectively, across all six macaques studied (Figs. 5–7). We also examined the population responses of V1 and V2 elicited by FNS with two different sizes of large noise in two macaques. The large noise size was generated by bilinear interpolation of our initial noise texture and magnified to 5 and 9 times, respectively. We found that the noise size had no clear effects on the phenomenon that the orientation preference of population responses was perpendicular to the axis of moving noise at low speed but parallel when at high speed. However, the critical speeds for the flipping were increased to ∼2 and 3°/s in V1 and 4 and 5°/s in V2 using the two larger noise stimuli described above, respectively (data not shown). More importantly, with respect to the classical orientation domains activated by sine-wave gratings, we also observed inverted motion-axis domains in V4 elicited by noise stimuli moving at 7°/s, along with those simultaneously mapped inverted motion-axis domains in V1 and V2 across five hemispheres investigated in three macaques (Figs. 6, 7). These observations in simultaneously recorded V1, V2, and V4 of macaque ventral pathway were consistent with the finding from a recent human brain imaging study that showed fast motion activates many early visual cortices of humans including V1, but not V5/MT (Apthorp et al., 2010). Also, our observation of motion-axis domains overlapping with orientation domains in macaque V1 was consistent with a very recent report using voltage-sensitive dye imaging in cat visual area 17, in which the physical motion of a moving grating was directly observed across overlaid visual space and orientation maps (Onat et al., 2011). Thus, our results reveal that orientation preference domains in V1, V2, and V4 that process orientation signals also serve to process motion signals associated with the axis and speed of motion. These simultaneous recordings of V1, V2, and V4 suggest that orientation domains encoding the past trajectory of a moving object is a common feature in the early ventral visual pathway of the macaque.
Figure 4.
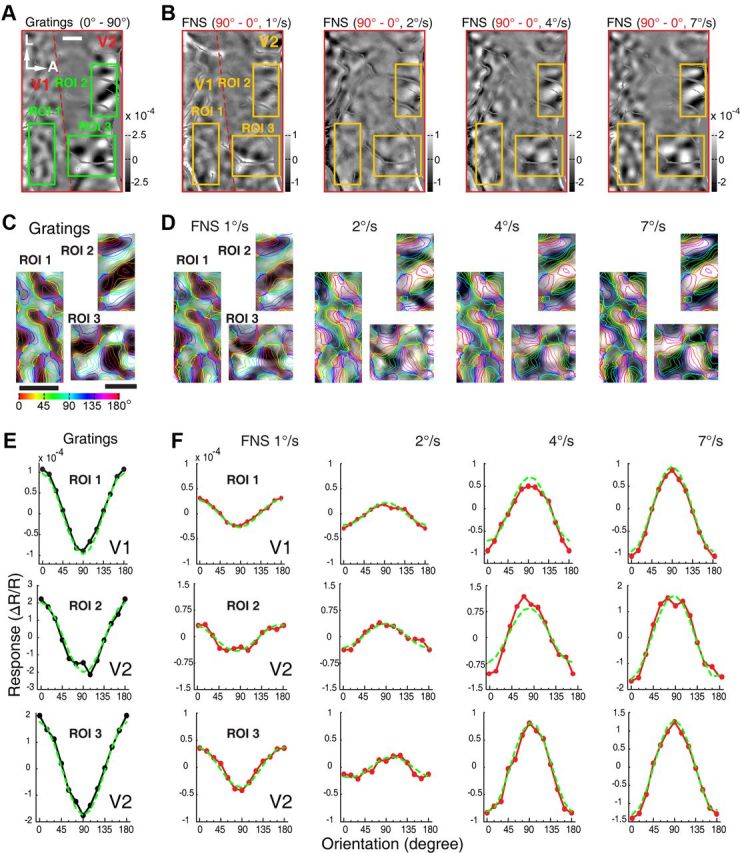
Motion-axis maps activated by FNS moving at different speeds in V1 and V2 in the left hemisphere of macaque M06275. A, Differential orientation map for sine-wave gratings (0–90°). Three different ROIs (one in V1, two in V2) outlined by the green boxes were analyzed in detail. Blood vessels were colored gray. B, Differential motion-axis maps generated by FNS drifted at different speeds. The ROIs boxed in yellow are identical to those in A. C, D, Magnified maps from representative ROIs of V1 and V2 for grating stimuli and FNS, respectively. Regions covered by blood vessels were interpolated to reveal the complete response patterns. E, F, Results of orientation response profile analysis from corresponding ROIs of C and D. Note that when the FNS moving speed exceeded 1°/s, the population response profiles inverted in comparison with those activated by sine-wave gratings and FNS with moving speed of 1°/s. Scale bar, 1 mm.
Figure 5.
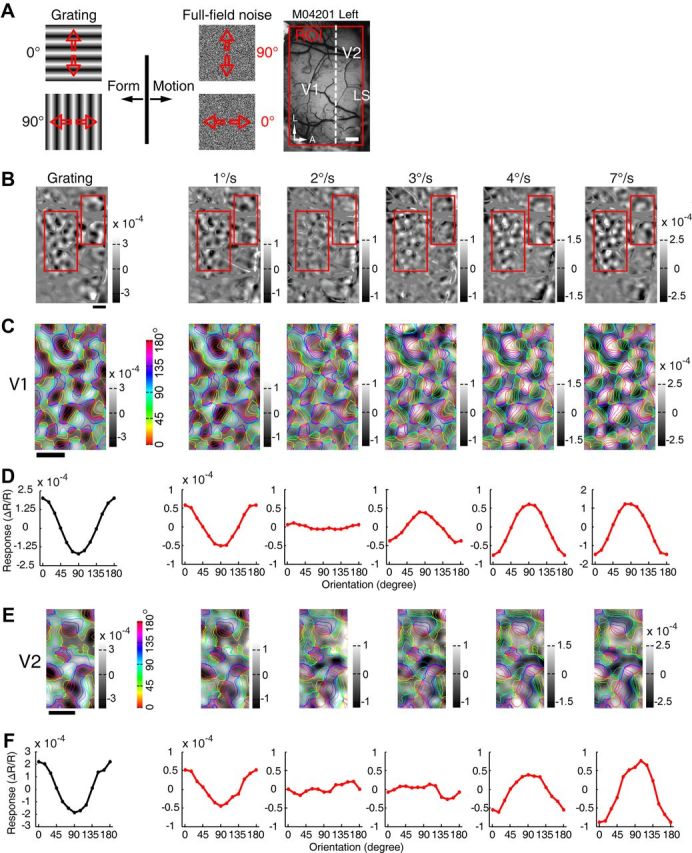
Further example of motion-axis domains in V1 and V2 in the left hemisphere of macaque M04201. A, Stimulus diagrams of sine-wave gratings and FNS. Red arrows indicate motion directions. Recording area was outlined by a red box overlaid onto an image of the cortical surface of V1 and V2 taken under green-light illumination (550 nm). A, Anterior; L, lateral. LS runs just to the right of the imaged area. B, Differential orientation maps generated by pairs of sine-wave gratings with orthogonal orientations (0–90°) and FNS moving along orthogonal motion axes (90–0°) with different speeds (1, 2, 3, 4, and 7°/s). Blood vessels were colored gray. Note that the white and black polarities of orientation domains activated by FNS inverted when the moving speed exceeded 2°/s. Red boxes indicate ROIs of V1 and V2 selected for further analysis. C, E, Magnified maps from representative ROIs in B. D, F, Results of orientation response profile analysis for response maps in C and E, respectively. Note that when the FNS moving speed exceeded 2°/s, the response profiles inverted compared with those activated by the sine-wave gratings and the FNS with moving speed of 1°/s. Scale bar, 1 mm.
Figure 6.
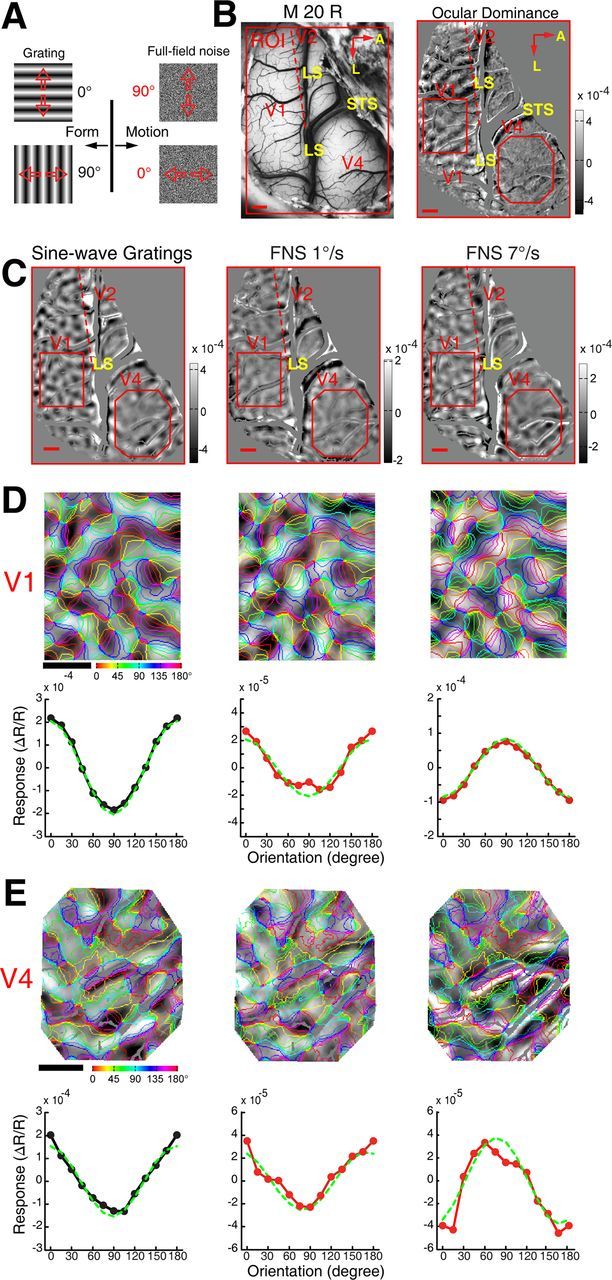
Motion-axis domains within V1, V2, and V4 recorded simultaneously in the right hemisphere of macaque 20. A, Diagrams of the visual stimuli. B, The cortical vasculature in the imaged region of V1, V2, and V4. The red dashed line depicts the border between V1 and V2 as revealed by OD map (right). Note in this animal most of V2 was embedded underneath the LS. The red subregions overlaid on the OD map (right) and on the differential maps in C indicate areas of V1 and V4 that were further analyzed in D and E. Scale bar, 1 mm. C, Differential orientation map obtained with drifting sine-wave gratings and motion-axis maps generated by FNS moving at speeds of 1 and 7°/s. The bright and dark polarities of the orientation domains in the small exposed area of V2 activated by the axis of moving noise at 7°/s were inverted with respect to those activated by sine-wave gratings. Blood vessels and other noisy regions were masked gray. D, E, Magnified maps from representative areas of V1 and V4 with the results from orientation response profile analysis shown underneath. No orientation response profiles were generated for V2 because there was very little of V2 exposed. Similar findings were also obtained using FNS moving at speeds of 1 and 7°/s along 135 and 45° axes.
Figure 7.
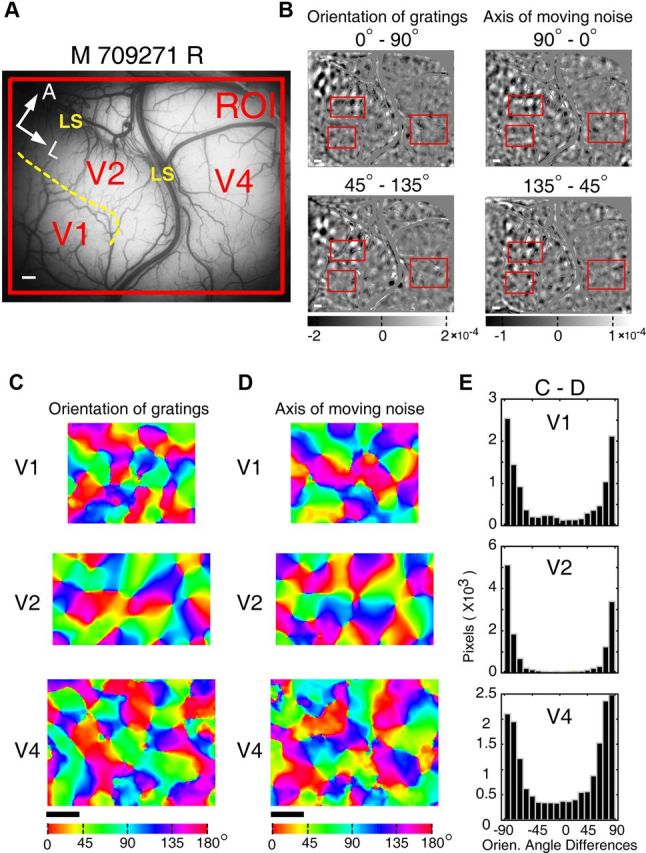
Further example of motion-axis domains within V1, V2, and V4 recorded simultaneously in macaque 709271 right hemisphere. A, The recorded region of V1, V2, and V4. The yellow dashed line depicts the border between V1 and V2. A, Anterior; L, lateral. Scale bar, 1 mm. B, Differential orientation maps generated using drifting sine-wave gratings (0–90° and 45–135°), and motion-axis maps produced by drifting FNS (90–0° and 135–45°). The red boxed ROIs in V1, V2, and V4 were further analyzed in C–E. Blood vessels and other noisy regions were masked gray. C, D, Orientation preference maps (color map) generated using vector summation method from representative regions of V1, V2, and V4 (outlined by the red boxes in B). Colors depict the full range of orientation preferences. E, Histograms produced by subtracting different pairs of color maps of the same visual area in C and D. The histograms display the distribution of angular differences in preferred orientations between the two sets of maps. All the resulting histograms peak around ±90°, demonstrating orthogonal orientation preference for sine-wave gratings and FNS with a moving speed of 7°/s in V1, V2, and V4.
Relationship between direction domains and motion speeds in the thick stripes of V2
Motion direction and speed together form a single vector known as motion velocity (Bradley and Goyal, 2008). To explore the effects of speed on the preference of direction-selective domains, we compared the population responses to FNS drifted in opposite directions at speeds of 1 and 7°/s (the speed of 7°/s activated inverted orientation domains for axes of motion). As illustrated in Figure 8, clear direction-selective domains were activated by FNS moving at both speeds in V2 but not in V1. Most importantly, the direction-selective domains elicited by opposite directions across all four pairs appeared very similar between motion speeds of 1 and 7°/s (Fig. 8A,B). Using the conventional vector-summation method as described in previous studies (Shmuel and Grinvald, 1996; Weliky et al., 1996; Lu et al., 2010; Pan et al., 2012), direction preference maps were generated separately for 1 and 7°/s within ROIs 1 and 2 (Fig. 8C). We further analyzed the microstructure of these direction domains at 1 and 7°/s. We found that direction domains in V2 at both speeds not only exhibited clear pinwheel centers and organizations with gradually changing preferences (Fig. 8C), but also the preferred directions tended to be perpendicular to the preferred orientations elicited by drifting gratings (data not shown). The organization of these direction preference maps within the thick stripes of macaque V2 exhibited a similar pattern to those previously reported in ferret area 17 and cat area 18 where direction-selective neurons are homogeneously distributed into mosaic-like maps of direction preference (Shmuel and Grinvald, 1996; Weliky et al., 1996; Li et al., 2008). Pixelwise subtraction of the angles of preferred directions at the two motion speeds showed histograms peaking around 0° for both ROIs (Fig. 8C), which indicated no change in the preferred direction despite the great change in motion speed. Similar results were observed in five hemispheres examined across three macaques. In conclusion, unlike motion-axis domains in pale stripes of V2, the preference of direction domains, only present in the thick stripes of V2, was independent of motion speed, suggesting that the direction signals were processed by a separate neuronal population and at least in part by a different mechanism. This separate neural mechanism underlying direction selectivity in the thick stripes of V2 (DeYoe and Van Essen, 1985; Shipp and Zeki, 1985, 2002; Peterhans and von der Heydt, 1993; Levitt et al., 1994a; Gegenfurtner et al., 1996) is most likely similar to those in V1 and MT of the macaque dorsal pathway (Adelson and Movshon, 1982; De Valois et al., 1982; Albright, 1984; Hawken et al., 1988; Movshon and Newsome, 1996; Simoncelli and Heeger, 1998; Born and Bradley, 2005; Priebe et al., 2006; Rust et al., 2006; Bradley and Goyal, 2008; Hedges et al., 2011).
Figure 8.
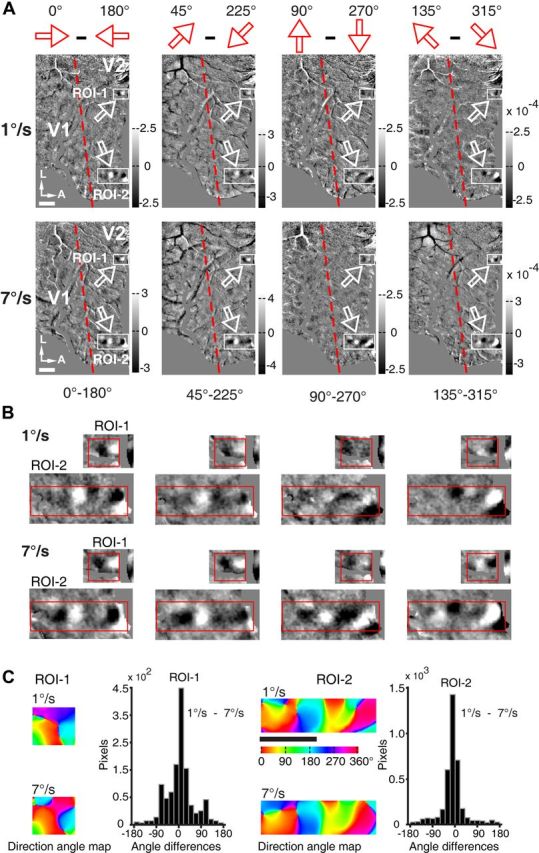
The direction-selective responses recorded in V2 from the left hemisphere of macaque M06275. A, Differential direction maps in V2. Moving FNS of 1 and 7°/s were used to produce these differential maps. In each image the red dashed line delineates the V1 and V2 border. Scale bar, 1 mm. White arrows point to the only regions with direction-selective responses in V2 (examined in details in B and C). Blood vessels and unrelated marginal regions were colored with gray. B, The ROIs outlined in A were magnified for a clearer view and easier comparison. C, Detailed analysis of the direction preference maps in the two ROIs outlined in B. Direction angle maps depict the direction preferences of the two ROIs for FNS moving at 1 and 7°/s. Histograms show the angular differences between the direction angle maps generated by FNS at moving speeds of 1 and 7°/s. The percentages of pixels possessed angular differences between −60° to 60° amounted to 73 and 85% in ROI 1 and ROI 2, respectively, indicating highly matched direction preference maps produced by FNS with moving speeds of 1 and 7°/s.
Relationship between motion-axis domains and motion speeds in the thick stripes of V2
Previous studies have shown that orientation-selective neurons are also present in V2 thick stripes (DeYoe and Van Essen, 1985; Shipp and Zeki, 1985; Peterhans and von der Heydt, 1993; Hegdé and Felleman, 2007), the only loci where direction preference domains could be mapped in the macaque (Fig. 8). We thus directly examined the orientation signals within V2 thick stripes in response to sine-wave gratings and FNS with bidirectional motion. Figure 9 shows the orientation domains activated by both gratings and FNS within the same ROI 2 as that in Figure 8 where clear direction domains were mapped. There were no differences in response strength between pale and thick stripes activated by axes of moving noise at the speed of 2°/s (p = 0.334, t test). However, the response strength in the thick stripes for grating stimuli and the axis of moving noise at the speed of 1°/s appeared to be weaker than that in the pale stripes (p = 0.014 for gratings; p = 0.0085 for moving noise, t test). Furthermore, the average population responses for the axis of moving noise, at speeds of 4 and 7°/s, were much weaker in the thick stripes than those in the pale stripes (p < 0.0001, t test). Most importantly, unlike the direction domains that lay within the same thick stripes of V2 and were independent of motion speed (Fig. 8), the preference of motion-axis domains depended critically on motion speed and inverted around 2°/s (Fig. 9).
Figure 9.

Motion-axis domains within a thick stripe in V2, from the left hemisphere of macaque M06275. A, Differential orientation maps produced by sine-wave gratings (0–90° and 45–135°) from ROI 2 in Figure 8, a region that showed robust direction-selective responses. The corresponding orientation response profiles are shown underneath each differential map. B, Differential motion-axis maps generated by FNS drifted at different speeds. The results of response profile analysis at each speed are shown underneath each motion-axis map. Note that when the FNS moving speed exceeded 2°/s, the population response profiles inverted in comparison with those generated by gratings and FNS with moving speed of 1°/s. Scale bar, 1 mm.
A spatiotemporal energy model simulation for population responses in V1 and V2
Cortical neurons in macaque V1 and V2 respond rigorously to the orientation of a physical stimulus when the orientation matches their oriented RFs and the spatial and temporal frequencies of the stimulus are within their spatiotemporal pass-bands (Hubel and Wiesel, 1968; De Valois et al., 1982; Foster et al., 1985; Burr et al., 1986; Livingstone and Hubel, 1987; Levitt et al., 1994a; Carandini et al., 2005; Rust et al., 2005; Issa et al., 2008). Using SF, TF, and orientation filters described in previous studies (Baker and Issa, 2005; Mante and Carandini, 2005), but with filter parameters derived from early single-cell recordings of macaque V1 and V2 neurons (De Valois et al., 1982; Foster et al., 1985; Levitt et al., 1994a), we implemented the spatiotemporal energy model simulation of the population responses for both V1 and V2. The spatial orientations activated by axes of moving noise were successfully simulated (Fig. 10A), and more importantly, the flipping speeds were precisely predicted (Fig. 10B). Essentially, populations of V1 and V2 neurons temporally integrate local noise inputs along the axis of motion, inducing a stronger activation of V1 and V2 neurons with the preferred orientation orthogonal to the motion axis at low speeds but parallel to the motion axis at high speeds. We also simulated the population responses of V1 and V2 neurons to FNS with different noise sizes (from 1 × 1 pixel to approximate 16 × 16 pixels). Increasing noise size up to 16 × 16 pixels, led to large decreases in the magnitude of the simulated population responses at all speeds together with an increase in transition speeds, from 1.2 to 3.2°/s for V1 and from 1.7 to 5.7°/s for V2 (Fig. 10C), due to the changes of spatiotemporal energy profiles of FNS with different noise sizes. This simulation result agreed with our experimental observations. When further simulated population response to FNS with pixel intensity generated from Gaussian distribution, the results were consistent with those using stimuli of the noise generated from uniform grayscale distribution in both V1 and V2, as presented in Figure 10B. Together, with the evidence from previous studies (Adelson and Bergen, 1985; Geisler, 1999; Jancke, 2000; Geisler et al., 2001; Burr and Ross, 2002; Clifford and Ibbotson, 2002; Jancke and Grinvald, 2007; Bradley and Goyal, 2008; Burr and Thompson, 2011; Onat et al., 2011), these simulation results derived from a simple energy model further support the notion that neural populations with orientation-selective responses in both V1 and V2 play an important role in motion signal analysis.
Figure 10.
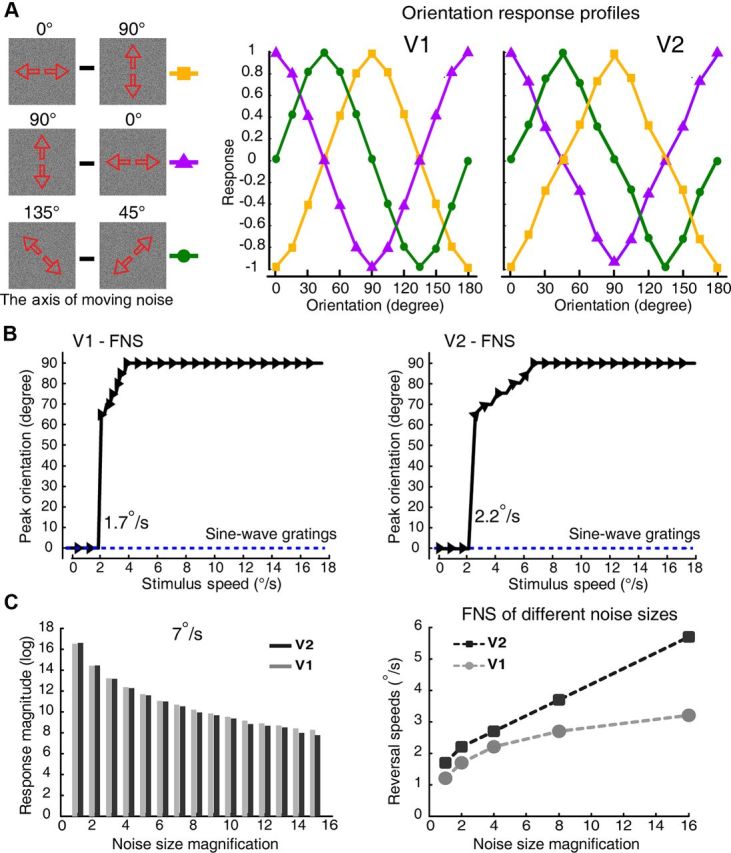
Spatiotemporal energy model simulation for the population responses coding motion axis in V1 and V2. A, Model simulation results for different pairs of motion axes of FNS with the moving speed of 1°/s. The diagrams of stimuli are shown to the left and the simulated results of different motion axes for macaque V1 and V2 at the speed of 1°/s are shown in the middle and right. B, The drastic change of peak orientation preferences to different speeds in both V1 and V2, predicted by the energy model simulation for motion-axis condition of 90–0°. The peak orientations for sine-wave gratings (0–90°) drifting bidirectionally were also simulated and indicated as blue dashed lines. The model predicted the critical speeds for the transition of preference of the motion axis in V1 and V2 to be 1.7 and 2.2 °/s. C, The energy model simulation for the effects of varying noise sizes on the reversal speed. As noise size increases, there are large decreases in the magnitude of simulated population responses at all speeds tested (results of 7°/s were shown, left). When the noise size increases to 16 times that of the pixel size of our initial noise texture, the transition speeds for the orientation preference of model neurons increased from 1.2 to 3.2°/s for V1 and from 1.7 to 5.7°/s for V2 (right).
In conclusion, as revealed here both experimentally and mathematically, across three visual areas (V1, V2, and V4) of macaque ventral stream, orientation-selective populations of neurons not only serve the processing of contour orientations but also the linear components of motion signals associated with the axis and speed. Our findings also add new insights to the segregated and parallel pathways for the distinct processing of different motion signals in V1, V2, and V4 of the macaque ventral visual pathway. Figure 11 is a schematic diagram to summarize our findings together with those of previous studies (Livingstone and Hubel, 1988; Van Essen and Gallant, 1994; Ts'o et al., 2001; Xiao et al., 2003; Born and Bradley, 2005; Sincich and Horton, 2005; Conway et al., 2007; Bradley and Goyal, 2008; Chen et al., 2008; Kotake et al., 2009; Nassi and Callaway, 2009; Lu et al., 2010; Tanigawa et al., 2010).
Figure 11.

Summary of the main findings. A schematic of the segregated and parallel pathways for distinct processing of different motion signals in V1, V2, and V4 of macaque ventral visual pathway, encapsulating our findings with those of previous studies. Here we illustrate only the main feedforward projections. Essentially, the orientation domains mapped in V1, V2, and V4 not only process contour orientation signals but also process motion signals associated with motion axis and speed. In contrast, the direction-selective responses recorded in V2 thick stripes are independent of motion speed.
Discussion
Another solution to the processing of motion signals in V1, V2, and V4
A central question in visual processing is how the visual system determines the direction of moving objects within the visual field given the inherent ambiguities of the motion detectors that have limited spatiotemporal capacity in early visual pathway of the primate. In the current study, we found that the orientation-selective columns of macaque V1, V2, and V4, which are usually thought to process the contour-orientation signals, also encoded the motion axis associated with the motion speed. This finding concurs with previous human psychophysical studies (Geisler, 1999; Ross et al., 2000; Burr and Ross, 2002; Badcock and Dickinson, 2009) and evidence from single-cell recordings in macaque V1 (Judge et al., 1980; Geisler et al., 2001).
Together, with results showing that the population responses coding the motion trajectory in macaque V1 and V2 can be precisely simulated with spatiotemporally oriented filters, our findings strongly support the notion that motion direction can be processed as orientation in space–time as a first linear step (Adelson and Bergen, 1985; Simoncelli and Heeger, 1998; Rust et al., 2005; Bradley and Goyal, 2008). Thus, unlike the nonlinear processing of motion direction in the dorsal pathway (Adelson and Movshon, 1982; Simoncelli and Heeger, 1998; Rust et al., 2006; Bradley and Goyal, 2008), the population responses within orientation columns of V1, V2, and V4 provide a linear spatial representation of the temporal series of retinotopic activations generated by a moving object. This motion-processing strategy, in the ventral pathway of the macaque, may serve a separate processing stream contributing directly to motion perception, helping to resolve the aperture problem (Geisler, 1999; Burr and Thompson, 2011) and underlying the perception of sampled motion in the cinema and on television (Burr and Ross, 1986, 2002). Indeed, in reality the representation of the spatial positions of moving objects has long been employed as in the speed-lines used by artists to indicate the direction of fast-moving objects in static 2D images.
Parallel and segregated processing of different motion signals in V1, V2, and V4
At the circuit level, while thalamic-parvocellular inputs carrying primarily form and color signals travel through layer 2/3 of V1 to the pale and thin stripes of V2 and subsequently to V4, those magnocellular signals conveying mostly motion and disparity information split into multiple streams projecting to area MT (Livingstone and Hubel, 1988; Sincich and Horton, 2005; Nassi and Callaway, 2009; Ninomiya et al., 2011). Specifically, the major direct ascending magnocellular signal inputs to MT come from spiny-stellate neurons of layer 4B and pyramidal neurons of layer 6 in V1 (Movshon and Newsome, 1996; Yabuta et al., 2001; Nassi and Callaway, 2009). The indirect stream travels via pyramidal cells in layer 4B and 6 of V1 to V2 thick stripes before arriving at MT (DeYoe and Van Essen, 1985; Shipp and Zeki, 1985; Sincich and Horton, 2005; Nassi and Callaway, 2009), where direction-selective neurons are known to cluster into columns (Albright et al., 1984; Malonek et al., 1994; Diogo et al., 2003; Xu et al., 2004). It should be noted that V2 thick stripes also receive some parvocellular inputs from layer 2/3 of V1 (Federer et al., 2009; Sincich et al., 2010), which most likely contribute to the orientation selectivity within the thick stripes (Fig. 9). As in all previous reports, direction domains were not found in V1 superficial layers with intrinsic optical imaging (Figs. 2, 8). Consequently, the lack of direction domains in pale stripes of V2 is understandable, as V2 pale stripes are the main projection targets for the orientation-selective neurons in layer 2/3 of V1. Nevertheless, our findings of distinct population responses within anatomically separated compartments support the parallel and segregated processing of different motion signals, before these signals are fully combined to allow cue-invariant motion and form processing in areas downstream of V2 (Albright, 1992; Merigan and Maunsell, 1993; Sáry et al., 1993; Onat et al., 2011) (Fig. 11).
The preference of motion-axis but not direction domains depends on motion speed
The axis of motion represents spatial positions of a moving object across the visual field through time and has been attributed to the spatiotemporal integration of visual system (Adelson and Bergen, 1985; Geisler, 1999; Jancke, 2000; Geisler et al., 2001; Burr and Ross, 2002). The occurrence of inverted orientation preference at high motion speeds (up to 100°/s for ferrets) has been reported in visual area 17 of carnivores (Jancke, 2000; Basole et al., 2003; Jancke and Grinvald, 2007), and been later mathematically simulated with a spatiotemporal energy model by integrating the stimulus energy falling into the RFs of area 17 neurons (Baker and Issa, 2005; Mante and Carandini, 2005). Using a similar spatiotemporal energy model but with RF characteristics of macaque V1 and V2 neurons (De Valois et al., 1982; Foster et al., 1985; Levitt et al., 1994a), the population responses to motion-axis stimuli were also reproduced mathematically (Fig. 10). These precise simulations using TF, SF, and orientation filters showed that the orientation-selective neurons with small spatiotemporally oriented RFs in macaque V1 and V2 encode motion axes with their preferences perpendicular or parallel to the motion axes that depend critically on motion speed.
Most direction-selective neurons in V1 are simple cells residing mainly in layers 4B and 6 (Hubel and Wiesel, 1968; Hawken et al., 1988; Movshon and Newsome, 1996; Gur and Snodderly, 2007), and most direction-selective pyramidal cells in layer 4B of V1 project to the thick stripes of V2 (Nassi and Callaway, 2009). It has long been known that many macaque V1 and V2 direction-selective neurons are velocity lowpass (Foster et al., 1985; Orban et al., 1986; Geisler et al., 2001), and the direction sensitivity disappears only when the moving speeds of the optimal bar stimulus are below the average speed of 0.21 and 0.79°/s for macaque central and peripheral V1/V2 neurons, respectively (Orban et al., 1986). Furthermore, most direction-selective simple cells in V1 are nonspeed tuned to drifting gratings, but this is not the case for some complex direction-selective cells that behave more like MT neurons instead (Priebe et al., 2006). Our results further suggest that the mechanisms for the processing of motion axis and direction are fundamentally different in pale and thick stripes of V2, which may reflect the main physiological differences between their prominent inputs of parvocellular and magnocellular signals. The dissociation between direction and speed of motion in V2 thick stripes supports the notion that the combining of motion direction and speed may occur primarily in MT via the direct V1 inputs.
The possible functional role for V2 direction domains
Reversible inactivation of V2 and V3 affects binocular disparity but not the direction selectivity of MT neurons (Ponce et al., 2008, 2011). Furthermore, previous studies have shown that functional domains for disparity are located in V2 thick stripes (Livingstone and Hubel, 1988; Ts'o et al., 2001, 2009; Chen et al., 2008), where direction-selective domains were also found (Figs. 2E, 8). These results support the idea that the direct pathway from thalamus to V1 and to MT conveys information about motion speed and direction (Bradley and Goyal, 2008; Nassi and Callaway, 2009), whereas indirect inputs from V2 thick stripes provide mostly disparity rather than direction information for MT (Livingstone and Hubel, 1988; Ponce et al., 2008). It is also important to note that V4 receives major inputs from its projecting neurons in V2 pale stripes (Shipp and Zeki, 1985; Xiao et al., 1999; Sincich and Horton, 2005; Nassi and Callaway, 2009), but many neurons in layer 4C of V1 and thick stripes of V2 are also found to project to corresponding modules in V4 (Ferrera et al., 1992; Ninomiya et al., 2011). Furthermore, up to one third of neurons in V4 are reported to be direction selective (Desimone and Schein, 1987; Tolias et al., 2005). Thus, combining with motion-axis domains, the primary functional role of direction-selective domains in V2 thick stripes is most likely to serve motion processing in the ventral pathway of the macaque (Fig. 11).
Concluding remarks
The central issue addressed here concerns the cortical organization and processing of different components of motion signals in the macaque ventral visual pathway (Fig. 11). The orientation domains mapped in V1, V2, and V4 encode the perpendicular and parallel motion below and above a low transition speed, respectively, whereas it is not the case for the segregated direction domains in the thick stripes of V2. Thus, the neuronal populations within these orientation domains with dual functions may provide a linear and efficient strategy for linking fine form and motion analysis, helping to resolve the aperture problem as well as contributing to the interactions between form and motion (Glass, 1969; Andersen, 1997; Lorenceau and Alais, 2001; Grunewald et al., 2002; Krekelberg et al., 2003; Smith et al., 2007; Kourtzi et al., 2008).
Footnotes
This work was supported by National “973” Program 2011CBA00405 and the Chinese Academy of Sciences “Hundred Talents Program” awards (Y.Y. and W. W.). We thank Drs. M.-m. Poo, Y. Frégnac, N. McLoughlin, and K. Grieve for comments and suggestions on the manuscript and Dr. A. Movshon for discussions on results and spatiotemporal filters. We also thank Dr. L.C. Sincich for his advice on flattening area V2.
References
- Adelson EH, Bergen JR. Spatiotemporal energy models for the perception of motion. J Opt Soc Am A. 1985;2:284–299. doi: 10.1364/josaa.2.000284. [DOI] [PubMed] [Google Scholar]
- Adelson EH, Movshon JA. Phenomenal coherence of moving visual patterns. Nature. 1982;300:523–525. doi: 10.1038/300523a0. [DOI] [PubMed] [Google Scholar]
- Albright TD. Direction and orientation selectivity of neurons in visual area MT of the macaque. J Neurophysiol. 1984;52:1106–1130. doi: 10.1152/jn.1984.52.6.1106. [DOI] [PubMed] [Google Scholar]
- Albright TD. Form-cue invariant motion processing in primate visual cortex. Science. 1992;255:1141–1143. doi: 10.1126/science.1546317. [DOI] [PubMed] [Google Scholar]
- Albright TD, Desimone R, Gross CG. Columnar organization of directionally selective cells in visual area MT of the macaque. J Neurophysiol. 1984;51:16–31. doi: 10.1152/jn.1984.51.1.16. [DOI] [PubMed] [Google Scholar]
- Andersen RA. Neural mechanisms of visual motion perception in primates. Neuron. 1997;18:865–872. doi: 10.1016/s0896-6273(00)80326-8. [DOI] [PubMed] [Google Scholar]
- Apthorp D, Bahrami B, Schwarzkopf DS, Kaul C, Alais D, Rees G. Motion streaks in the brain: an fMRI study. Perception. 2010;39:137. [Google Scholar]
- Badcock DR, Dickinson JE. Second-order orientation cues to the axis of motion. Vis Res. 2009;49:407–415. doi: 10.1016/j.visres.2008.11.009. [DOI] [PubMed] [Google Scholar]
- Baker TI, Issa NP. Cortical maps of separable tuning properties predict population responses to complex visual stimuli. J Neurophysiol. 2005;94:775–787. doi: 10.1152/jn.01093.2004. [DOI] [PubMed] [Google Scholar]
- Basole A, White LE, Fitzpatrick D. Mapping multiple features in the population response of visual cortex. Nature. 2003;423:986–990. doi: 10.1038/nature01721. [DOI] [PubMed] [Google Scholar]
- Blasdel GG. Differential imaging of ocular dominance and orientation selectivity in monkey striate cortex. J Neurosci. 1992;12:3115–3138. doi: 10.1523/JNEUROSCI.12-08-03115.1992. [DOI] [PMC free article] [PubMed] [Google Scholar]
- Blasdel GG, Salama G. Voltage-sensitive dyes reveal a modular organization in monkey striate cortex. Nature. 1986;321:579–585. doi: 10.1038/321579a0. [DOI] [PubMed] [Google Scholar]
- Bonhoeffer T, Grinvald A. Optical Imaging based on intrinsic signals: the methodology. In: Toga AW, Mazziotta JC, editors. Brain mapping: the methods. San Diego: Academic; 1996. pp. 55–97. [Google Scholar]
- Born RT, Bradley DC. Structure and function of visual area MT. Annu Rev Neurosci. 2005;28:157–189. doi: 10.1146/annurev.neuro.26.041002.131052. [DOI] [PubMed] [Google Scholar]
- Bradley DC, Goyal MS. Velocity computation in the primate visual system. Nat Rev Neurosci. 2008;9:686–695. doi: 10.1038/nrn2472. [DOI] [PMC free article] [PubMed] [Google Scholar]
- Britten KH, Shadlen MN, Newsome WT, Movshon JA. The analysis of visual motion: a comparison of neuronal and psychophysical performance. J Neurosci. 1992;12:4745–4765. doi: 10.1523/JNEUROSCI.12-12-04745.1992. [DOI] [PMC free article] [PubMed] [Google Scholar]
- Burr D, Ross J. Visual processing of motion. Trends Neurosci. 1986;9:304–307. [Google Scholar]
- Burr D, Thompson P. Motion psychophysics: 1985–2010. Vis Res. 2011;51:1431–1456. doi: 10.1016/j.visres.2011.02.008. [DOI] [PubMed] [Google Scholar]
- Burr DC, Ross J. Direct evidence that “speedlines” influence motion mechanisms. J Neurosci. 2002;22:8661–8664. doi: 10.1523/JNEUROSCI.22-19-08661.2002. [DOI] [PMC free article] [PubMed] [Google Scholar]
- Burr DC, Ross J, Morrone MC. Seeing objects in motion. Proc R Soc Lond B Biol Sci. 1986;227:249–265. doi: 10.1098/rspb.1986.0022. [DOI] [PubMed] [Google Scholar]
- Carandini M, Demb JB, Mante V, Tolhurst DJ, Dan Y, Olshausen BA, Gallant JL, Rust NC. Do we know what the early visual system does? J Neurosci. 2005;25:10577–10597. doi: 10.1523/JNEUROSCI.3726-05.2005. [DOI] [PMC free article] [PubMed] [Google Scholar]
- Chen G, Lu HD, Roe AW. A map for horizontal disparity in monkey V2. Neuron. 2008;58:442–450. doi: 10.1016/j.neuron.2008.02.032. [DOI] [PMC free article] [PubMed] [Google Scholar]
- Chubb C, Sperling G. Drift-balanced random stimuli: a general basis for studying non-Fourier motion perception. J Opt Soc Am A. 1988;5:1986–2007. doi: 10.1364/josaa.5.001986. [DOI] [PubMed] [Google Scholar]
- Clifford CW, Ibbotson MR. Fundamental mechanisms of visual motion detection: models, cells and functions. Prog Neurobiol. 2002;68:409–437. doi: 10.1016/s0301-0082(02)00154-5. [DOI] [PubMed] [Google Scholar]
- Conway BR, Moeller S, Tsao DY. Specialized color modules in macaque extrastriate cortex. Neuron. 2007;56:560–573. doi: 10.1016/j.neuron.2007.10.008. [DOI] [PMC free article] [PubMed] [Google Scholar]
- Desimone R, Schein SJ. Visual properties of neurons in area V4 of the macaque: sensitivity to stimulus form. J Neurophysiol. 1987;57:835–868. doi: 10.1152/jn.1987.57.3.835. [DOI] [PubMed] [Google Scholar]
- De Valois RL, Yund EW, Hepler N. The orientation and direction selectivity of cells in macaque visual cortex. Vis Res. 1982;22:531–544. doi: 10.1016/0042-6989(82)90112-2. [DOI] [PubMed] [Google Scholar]
- DeYoe EA, Van Essen DC. Segregation of efferent connections and receptive field properties in visual area V2 of the macaque. Nature. 1985;317:58–61. doi: 10.1038/317058a0. [DOI] [PubMed] [Google Scholar]
- Diogo AC, Soares JG, Koulakov A, Albright TD, Gattass R. Electrophysiological imaging of functional architecture in the cortical middle temporal visual area of Cebus apella monkey. J Neurosci. 2003;23:3881–3898. doi: 10.1523/JNEUROSCI.23-09-03881.2003. [DOI] [PMC free article] [PubMed] [Google Scholar]
- Federer F, Ichida JM, Jeffs J, Schiessl I, McLoughlin N, Angelucci A. Four projection streams from primate V1 to the cytochrome oxidase stripes of V2. J Neurosci. 2009;29:15455–15471. doi: 10.1523/JNEUROSCI.1648-09.2009. [DOI] [PMC free article] [PubMed] [Google Scholar]
- Felleman DJ, Van Essen DC. Distributed hierarchical processing in the primate cerebral cortex. Cereb Cortex. 1991;1:1–47. doi: 10.1093/cercor/1.1.1-a. [DOI] [PubMed] [Google Scholar]
- Ferrera VP, Nealey TA, Maunsell JH. Mixed parvocellular and magnocellular geniculate signals in visual area V4. Nature. 1992;358:756–761. doi: 10.1038/358756a0. [DOI] [PubMed] [Google Scholar]
- Foster KH, Gaska JP, Nagler M, Pollen DA. Spatial and temporal frequency selectivity of neurones in visual cortical areas V1 and V2 of the macaque monkey. J Physiol. 1985;365:331–363. doi: 10.1113/jphysiol.1985.sp015776. [DOI] [PMC free article] [PubMed] [Google Scholar]
- Gegenfurtner KR, Kiper DC. Color vision. Annu Rev Neurosci. 2003;26:181–206. doi: 10.1146/annurev.neuro.26.041002.131116. [DOI] [PubMed] [Google Scholar]
- Gegenfurtner KR, Kiper DC, Fenstemaker SB. Processing of color, form, and motion in macaque area V2. Vis Neurosci. 1996;13:161–172. doi: 10.1017/s0952523800007203. [DOI] [PubMed] [Google Scholar]
- Geisler WS. Motion streaks provide a spatial code for motion direction. Nature. 1999;400:65–69. doi: 10.1038/21886. [DOI] [PubMed] [Google Scholar]
- Geisler WS, Albrecht DG, Crane AM, Stern L. Motion direction signals in the primary visual cortex of cat and monkey. Vis Neurosci. 2001;18:501–516. doi: 10.1017/s0952523801184014. [DOI] [PubMed] [Google Scholar]
- Ghose GM, Ts'o DY. Form processing modules in primate area V4. J Neurophysiol. 1997;77:2191–2196. doi: 10.1152/jn.1997.77.4.2191. [DOI] [PubMed] [Google Scholar]
- Glass L. Moire effect from random dots. Nature. 1969;223:578–580. doi: 10.1038/223578a0. [DOI] [PubMed] [Google Scholar]
- Goodale MA, Milner AD. Separate visual pathways for perception and action. Trends Neurosci. 1992;15:20–25. doi: 10.1016/0166-2236(92)90344-8. [DOI] [PubMed] [Google Scholar]
- Grinvald A, Lieke E, Frostig RD, Gilbert CD, Wiesel TN. Functional architecture of cortex revealed by optical imaging of intrinsic signals. Nature. 1986;324:361–364. doi: 10.1038/324361a0. [DOI] [PubMed] [Google Scholar]
- Grunewald A, Bradley DC, Andersen RA. Neural correlates of structure-from-motion perception in macaque V1 and MT. J Neurosci. 2002;22:6195–6207. doi: 10.1523/JNEUROSCI.22-14-06195.2002. [DOI] [PMC free article] [PubMed] [Google Scholar]
- Gur M, Snodderly DM. Direction selectivity in V1 of alert monkeys: evidence for parallel pathways for motion processing. J Physiol. 2007;585:383–400. doi: 10.1113/jphysiol.2007.143040. [DOI] [PMC free article] [PubMed] [Google Scholar]
- Hawken MJ, Parker AJ, Lund JS. Laminar organization and contrast sensitivity of direction-selective cells in the striate cortex of the Old World monkey. J Neurosci. 1988;8:3541–3548. doi: 10.1523/JNEUROSCI.08-10-03541.1988. [DOI] [PMC free article] [PubMed] [Google Scholar]
- Hedges JH, Gartshteyn Y, Kohn A, Rust NC, Shadlen MN, Newsome WT, Movshon JA. Dissociation of neuronal and psychophysical responses to local and global motion. Curr Biol. 2011;21:2023–2028. doi: 10.1016/j.cub.2011.10.049. [DOI] [PMC free article] [PubMed] [Google Scholar]
- Hegdé J, Felleman DJ. Reappraising the functional implications of the primate visual anatomical hierarchy. Neuroscientist. 2007;13:416–421. doi: 10.1177/1073858407305201. [DOI] [PubMed] [Google Scholar]
- Heider B, Meskenaite V, Peterhans E. Anatomy and physiology of a neural mechanism defining depth order and contrast polarity at illusory contours. Eur J Neurosci. 2000;12:4117–4130. doi: 10.1046/j.1460-9568.2000.00293.x. [DOI] [PubMed] [Google Scholar]
- Horton JC, Hubel DH. Regular patchy distribution of cytochrome oxidase staining in primary visual cortex of macaque monkey. Nature. 1981;292:762–764. doi: 10.1038/292762a0. [DOI] [PubMed] [Google Scholar]
- Hubel DH, Livingstone MS. Segregation of form, color, and stereopsis in primate area 18. J Neurosci. 1987;7:3378–3415. doi: 10.1523/JNEUROSCI.07-11-03378.1987. [DOI] [PMC free article] [PubMed] [Google Scholar]
- Hubel DH, Wiesel TN. Receptive fields and functional architecture of monkey striate cortex. J Physiol. 1968;195:215–243. doi: 10.1113/jphysiol.1968.sp008455. [DOI] [PMC free article] [PubMed] [Google Scholar]
- Issa NP, Rosenberg A, Husson TR. Models and measurements of functional maps in V1. J Neurophysiol. 2008;99:2745–2754. doi: 10.1152/jn.90211.2008. [DOI] [PubMed] [Google Scholar]
- Jancke D. Orientation formed by a spot's trajectory: a two-dimensional population approach in primary visual cortex. J Neurosci. 2000;20:RC86. doi: 10.1523/JNEUROSCI.20-14-j0005.2000. [DOI] [PMC free article] [PubMed] [Google Scholar]
- Jancke D, Grinvald A. Cortical activity streaks evoked by fast moving stimuli form to patterns that map orientation of motion trajectories–voltage-sensitive dye imaging across cat primary visual cortex. Soc Neurosci Abstr. 2007;33 337.2. [Google Scholar]
- Judge SJ, Wurtz RH, Richmond BJ. Vision during saccadic eye movements. I. Visual interactions in striate cortex. J Neurophysiol. 1980;43:1133–1155. doi: 10.1152/jn.1980.43.4.1133. [DOI] [PubMed] [Google Scholar]
- Khaytin I, Chen X, Royal DW, Ruiz O, Jermakowicz WJ, Siegel RM, Casagrande VA. Functional organization of temporal frequency selectivity in primate visual cortex. Cereb Cortex. 2008;18:1828–1842. doi: 10.1093/cercor/bhm210. [DOI] [PMC free article] [PubMed] [Google Scholar]
- Kotake Y, Morimoto H, Okazaki Y, Fujita I, Tamura H. Organization of color-selective neurons in macaque visual area V4. J Neurophysiol. 2009;102:15–27. doi: 10.1152/jn.90624.2008. [DOI] [PubMed] [Google Scholar]
- Kourtzi Z, Krekelberg B, van Wezel RJ. Linking form and motion in the primate brain. Trends Cogn Sci. 2008;12:230–236. doi: 10.1016/j.tics.2008.02.013. [DOI] [PubMed] [Google Scholar]
- Krekelberg B, Dannenberg S, Hoffmann KP, Bremmer F, Ross J. Neural correlates of implied motion. Nature. 2003;424:674–677. doi: 10.1038/nature01852. [DOI] [PubMed] [Google Scholar]
- Lagae L, Raiguel S, Orban GA. Speed and direction selectivity of macaque middle temporal neurons. J Neurophysiol. 1993;69:19–39. doi: 10.1152/jn.1993.69.1.19. [DOI] [PubMed] [Google Scholar]
- Levitt JB, Kiper DC, Movshon JA. Receptive fields and functional architecture of macaque V2. J Neurophysiol. 1994a;71:2517–2542. doi: 10.1152/jn.1994.71.6.2517. [DOI] [PubMed] [Google Scholar]
- Levitt JB, Yoshioka T, Lund JS. Intrinsic cortical connections in macaque visual area V2: evidence for interaction between different functional streams. J Comp Neurol. 1994b;342:551–570. doi: 10.1002/cne.903420405. [DOI] [PubMed] [Google Scholar]
- Li Y, Van Hooser SD, Mazurek M, White LE, Fitzpatrick D. Experience with moving visual stimuli drives the early development of cortical direction selectivity. Nature. 2008;456:952–956. doi: 10.1038/nature07417. [DOI] [PMC free article] [PubMed] [Google Scholar]
- Lim H, Wang Y, Xiao Y, Hu M, Felleman DJ. Organization of hue selectivity in macaque V2 thin stripes. J Neurophysiol. 2009;102:2603–2615. doi: 10.1152/jn.91255.2008. [DOI] [PMC free article] [PubMed] [Google Scholar]
- Livingstone M, Hubel D. Segregation of form, color, movement, and depth-anatomy, physiology, and perception. Science. 1988;240:740–749. doi: 10.1126/science.3283936. [DOI] [PubMed] [Google Scholar]
- Livingstone MS, Hubel DH. Specificity of cortico-cortical connections in monkey visual system. Nature. 1983;304:531–534. doi: 10.1038/304531a0. [DOI] [PubMed] [Google Scholar]
- Livingstone MS, Hubel DH. Anatomy and physiology of a color system in the primate visual cortex. J Neurosci. 1984;4:309–356. doi: 10.1523/JNEUROSCI.04-01-00309.1984. [DOI] [PMC free article] [PubMed] [Google Scholar]
- Livingstone MS, Hubel DH. Psychophysical evidence for separate channels for the perception of form, color, movement, and depth. J Neurosci. 1987;7:3416–3468. doi: 10.1523/JNEUROSCI.07-11-03416.1987. [DOI] [PMC free article] [PubMed] [Google Scholar]
- Lorenceau J, Alais D. Form constraints in motion binding. Nat Neurosci. 2001;4:745–751. doi: 10.1038/89543. [DOI] [PubMed] [Google Scholar]
- Lu HD, Chen G, Tanigawa H, Roe AW. A motion direction map in macaque V2. Neuron. 2010;68:1002–1013. doi: 10.1016/j.neuron.2010.11.020. [DOI] [PMC free article] [PubMed] [Google Scholar]
- Mackay DM. Visual noise as a tool of research. J Gen Psychol. 1965;72:181–197. doi: 10.1080/00221309.1965.9710688. [DOI] [PubMed] [Google Scholar]
- Malach R, Tootell RB, Malonek D. Relationship between orientation domains, cytochrome oxidase stripes, and intrinsic horizontal connections in squirrel monkey area V2. Cereb Cortex. 1994;4:151–165. doi: 10.1093/cercor/4.2.151. [DOI] [PubMed] [Google Scholar]
- Malonek D, Tootell RB, Grinvald A. Optical imaging reveals the functional architecture of neurons processing shape and motion in owl monkey area MT. Proc Biol Sci. 1994;258:109–119. doi: 10.1098/rspb.1994.0150. [DOI] [PubMed] [Google Scholar]
- Mante V, Carandini M. Mapping of stimulus energy in primary visual cortex. J Neurophysiol. 2005;94:788–798. doi: 10.1152/jn.01094.2004. [DOI] [PubMed] [Google Scholar]
- Marr D, Ullman S. Directional selectivity and its use in early visual processing. Proc R Soc Lond B Biol Sci. 1981;211:151–180. doi: 10.1098/rspb.1981.0001. [DOI] [PubMed] [Google Scholar]
- Maunsell JH, Van Essen DC. Functional properties of neurons in middle temporal visual area of the macaque monkey. I. Selectivity for stimulus direction, speed, and orientation. J Neurophysiol. 1983a;49:1127–1147. doi: 10.1152/jn.1983.49.5.1127. [DOI] [PubMed] [Google Scholar]
- Merigan WH, Maunsell JH. How parallel are the primate visual pathways? Annu Rev Neurosci. 1993;16:369–402. doi: 10.1146/annurev.ne.16.030193.002101. [DOI] [PubMed] [Google Scholar]
- Mikami A, Newsome WT, Wurtz RH. Motion selectivity in macaque visual cortex. I. Mechanisms of direction and speed selectivity in extrastriate area MT. J Neurophysiol. 1986;55:1308–1327. doi: 10.1152/jn.1986.55.6.1308. [DOI] [PubMed] [Google Scholar]
- Movshon JA, Newsome WT. Visual response properties of striate cortical neurons projecting to area MT in macaque monkeys. J Neurosci. 1996;16:7733–7741. doi: 10.1523/JNEUROSCI.16-23-07733.1996. [DOI] [PMC free article] [PubMed] [Google Scholar]
- Nakayama K, Tyler CW. Psychophysical isolation of movement sensitivity by removal of familiar position cues. Vis Res. 1981;21:427–433. doi: 10.1016/0042-6989(81)90089-4. [DOI] [PubMed] [Google Scholar]
- Nassi JJ, Callaway EM. Parallel processing strategies of the primate visual system. Nat Rev Neurosci. 2009;10:360–372. doi: 10.1038/nrn2619. [DOI] [PMC free article] [PubMed] [Google Scholar]
- Ninomiya T, Sawamura H, Inoue K, Takada M. Differential architecture of multisynaptic geniculo-cortical pathways to V4 and MT. Cereb Cortex. 2011;21:2797–2808. doi: 10.1093/cercor/bhr078. [DOI] [PubMed] [Google Scholar]
- Onat S, Nortmann N, Rekauzke S, König P, Jancke D. Independent encoding of grating motion across stationary feature maps in primary visual cortex visualized with voltage-sensitive dye imaging. Neuroimage. 2011;55:1763–1770. doi: 10.1016/j.neuroimage.2011.01.004. [DOI] [PubMed] [Google Scholar]
- Orban GA, Kennedy H, Bullier J. Velocity sensitivity and direction selectivity of neurons in areas V1 and V2 of the monkey: influence of eccentricity. J Neurophysiol. 1986;56:462–480. doi: 10.1152/jn.1986.56.2.462. [DOI] [PubMed] [Google Scholar]
- Pack CC, Born RT. Temporal dynamics of a neural solution to the aperture problem in visual area MT of macaque brain. Nature. 2001;409:1040–1042. doi: 10.1038/35059085. [DOI] [PubMed] [Google Scholar]
- Pan Y, Chen M, Yin J, An X, Zhang X, Lu Y, Gong H, Li W, Wang W. Equivalent representation of real and illusory contours in macaque V4. J Neurosci. 2012;32:6760–6770. doi: 10.1523/JNEUROSCI.6140-11.2012. [DOI] [PMC free article] [PubMed] [Google Scholar]
- Perrone JA, Thiele A. Speed skills: measuring the visual speed analyzing properties of primate MT neurons. Nat Neurosci. 2001;4:526–532. doi: 10.1038/87480. [DOI] [PubMed] [Google Scholar]
- Peterhans E, von der Heydt R. Functional organization of area V2 in the alert macaque. Eur J Neurosci. 1993;5:509–524. doi: 10.1111/j.1460-9568.1993.tb00517.x. [DOI] [PubMed] [Google Scholar]
- Ponce CR, Lomber SG, Born RT. Integrating motion and depth via parallel pathways. Nat Neurosci. 2008;11:216–223. doi: 10.1038/nn2039. [DOI] [PMC free article] [PubMed] [Google Scholar]
- Ponce CR, Hunter JN, Pack CC, Lomber SG, Born RT. Contributions of indirect pathways to visual response properties in macaque middle temporal area MT. J Neurosci. 2011;31:3894–3903. doi: 10.1523/JNEUROSCI.5362-10.2011. [DOI] [PMC free article] [PubMed] [Google Scholar]
- Priebe NJ, Cassanello CR, Lisberger SG. The neural representation of speed in macaque area MT/V5. J Neurosci. 2003;23:5650–5661. doi: 10.1523/JNEUROSCI.23-13-05650.2003. [DOI] [PMC free article] [PubMed] [Google Scholar]
- Priebe NJ, Lisberger SG, Movshon JA. Tuning for spatiotemporal frequency and speed in directionally selective neurons of macaque striate cortex. J Neurosci. 2006;26:2941–2950. doi: 10.1523/JNEUROSCI.3936-05.2006. [DOI] [PMC free article] [PubMed] [Google Scholar]
- Rodman HR, Albright TD. Coding of visual stimulus velocity in area MT of the macaque. Vis Res. 1987;27:2035–2048. doi: 10.1016/0042-6989(87)90118-0. [DOI] [PubMed] [Google Scholar]
- Roe AW, Ts'o DY. Visual topography in primate V2: multiple representation across functional stripes. J Neurosci. 1995;15:3689–3715. doi: 10.1523/JNEUROSCI.15-05-03689.1995. [DOI] [PMC free article] [PubMed] [Google Scholar]
- Ross J, Badcock DR, Hayes A. Coherent global motion in the absence of coherent velocity signals. Curr Biol. 2000;10:679–682. doi: 10.1016/s0960-9822(00)00524-8. [DOI] [PubMed] [Google Scholar]
- Rust NC, Schwartz O, Movshon JA, Simoncelli EP. Spatiotemporal elements of macaque V1 receptive fields. Neuron. 2005;46:945–956. doi: 10.1016/j.neuron.2005.05.021. [DOI] [PubMed] [Google Scholar]
- Rust NC, Mante V, Simoncelli EP, Movshon JA. How MT cells analyze the motion of visual patterns. Nat Neurosci. 2006;9:1421–1431. doi: 10.1038/nn1786. [DOI] [PubMed] [Google Scholar]
- Sáry G, Vogels R, Orban GA. Cue-invariant shape selectivity of macaque inferior temporal neurons. Science. 1993;260:995–997. doi: 10.1126/science.8493538. [DOI] [PubMed] [Google Scholar]
- Schiessl I, Wang W, McLoughlin N. Independent components of the haemodynamic response in intrinsic optical imaging. Neuroimage. 2008;39:634–646. doi: 10.1016/j.neuroimage.2007.09.022. [DOI] [PubMed] [Google Scholar]
- Shipp S, Zeki S. Segregation of pathways leading from area V2 to areas V4 and V5 of macaque monkey visual cortex. Nature. 1985;315:322–325. doi: 10.1038/315322a0. [DOI] [PubMed] [Google Scholar]
- Shipp S, Zeki S. The functional organization of area V2, I: specialization across stripes and layers. Vis Neurosci. 2002;19:187–210. doi: 10.1017/s0952523802191164. [DOI] [PubMed] [Google Scholar]
- Shmuel A, Grinvald A. Functional organization for direction of motion and its relationship to orientation maps in cat area 18. J Neurosci. 1996;16:6945–6964. doi: 10.1523/JNEUROSCI.16-21-06945.1996. [DOI] [PMC free article] [PubMed] [Google Scholar]
- Simoncelli EP, Heeger DJ. A model of neuronal responses in visual area MT. Vision Res. 1998;38:743–761. doi: 10.1016/s0042-6989(97)00183-1. [DOI] [PubMed] [Google Scholar]
- Sincich LC, Horton JC. Independent projection streams from macaque striate cortex to the second visual area and middle temporal area. J Neurosci. 2003;23:5684–5692. doi: 10.1523/JNEUROSCI.23-13-05684.2003. [DOI] [PMC free article] [PubMed] [Google Scholar]
- Sincich LC, Horton JC. The circuitry of V1 and V2: integration of color, form, and motion. Annu Rev Neurosci. 2005;28:303–326. doi: 10.1146/annurev.neuro.28.061604.135731. [DOI] [PubMed] [Google Scholar]
- Sincich LC, Jocson CM, Horton JC. V1 interpatch projections to V2 thick stripes and pale stripes. J Neurosci. 2010;30:6963–6974. doi: 10.1523/JNEUROSCI.5506-09.2010. [DOI] [PMC free article] [PubMed] [Google Scholar]
- Smith MA, Kohn A, Movshon JA. Glass pattern responses in macaque V2 neurons. J Vis. 2007;7:5. doi: 10.1167/7.3.5. [DOI] [PMC free article] [PubMed] [Google Scholar]
- Snowden RJ, Treue S, Andersen RA. The response of neurons in areas V1 and MT of the alert rhesus monkey to moving random dot patterns. Exp Brain Res. 1992;88:389–400. doi: 10.1007/BF02259114. [DOI] [PubMed] [Google Scholar]
- Tanigawa H, Lu HD, Roe AW. Functional organization for color and orientation in macaque V4. Nat Neurosci. 2010;13:1542–1548. doi: 10.1038/nn.2676. [DOI] [PMC free article] [PubMed] [Google Scholar]
- Tolias AS, Keliris GA, Smirnakis SM, Logothetis NK. Neurons in macaque area V4 acquire directional tuning after adaptation to motion stimuli. Nat Neurosci. 2005;8:591–593. doi: 10.1038/nn1446. [DOI] [PubMed] [Google Scholar]
- Tootell RB, Hamilton SL. Functional anatomy of the second visual area (V2) in the macaque. J Neurosci. 1989;9:2620–2644. doi: 10.1523/JNEUROSCI.09-08-02620.1989. [DOI] [PMC free article] [PubMed] [Google Scholar]
- Tootell RB, Silverman MS, De Valois RL, Jacobs GH. Functional organization of the second cortical visual area in primates. Science. 1983;220:737–739. doi: 10.1126/science.6301017. [DOI] [PubMed] [Google Scholar]
- Ts'o DY, Frostig RD, Lieke EE, Grinvald A. Functional organization of primate visual cortex revealed by high resolution optical imaging. Science. 1990;249:417–420. doi: 10.1126/science.2165630. [DOI] [PubMed] [Google Scholar]
- Ts'o DY, Roe AW, Gilbert CD. A hierarchy of the functional organization for color, form and disparity in primate visual area V2. Vision Res. 2001;41:1333–1349. doi: 10.1016/s0042-6989(01)00076-1. [DOI] [PubMed] [Google Scholar]
- Ts'o DY, Zarella M, Burkitt G. Whither the hypercolumn? J Physiol-London. 2009;587:2791–2805. doi: 10.1113/jphysiol.2009.171082. [DOI] [PMC free article] [PubMed] [Google Scholar]
- Ungerleider LG, Mishkin M. Two cortical visual systems. In: Ingle DA, Goodale MA, Mansfield RJW, editors. The analysis of visual behavior. Cambridge, MA: MIT; 1982. [Google Scholar]
- Van Essen DC, Gallant JL. Neural mechanisms of form and motion processing in the primate visual system. Neuron. 1994;13:1–10. doi: 10.1016/0896-6273(94)90455-3. [DOI] [PubMed] [Google Scholar]
- Weliky M, Bosking WH, Fitzpatrick D. A systematic map of direction preference in primary visual cortex. Nature. 1996;379:725–728. doi: 10.1038/379725a0. [DOI] [PubMed] [Google Scholar]
- Xiao Y, Felleman DJ. Projections from primary visual cortex to cytochrome oxidase thin stripes and interstripes of macaque visual area 2. Proc Natl Acad Sci U S A. 2004;101:7147–7151. doi: 10.1073/pnas.0402052101. [DOI] [PMC free article] [PubMed] [Google Scholar]
- Xiao Y, Zych A, Felleman DJ. Segregation and convergence of functionally defined V2 thin stripe and interstripe compartment projections to area V4 of macaques. Cereb Cortex. 1999;9:792–804. doi: 10.1093/cercor/9.8.792. [DOI] [PubMed] [Google Scholar]
- Xiao Y, Wang Y, Felleman DJ. A spatially organized representation of colour in macaque cortical area V2. Nature. 2003;421:535–539. doi: 10.1038/nature01372. [DOI] [PubMed] [Google Scholar]
- Xu X, Collins CE, Kaskan PM, Khaytin I, Kaas JH, Casagrande VA. Optical imaging of visually evoked responses in prosimian primates reveals conserved features of the middle temporal visual area. Proc Natl Acad Sci U S A. 2004;101:2566–2571. doi: 10.1073/pnas.0308745101. [DOI] [PMC free article] [PubMed] [Google Scholar]
- Yabuta NH, Sawatari A, Callaway EM. Two functional channels from primary visual cortex to dorsal visual cortical areas. Science. 2001;292:297–300. doi: 10.1126/science.1057916. [DOI] [PubMed] [Google Scholar]
- Zhan CA, Baker CL., Jr Boundary cue invariance in cortical orientation maps. Cereb Cortex. 2006;16:896–906. doi: 10.1093/cercor/bhj033. [DOI] [PubMed] [Google Scholar]