

Abstract
In the developing nervous system, spontaneous neuronal activity arises independently of experience or any environmental input. This activity may play a major role in axonal pathfinding, refinement of topographic maps, dendritic morphogenesis, and the segregation of axonal terminal arbors. In the auditory system, endogenously released ATP in the cochlea activates inner hair cells to trigger bursts of action potentials (APs), which are transferred to the central auditory system. Here we show the modulatory role of purinergic signaling beyond the cochlea, i.e., the developmentally regulated and cell-type-specific depolarizing effects on auditory brainstem neurons of Mongolian gerbil. We assessed the effects of P2X receptors (P2XRs) on neuronal excitability from prehearing to early stages of auditory signal processing. Our results demonstrate that in neurons expressing P2XRs, extracellular ATP can evoke APs in sync with Ca2+ signals. In cochlear nucleus (CN) bushy cells, ATP increases spontaneous and also acoustically evoked activity in vivo, but these effects diminish with maturity. Moreover, ATP not only augmented glutamate-driven firing, but it also evoked APs in the absence of glutamatergic transmission. In vivo recordings also revealed that endogenously released ATP in the CN contributes to neuronal firing activity by facilitating AP generation and prolonging AP duration. Given the enhancing effect of ATP on AP firing and confinement of P2XRs to certain auditory brainstem nuclei, and to distinct neurons within these nuclei, it is conceivable that purinergic signaling plays a specific role in the development of neuronal brainstem circuits.
Introduction
Early in development of the auditory and visual systems, endogenously generated spontaneous action potentials (APs) provide an important instructive signal for the refinement of sensory maps before the actual function commences (Shatz, 1996; Eglen and Gjorgjieva, 2009). In the auditory system, patterned firing activity was observed before hearing onset in several nuclei along the ascending auditory pathway (Walsh and McGee, 1988; Rübsamen and Schäfer, 1990; Lippe, 1994; Jones et al., 2007; Sonntag et al., 2009). Such activity is likely to support survival of target neurons, tonotopic refinement of afferent connections, and adjustment of synaptic strength (Friauf and Lohmann, 1999; Rubel and Fritzsch, 2002; Leake et al., 2006; McKay and Oleskevich, 2007; Kandler et al., 2009). Before the onset of hearing, ATP-mediated activation of the cochlear inner hair cells evokes APs in the spiral ganglion neurons (SGNs) (Tritsch and Bergles, 2010), which provide synaptic inputs to second-order neurons in the cochlear nucleus (CN) (Feldman and Harrison, 1969; Fekete et al., 1984; Liberman and Oliver, 1984). However, purinergic signaling in the developing auditory system is not restricted to the organ of Corti. Recently, it was shown that activation of P2 purinoreceptors evokes APs in spherical bushy cells (SBCs) of the CN (Milenkovic et al., 2009). The modulatory effect of ATP on AP firing was observed before and shortly after the onset of hearing. It is mediated by P2X receptors (P2XR) and engages increase in cytosolic Ca2+, the activation of protein kinase C (PKC), and possibly the inhibition of IKL conductance. These data raised the question whether purinergic signaling might attune the activity of central auditory neurons and thereby contribute to developmental processes. In Mongolian gerbils, P2Rs show a differential distribution in the anteroventral cochlear nucleus (AVCN), i.e., they are present on SBCs, but not on stellate cells (Milenkovic et al., 2009). Purinergic signaling was also shown in neurons of the lateral superior olive (LSO) (Kreinest et al., 2009) and the medial nucleus of the trapezoid body (MNTB) (Watano et al., 2004). It still remains inconclusive what neuron types within the auditory brainstem underlie purinergic modulation and whether such modulation may be engaged in the adjustment of the activity level during early postnatal development. The present study reports in vivo and in vitro data on the developmental profile of P2R-mediated responses in neurons of the CN, LSO, MNTB, and the medial superior olive (MSO). We provide evidence for cell-specific and developmentally regulated purinergic enhancement of glutamate-driven neuronal activity, mediated by mechanisms involving ATP-induced membrane depolarization and increase in [Ca2+]i.
Materials and Methods
All experimental procedures were approved by the Saxonian district Government (T 52/09, T 115/10 and TVV 06/09), Leipzig, and were done according to the European Communities Council Directive of November 24, 1986 (86/609/EEC).
Slice preparation and maintenance
Acute slices were generated either in parasagittal or coronal plane (200 μm) from the brainstem of Mongolian gerbils (Meriones unguiculatus) of either sex aged P3–P21. Dissections were performed in a cold (3−4°C), low-calcium artificial CSF (ACSF) solution containing the following (in mm): 125 NaCl, 2.5 KCl, 0.1 CaCl2, 3 MgCl2, 1.25 NaH2PO4, 25 NaHCO3, 25 glucose, 2 sodium pyruvate, 3 myo-inositol, and 0.5 ascorbic acid, continuously equilibrated with 5% CO2 and 95% O2, pH 7.4. The brainstem was cut on a vibratome (Microm HM 650) and the slices comprising the CN, LSO, MSO, or MNTB were transferred into a beaker containing standard recording solution (ACSF same as for slicing, except for CaCl2 and MgCl2, which were changed to 2 and 1 mm, respectively), incubated for 30 min at 37°C and stored at room temperature (RT) until recording. Experiments were made at RT (21−23°C) except for the EPSCs and IPSCs recordings, which were done at 33 ± 0.5°C.
Whole-cell recordings and post hoc visualization of recorded cells
Whole-cell recordings and [Ca2+]i measurements were made in a recording chamber (1 ml volume superfused with ACSF at 1.5–2 ml/min) positioned on a stage of an upright microscope (Axioskop 2, 40× water-immersion objective; Zeiss). Patch pipettes were pulled from borosilicate glass capillaries (Science Products) to have resistances of 3–5 MΩ when filled with internal solution containing the following (in mm): 130 potassium-gluconate, 10 KCl, 1 NaCl, 0.05 CaCl2, 10 HEPES, 0.1 EGTA, and 0.2% biocytin (pH 7.3 with KOH). For recordings of evoked EPSCs and IPSCs, the pipettes had resistances of 2.2–3.3 MΩ when filled with the following (in mm): 140 CsMeSO3, 20 TEA-Cl, 3.3 MgCl2, 10 HEPES, 0.1 EGTA, 5 QX-314, and 0.2% biocytin (pH 7.3 with CsOH). Both pipette solutions were supplemented with 5 mm phosphocreatine, 2 mm ATP disodium salt, and 0.3 mm GTP disodium salt. All voltages were corrected off-line for empirically determined junction potentials of 14 and 11 mV, respectively. The recordings were acquired using a Multiclamp 700B amplifier (Molecular Devices) in current-clamp or voltage-clamp mode. Access resistance (Rs) ranged from 4 to 10 MΩ and it was compensated by >60% in voltage-clamp recordings. Current-clamp recordings were done from the membrane potential of −60 mV, approximately corresponding to the resting membrane potential of investigated neurons (MNTB: Banks and Smith, 1992; LSO: Kandler and Friauf, 1995; MSO: Smith, 1995; Smith et al., 2000; Balakrishnan et al., 2003; Leao et al., 2004; Magnusson et al., 2005; CN: McGinley and Oertel, 2006; Price and Trussell, 2006; Milenkovic et al., 2007) and bridge balance and pipette capacitance neutralization were set and adjusted accordingly. Recorded signals were sampled at 10 kHz and lowpass filtered at 2 kHz except for evoked postsynaptic currents (PSCs), where data were digitized at 20 kHz and filtered at 6 kHz. Data analysis was done with pClamp 10 software (Molecular Devices). Application of the metabolically stable P2R agonist, ATPγS (Chung et al., 1991), and glutamate, which served as a control for the cell's vitality, was done through a wider tip patch pipette mounted on a Picospritzer (General Valve). To assure constant stimulation conditions, pipette diameter, application pressure and duration, and distance from the cell were always kept constant (3 μm, 2 psi, 150 ms, 20 μm, respectively). The size of the puff was adjusted in initial experiments by measuring dispersion of the fluorescent dye ATTO 488. The perfusion was turned off just before each puff application to avoid unequal dilution of the agonist. Application of ACSF evoked no response, whereas ATPγS evoked membrane depolarization and inward currents in the same neurons. The responses were considered significant when in the z test the calculated z-scores were >3 or z < −3 [z = (A − BL)/SDBL, with A being the maximal amplitude of the response, BL the mean of the baseline for 2 s before stimulation, SDBL the SD of the baseline]. For instance, average z-scores for the voltage-clamp responses under the above two conditions were as follows: ACSF = 0.4 ± 0.4, ATPγS = −51.4 ± 14.8, n = 5.
Antagonists and blockers were diluted in ACSF and applied to the slice by superfusion. The blockers of glutamate, GABA, and glycine receptors (10 μm NBQX, 50 μm AP-V, 20 μm SR95531, 3 μm CGP55845, and 0.5 μm strychnine) were added to exclude possible effects of presynaptic P2Rs (Watano et al., 2004; Kreinest et al., 2009).
Recordings of EPSCs and IPSCs in SBCs were done by electrical stimulation of afferent fibers through a bipolar theta glass electrode (tip diameter 5 μm; Sutter Instruments) filled with bath solution. To investigate whether ATP might be released from the auditory nerve, or from the inhibitory synaptic inputs, single shock (100 μs) was applied every 15 s, delivered via an isolated stimulus unit (AMPI Iso-flex). Evoked PSCs were recorded at −60 mV under pharmacological inhibition of GABAA and glycine receptors (20 μm SR95531, 0.5 μm strychnine), for EPSCs, or under Glu-R antagonists (10 μm NBQX, 50 μm AP-5), for IPSCs. In both experiments, 3 μm CGP55845 was added to block the GABAB receptors. Stimulation was set to minimal intensity that reliably evokes currents of stable amplitudes (20–80 V); under these conditions no fiber recruitment was observed. Mean peak amplitudes and time constant (τ) were measured by averaging >5 repetitions.
Morphological characterization of the recorded neurons was assessed (as previously shown for CN neurons; Milenkovic et al., 2009) by a post hoc labeling of biocytin-filled neurons with Cy2-conjugated streptavidin, according to the protocol described by (Bischofberger et al., 2006). After recording and fixation in 4% paraformaldehyde (PFA; in 0.1 m PBS, pH 7.3), the slices were washed (6 × 5 min with TBS and 6 × 5 min with TBS/0.3% Triton X-100) and incubated with Cy2-conjugated streptavidin (5 μg/ml; Jackson ImmunoResearch) 2.5 h at RT. Labeled cells were examined by confocal laser scanning microscopy (TCS PS5; Leica).
Fluorometric Ca2+ measurements
For fluorometric Ca2+ measurements two approaches were used. (1) The slices were bulk labeled by incubation in ACSF supplemented with Fura 2 acetoxymethyl ester (10 μm Fura-2 AM; Invitrogen) and 0.025% (w/v) pluronic acid, for 30 min at 37°C, as described previously (Milenkovic et al., 2009). (2) Alternatively, the measurement of intracellular calcium was performed simultaneously with whole-cell recordings. In the latter case, the potassium gluconate-based intracellular solution was supplemented with Fura 2 (50–100 μm). Since the different labeling protocols had no influence on the calcium signal properties, the data were pooled together. The data obtained by the two approaches are shown in Figure 1F.
Figure 1.
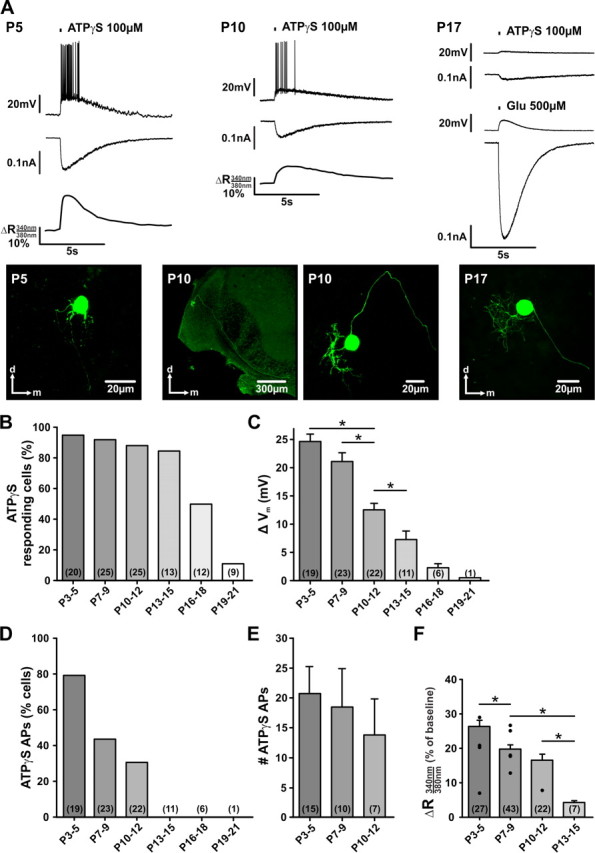
Developmental profile of P2X-mediated responses in SBCs. A, Exemplary whole-cell recordings from SBCs at different developmental stages (P5, P10 prehearing, and P17 after hearing onset). ATPγS was applied through the puff-pipette (150 ms, 2 psi, 20 μm to cell soma). Ca2+ measurements were done simultaneously with current-clamp recordings (Vh = −60 mV). All traces originate from the respective biocytin-labeled neurons shown below. The P10 neuron is shown in two magnifications to visualize the course of the axon passing along the ventral acoustic stria (left) and the morphology of the dendritic tree (right). The morphology of recorded cells characterizes them as SBCs. Note that the ATPγS-induced responses are downregulated during development. In P17 SBC, additional application of glutamate was done to confirm cells' vitality. B, Percentages of neurons responding to ATPγS. C, Mean membrane potential changes elicited by ATPγS. D, Percentages of neurons generating APs in response to ATPγS. E, Number of APs in the SBCs shown in D. ANOVA yielded no difference between the groups. F, Changes in fluorescence ratios indicating calcium responses to ATPγS. Black circles show values obtained in simultaneous whole-cell-Ca2+ imaging experiments from morphologically characterized SBCs. The remaining data are from SBCs in bulk-labeled slices. Data shown in bars are pooled from both approaches. Data in B and D are percentage; C, E, and F depict mean ± SEM. C, F, *p < 0.05, ANOVA. Cell numbers are indicated in parentheses.
Pairs of images were obtained by alternating 340 and 380 nm light excitation generated by a monochromator (Polychrome V; TILL Photonics); the fluorescence emission was long-pass filtered (D510, Fura-2 filter set; Chroma Technology). Pairs of images with full spatial resolution were acquired at 4 Hz with a cooled interline transfer CCD camera (IMAGO Typ VGA; TILL Photonics) and the ratios (r = F340/F380) were calculated from the regions of interest (ROI) marking the soma of the recorded neuron. From ratio values, fluorescence changes relative to baseline fluorescence were calculated (ΔR given as percentage). Background fluorescence was subtracted using appropriate software (TILLvision; TILL Photonics). Data obtained in single cells depict average calcium responses from three to five applications. In the range of physiological Ca2+ concentrations, the ratio values are linearly related to the changes in [Ca2+]i (Grynkiewicz et al., 1985). The significance of the Ca2+ transients was calculated by a z test (z > 3) analogous to the procedure described for whole-cell recordings, except for the baseline, which was determined as average fluorescence of 10 consecutive images before stimulation. Cells with high initial ratio values and the cells that did not return to baseline after stimulation were excluded from analysis.
In vivo recordings
All recording experiments were performed in a sound-attenuated chamber (Type 400; Industrial Acoustic) with the custom-made stereotaxic animal holder positioned on a vibration-isolated table.
Animal preparation.
In vivo data were obtained from 11 adult gerbils (>P60) and 31 gerbils P13–P23 of either sex. Additional 24 prehearing gerbils (P8–P10) were tried for recordings with multibarrel electrodes and iontophoretic application of drugs. While the conventional glass electrode recordings could be performed in these animals, with multibarrel electrodes it was not possible to assess stable recordings over longer periods of time (at least 200 s are necessary). This is presumably due to the soft consistency of immature tissue and poor myelination.
Before surgical preparation, animals were anesthetized with an initial intraperitoneal injection of a mixture of ketamine hydrochloride (adults: 0.18 mg/g; others: 0.1 mg/g body weight) (Ketavet; Pfizer) and xylazine hydrochloride (adults: 0.007 mg/g; others: 0.005 mg/g body weight) (Rompun; Bayer). During recording sessions, anesthesia was maintained by additional subcutaneous application of one-third of the initial dose (approximately every 60 min in adults, 90 min in P13–P23). The skull of the experimental animal was exposed along the dorsal midsagittal line, and a small metal bolt for fixing the animal in the stereotaxic device was glued to the skull at the bregma point. Two holes were drilled through the occipital bone, 1800–2300 μm caudal to the lambda suture. One hole (diameter 0.5 mm) was used to position the reference electrode in the superficial cerebellum, while the recording electrode penetrated through the other opening (diameter 1 mm). The drill hole for the reference electrode was located on the midline, while the second hole was drilled 1 mm lateral to the midline for the AVCN recordings, and vice versa for the MNTB recordings. Both nuclei were approached dorsally with the animal tilted at 14–18 and 2–6° to the midsagittal plane, for the AVCN and MNTB, respectively. During experiments, the body temperature was kept between 37.5 and 38.5°C by positioning the animal on a temperature-controlled heating pad.
Acoustic stimulation.
Acoustic stimuli were generated by custom-written MATLAB software (The MathWorks) at a sampling rate of 97.7 kHz. The stimuli were transferred to a real-time processor (RP2.1; Tucker-Davis Technologies), D/A converted, and sent to custom-made earphones (acoustic transducer: DT 770 pro; Beyer Dynamics). The earphones were fitted with plastic tubes (length 35 mm, diameter 5 mm) and positioned into the outer ear canal at a distance of ∼4 mm to the eardrum. Three stimulation protocols were used. (1) The excitatory response areas of extracellularly recorded single units (see below) were measured by random presentation of pure tone pulses (100 ms duration, 5 ms rise-fall time, 100 ms interstimulus interval) within a predefined matrix of frequency/intensity pairs (20 frequencies on a logarithmic scale, 10 intensity levels on a linear scale, 4– 5 repetitions). From these data, characteristic frequency (CF; stimulus frequency to which the unit is most sensitive) and threshold were obtained and used for the next protocol. (2) Temporal response properties of single units (see below) were measured during a repetitive two-tone presentation. Stimulation protocol consisted of 100 ms long excitatory tones at cells' CF presented 20 dB above threshold, in which a second, inhibitory tone was embedded. The latter had duration of 50 ms and started with a 25 ms delay after the onset of the excitatory tone; the frequency was set to the unit's individual inhibitory sideband, 20–30 dB above threshold. This two-tone combination was repeated 100 times with 500 ms interstimuli intervals. Peristimulus time histograms (PSTHs) were generated from these datasets and served for evaluation of the neurons temporal response patterns, spike latencies, jitter of evoked responses, and firing rates. First spike latency (FSL) was determined as the median value of the time between the onset of the stimulus and the first evoked spike, calculated for each repetition, and jitter of the responses as the SD of the FSL. In units lacking inhibitory sidebands, single tone stimulations were applied. (3) Neuronal spontaneous discharge activity was acquired in absence of acoustic stimulation and used to obtain average firing rate and mean waveform of the recorded signals. In a few cases, when quality of recording abruptly decreased during data acquisition, spontaneous activity was obtained from silent interstimuli intervals (the last 350 ms of each interval) defined above. Protocols (2) and (3) were performed before, during, and after the pharmacological application.
Data analysis.
The stereotaxic coordinates of the AVCN and the MNTB were determined by the on-line analysis of acoustically evoked multiunit activity. For this purpose, glass micropipettes (GB150F-10; Science Products) with impedances of 1–5 MΩ filled with 3 m KCl were used. In the AVCN, the most rostral part (frequencies <4000 Hz) was targeted considering the tonotopic organization of the nucleus (high frequencies are located caudally and dorsally, low frequencies rostrally and ventrally) as described previously (Kopp-Scheinpflug et al., 2002; Dehmel et al., 2010). The MNTB was distinguished from other nuclei in the superior olivary complex (SOC) by the monaural, contralateral excitation of its units (Kopp-Scheinpflug et al., 2008). In seven animals recording sites were additionally histologically verified by iontophoretic injection of Fluorogold (4 μA for 7 min). After 4–6 h, animals were perfused via the left heart ventricle with 0.9% NaCl solution followed by 5% PFA. The brain was cut on a vibratome and the tissue sections (100 μm thick) were visualized under the confocal laser scanning microscope.
Following multiunit mapping, juxtacellular single unit recordings including pharmacological manipulations were performed using three- and four-barreled piggyback electrodes (Havey and Caspary, 1980; Dehmel et al., 2010) with the following features: tip diameter 5–8 μm, recording barrel protruding 15–25 μm, impedance 8–15 MΩ (GB200F-10, 3GB120F-10, and 4GB120F-10; Science Products). The acquired voltage signals were pre-amplified (Neuroprobe 1600; A-M Systems), bandpass filtered (0.3–7 kHz), and further amplified (PC1; Tucker-Davis Technologies). Voltage traces were then digitized at a sampling rate of 97.7 kHz (RP2.1; Tucker-Davis Technologies) and stored for off-line analysis using custom-written MATLAB software. Three criteria were used to classify single unit recordings: (1) changes in the spike height did not exceed 20% (in average 12.4 ± 0.7%, n = 30), (2) uniform waveforms, and (3) signal-to-noise ratio at least 8:1. The typical feature of MNTB principal neurons was the characteristic complex waveform consisting of the calyceal potential (“prepotential”) and postsynaptic AP (Guinan and Li, 1990; Wu and Kelly, 1992; Englitz et al., 2009; Tolnai et al., 2009). Also the SBCs of the AVCN were identified by the complex waveform of the recorded discharges (Pfeiffer, 1966; Winter et al., 1990; Englitz et al., 2009; Typlt et al., 2010) and/or by the primary-like PSTH (Blackburn and Sachs, 1989). The accurate analysis of the complex waveforms was done using a fitting method, which decomposes the extracellularly recorded signal into its presynaptic and postsynaptic components (Sonntag et al., 2011). However, due to the smaller size of the prepotential signal in the AVCN than in MNTB, and the higher noise susceptibility in recordings with multibarrel electrodes, the fitting method could be applied only to a limited number of recordings. Drugs (ATP: 200 mm, pH 8; ATPγS: 200 mm, pH 8; TNP-ATP: 1 mm, pH 8; kynurenic acid [KynA]: 200 mm, pH 8; glycine: 400 mm, pH 4) were applied iontophoretically (EPMS 07; npi electronics) with increasing current steps (ATP, ATPγS, TNP-ATP: −50 to −150 nA; KynA: −5 to −50 nA; glycine +5 to +50 nA) separated by at least 60 s. Holding current for each barrel was ±20 nA. A balancing channel was used to alleviate current effects (barrel filled with 1 m sodium acetate). In control experiments the carrier alone (aqua dest., pH 8) was applied (−50 to −150 nA). Specific responses to drugs were defined as a sustained increase in neuronal activity >20% when applying ATP or ATPγS, and sustained decrease in activity >20% for TNP-ATP, KynA, and glycine application.
Statistics
Datasets were tested for Gaussian distribution before comparison by the Student's t-test or ANOVA followed by pairwise multiple comparisons (Holm–Sidak post hoc test) (Sigma Plot 11; Systat Software). In case of a non-Gaussian distribution, nonparametric tests were applied, such as Mann–Whitney rank sum test or ANOVA on ranks. Repeated measures (RM) ANOVA was applied to the test for effects of drugs, i.e., before-drug, drug, and after-drug conditions for the group of cells. In some diagrams, dots representing single cells are added to the bars to illustrate data distribution. Average data are reported as mean ± SEM values, unless otherwise noted.
Results
Developmental regulation of P2XR responses in the CN
The developmental profile of P2XR-mediated responses in auditory brainstem neurons was investigated by assessing the effects of ATPγS in vitro and in vivo. For in vitro experiments, ATPγS was pressure ejected onto the soma of recorded cell, and each cell was morphologically characterized by a post hoc labeling of biocytin, administered through the patch pipette. Consistent with our previous study (Milenkovic et al., 2009), the activation of P2XRs on SBCs in prehearing gerbils induced trains of APs that temporally matched the transient inward current and the intracellular Ca2+ signal (Fig. 1A).
The magnitude of the effect was dependent on animals' age, indicated by the decrease in the number of cells showing significant responses. Whereas in P3–P5 animals, 19 of 20 (95%) SBCs were significantly depolarized by ATPγS, only 6 of 12 (50%) responded in P16–P18 animals and 1 of 9 at P19 (11%) (Fig. 1B). Developmental changes are also evidenced by a decrease of the ATPγS-evoked depolarization from P3–P21 (Fig. 1C). Since ATPγS readily induces APs (especially in the animals from P3–P5 and P7–P9; Fig. 1D), the average maximum membrane depolarization in such cells was estimated from three to five applications excluding the APs. The number of cells generating APs upon ATPγS application showed a developmental reduction; while in P3–P5 animals 79% responded with APs, only 32% did so in P10–P12, and no APs were elicited in animals older than P12 (Fig. 1D). In those neurons that showed ATPγS-induced APs, a trend toward fewer APs was observed with increasing maturity, but differences did not reach statistical significance (Figure 1E) (P3–P5 = 20.8 ± 4.6, n = 15; P7–P9 = 18.5 ± 6.7, n = 10; P10–P12 = 13.8 ± 6.0, n = 7; p = 0.54, ANOVA, Holm–Sidak post hoc test). In the same SBCs, the average voltage change decreased with age (P3–P5 = 24.6 ± 1.3 mV, n = 15; P7–P9 = 22.7 ± 1.7 mV, n = 10; P10–P12 = 17.0 ± 1.8 mV, n = 7; p = 0.011 for P3–P5 vs P10-P12, ANOVA, Holm–Sidak post hoc test). The lack of APs in animals >P12 is likely due to the small depolarization (<7 mV) insufficient to reach the AP threshold. Earlier we had shown that ATPγS elicits multiple APs in SBCs through mechanisms engaging an increase in [Ca2+]i and activation of Ca2+-dependent PKC (Milenkovic et al., 2009). Therefore, we next examined whether the magnitude of a Ca2+ signal might correlate with the presence of APs evoked by ATPγS in prehearing animals. Indeed, not only the amplitude (Figure 1F) (mean baseline ratio ± SD: P3–P5 = 0.46 ± 0.11, n = 27; P7–P9 = 0.53 ± 0.22, n = 43; P10–P12 = 0.39 ± 0.10, n = 22; P13–P15 = 0.32 ± 0.02, n = 7; mean peak ratio change relative to baseline ΔR ± SEM: P3–P5 = 26.4 ± 1.7%; P7–P9 = 19.9 ± 1.2%; P10–P12 = 16.7 ± 1.7%, P13–P15 = 4.3 ± 0.5%; no responses in P16–P18 and P19–P21 SBCs), but also the number of cells showing a Ca2+ response was significantly decreased from P10–P12 to P13–P15 (cells showing significant [Ca2+]i increase: P3–P5 = 93%, n = 29; P7–P9 = 71%, n = 60; P10–P12 = 42%, n = 53; P13–P15 = 14%, n = 51). Since the magnitude of the somatic Ca2+ signal did not differ with respect to the method used for labeling cells with Fura 2, the data collected with both approaches were pooled (average amplitude for bulk-labeled cells: P3–P5 = 27.7 ± 1.8%, n = 23, for simultaneous whole-cell and Ca2+ recordings: P3–P5 = 19.3 ± 4.6%, n = 4, p = 0.18, Mann–Whitney rank sum test; bulk labeling: P7–P9 = 19.9 ± 1.4%, n = 38, whole-cell and Ca2+ recordings: P7–P9 = 20.0 ± 2.6%, n = 5, p = 0.99, Mann–Whitney rank sum test). These data provide further support for the hypothesis that an increase in [Ca2+]i correlates with P2R-mediated firing activity (Milenkovic et al., 2009). After P12, when the Ca2+ signals are strongly downregulated, APs could no longer be evoked in vitro.
The follow-up experiments addressed the potential causes for the developmental reduction of purinergic responses in SBCs. A gradual reduction in maximal ATPγS-evoked current amplitude was seen from P3 to P15 followed by a strong decrease in P16–P18 SBCs (Fig. 2A). Previously we had ruled out any possible contribution of P2Rs affecting the release of glutamate from presynaptic terminals (Milenkovic et al., 2009). This notion is further confirmed by the strong inhibitory effect of TNP-ATP (100% current inhibition) (see below; see Fig. 8F), a potent antagonist at receptors containing P2X1–3 subunits (Virginio et al., 1998; North and Surprenant, 2000; Jarvis and Khakh, 2009) (mean ATPγS-induced current at P7–P9 = 147.2 ± 26.9 pA, n = 17; ATPγS + TNP-ATP = 0.2 ± 0.7 pA, n = 8, p < 0.01, t test).
Figure 2.
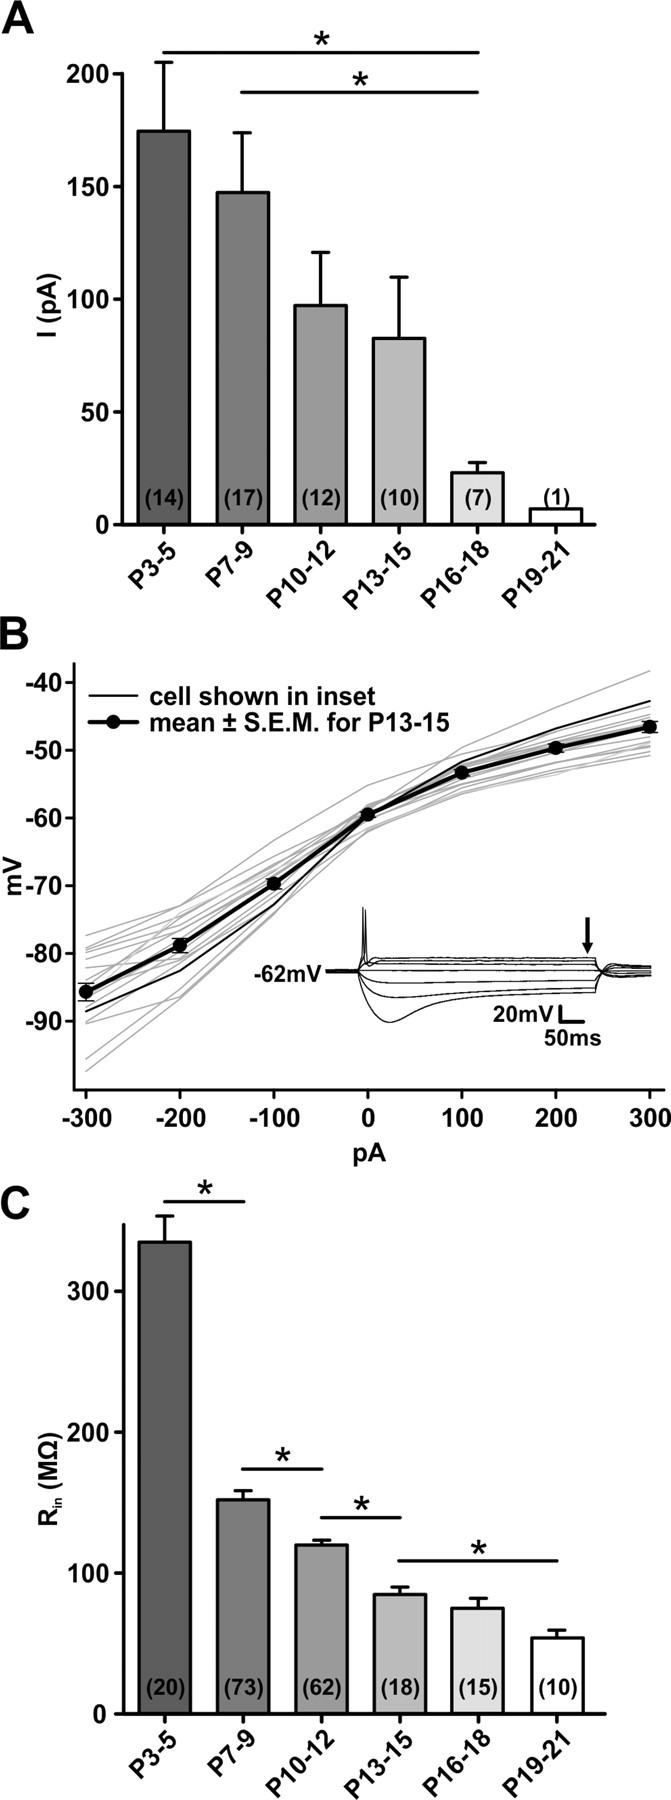
P2XR current decreases with maturity. A, Mean peak currents evoked by ATPγS in SBCs of different postnatal ages. Current amplitudes gradually decrease to P15, after which a marked reduction is observed. B, Plots of voltage as a function of injected current for 18 SBCs from P13–P15. Inset shows responses of the SBC depicted by the thin black line in the graph. The steady-state voltage was determined at the point shown by the arrow and plotted in the graph. The slope of these plots at the resting membrane potential is the input resistance, on average 84.8 ± 3.7 MΩ (n = 18). C, Developmental change of input resistance of SBCs. The most notable change occurs between P3–P5 and P7–P9. Error bars indicate mean ± SEM. Cell numbers are given in parentheses. *p < 0.05.
Figure 8.

Comparison of the P2X-mediated responses in different auditory brainstem neurons. A, The percentages of neurons (P7–P9) responding to ATPγS differ between nuclei (current-clamp data). ATPγS elicits significantly larger P2X current (B) and depolarization (C) in SBCs than in the other neurons expressing P2XRs. Bars indicate mean peak current or depolarization. Error bars indicate SEM. Note the similar magnitudes of responses in GBC and the principal MNTB neurons. Cell numbers are given in parentheses. ***p < 0.001, ANOVA followed by Holm–Sidak test. D, Percentages of cells in which ATPγS evoked APs. Inset shows exemplary APs elicited by 100 μm ATPγS in an SBC. Numbers in parentheses indicate the total number of recorded cells. E, The mean number of APs elicited by a single ATPγS application is significantly higher in SBCs than in MNTB principal neurons (**p = 0.009, Mann–Whitney rank sum test). In GBC and LSO neurons, APs were recorded in only 2/11 and 1/6 neurons, respectively. F, ATPγS-evoked responses are completely blocked by a P2X1–3 receptor antagonist TNP-ATP in SBCs, GBCs, and in the principal MNTB neurons. Example traces of current-clamp (top) and voltage-clamp recordings (bottom) upon application of ATPγS (150 ms) (black) and under TNP-ATP (gray).
The abatement of the P2XR-mediated currents correlates with the developmental change of input resistance (Rin) of SBCs. Figure 2C shows the Rin, calculated as the slope of the V-I relationship at resting membrane potential as depicted in Figure 2B and described previously (Cao et al., 2007; Chirila et al., 2007). Rin continuously declined from young (P3–P5 = 334.5 ± 19.0 MΩ; n = 20) to older ages (P16–P18 = 76.0 ± 5.8 MΩ; n = 15). In P16–P18 SBCs, Rin approached the values measured at P19 (P19–P21 = 53.9 ± 5.1 MΩ; n = 10; Fig. 2C), which were in the same range as values recorded in bushy cells of the adult rat (Francis and Manis, 2000). Thus, the passive electrical properties, typical for more mature animals, are attained shortly after hearing onset. Membrane time constant values (τmembrane measured at RT) decreased from 7.5 ± 0.5 ms at P3–P5 (n = 20) to 3.8 ± 0.1 ms at P10–P12 (n = 62), 2.5 ± 0.1 ms at P13–P15 (n = 18), and 1.2 ± 0.2 ms at P19–P21 (n = 10). These data are in agreement with the developmental profile of neurons in the gerbil MSO, where no further reduction of Rin and τmembrane was seen after P17 (Magnusson et al., 2005; Chirila et al., 2007).Together, our data demonstrate the developmental downregulation of purinergic responses in SBCs, caused by the reduction of membrane currents through P2XRs, abatement of calcium transients, and decrease of input resistance.
ATP increases neuronal activity in vivo
To evaluate the functional significance of the above results, the effects of the P2R activation were investigated in vivo. We conducted extracellular recordings at the rostral pole of the AVCN and targeted the large SBCs as the dominating neuron type in the low-frequency area (Tolbert et al., 1982; Rouiller and Ryugo, 1984; Hackney et al., 1990; Ostapoff et al., 1994; Bazwinsky et al., 2008). The recordings were performed shortly after the gerbil's hearing onset and paired with iontophoretic applications of ATP and glycine using multibarreled piggyback electrodes. A total of 52 units was recorded in 26 P13–P65 gerbils. Thirty-nine units showed both the characteristic complex waveform (Fig. 3A, top) and primary-like PSTHs (Fig. 5A), while the remaining 13 units showed either one of these SBCs characteristics (Pfeiffer, 1966; Rouiller and Ryugo, 1984; Blackburn and Sachs, 1989; Englitz et al., 2009; Typlt et al., 2010). Sound-evoked activity in these units yielded CFs in the range of 900–4600 Hz (mean 2458 ± 128 Hz, n = 52). Control applications of glycine were performed in all units, and led to a complete, but reversible, inhibition of spontaneous AP firing (Fig. 3A, bottom). The application of ATP induced rapid and persistent increase in spontaneous activity by 139 ± 68% in P13–P16, and by 80 ± 33% in P20–P23 SBCs. The activity reverted back to the basal level after the cessation of application (Fig. 3B,C). The initially higher rates in P20–P23 SBCs could possibly contribute to the smaller ATP-induced percentage change with respect to the P13–P16 group. Application of dH2O (pH 8) as a vehicle did not alter the spontaneous firing rate (n = 7, p = 0.61, RM ANOVA) (Fig. 3D), confirming the specific effects of ATP. Similar to the in vitro results, the percentage of cells responding to ATP decreased with maturity, i.e., ATP increased firing activity in 38% (9/24) of recorded neurons at P13–P16, and in 32% (6/19) neurons at P20–P23. In adults neither ATP nor ATPγS had an effect on the discharge characteristics of SBCs (>P60, n = 9). Finally, stellate cells did not respond to ATP (n = 5 for P13–P16, n = 3 for P20–P23, n = 5 for >P60), while their activity was efficiently inhibited by glycine. Stellate cells were characterized according to the chopper pattern of the PSTH (Roos and May, 2012).
Figure 3.
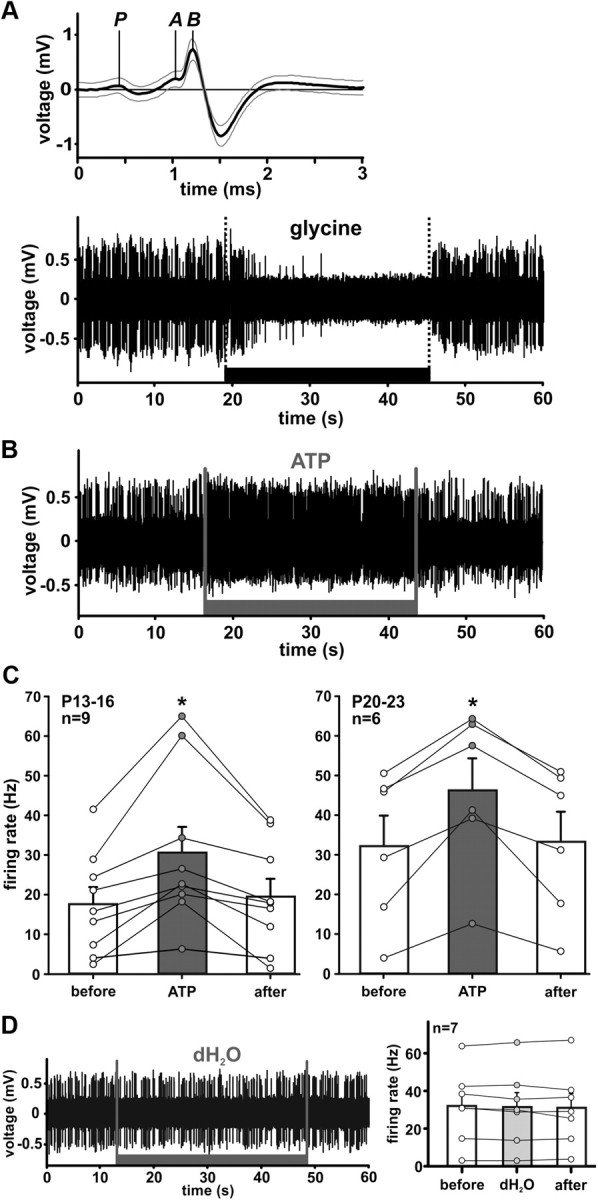
ATP increases spontaneous activity of SBCs in vivo. A, Top, Complex waveform used as a criterion to identify SBCs in the rostral AVCN (Englitz et al., 2009; Typlt et al., 2010). Thick line shows mean waveform for 1767 spikes, thin gray lines ± SD. The representative extracellularly recorded signal is decomposed into its presynaptic (P) and postsynaptic components (A-EPSP, and B-AP). A, Bottom, Exemplary trace of SBC discharges during iontophoretic application of glycine (400 mm, black bar), which causes a complete but reversible inhibition of spontaneous spiking activity. B, Iontophoretic application of ATP (200 mm, gray bar) reversibly increases firing in an SBC. C, Changes in spontaneous spiking elicited by ATP (200 mm) in P13–P16 and P20–P23 gerbils. D, Application of dH2O (vehicle) has no effect on AP firing. Circles are data from individual cells; error bars indicate mean ± SEM. *p < 0.05.
Figure 5.
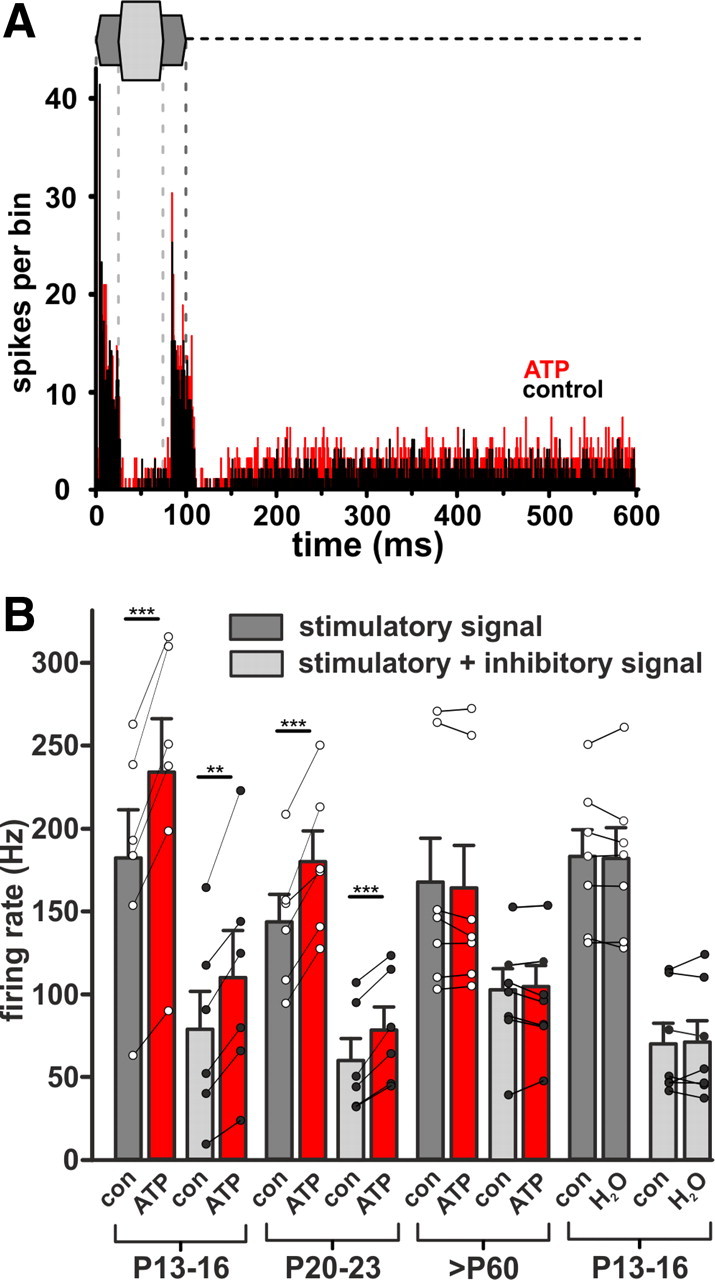
ATP increases acoustically evoked activity of SBCs in vivo. A, Exemplary PSTHs (bin width 0.5 ms) of a single unit in response to two-tone stimulation. Sketch above the histogram: dark gray, excitatory stimulus (100 ms, frequency at the unit's CF = 2.3 kHz, 30 dB SPL); light gray, embedded inhibitory stimulus (50 ms, lagging 25 ms after onset of excitatory stimulus, frequency 6.2 kHz, 65 dB SPL); dashed line, spontaneous activity, 100–600 ms. Unit shows a phasic–tonic response pattern; during the tonic phase, response is reduced through inhibition. Black and red histograms: discharge activity during 100 stimulus repetitions before and during ATP application (200 mm), respectively. Note that during application of ATP the firing rate is increased throughout all three stimulus epochs, i.e., excitation, inhibition, and spontaneous. B, Summary of changes elicited by ATP (red bars) during excitatory signals at the unit's CFs (dark gray) and acoustically driven inhibition (light gray). The ATP effects were significant for P13–P16 and P20–P23, but not for >P60. Administration of dH2O did not influence firing under acoustic stimulation. Circles represent individual cells. Error bars indicate mean ± SEM. **p < 0.01, ***p < 0.001.
We next examined whether the extracellular ATP is capable of evoking APs in vivo in the absence of glutamatergic transmission (Fig. 4). A competitive glutamate receptor antagonist, KynA, was iontophoretically applied until the neuronal activity was completely blocked (AP frequency under the last 3 s of KynA = 0.7 ± 0.4% of control; n = 4). Then, the ATP was simultaneously administered with KynA causing a partial resumption of AP discharges (average rate for the whole duration of application: 13.1 ± 4.6% of control). The average AP waveform, recorded during ATP application, is lacking the presynaptic (Fig. 4C, P) component, suggesting a direct postsynaptic effect. After termination of the ATP application, but with continuous KynA blockade, the neuronal activity diminished again. These data clearly demonstrate that ATP can increase the neuronal activity independent of glutamate, likely due to activation of P2XRs on SBCs.
Figure 4.

In vivo ATP-evoked APs in the absence of glutamatergic transmission. A, Exemplary recording of spontaneous activity of an SBC, before, during, and after application of KynA (200 mm, black bar). Upon the complete cessation of glutamatergic APs, application of ATP (200 mm, gray bar) causes a resumption of AP firing, yet without completely restoring the initial rate. B, AP firing rate under different conditions: (before) spontaneous activity before application averaged for 90 s; (KynA) mean activity of last 3 s before ATP; and (KynA + ATP) ATP application in the presence of KynA, mean activity for the whole duration of application was considered (mean application duration 28.3 ± 4.4s, n = 4) and (after) mean activity for 60 s period after the end of KynA application. Circles are data from individual cells. Error bars indicate mean ± SEM; *p < 0.05, ANOVA on ranks. C, Top, Mean waveform for control condition (black, n = 714). Bottom, Mean waveform during KynA + ATP application (gray, n = 76). Note that the complex waveform of the SBC discharges recorded under the KynA + ATP condition lacks the presynaptic signal component (P). The latter signals also have longer response rise time from the EPSP to the postsynaptic AP (A-B) than APs evoked by synaptic release of glutamate (black trace).
Next we tested whether ATP—aside from augmentation of spontaneous firing—also affects the sound-evoked activity. Extracellular single units were recorded in vivo while using a two-tone stimulus protocol (see Materials and Methods), with one stimulus component set at the unit's CF (20 dB above threshold) and the second stimulus component—with a 25 ms time lag—in the unit's inhibitory sideband (Fig. 5A). From analysis of PSTHs, both the contribution of P2Rs to sound-driven excitation and the changes following the additional activation of inhibitory inputs could be evaluated. Under the application of ATP, the overall firing activity was significantly increased in P13–P16 and P20–P23 animals, but not in >P60 (Fig. 5B). Extracellular ATP increased the number of APs generated during excitatory acoustic stimulation (P13–P16: AP frequency before = 182.4 ± 28.7 Hz; ATP = 233.6 ± 34.0 Hz; n = 6, p < 0.001; P20–P23: AP frequency before = 143.7 ± 16.4 Hz; ATP = 180.1 ± 18.5 Hz; n = 6, p < 0.001, paired t test). Prominent ATP effects on SBC firing were also observed during the additional activation of sideband inhibition (P13–P16: AP frequency before = 79.2 ± 23.0 Hz; ATP = 110.3 ± 28.5 Hz; n = 6, p < 0.01; P20–P23: AP frequency before = 60.5 ± 13.3 Hz; ATP = 79.1 ± 13.8 Hz, n = 6, p < 0.001, paired t test). In control experiments, administration of dH2O (pH 8) did not alter the firing rate (Fig. 5B; stimulatory signal: mean frequency = 182.1 ± 16.3 Hz; dH2O = 181.8 ± 18.4 Hz; n = 7, p = 0.93; stimulatory + inhibitory signal: mean frequency = 70.2 ± 12.2 Hz; dH2O = 70.7 ± 13.2 Hz; n = 7, p = 0.94, paired t test). ATP had no effect on FSL (FSL: P13–P16 control = 6.6 ± 0.7 ms; ATP = 6.3 ± 0.6 ms; n = 6, p = 0.26; P20–P23 control = 5.3 ± 0.3 ms; ATP = 5.2 ± 0.3 ms; n = 6, p = 0.52, paired t test). Also, jitter values were similar between the two conditions (jitter: P13–P16 control = 1.5 ± 0.1 ms; ATP = 1.7 ± 0.2 ms; n = 6, p = 0.51; P20–P23 control = 1.8 ± 0.4 ms; ATP = 2.0 ± 0.6 ms; n = 6, p = 0.63, paired t test).
These experiments demonstrate that the major effect of purinergic signaling might be a general enhancement of firing, rather than a specific augmentation of spontaneous activity or modulation of spiking activity during acoustic stimulation.
In the CN, purinergic signaling is confined to bushy cells
To investigate whether the P2Rs are confined to specific cell types, whole-cell recordings and Ca2+ measurements were also done on other neurons in the VCN from P7–P9 gerbils. Since the data from SBCs showed a developmental downregulation of P2Rs, it was assumed that, if other neuronal types were engaged in purinergic signaling, the most prominent effects should be observed before hearing onset. The recordings revealed that stellate cells from the AVCN and octopus cells from the posteroventral CN most likely do not express P2Rs (Figs. 6, 8). The negative results from stellate cells are consistent with in vivo data, but also with our earlier observation in slice experiments (Milenkovic et al., 2009).
Figure 6.

P2XRs are expressed on bushy cells, but not on stellate or octopus cells. Left, Biocytin labeling of recorded neurons reveals the morphology of an SBC and a GBC, an octopus, and a stellate cell (top to bottom). The recordings to the right were acquired from the respective cells. Middle, Electrophysiological characterization shows the phasic firing in response to depolarizing current steps in the SBC, GBC, and in the octopus cell. Stellate cell shows the characteristic tonic firing pattern. Responses of SBC and GBC to hyperpolarizing current steps sag back toward rest due to inward rectification. Right, Comparison of the responses, obtained by whole-cell recordings from SBC (black traces) and GBC (gray traces), upon ATPγS puff application (150 ms). The magnitude of depolarization, current, and the Ca2+ signal is more prominent in SBC than in GBC. In octopus and stellate cells, ATPγS had no effect. Control application of glutamate, however, elicited strong responses, thus confirming the cells' vitality.
In globular bushy cells (GBCs), on the other hand, ATPγS reliably evoked inward current, membrane depolarization, and Ca2+ transients (Fig. 6). Yet these responses were consistently smaller than in SBCs (see Figure 8B current: SBCs = 147.2 ± 26.9 pA, n = 17, GBCs = 46.0 ± 5.2 pA, n = 11, p < 0.001; Figure 8C depolarization: SBCs = 21.1 ± 1.5mV, n = 23, GBCs = 11.2 ± 1.2mV, n = 11, p < 0.001, ANOVA, Holm–Sidak post hoc test; Ca2+ signal ΔR: SBCs = 19.9 ± 1.2%, n = 43, GBCs = 7.9 ± 0.5%, n = 3; p < 0.05, Mann–Whitney rank sum test). As in SBCs, bath application of TNP-ATP (5 μm) completely inhibited the ATPγS-induced current (Fig. 8F) suggesting akin P2X subunit composition in both neuron types (mean ATPγS-evoked current for GBCs = 46.0 ± 5.2 pA, n = 11; ATPγS + TNP-ATP = 0.3 ± 0.1 pA, n = 6, p < 0.001, t test). Higher Rin values of SBCs compared with GBCs (SBCs = 152.0 ± 6.6 MΩ, n = 73, GBCs = 110.1 ± 7.9MΩ, n = 14, p = 0.003, t test; P7–P9) probably contribute to more prominent P2R responses. Despite these differences, these data demonstrate that purinergic signaling in developing CN is confined to the bushy cells.
Regional specificity of P2R-mediated responses in SOC
We next examined whether SOC neurons show physiological responses to ATPγS at P7–P9. Surprisingly, the MSO neurons were completely insensitive to ATPγS (Figs. 7, 8). On the other hand, ATPγS elicited moderate depolarization and inward currents in both the lateral and the medial limb LSO neurons (Figs. 7, 8) (mean depolarization: 11.0 ± 3.8 mV; mean current: 25.4 ± 7.0 pA; n = 6).
Figure 7.

Regional specificity of P2X-mediated responses in the SOC. Whole-cell recordings from biocytin-labeled P9 neurons in the SOC. The labeling was visualized post hoc with Cy2-conjugated streptavidin. Under current-clamp, neurons show typical phasic responses to depolarizing current steps. Note that moderate responses to ATPγS application (150 ms) were recorded in the LSO and in the MNTB neuron, but not in the MSO neuron, the vitality of which was confirmed with glutamate application. The MSO neuron in the lower left is not from the slice shown in the center, but its respective position in the brain slice is indicated by the tip of the dashed line. The position of this neuron shows a good match with the axonal terminal field of the MNTB neuron on the right side. The current and voltage traces correspond to the adjacent neurons.
ATPγS failed to induce Ca2+ signals in the LSO neurons and APs were generally missing (only 1 AP in 1 of 13 neurons). Four of nine neurons in the lateral limb responded to ATPγS. Among these four neurons, two displayed bipolar and two multipolar morphology. In the medial LSO limb, two of four neurons showed purinergic responses and had multipolar shapes. However, because of prominent developmental changes in the morphology of LSO neurons, it is difficult to infer any specific neuronal type at this developmental stage (Rietzel and Friauf, 1998). Still, it can be concluded that approximately half of the recorded LSO neurons express P2Rs.
In the SOC, some of the SBC target neurons express P2Rs, such as LSO neurons from the lateral limb, whereas others like the MSO neurons lack these receptors. To further explore this issue, the effects of ATPγS in developing principal neurons of the MNTB were compared with the data obtained from GBCs. The magnitudes of the P2X responses in the GBCs and MNTB neurons were strikingly similar (Fig. 8). In the MNTB, the ATPγS-evoked currents also show full sensitivity to TNP-ATP (mean ATPγS-evoked current = 72.2 ± 13.8 pA, n = 14; ATPγS + TNP-ATP = 0.8 ± 0.3 pA, n = 6, p < 0.001, t test) (Fig. 8F).
The enhancing effect of ATP on firing properties of MNTB neurons was also confirmed by in vivo recordings; however, only in one of nine recorded neurons from P13–P16. Similar to results in SBCs, ATP enhanced the spontaneous and acoustically evoked activity in this MNTB unit (spontaneous AP frequency before = 46.0 ± 1.0 Hz, ATP = 58.7 ± 1.0 Hz, after = 48.2 ± 1.1 Hz; p < 0.001, ANOVA) (mean AP frequency: stimulatory signal = 126.0 ± 4.0 Hz, ATP = 157.6 ± 4.1Hz, p < 0.001; stimulatory + inhibitory signal = 67.2 ± 4.2 Hz, ATP = 97.2 ± 4.4 Hz, p < 0.001, Mann–Whitney rank sum test). Together, these data demonstrate that ATP can enhance the activity of specific neuron types in developing auditory brainstem.
Endogenous release of ATP contributes to firing of SBCs
We further investigated the possibility of endogenous ATP release affecting neuronal activity in the rostral AVCN. A potent antagonist at P2X1–3 receptors, TNP-ATP, was iontophoretically administered during extracellular in vivo recordings in 13 gerbils from P13–P23 and 3 adult gerbils (>P60). A total of 48 units were recorded, with CFs in the range of 700–4300 Hz (mean 2481 ± 167 Hz, n = 48). Thirty-eight units showed both the characteristic complex waveform and primary-like PSTHs, while the remaining 10 units showed either one of these SBCs characteristics. While all recorded SBCs responded to glycine administration with a reversible block of activity, decreased firing rate in response to TNP-ATP was observed in 42% of P13–P16 cells (8/19) and in just 33% of P20–P23 units (6/18). TNP-ATP had no effect in adult. TNP-ATP application caused rapid and sustained inhibition of spontaneous firing to 39 ± 6% of the initial rate in P13–P16, and to 43 ± 10% in P20–P23 animals (Fig. 9B). The discharge rate recovered after the end of the exposure in both groups.
Figure 9.
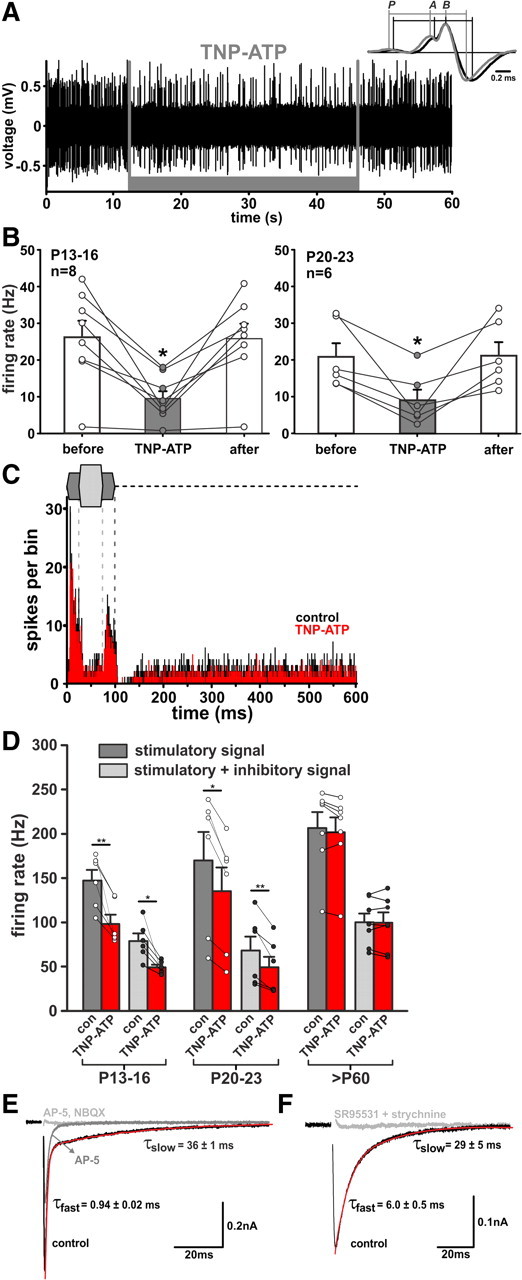
Endogenous ATP contributes to SBCs firing in vivo. A, Iontophoretic application of TNP-ATP (1 mm, gray bar) reversibly reduces the rate of spontaneous SBCs firing. Inset shows the mean waveforms calculated for 1299 APs under control condition (black) and 461 APs under TNP-ATP application (gray). The waveforms are aligned at B, the peak of APs: P, prepotential; A, EPSP. Note the longer A-B transition and shorter AP duration under TNP-ATP. B, Changes in spontaneous spiking elicited by TNP-ATP in P13–P16 and P20–P23 animals. Circles are data from individual cells. Error bars indicate mean ± SEM. *p < 0.05. C, PSTHs (bin width 0.5 ms) of responses to a two-tone stimulation. Design as in Figure 5, excitatory stimulus at CF = 1.4 kHz, 20 dB SPL, inhibitory stimulus at 4.8 kHz, 30 dB SPL; before (black) and during TNP-ATP application (red). D, Summary of the TNP-ATP effects (red bars) on the AP rates under excitatory (dark gray) and combined excitatory and inhibitory (light gray) stimulation. TNP-ATP significantly inhibited firing in P13–P16 and P20–P23. Circles represent individual cells. Error bars indicate mean ± SEM. **p < 0.01, ***p < 0.001. E, EPSCs from a P9 SBC, recorded at 33°C. Traces are average for >5 events recorded under each condition. Decays were best fit with the sum of two exponentials. The exponential fit is superimposed on the EPSC decay (red). The NMDAR (50 μm AP-5) and AMPAR (10 μm NBQX) antagonists completely inhibited the EPSCs, leaving no residual component that could be attributed to P2XR activation. F, Example IPSC traces showing mean for >5 single-shock stimuli, recorded from a P9 SBC. IPSCs were recorded at Vhold = −60 mV with [Cl−]pipette = 26 mm. Decays were best fit by a double exponential function (red). Pharmacological blockade confirms glycinergic/GABAergic transmission and excludes contribution of P2XRs.
Inhibition of P2XRs also had an effect on the AP generation in SBCs, i.e., it prolonged the time between the EPSP (Fig. 9A inset, component A of the complex waveform) and the peak of the postsynaptic AP (Fig. 9A inset, component B; Typlt et al., 2010) (A-B delay in P13–P16 control = 0.20 ± 0.02 ms, TNP-ATP = 0.25 ± 0.02 ms, after = 0.20 ± 0.02 ms, n = 7, p < 0.001; P20–P23 control = 0.24 ± 0.04 ms, TNP-ATP = 0.27 ± 0.04 ms, after = 0.25 ± 0.04 ms, n = 6, p < 0.01, RM ANOVA). At the same time, the delay between the presynaptic (P) component (discharge of the endbulb of Held) and the A component was not affected, confirming the postsynaptic mechanism of action. This notion was further supported by the finding that inhibition of P2XRs by TNP-ATP also shortens the AP duration, calculated as time from the positive to negative peak of the extracellularly recorded biphasic signal (AP duration in P13–P16 control = 0.43 ± 0.03 ms, TNP-ATP = 0.38 ± 0.02 ms, after = 0.43 ± 0.02 ms, n = 8, p < 0.001; P20–P23 control = 0.35 ± 0.02 ms, TNP-ATP = 0.33 ± 0.02 ms, after = 0.35 ± 0.02 ms, n = 6, p = 0.13, RM ANOVA). This observation is potentially interesting because the APs generally become shorter during development (positive to negative AP peak in P13–P16 = 0.40 ± 0.01 ms (n = 75); P20–P23 = 0.34 ± 0.01 ms (n = 57); adult = 0.30 ± 0.004 ms (n = 72), p < 0.001, ANOVA on ranks). During two-tone stimulation, TNP-ATP induced reduction of both acoustically evoked AP generation, recorded at CF (stimulatory signal P13–P16: −32 ± 5%, n = 6; P20–P23: −22 ± 2%, n = 6), and during acoustically evoked systemic inhibition (stimulatory + inhibitory signal P13–P16: −35 ± 6%, n = 6; P20–P23: −29 ± 4%, n = 6) (Fig. 9C,D). While TNP-ATP had no effect on the FSL, it increased jitter in P13–P16 (control = 2.2 ± 0.3 ms; TNP-ATP = 4.9 ± 0.9 ms; n = 6, p < 0.05; paired t test), but not in the P20–P23 group (control = 2.0 ± 0.3 ms; TNP-ATP = 2.4 ± 0.4 ms; n = 6, p = 0.71, paired t test).Together, these data suggest that in the presence of endogenous ATP the integration time for AP generation is shorter and at the same time the APs are prolonged. Moreover, the endogenous release of ATP contributes to the spontaneous as well as to acoustically evoked neuronal activity. The modulatory effects of purinergic signaling diminish, however, during development.
To explore the possible source of ATP, recordings of EPSCs from SBCs were obtained in P8–P10 animals. EPSCs were evoked by electrical stimulation of the auditory nerve fibers in the presence of the GABA and glycine receptor antagonists (20 μm SR95531, 3 μm CGP55845, and 0.5 μm strychnine). When recorded at −60 mV, the EPSCs had magnitudes ranging from 0.5 to 1.7 nA and showed bi-exponential decays (τwd = 7.0 ± 2.2 ms, τfast = 1.0 ± 0.4 ms, τslow = 28.5 ± 7.8 ms, %τfast = 78, n = 8; 33°C) (Fig. 9E). Superfusion of 50 μm AP-5 and 10 μm NBQX inhibited the mean peak EPSC amplitude by 98% (mean control EPSC = 1064 ± 180 pA, AP-5 + NBQX = 24 ± 4 pA, n = 6, p = 0.002, paired t test). To test whether ATP might be released from inhibitory synaptic inputs, IPSCs were recorded at −60 mV with [Cl−]pipette set to 26 mm, while the glutamate receptors were blocked by 50 μm AP-5 and 10 μm NBQX (Fig. 9F). The IPSCs were best fit with the sum of two exponentials (τwd = 16.1 ± 2.4 ms, τfast = 5.7 ± 0.7 ms, τslow = 30.4 ± 4.5 ms, %τfast = 51, n = 7; 33°C). SR95531 (20 μm) and strychnine (0.5 μm) inhibited efficiently the IPSCs amplitudes (mean control IPSC amplitude = 281 ± 52 pA, SR95531 + strychnine = 19 ± 3 pA, n = 7, p < 0.001, paired t test). In one of seven neurons, a very small residual current was insensitive to ensuing TNP-ATP application. Therefore, we conclude that the ATP is probably not released from glutamatergic or GABA/glycinergic synaptic terminals in the CN.
Discussion
Sound-independent patterned activity occurs throughout the afferent auditory pathways during early postnatal development and is replaced by a Poisson-like spontaneous firing after hearing onset (Walsh and McGee, 1988; Rübsamen and Schäfer, 1990; Gummer and Mark, 1994; Lippe, 1994; Jones et al., 2007; Sonntag et al., 2009). Competition driven by such activity may be essential for development and refinement of topographic connections both in the auditory and the visual system (Katz and Shatz, 1996; Shatz, 1996; Stellwagen and Shatz, 2002). Our findings indicate that ATP, released endogenously in the CN from a yet unknown source, acts via P2XRs on bushy cells to increase AP firing initially generated in the cochlea. In the CN and in the SOC, where synaptic refinement of topographic maps followed by axonal pruning depends on spontaneous and/or early sound-driven activity (Kapfer et al., 2002; Leake et al., 2002; Kandler et al., 2009), purinergic modulation of neuronal activity could possibly play a role in establishment of functional auditory brainstem circuits. This study reports substantial findings, some of which are consistent with ATP modulation during the period when these circuits are established: (1) P2X responses in SBC are prominent prehearing and downregulated after the onset of acoustically evoked neuronal signal processing; (2) activation of P2XRs on SBCs can per se evoke APs, but also increases the firing rate driven by the glutamatergic input; (3) endogenously released ATP facilitates the AP generation as indicated by shorter EPSP-AP transitions; (4) ATP is unlikely to be coreleased with glutamate from excitatory endbulb terminals or with GABA/glycine from inhibitory synaptic terminals; and (5) purinergic signaling is confined to specific neuron types within auditory brainstem nuclei.
ATP—activity modulator beyond the cochlea
Purinergic modulation has been extensively studied in the inner ear, where it supports cochlear homeostasis (Wang et al., 2003; Thorne et al., 2004), modulates transmission at the inner and outer hair cells (Housley et al., 1999; Robertson and Paki, 2002; Weisz et al., 2009), and contributes to morphological and physiological maturation of the cochlea (Housley, 2000; Housley et al., 2009). The latter is apparent through a transient postnatal expression of specific P2R and paracrine ATP signaling (Huang et al., 2006, 2010; Tritsch et al., 2007). ATP released by the Kölliker's organ in the prehearing cochlea excites the inner hair cells and leads to ensuing activation of SGNs (Glowatzki and Fuchs, 2002; Tritsch et al., 2010). Our data demonstrate that ATP also enhances the spontaneous as well as the sound-driven activity of SBCs in the CN. This effect is mediated by a direct action via P2XRs on SBCs, which evoke membrane depolarization and calcium transients (Milenkovic et al., 2009). By increasing [Ca2+]i, P2XRs can mediate long-term plasticity changes (long-term potentiation and long-term depression) in the CA1 pyramidal neurons of the hippocampus (Pankratov et al., 2002; Yamazaki et al., 2003; Lorca et al., 2011). Future experiments will have to clarify whether similar regulations of synaptic strength occur in developing bushy cells.
In accordance with developmental cessation of ATP release in the cochlea, the ATP responsiveness of SBCs in the AVCN was decreased after hearing onset. Both our slice and in vivo recordings consistently show developmental downregulation, and it is conceivable that ATP takes its most prominent physiological effects before hearing onset. This places purinergic signaling in a position of a neuromodulator during the critical developmental period, when the neuronal activity guides postnatal refinement of topographically broad projections from the cochlea to the AVCN (Leake et al., 2002, 2006).
A modulatory role of purinergic signaling was described in LSO neurons of neonatal rats where presynaptic P2Rs modulate glutamate release, and postsynaptic receptors on LSO principal neurons mediate depolarizing cation conductance (Kreinest et al., 2009). Our data are similar with respect to the occurrence of P2Rs on LSO neurons (46%) here and 41% described by Kreinest et al. (2009). The fact that at a defined time point different shares of principal neurons in the respective nuclei responded to ATP (P7–P9: 92% SBCs, 79% GBCs, and 53% MNTB) might suggest different developmental time courses of purinergic signaling. However, we consider it more likely that P2Rs are confined to specific cell types, given that stellate cells, octopus cells, and MSO neurons lack ATP responses. While the details of purinergic contribution to neuronal development remain to be further clarified, the current data already hint toward a selective impact on neurons receiving monaural inputs, such as CN bushy cells and MNTB principal neurons. In contrast, neurons that receive binaural inputs such as the LSO principal cells, only partially express P2Rs, and MSO neurons completely lack them.
Importance of neuronal activity for functional development in the brainstem
Establishment of a precise tonotopic organization within the auditory circuitry requires two important steps: Genetically determined assembly of initial connectivity, which is controlled by guidance molecules (Rubel and Fritzsch, 2002; Cramer, 2005; Appler and Goodrich, 2011; Nakamura and Cramer, 2011) and activity-dependent remodeling of axonal domains, which yields a more selective topographic restriction of synaptic inputs (Sanes and Takács, 1993; Friauf and Lohmann, 1999; Kandler, 2004; Walmsley et al., 2006). Moreover, early neuronal activity provides trophic signals, necessary for survival of second- and third-order neurons of the auditory brainstem (Parks, 1997; O'Neil et al., 2011). This led to the hypothesis that some unknown trophic molecule coreleased with glutamate might be essential for neuronal survival (Hyson and Rubel, 1989; Rubel and Fritzsch, 2002). Our results imply that ATP might serve this function, showing that endogenously released ATP contributes to AP firing in SBCs. In later stages of development the ATP effect in the CN diminishes. However, our experiments do not support the assumption that ATP is synaptically coreleased with glutamate or with GABA/glycine (Fig. 9E,F). It is plausible that ATP is released from non-neuronal elements through gap-junction hemichannels or pannexins, i.e., through mechanisms similar to ATP release in the cochlea (Zhao et al., 2005; Wang et al., 2009). Still, our results indicate the possible dependence of ATP release on glutamatergic transmission. Spiking activity in vivo was completely abolished with KynA, suggesting that most likely also the release of ATP tailed off. This points to a potential link to glial cells, which can release ATP upon stimulation with glutamate (Lalo et al., 2011; Wurm et al., 2011). Whether such a tripartite synaptic mechanism controls the release of ATP in the CN remains to be determined in future studies.
Development of neuronal membrane properties in the MNTB principal neurons and regulation of synaptic strength depend on auditory nerve activity (Walmsley et al., 2006). In congenitally deaf mice, the lack of afferent input causes disruption of the topographic gradient of voltage gated potassium conductance (also inducing increased excitability), and dysfunctional sodium channels (Leão et al., 2006a,b; Walmsley et al., 2006). Spontaneous afferent activity is also important for survival of the LSO neurons and development of physiological properties controlling AP firing, as shown recently in Cav1.3−/− mice (Hirtz et al., 2011).
By enhancing the excitability of CN bushy cells, MNTB, and (selected) LSO neurons, the actions of P2XRs may critically contribute to the maintenance of synaptic contacts through Hebbian-like plasticity (Walmsley et al., 2006). Contrary to NMDAR, the activation of P2XRs can mediate substantial Ca2+ influx at resting membrane potential. Both receptor types were shown to be involved in Ca2+-driven plasticity processes (Pankratov et al., 2009). Given the modulatory effect on neuronal excitability shown here, it is a reasonable assumption that purinergic signaling could be engaged by some developmental mechanisms such as trophic regulation, regulation of synaptic strength, or structural reorganization.
Footnotes
This work was supported by the Deutsche Forschungsgemeinschaft Grants MI 954/1-2 (I.M.), RU 390/19-1 (R.R.), GRK 1097 (B.D.), and DAAD scholarship to S.J. Development of data analysis routines by Bernhard Englitz is greatly acknowledged.
References
- Appler JM, Goodrich LV. Connecting the ear to the brain: molecular mechanisms of auditory circuit assembly. Prog Neurobiol. 2011;93:488–508. doi: 10.1016/j.pneurobio.2011.01.004. [DOI] [PMC free article] [PubMed] [Google Scholar]
- Balakrishnan V, Becker M, Löhrke S, Nothwang HG, Güresir E, Friauf E. Expression and function of chloride transporters during development of inhibitory neurotransmission in the auditory brainstem. J Neurosci. 2003;23:4134–4145. doi: 10.1523/JNEUROSCI.23-10-04134.2003. [DOI] [PMC free article] [PubMed] [Google Scholar]
- Banks MI, Smith PH. Intracellular recordings from neurobiotin-labeled cells in brain slices of the rat medial nucleus of the trapezoid body. J Neurosci. 1992;12:2819–2837. doi: 10.1523/JNEUROSCI.12-07-02819.1992. [DOI] [PMC free article] [PubMed] [Google Scholar]
- Bazwinsky I, Härtig W, Rübsamen R. Characterization of cochlear nucleus principal cells of Meriones unguiculatus and Monodelphis domestica by use of calcium-binding protein immunolabeling. J Chem Neuroanat. 2008;35:158–174. doi: 10.1016/j.jchemneu.2007.10.003. [DOI] [PubMed] [Google Scholar]
- Bischofberger J, Engel D, Li L, Geiger JR, Jonas P. Patch-clamp recording from mossy fiber terminals in hippocampal slices. Nat Protoc. 2006;1:2075–2081. doi: 10.1038/nprot.2006.312. [DOI] [PubMed] [Google Scholar]
- Blackburn CC, Sachs MB. Classification of unit types in the anteroventral cochlear nucleus: PST histograms and regularity analysis. J Neurophysiol. 1989;62:1303–1329. doi: 10.1152/jn.1989.62.6.1303. [DOI] [PubMed] [Google Scholar]
- Cao XJ, Shatadal S, Oertel D. Voltage-sensitive conductances of bushy cells of the mammalian ventral cochlear nucleus. J Neurophysiol. 2007;97:3961–3975. doi: 10.1152/jn.00052.2007. [DOI] [PubMed] [Google Scholar]
- Chirila FV, Rowland KC, Thompson JM, Spirou GA. Development of gerbil medial superior olive: integration of temporally delayed excitation and inhibition at physiological temperature. J Physiol. 2007;584:167–190. doi: 10.1113/jphysiol.2007.137976. [DOI] [PMC free article] [PubMed] [Google Scholar]
- Chung SK, Reinhart PH, Martin BL, Brautigan D, Levitan IB. Protein kinase activity closely associated with a reconstituted calcium-activated potassium channel. Science. 1991;253:560–562. doi: 10.1126/science.1857986. [DOI] [PubMed] [Google Scholar]
- Cramer KS. Eph proteins and the assembly of auditory circuits. Hear Res. 2005;206:42–51. doi: 10.1016/j.heares.2004.11.024. [DOI] [PubMed] [Google Scholar]
- Dehmel S, Kopp-Scheinpflug C, Weick M, Dörrscheidt GJ, Rübsamen R. Transmission of phase-coupling accuracy from the auditory nerve to spherical bushy cells in the Mongolian gerbil. Hear Res. 2010;268:234–249. doi: 10.1016/j.heares.2010.06.005. [DOI] [PubMed] [Google Scholar]
- Eglen SJ, Gjorgjieva J. Self-organization in the developing nervous system: theoretical models. HFSP J. 2009;3:176–185. doi: 10.2976/1.3079539. [DOI] [PMC free article] [PubMed] [Google Scholar]
- Englitz B, Tolnai S, Typlt M, Jost J, Rübsamen R. Reliability of synaptic transmission at the synapses of Held in vivo under acoustic stimulation. PLoS One. 2009;4:e7014. doi: 10.1371/journal.pone.0007014. [DOI] [PMC free article] [PubMed] [Google Scholar]
- Fekete DM, Rouiller EM, Liberman MC, Ryugo DK. The central projections of intracellularly labeled auditory nerve fibers in cats. J Comp Neurol. 1984;229:432–450. doi: 10.1002/cne.902290311. [DOI] [PubMed] [Google Scholar]
- Feldman ML, Harrison JM. The projection of the acoustic nerve to the ventral cochlear nucleus of the rat. A Golgi study. J Comp Neurol. 1969;137:267–294. doi: 10.1002/cne.901370303. [DOI] [PubMed] [Google Scholar]
- Francis HW, Manis PB. Effects of deafferentation on the electrophysiology of ventral cochlear nucleus neurons. Hear Res. 2000;149:91–105. doi: 10.1016/s0378-5955(00)00165-9. [DOI] [PubMed] [Google Scholar]
- Friauf E, Lohmann C. Development of auditory brainstem circuitry. Activity-dependent and activity-independent processes. Cell Tissue Res. 1999;297:187–195. doi: 10.1007/s004410051346. [DOI] [PubMed] [Google Scholar]
- Glowatzki E, Fuchs PA. Transmitter release at the hair cell ribbon synapse. Nat Neurosci. 2002;5:147–154. doi: 10.1038/nn796. [DOI] [PubMed] [Google Scholar]
- Grynkiewicz G, Poenie M, Tsien RY. A new generation of Ca2+ indicators with greatly improved fluorescence properties. J Biol Chem. 1985;260:3440–3450. [PubMed] [Google Scholar]
- Guinan JJ, Jr, Li RY. Signal processing in brainstem auditory neurons which receive giant endings (calyces of Held) in the medial nucleus of the trapezoid body of the cat. Hear Res. 1990;49:321–334. doi: 10.1016/0378-5955(90)90111-2. [DOI] [PubMed] [Google Scholar]
- Gummer AW, Mark RF. Patterned neural activity in brain stem auditory areas of a prehearing mammal, the tammar wallaby (Macropus eugenii) Neuroreport. 1994;5:685–688. doi: 10.1097/00001756-199402000-00006. [DOI] [PubMed] [Google Scholar]
- Hackney CM, Osen KK, Kolston J. Anatomy of the cochlear nuclear complex of guinea pig. Anat Embryol (Berl) 1990;182:123–149. doi: 10.1007/BF00174013. [DOI] [PubMed] [Google Scholar]
- Havey DC, Caspary DM. A simple technique for constructing ‘piggy-back’ multibarrel microelectrodes. Electroencephalogr Clin Neurophysiol. 1980;48:249–251. doi: 10.1016/0013-4694(80)90313-2. [DOI] [PubMed] [Google Scholar]
- Hirtz JJ, Boesen M, Braun N, Deitmer JW, Kramer F, Lohr C, Müller B, Nothwang HG, Striessnig J, Löhrke S, Friauf E. Cav1.3 calcium channels are required for normal development of the auditory brainstem. J Neurosci. 2011;31:8280–8294. doi: 10.1523/JNEUROSCI.5098-10.2011. [DOI] [PMC free article] [PubMed] [Google Scholar]
- Housley GD. Physiological effects of extracellular nucleotides in the inner ear. Clin Exp Pharmacol Physiol. 2000;27:575–580. doi: 10.1046/j.1440-1681.2000.03314.x. [DOI] [PubMed] [Google Scholar]
- Housley GD, Kanjhan R, Raybould NP, Greenwood D, Salih SG, Järlebark L, Burton LD, Setz VC, Cannell MB, Soeller C, Christie DL, Usami S, Matsubara A, Yoshie H, Ryan AF, Thorne PR. Expression of the P2X(2) receptor subunit of the ATP-gated ion channel in the cochlea: implications for sound transduction and auditory neurotransmission. J Neurosci. 1999;19:8377–8388. doi: 10.1523/JNEUROSCI.19-19-08377.1999. [DOI] [PMC free article] [PubMed] [Google Scholar]
- Housley GD, Bringmann A, Reichenbach A. Purinergic signaling in special senses. Trends Neurosci. 2009;32:128–141. doi: 10.1016/j.tins.2009.01.001. [DOI] [PubMed] [Google Scholar]
- Huang LC, Ryan AF, Cockayne DA, Housley GD. Developmentally regulated expression of the P2X3 receptor in the mouse cochlea. Histochem Cell Biol. 2006;125:681–692. doi: 10.1007/s00418-005-0119-4. [DOI] [PubMed] [Google Scholar]
- Huang LC, Thorne PR, Vlajkovic SM, Housley GD. Differential expression of P2Y receptors in the rat cochlea during development. Purinergic Signal. 2010;6:231–248. doi: 10.1007/s11302-010-9191-x. [DOI] [PMC free article] [PubMed] [Google Scholar]
- Hyson RL, Rubel EW. Transneuronal regulation of protein synthesis in the brain-stem auditory system of the chick requires synaptic activation. J Neurosci. 1989;9:2835–2845. doi: 10.1523/JNEUROSCI.09-08-02835.1989. [DOI] [PMC free article] [PubMed] [Google Scholar]
- Jarvis MF, Khakh BS. ATP-gated P2X cation-channels. Neuropharmacology. 2009;56:208–215. doi: 10.1016/j.neuropharm.2008.06.067. [DOI] [PubMed] [Google Scholar]
- Jones TA, Leake PA, Snyder RL, Stakhovskaya O, Bonham B. Spontaneous discharge patterns in cochlear spiral ganglion cells before the onset of hearing in cats. J Neurophysiol. 2007;98:1898–1908. doi: 10.1152/jn.00472.2007. [DOI] [PMC free article] [PubMed] [Google Scholar]
- Kandler K. Activity-dependent organization of inhibitory circuits: lessons from the auditory system. Curr Opin Neurobiol. 2004;14:96–104. doi: 10.1016/j.conb.2004.01.017. [DOI] [PubMed] [Google Scholar]
- Kandler K, Friauf E. Development of glycinergic and glutamatergic synaptic transmission in the auditory brainstem of perinatal rats. J Neurosci. 1995;15:6890–6904. doi: 10.1523/JNEUROSCI.15-10-06890.1995. [DOI] [PMC free article] [PubMed] [Google Scholar]
- Kandler K, Clause A, Noh J. Tonotopic reorganization of developing auditory brainstem circuits. Nat Neurosci. 2009;12:711–717. doi: 10.1038/nn.2332. [DOI] [PMC free article] [PubMed] [Google Scholar]
- Kapfer C, Seidl AH, Schweizer H, Grothe B. Experience-dependent refinement of inhibitory inputs to auditory coincidence-detector neurons. Nat Neurosci. 2002;5:247–253. doi: 10.1038/nn810. [DOI] [PubMed] [Google Scholar]
- Katz LC, Shatz CJ. Synaptic activity and the construction of cortical circuits. Science. 1996;274:1133–1138. doi: 10.1126/science.274.5290.1133. [DOI] [PubMed] [Google Scholar]
- Kopp-Scheinpflug C, Dehmel S, Dörrscheidt GJ, Rübsamen R. Interaction of excitation and inhibition in anteroventral cochlear nucleus neurons that receive large endbulb synaptic endings. J Neurosci. 2002;22:11004–11018. doi: 10.1523/JNEUROSCI.22-24-11004.2002. [DOI] [PMC free article] [PubMed] [Google Scholar]
- Kopp-Scheinpflug C, Tolnai S, Malmierca MS, Rübsamen R. The medial nucleus of the trapezoid body: comparative physiology. Neuroscience. 2008;154:160–170. doi: 10.1016/j.neuroscience.2008.01.088. [DOI] [PubMed] [Google Scholar]
- Kreinest M, Müller B, Winkelhoff J, Friauf E, Löhrke S. Miniature EPSCs in the lateral superior olive before hearing onset: regional and cell-type-specific differences and heterogeneous neuromodulatory effects of ATP. Brain Res. 2009;1295:21–36. doi: 10.1016/j.brainres.2009.07.083. [DOI] [PubMed] [Google Scholar]
- Lalo U, Pankratov Y, Parpura V, Verkhratsky A. Ionotropic receptors in neuronal-astroglial signalling: what is the role of “excitable” molecules in non-excitable cells. Biochim Biophys Acta. 2011;1813:992–1002. doi: 10.1016/j.bbamcr.2010.09.007. [DOI] [PubMed] [Google Scholar]
- Leake PA, Snyder RL, Hradek GT. Postnatal refinement of auditory nerve projections to the cochlear nucleus in cats. J Comp Neurol. 2002;448:6–27. doi: 10.1002/cne.10176. [DOI] [PMC free article] [PubMed] [Google Scholar]
- Leake PA, Hradek GT, Chair L, Snyder RL. Neonatal deafness results in degraded topographic specificity of auditory nerve projections to the cochlear nucleus in cats. J Comp Neurol. 2006;497:13–31. doi: 10.1002/cne.20968. [DOI] [PMC free article] [PubMed] [Google Scholar]
- Leao RN, Berntson A, Forsythe ID, Walmsley B. Reduced low-voltage activated K+ conductances and enhanced central excitability in a congenitally deaf (dn/dn) mouse. J Physiol. 2004;559:25–33. doi: 10.1113/jphysiol.2004.067421. [DOI] [PMC free article] [PubMed] [Google Scholar]
- Leão RN, Naves MM, Leão KE, Walmsley B. Altered sodium currents in auditory neurons of congenitally deaf mice. Eur J Neurosci. 2006a;24:1137–1146. doi: 10.1111/j.1460-9568.2006.04982.x. [DOI] [PubMed] [Google Scholar]
- Leao RN, Sun H, Svahn K, Berntson A, Youssoufian M, Paolini AG, Fyffe RE, Walmsley B. Topographic organization in the auditory brainstem of juvenile mice is disrupted in congenital deafness. J Physiol. 2006b;571:563–578. doi: 10.1113/jphysiol.2005.098780. [DOI] [PMC free article] [PubMed] [Google Scholar]
- Liberman MC, Oliver ME. Morphometry of intracellularly labeled neurons of the auditory nerve: correlations with functional properties. J Comp Neurol. 1984;223:163–176. doi: 10.1002/cne.902230203. [DOI] [PubMed] [Google Scholar]
- Lippe WR. Rhythmic spontaneous activity in the developing avian auditory system. J Neurosci. 1994;14:1486–1495. doi: 10.1523/JNEUROSCI.14-03-01486.1994. [DOI] [PMC free article] [PubMed] [Google Scholar]
- Lorca RA, Rozas C, Loyola S, Moreira-Ramos S, Zeise ML, Kirkwood A, Huidobro-Toro JP, Morales B. Zinc enhances long-term potentiation through P2X receptor modulation in the hippocampal CA1 region. Eur J Neurosci. 2011;33:1175–1185. doi: 10.1111/j.1460-9568.2010.07589.x. [DOI] [PMC free article] [PubMed] [Google Scholar]
- Magnusson AK, Kapfer C, Grothe B, Koch U. Maturation of glycinergic inhibition in the gerbil medial superior olive after hearing onset. J Physiol. 2005;568:497–512. doi: 10.1113/jphysiol.2005.094763. [DOI] [PMC free article] [PubMed] [Google Scholar]
- McGinley MJ, Oertel D. Rate thresholds determine the precision of temporal integration in principal cells of the ventral cochlear nucleus. Hear Res. 2006;216–217:52–63. doi: 10.1016/j.heares.2006.02.006. [DOI] [PubMed] [Google Scholar]
- McKay SM, Oleskevich S. The role of spontaneous activity in development of the endbulb of Held synapse. Hear Res. 2007;230:53–63. doi: 10.1016/j.heares.2007.05.006. [DOI] [PubMed] [Google Scholar]
- Milenkovic I, Witte M, Turecek R, Heinrich M, Reinert T, Rübsamen R. Development of chloride-mediated inhibition in neurons of the anteroventral cochlear nucleus of gerbil (Meriones unguiculatus) J Neurophysiol. 2007;98:1634–1644. doi: 10.1152/jn.01150.2006. [DOI] [PubMed] [Google Scholar]
- Milenkovic I, Rinke I, Witte M, Dietz B, Rübsamen R. P2 receptor-mediated signaling in spherical bushy cells of the mammalian cochlear nucleus. J Neurophysiol. 2009;102:1821–1833. doi: 10.1152/jn.00186.2009. [DOI] [PubMed] [Google Scholar]
- Nakamura PA, Cramer KS. Formation and maturation of the calyx of Held. Hear Res. 2011;276:70–78. doi: 10.1016/j.heares.2010.11.004. [DOI] [PMC free article] [PubMed] [Google Scholar]
- North RA, Surprenant A. Pharmacology of cloned P2X receptors. Annu Rev Pharmacol Toxicol. 2000;40:563–580. doi: 10.1146/annurev.pharmtox.40.1.563. [DOI] [PubMed] [Google Scholar]
- O'Neil JN, Connelly CJ, Limb CJ, Ryugo DK. Synaptic morphology and the influence of auditory experience. Hear Res. 2011;279:118–130. doi: 10.1016/j.heares.2011.01.019. [DOI] [PMC free article] [PubMed] [Google Scholar]
- Ostapoff EM, Feng JJ, Morest DK. A physiological and structural study of neuron types in the cochlear nucleus. II. Neuron types and their structural correlation with response properties. J Comp Neurol. 1994;346:19–42. doi: 10.1002/cne.903460103. [DOI] [PubMed] [Google Scholar]
- Pankratov YV, Lalo UV, Krishtal OA. Role for P2X receptors in long-term potentiation. J Neurosci. 2002;22:8363–8369. doi: 10.1523/JNEUROSCI.22-19-08363.2002. [DOI] [PMC free article] [PubMed] [Google Scholar]
- Pankratov Y, Lalo U, Krishtal OA, Verkhratsky A. P2X receptors and synaptic plasticity. Neuroscience. 2009;158:137–148. doi: 10.1016/j.neuroscience.2008.03.076. [DOI] [PubMed] [Google Scholar]
- Parks TN. Effects of early deafness on development of brain stem auditory neurons. Ann Otol Rhinol Laryngol Suppl. 1997;168:37–43. [PubMed] [Google Scholar]
- Pfeiffer RR. Anteroventral cochlear nucleus: wave forms of extracellularly recorded spike potentials. Science. 1966;154:667–668. doi: 10.1126/science.154.3749.667. [DOI] [PubMed] [Google Scholar]
- Price GD, Trussell LO. Estimate of the chloride concentration in a central glutamatergic terminal: a gramicidin perforated-patch study on the calyx of Held. J Neurosci. 2006;26:11432–11436. doi: 10.1523/JNEUROSCI.1660-06.2006. [DOI] [PMC free article] [PubMed] [Google Scholar]
- Rietzel HJ, Friauf E. Neuron types in the rat lateral superior olive and developmental changes in the complexity of their dendritic arbors. J Comp Neurol. 1998;390:20–40. [PubMed] [Google Scholar]
- Robertson D, Paki B. A role for purinergic receptors at the inner hair cell-afferent synapse? Audiol Neurootol. 2002;7:62–67. doi: 10.1159/000046866. [DOI] [PubMed] [Google Scholar]
- Roos MJ, May BJ. Classification of unit types in the anteroventral cochlear nucleus of laboratory mice. Hear Res. 2012;289:13–26. doi: 10.1016/j.heares.2012.04.019. [DOI] [PMC free article] [PubMed] [Google Scholar]
- Rouiller EM, Ryugo DK. Intracellular marking of physiologically characterized cells in the ventral cochlear nucleus of the cat. J Comp Neurol. 1984;225:167–186. doi: 10.1002/cne.902250203. [DOI] [PubMed] [Google Scholar]
- Rubel EW, Fritzsch B. Auditory system development: primary auditory neurons and their targets. Annu Rev Neurosci. 2002;25:51–101. doi: 10.1146/annurev.neuro.25.112701.142849. [DOI] [PubMed] [Google Scholar]
- Rübsamen R, Schäfer M. Ontogenesis of auditory fovea representation in the inferior colliculus of the Sri Lankan rufous horseshoe bat, Rhinolophus rouxi. J Comp Physiol A. 1990;167:757–769. doi: 10.1007/BF00189766. [DOI] [PubMed] [Google Scholar]
- Sanes DH, Takács C. Activity-dependent refinement of inhibitory connections. Eur J Neurosci. 1993;5:570–574. doi: 10.1111/j.1460-9568.1993.tb00522.x. [DOI] [PubMed] [Google Scholar]
- Shatz CJ. Emergence of order in visual system development. Proc Natl Acad Sci U S A. 1996;93:602–608. doi: 10.1073/pnas.93.2.602. [DOI] [PMC free article] [PubMed] [Google Scholar]
- Smith AJ, Owens S, Forsythe ID. Characterisation of inhibitory and excitatory postsynaptic currents of the rat medial superior olive. J Physiol. 2000;529:681–698. doi: 10.1111/j.1469-7793.2000.00681.x. [DOI] [PMC free article] [PubMed] [Google Scholar]
- Smith PH. Structural and functional differences distinguish principal from nonprincipal cells in the guinea pig MSO slice. J Neurophysiol. 1995;73:1653–1667. doi: 10.1152/jn.1995.73.4.1653. [DOI] [PubMed] [Google Scholar]
- Sonntag M, Englitz B, Kopp-Scheinpflug C, Rübsamen R. Early postnatal development of spontaneous and acoustically evoked discharge activity of principal cells of the medial nucleus of the trapezoid body: an in vivo study in mice. J Neurosci. 2009;29:9510–9520. doi: 10.1523/JNEUROSCI.1377-09.2009. [DOI] [PMC free article] [PubMed] [Google Scholar]
- Sonntag M, Englitz B, Typlt M, Rübsamen R. The calyx of held develops adult-like dynamics and reliability by hearing onset in the mouse in vivo. J Neurosci. 2011;31:6699–6709. doi: 10.1523/JNEUROSCI.0575-11.2011. [DOI] [PMC free article] [PubMed] [Google Scholar]
- Stellwagen D, Shatz CJ. An instructive role for retinal waves in the development of retinogeniculate connectivity. Neuron. 2002;33:357–367. doi: 10.1016/s0896-6273(02)00577-9. [DOI] [PubMed] [Google Scholar]
- Thorne PR, Muñoz DJ, Housley GD. Purinergic modulation of cochlear partition resistance and its effect on the endocochlear potential in the guinea pig. J Assoc Res Otolaryngol. 2004;5:58–65. doi: 10.1007/s10162-003-4003-4. [DOI] [PMC free article] [PubMed] [Google Scholar]
- Tolbert LP, Morest DK, Yurgelun-Todd DA. The neuronal architecture of the anteroventral cochlear nucleus of the cat in the region of the cochlear nerve root: horseradish peroxidase labelling of identified cell types. Neuroscience. 1982;7:3031–3052. doi: 10.1016/0306-4522(82)90228-7. [DOI] [PubMed] [Google Scholar]
- Tolnai S, Englitz B, Scholbach J, Jost J, Rübsamen R. Spike transmission delay at the calyx of Held in vivo: rate dependence, phenomenological modeling, and relevance for sound localization. J Neurophysiol. 2009;102:1206–1217. doi: 10.1152/jn.00275.2009. [DOI] [PubMed] [Google Scholar]
- Tritsch NX, Bergles DE. Developmental regulation of spontaneous activity in the mammalian cochlea. J Neurosci. 2010;30:1539–1550. doi: 10.1523/JNEUROSCI.3875-09.2010. [DOI] [PMC free article] [PubMed] [Google Scholar]
- Tritsch NX, Yi E, Gale JE, Glowatzki E, Bergles DE. The origin of spontaneous activity in the developing auditory system. Nature. 2007;450:50–55. doi: 10.1038/nature06233. [DOI] [PubMed] [Google Scholar]
- Tritsch NX, Rodríguez-Contreras A, Crins TT, Wang HC, Borst JG, Bergles DE. Calcium action potentials in hair cells pattern auditory neuron activity before hearing onset. Nat Neurosci. 2010;13:1050–1052. doi: 10.1038/nn.2604. [DOI] [PMC free article] [PubMed] [Google Scholar]
- Typlt M, Haustein MD, Dietz B, Steinert JR, Witte M, Englitz B, Milenkovic I, Kopp-Scheinpflug C, Forsythe ID, Rübsamen R. Presynaptic and postsynaptic origin of multicomponent extracellular waveforms at the endbulb of Held-spherical bushy cell synapse. Eur J Neurosci. 2010;31:1574–1581. doi: 10.1111/j.1460-9568.2010.07188.x. [DOI] [PubMed] [Google Scholar]
- Virginio C, Robertson G, Surprenant A, North RA. Trinitrophenyl-substituted nucleotides are potent antagonists selective for P2X1, P2X3, and heteromeric P2X2/3 receptors. Mol Pharmacol. 1998;53:969–973. [PubMed] [Google Scholar]
- Walmsley B, Berntson A, Leao RN, Fyffe RE. Activity-dependent regulation of synaptic strength and neuronal excitability in central auditory pathways. J Physiol. 2006;572:313–321. doi: 10.1113/jphysiol.2006.104851. [DOI] [PMC free article] [PubMed] [Google Scholar]
- Walsh EJ, McGee J. Rhythmic discharge properties of caudal cochlear nucleus neurons during postnatal development in cats. Hear Res. 1988;36:233–247. doi: 10.1016/0378-5955(88)90065-2. [DOI] [PubMed] [Google Scholar]
- Wang JC, Raybould NP, Luo L, Ryan AF, Cannell MB, Thorne PR, Housley GD. Noise induces up-regulation of P2X2 receptor subunit of ATP-gated ion channels in the rat cochlea. Neuroreport. 2003;14:817–823. doi: 10.1097/00001756-200305060-00008. [DOI] [PubMed] [Google Scholar]
- Wang XH, Streeter M, Liu YP, Zhao HB. Identification and characterization of pannexin expression in the mammalian cochlea. J Comp Neurol. 2009;512:336–346. doi: 10.1002/cne.21898. [DOI] [PMC free article] [PubMed] [Google Scholar]
- Watano T, Calvert JA, Vial C, Forsythe ID, Evans RJ. P2X receptor subtype-specific modulation of excitatory and inhibitory synaptic inputs in the rat brainstem. J Physiol. 2004;558:745–757. doi: 10.1113/jphysiol.2004.066845. [DOI] [PMC free article] [PubMed] [Google Scholar]
- Weisz C, Glowatzki E, Fuchs P. The postsynaptic function of type II cochlear afferents. Nature. 2009;461:1126–1129. doi: 10.1038/nature08487. [DOI] [PMC free article] [PubMed] [Google Scholar]
- Winter IM, Robertson D, Yates GK. Diversity of characteristic frequency rate-intensity functions in guinea pig auditory nerve fibres. Hear Res. 1990;45:191–202. doi: 10.1016/0378-5955(90)90120-e. [DOI] [PubMed] [Google Scholar]
- Wu SH, Kelly JB. Synaptic pharmacology of the superior olivary complex studied in mouse brain slice. J Neurosci. 1992;12:3084–3097. doi: 10.1523/JNEUROSCI.12-08-03084.1992. [DOI] [PMC free article] [PubMed] [Google Scholar]
- Wurm A, Pannicke T, Iandiev I, Francke M, Hollborn M, Wiedemann P, Reichenbach A, Osborne NN, Bringmann A. Purinergic signaling involved in Muller cell function in the mammalian retina. Prog Retin Eye Res. 2011;30:324–342. doi: 10.1016/j.preteyeres.2011.06.001. [DOI] [PubMed] [Google Scholar]
- Yamazaki Y, Kaneko K, Fujii S, Kato H, Ito K. Long-term potentiation and long-term depression induced by local application of ATP to hippocampal CA1 neurons of the guinea pig. Hippocampus. 2003;13:81–92. doi: 10.1002/hipo.7999. [DOI] [PubMed] [Google Scholar]
- Zhao HB, Yu N, Fleming CR. Gap junctional hemichannel-mediated ATP release and hearing controls in the inner ear. Proc Natl Acad Sci U S A. 2005;102:18724–18729. doi: 10.1073/pnas.0506481102. [DOI] [PMC free article] [PubMed] [Google Scholar]