

Abstract
While research of human cortical function has typically focused on task-related increases in neuronal activity, there is a growing interest in the complementary phenomenon—namely, task-induced reductions. Recent human BOLD fMRI studies have associated such reductions with a specific network termed the default mode network (DMN). However, detailed understanding of the spatiotemporal patterns of task-negative responses and particularly how they compare across different cortical networks is lacking. Here we examined this issue in a large-scale electrocorticography study in patients performing a demanding backward masking task. Our results uncovered rapid (<1 s) task-induced reductions in gamma power, often concomitant with power increase in alpha/beta bands. Importantly, these responses were found both in the DMN and sensory–motor networks. Comparing the task-negative responses across these different networks revealed similar spectral signatures and dynamics. We hypothesize that the task-negative responses may reflect a cortical switching mechanism whose role is to steer activity away from cortical networks, which are inappropriate for the task at hand.
Introduction
The study of cortical functional properties has been traditionally dominated by the search for increased (i.e., positive-going) activations of cortical neurons. Electrophysiological data has demonstrated that increased neuronal firing is reflected in increased power of the high-frequency (gamma) band of the local field potential (Nir et al., 2007). Interestingly, these increases in neuronal firing and broadband gamma power are often accompanied by a complementary reduction in power at lower-frequency (alpha and beta) bands, a phenomenon termed evoked response desyncrhonization (Mukamel et al., 2005; Crone et al., 2006; Miller et al., 2007; Fisch et al., 2009).
While the importance of such positive task-related neuronal activations in human cognitive function is well established (Lachaux et al., 2005; Fisch et al., 2009; Gaillard et al., 2009), there is a growing interest in the complementary phenomenon: task-driven reductions in neuronal activity relative to the resting state baseline. In human brain imaging, such reductions have mainly been observed using fMRI and termed negative BOLD (Shmuel et al., 2002), task-negative (Fox et al., 2005), or default-mode (Raichle et al., 2001) responses.
Such negative BOLD responses have been mainly associated with a well defined network of cortical areas termed the default mode network (DMN). However, while most reports associate task-negative responses with the DMN, a number of studies have also shown clear negative BOLD responses in task-positive areas. Perhaps the most researched example is that of negative responses in retinotopic visual areas when the visual stimulus activates neighboring representations (Saad et al., 2001; Logothetis, 2002; Shmuel et al., 2002). Studies by Shmuel et al. (2002, 2006) examined the appearance of negative BOLD response under such circumstances and, importantly, showed, in anesthetized monkeys, that it was linked to a reduction in neuronal firing rates.
However, due to the sluggish nature of the BOLD signal, fMRI is not suitable for revealing the precise temporal dynamics of task-negative responses. A more informative method may be provided by intracranial electrocorticography (ECoG) recordings. So far only a small number of ECoG studies examined task-negative responses in the human cortex, mainly focusing on the default mode network (Lachaux et al., 2008; Miller et al., 2009; Jerbi et al., 2010; Dastjerdi et al., 2011; Ossandón et al., 2011).
Here we report on a large-scale study conducted while patients were engaged in a demanding visual recognition task. Our aim was to compare task-negative responses across different cortical networks to examine whether the temporal dynamics differed between different cortical areas.
Using both clustering and conventional analysis, we demonstrate that significant task-negative responses occur over a wide cortical extent, and are a robust and common phenomenon. In particular, the task-negative responses were not confined to the DMN, but could be found well within sensory and motor cortices as well (55.8% of task-negative electrodes were located outside the DMN), where they show a similar dynamics and spectral profile to DMN sites. This is compatible with the hypothesis that task-related reductions in cortical activity are generated by a widespread cortical control mechanism, in which cortical regions are rapidly inhibited during performance of a task that is inappropriate for their functional specialization.
Materials and Methods
Data acquisition
Recording of electrical activity was obtained from 16 neurosurgical patients (11 female) monitored for potential surgical treatment of pharmacologically intractable epilepsy. Electrode placement was based strictly on clinical criteria. Each patient was implanted with a subdural electrode array containing 40–80 contact electrodes (Adtech). In total, 689 electrodes were examined. Electrodes were placed directly on the cortical surface in 1D strips or in 2D grids. Electrode diameter was 2 mm and spacing between adjacent electrodes was 8 mm. Recordings were monopolar and were referenced to an extracranial electrode. The signal was sampled at a rate of 200 Hz (Grass Technologies). Stimulus-triggered electrical pulses were recorded simultaneously with the ECoG data for precise synchronization of the stimuli with the electrical responses.
All sessions were conducted at the patient's quiet bedside after periods of at least 3 h without any identifiable seizures. The patient was sitting upright in bed. Stimuli were presented via a standard laptop screen and verbal responses recorded using a portable recording device.
Patient age was 30.7 ± 7.5 years (mean ± SD). All patients functioned in the average to low-average general cognitive range (IQ range: 80–107; mean ± SD: 92.2 ± 9.3). All patients were regular recipients of medication for treatment of epilepsy (including benzodiazepine, oxcarbazepine, topiramate, and valproic acid), although during hospitalization, doses were typically lowered.
Patients provided written informed consent to participate in the experiment. The experimental protocol was approved by the Tel Aviv Sourasky Medical Center Committee for Activities Involving Human Subjects.
Electrode localization
Computed tomography (CT) scans following electrode implantation were coregistered to the preoperative MRI using iPlan Stereotaxy software (BrainLAB) to determine location of electrodes. The resulting 3D brain image was normalized to Talairach coordinates (Talairach and Tournoux, 1988) and rendered in BrainVoyager software in 2D as a surface mesh, enabling precise localization of the electrodes both with relation to the subject's anatomical MRI scan and in standard coordinate space. For joint presentation of all subjects' electrodes alongside previous fMRI mapping performed in our lab, electrode locations were projected onto a cortical reconstruction of a specific healthy subject that is commonly used in our mapping studies. Twenty-two of the entire set of 689 electrodes were not successfully localized for technical reasons (failure to fully resolve locations in fused CT/MRI image).
Stimuli and tasks
The backward-masking (BM) paradigm has been described previously (Fisch et al., 2009). The present study included the data from the quoted study as well as data from new patients who participated in the same experiments. Images were presented on a standard laptop display with a refresh rate of 60 Hz. All images were grayscale, ∼8° (700 pixels) wide, and were superimposed with a small central red fixation dot. The experiment consisted of 3 s trials in which a target image belonging to one of three categories (faces, houses, and man-made objects) was presented for 16 ms, followed by a single-mask stimulus. Each session included 100 such trials, with a 5 s break every 20 trials. The subjects' task was to verbally report the category of the object they perceived in each trial or declare that they did not know its identity, if that was the case. The baseline was calculated from the 500 ms preceding target onset, a period of time well after the end of the verbal response to the previous target (500 ms on average). Only trials in which the correct category was named were counted as ones in which successful recognition had occurred (“visible” trials). The target and the mask were separated by a blank gray screen, the duration of which determined the stimulus onset asynchrony (SOA), the time difference between the onset of the target and the mask. The mask was shown for 250 ms. As is typical in BM experiments, the SOA affected the visibility of the target, so that in trials with an SOA of 16 ms (the shortest used) the rate of successful recognition was <50%, whereas for SOA of 200 ms the success rate was >90%. Most sessions used the critical SOA for the subject, for which the rate of successful recognition was closest to 0.5. A small proportion (16%) of easy trials with a long (200 ms) SOA and relatively clear image were interspersed within the sequence of trials in each session. Also interspersed throughout each session were “blank” trials, where a blank screen replaced the target. For further details, see Fisch et al. (2009).
Mapping of the DMN was based on a previous experiment by our group, in which subjects performed a visual categorization task at two different presentation speeds, reporting by key press whether an animal or an inanimate object had been present in the stimulus (Goldberg et al., 2006).
Data preprocessing
In the preprocessing stage, potential 50 Hz electrical interference was removed from the raw electrical signals using a linear-phase notch finite impulse response (FIR) filter. Each electrode was de-referenced by subtraction of the averaged signal of all the electrodes, thus discarding non-neuronal contributions from the extracranial reference electrode. The raw signal was then z-normalized per channel and session.
For calculation of band-limited power (BLP) (Leopold et al., 2003) modulations in a given frequency band, the signal was bandpassed in this frequency range using a linear-phase FIR filter, and the BLP modulation extracted by taking the absolute value of the Hilbert transform (Le Van Quyen et al., 2001) and applying temporal smoothing of 50 ms (custom MATLAB code; Mathworks). To offset the ∼1/f2 profile of the power spectrum, resulting in domination of wide-band BLP modulations by contribution from the bottom end of the band, we calculated a flattened form of the BLP by dividing the entire frequency range into subranges of exponentially growing width (i.e., a wider window for higher frequencies due to the drop in power), calculating and scaling the BLP individually in each subrange by its mean value in the baseline period (500 ms before target onset), and finally averaging across subranges. Gamma BLP was extracted from the range of 30–85 Hz (average subrange width = 5 Hz). Beta BLP was extracted from the range of 15–25 Hz (average subrange width = 2 Hz), in which power is known to typically decrease in response to stimuli, a phenomenon known as event-related desynchronization (ERD); hence, we use this term to describe a drop of the beta BLP from baseline levels.
Data processing was performed using MATLAB. For filtering and time-frequency decomposition, we used original and adapted EEGLAB (Delorme and Makeig, 2004) code.
Quantification of responses
Time–frequency decomposition of response.
The decomposition was based on fast Fourier transforms power spectrum (using EEGLAB) in a 160 ms sliding window with average step size of 11.76 ms over a 2 s interval, starting with the onset time of the target image (t = 0 ms). Zero padding was used to increase frequency resolution to 0.2 Hz. The time course of power modulation in each frequency band was normalized by that band's mean baseline power (defined as the mean power in the 500 ms preceding the trials). The decomposition was performed per trial and then averaged across trials, yielding the induced power spectrograms shown (see Fig. 5). For clustering and correlating between different responses (see below) this 2D (frequency by time) power value matrix was collapsed into a 1D vector.
Figure 5.

Examples of negative-cluster spectral responses by region. Examples of time-frequency spectrograms of mean response in all BM trials, shown for each region. All negative cluster electrodes, color-coded by region (logarithmic scale, color key presented on the left) are presented on unfolded cortical hemispheres. Location of example electrodes is indicated by lines pointing to the respective time-frequency spectrograms. Note the common theme of reduced gamma and increased alpha/beta power.
Responsiveness.
The electrodes were initially divided into those that responded in a significant manner to the task, regardless of band or direction of power change, and those that did not. Responsiveness was determined for each electrode individually by means of the following shuffle test, using the entire set of BM trials. First, the mean induced time–frequency response for the odd trials, in the frequency range 20–85 Hz and time range of 0–2000 ms, was correlated with that of the even trials. Then the data were rearranged by randomly selecting for each trial a new trial onset time and looking at a window of 2000 ms following this random onset. In each such iteration (n = 1000), the same odd/even trial correlation that was calculated using the original data was found for the rearranged trials. The portion of iterations in which the correlation was higher than that of the real data was taken as the final p value for that electrode. Electrodes with p ≤ 0.01 were considered responsive.
Clustering into task-negative and task-positive responses.
The responsive electrodes were further divided in two by means of two-way k-means clustering. The observation on which the clustering was performed was the induced time–frequency response matrix (collapsed to a 1D vector; see Time–frequency decomposition of response, above) of each electrode after projecting out, by linear regression, of the time–frequency decomposition of the evoked (i.e., mean) response. The interelectrode distance measure used was one minus the correlation between the two electrodes' time–frequency response matrices (frequency range: 0–85 Hz; time range: 0–1000 ms after target onset). For Figure 3, the same procedure as above was followed, but using four, six-, eight-, and 10-way k-means.
Figure 3.

Effect of changing cluster number. Average induced time–frequency responses (centroids) of clusters arising from four, six, eight, and 10-way clustering of responsive electrodes (based on similarity of time-frequency pattern; see Materials and Methods). The centroids were calculated for each cluster. Average normalized power is coded by color (see color bar in Fig. 1B). Note the division of the clusters into two groups, one with increased gamma and reduced alpha/beta power (left), and one with decreased gamma (right). Clusters are sorted according to latency of gamma increase/decrease. Within each cluster, n indicates the number of electrodes belonging to the cluster.
The centroids shown in Figures 1 and 3 are the band-normalized time–frequency responses of the electrodes in the cluster (or set; see Fig. 2), averaged after centering and normalizing each response matrix to zero mean and unit standard deviation (see above). For the two cluster analysis shown in Figure 1, the two cluster centroids were almost perfectly anticorrelated with one another in terms of their respective power levels; the one showing negative gamma activity was defined as the task-negative cluster, while electrodes in the other cluster were considered to be task-positive.
Figure 1.

Clustering into positive and negative responses to the BM task across entire cortex. A, Normal and flattened cortical map showing BOLD-activated (yellow) and inactivated (blue) cortical regions in categorization task during fMRI mapping (Goldberg et al., 2006). The map is superimposed on a cortical reconstruction of one healthy subject from a previous study. B, Average induced time–frequency responses (centroids) of clusters arising from two-way clustering of responsive electrodes (based on similarity of time–frequency pattern; see Materials and Methods). The centroids were calculated for the negative and positive clusters (shown surrounded by blue and yellow frames, respectively). Average normalized power is coded by color (see color key). Note the typical positive signature of increased gamma and reduced alpha/beta power, and its inversion in the negative cluster. C, Clustered electrode locations (blue, negative cluster; yellow, positive cluster) superimposed on map shown in A (transparent patches). Dotted lines denote borders of retinotopic visual areas V1, V2, V3, VP, V3A, and V4/V8. White arrow points to motor region electrodes. Note the overlap of negative cluster electrodes with DMN (faint blue regions), but also clear prevalence of negative cluster electrodes in visual (dotted lines) and motor areas (arrow). A, Anterior; P, posterior; LH, left hemisphere; RH, right hemisphere; PreCS, precentral sulcus; CS, central sulcus; IFS, inferior frontal sulcus; SFS, superior frontal sulcus; IPS, inferior parietal sulcus; LOS, lateral occipital sulcus; CoS, collateral sulcus; LTC, lateral temporal cortex; ITS, inferior temporal sulcus.
Figure 2.

Negative-cluster and negative-gamma responses across entire cortex. Locations of task-negative responses, revealed through clustering and significant gamma decrease, superimposed on negative BOLD map from Figure 1A (blue). Green, Electrodes that were both negative-cluster and gamma-negative; blue, negative-cluster-only electrodes; purple, gamma-negative-only electrodes. Bottom, Respective set centroids (see Materials and Methods; Fig. 1). A, Anterior; P, posterior; LH, left hemisphere; RH, right hemisphere; PreCS, precentral sulcus; CS, central sulcus; IFS, inferior frontal sulcus; SFS, superior frontal sulcus; IPS, inferior parietal sulcus; LOS, lateral occipital sulcus; CoS, collateral sulcus; LTC, lateral temporal cortex; ITS, inferior temporal sulcus.
Negative gamma response.
A more direct measure for task-negative response, based solely on gamma activity, was obtained using a random shuffle test similar to that used for the responsiveness. All BM trials were used. First, gamma BLP electrode response was t tested (one-sided) at all time points between 150 and 1500 ms following trial onset for significant decrease relative to baseline levels, yielding a t statistic for each time point. Then the data were repeatedly (n = 5000) rearranged by concatenating all the relevant trials and randomly selecting new trial onset times. In each such iteration, the same point-by-point t test that was performed on the original data was repeated using the rearranged trials. The portion of iterations in which the most extreme t statistic of all time points deviated more than in the real data were taken as the electrode's p value. We used a conservative selection criterion of p ≤ 0.001. When repeating the same procedure separately on odd and on even trials, the sensitivity of the test changed, due to the smaller number of trials, and two different cutoff p values were therefore chosen so as to select the same number of electrodes as in the full set of trials.
Regional responses.
Mean and SEM of regional electrode responses were calculated in a straightforward manner for the time–frequency spectrograms and BLPs (see Fig. 6). For each time point, mean alpha and gamma BLP responses were tested across electrodes for significant deviation from mean baseline levels (one-sample t test; left- and right-tailed, respectively; n = number of task-negative electrodes per region; as listed in Regional division of task-negative electrodes, below).
Figure 6.
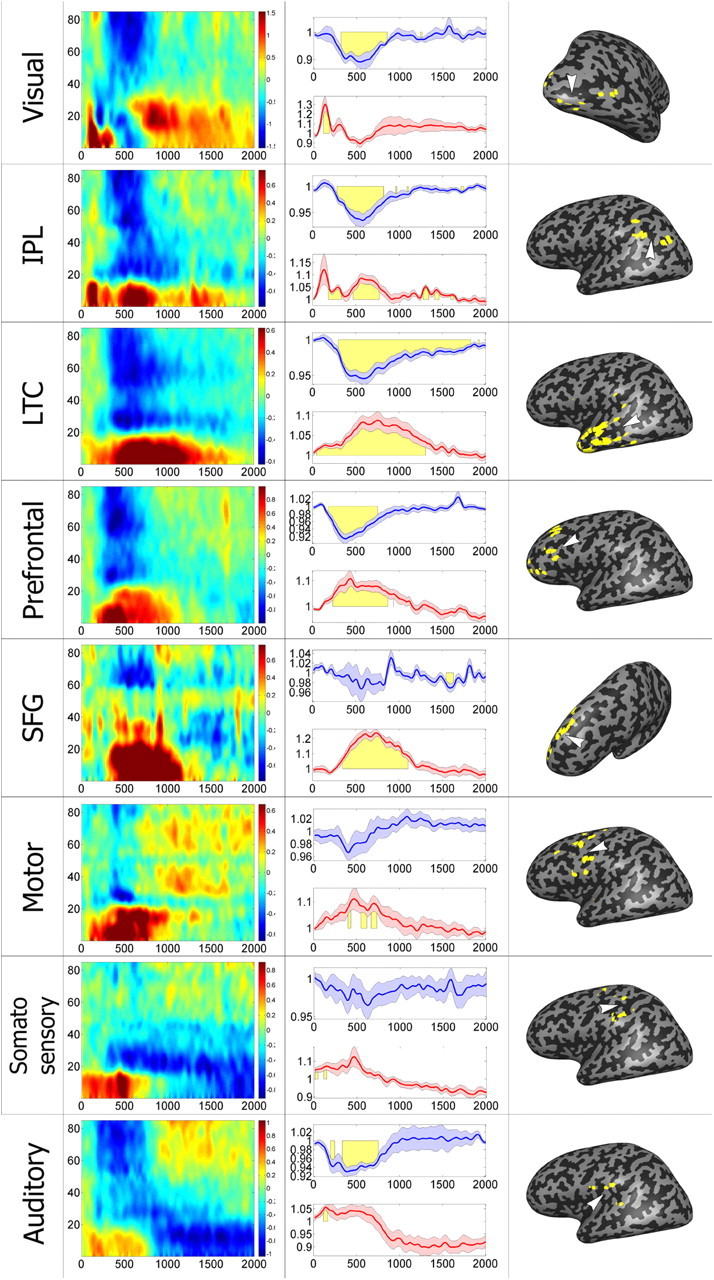
Mean negative cluster response by region. Average responses of all negative-cluster electrodes, divided by anatomical region. Left, Mean time–frequency response of all region electrodes, shown in logarithmic scale (see color key). Middle, Mean ± SEM gamma (30–85 Hz, blue) and alpha (5–15 Hz, red) BLP response across all region electrodes. Yellow denotes time points of significant deviation from baseline BLP levels (see Materials and Methods). Right, Electrode locations, as well as approximate locations of region centers, shown on inflated brain. Each row represents a different region, as defined in Figure 5.
Within the visual region, individual electrodes were tested for significant increase and decrease from baseline gamma BLP values, at all times points, by means of one-sample, one-tailed t test (alpha = 0.01). Electrodes that showed an increase followed by a decrease in gamma BLP levels were said to have a multiplexing of responses (see Results).
Anatomical partition
Regional division of task-negative electrodes.
All 154 electrodes that belonged to the negative cluster were divided into eight groups based on their estimated anatomical location. These included inferior parietal lobule (IPL; BA 39 and 40; 15 task-negative electrodes of total of 76 electrodes in this region, i.e., 19.7%), lateral temporal cortex (LTC; BA 21 and 38; 59 task-negative electrodes of 189 in this region, 31.2%), auditory (BA 41, 42; 8 task-negative electrodes of 117 in this region, 6.8%), visual (BA 18 and 37; 9 task-negative electrodes of 95 in this region, 9.5%), motor (BA 6; 12 task-negative electrodes of 72 in this region, 16.7%), prefrontal (parts of BA 8, 9, and 10; and BA 45, 46, 47; 23 task-negative electrodes of 59 in this region, 39.0%), superior frontal gyrus (SFG; parts of BA 8, 9 and 10; 14 task-negative electrodes of 20 in this region, 70.0%), and somatosensory cortex (BA 40; 7 task-negative electrodes of 39 in this region, 17.9%). See also Table 1 for further details about this partition for all responsive electrodes.
Table 1.
Electrode locations: Anatomical details of localized recording electrodes
| Region | Center of mass coordinate (Tallairach) |
Spread (STD) |
Brodmann areas included | Number of electrodes per patient per region |
|||||||||||||||||||
|---|---|---|---|---|---|---|---|---|---|---|---|---|---|---|---|---|---|---|---|---|---|---|---|
| x | y | z | x | y | z | P12 | P13 | P15 | P16 | P17 | P19 | P20 | P21 | P22 | P23 | P24 | P26 | P28 | P29 | P30 | P32 | ||
| IPL | |||||||||||||||||||||||
| LH | −45.5 | −58.4 | 26.6 | 12.8 | 8.4 | 14.6 | BA39, BA40 | 6 | 1 | 11 | 1 | 1 | 0 | 1 | 10 | 0 | 5 | 3 | 17 | 4 | 2 | 0 | 0 |
| RH | 41.7 | −59.6 | 31.3 | 15.4 | 10.5 | 15.2 | 6 | 1 | 11 | 1 | 1 | 0 | 1 | 17 | 0 | 6 | 3 | 18 | 9 | 2 | 0 | 0 | |
| LTC | |||||||||||||||||||||||
| LH | −52.3 | −12.6 | −14.6 | 10.2 | 18.7 | 11.5 | BA21, BA38 | 13 | 9 | 8 | 4 | 5 | 7 | 11 | 7 | 7 | 1 | 17 | 20 | 3 | 19 | 0 | 3 |
| RH | 54.8 | −22.1 | −14.8 | 11.1 | 18.4 | 11.2 | 17 | 9 | 8 | 17 | 5 | 7 | 26 | 11 | 10 | 1 | 17 | 22 | 12 | 24 | 0 | 3 | |
| Auditory | |||||||||||||||||||||||
| LH | −58.8 | −22.7 | 13.4 | 3.5 | 15.5 | 6.4 | BA41, BA42 | 5 | 7 | 3 | 4 | 7 | 5 | 14 | 6 | 4 | 9 | 16 | 12 | 4 | 8 | 0 | 5 |
| RH | 61.6 | −25.3 | 12.7 | 2.6 | 14.5 | 7.2 | 7 | 7 | 3 | 5 | 7 | 5 | 14 | 7 | 4 | 9 | 16 | 12 | 8 | 8 | 0 | 5 | |
| Visual | |||||||||||||||||||||||
| LH | −36.8 | −67.9 | −7.4 | 14.2 | 16.2 | 10.9 | BA18, BA37 | 7 | 0 | 7 | 0 | 12 | 0 | 5 | 12 | 2 | 11 | 7 | 10 | 3 | 14 | 0 | 0 |
| RH | 34.4 | −75.4 | −4.2 | 14.5 | 11.6 | 10.4 | 8 | 0 | 7 | 0 | 12 | 0 | 5 | 14 | 2 | 12 | 7 | 10 | 4 | 14 | 0 | 0 | |
| Motor | |||||||||||||||||||||||
| LH | −36.2 | −0.9 | 44.8 | 15.9 | 11.9 | 16.5 | BA6 | 1 | 14 | 0 | 3 | 2 | 1 | 0 | 0 | 5 | 5 | 0 | 3 | 0 | 1 | 11 | 14 |
| RH | 54.0 | 5.0 | 35.1 | 5.3 | 8.3 | 9.3 | 1 | 14 | 0 | 3 | 2 | 1 | 0 | 0 | 7 | 5 | 0 | 3 | 0 | 2 | 20 | 14 | |
| Prefrontal | |||||||||||||||||||||||
| LH | −41.6 | 33.9 | 23.0 | 7.9 | 12.0 | 13.7 | BA8–10, BA45–47 | 0 | 8 | 0 | 0 | 2 | 4 | 6 | 0 | 4 | 0 | 3 | 0 | 1 | 2 | 11 | 3 |
| RH | 46.1 | 29.8 | 12.2 | 16.2 | 11.3 | 17.9 | 0 | 8 | 0 | 1 | 2 | 4 | 7 | 0 | 4 | 0 | 3 | 0 | 4 | 2 | 18 | 6 | |
| SFG | |||||||||||||||||||||||
| LH | −12.1 | 38.8 | 47.4 | 3.4 | 14.3 | 10.1 | BA8–10 | 0 | 0 | 0 | 0 | 0 | 0 | 0 | 0 | 0 | 0 | 0 | 0 | 0 | 0 | 7 | 13 |
| RH | 13.0 | 48.8 | 37.0 | 5.2 | 16.9 | 14.6 | 0 | 0 | 0 | 0 | 0 | 0 | 0 | 0 | 0 | 0 | 0 | 0 | 0 | 0 | 7 | 13 | |
| Somato-sensory | |||||||||||||||||||||||
| LH | −42.4 | −27.9 | 48.4 | 12.3 | 9.2 | 12.7 | BA40 | 6 | 8 | 0 | 0 | 0 | 0 | 0 | 2 | 1 | 5 | 1 | 8 | 1 | 0 | 0 | 2 |
| RH | 55.2 | −32.5 | 36.8 | 4.0 | 9.5 | 7.8 | 8 | 8 | 0 | 0 | 0 | 0 | 0 | 2 | 1 | 5 | 1 | 8 | 4 | 0 | 0 | 2 | |
Electrodes are divided into eight regions, based on overlap with cortical subdivisions (see main text). Numbers refer to responsive localized electrodes only, except numbers in bold type which account for all localized electrodes.
P, Patient.
Mapping of default mode network and BOLD increase.
Electrodes were defined as belonging to the DMN on the basis of a previous fMRI experiment (Goldberg et al., 2006). We defined an electrode as being located in the DMN if at least half the Talairach voxels within a 2 mm range of its center showed a t value smaller than −1.0 in the categorization versus rest BOLD fMRI contrast map (GLM significance test) in the above-mentioned experiment (see Fig. 1). Likewise, electrodes in which at least half the voxels exceeded a t value of +1.0 were considered to lie within a BOLD-positive area.
The incidence of task-negative response (i.e., the ratio of the number of negative-cluster electrodes to that of all responsive electrodes, including positive-cluster ones) in electrodes located in the DMN was compared with that in non-DMN areas by means of a two-tailed, two-sample t test.
Results
Our study was based on 689 electrodes in 16 patients. Signals were recorded during a demanding BM experiment in which subjects were presented with a brief visual target, followed by a mask at a variable interval and SOA after image presentation. The subjects' task was to verbally report the items they recognized (for details, see Materials and Methods, above). Since the aim of the study was to search for task-negative responses throughout the entire sensory–motor trial period, we combined all trials of the experiment, regardless of SOA and verbal response, in the analysis. While admittedly averaging out the effects of differences in awareness to the target stimulus (Fisch et al., 2009) and in verbal response, as well as the more subtle ones of SOA difference, this massive signal averaging allowed high sensitivity in detecting weakly responding electrodes.
Electrodes were selected for analysis based on a shuffle test performed to determine their degree of responsiveness; only electrodes showing a significant task response (p < 0.01) were included in the analysis (see Materials and Methods, above). To identify specifically the task-negative responses, we used two complementary methods. The first of these was a data-driven time–frequency decomposition-based clustering approach. We used the mean induced ECoG response spectrograms as the observations for clustering, so that electrodes whose time-varying power spectra showed similar patterns were clustered together (for details, see Materials and Methods, above). As in previous fMRI studies (Golland et al., 2008), we divided the entire population of responsive electrodes, pooled across all patients, into two clusters.
The results of this analysis are depicted in Figure 1. As can be seen from the cluster centroid patterns, this bipartite clustering largely segregated the electrode responses into two complementary, stereotypical spectra. The first, task-positive one, containing 415 electrodes, showed, as previously reported (Crone et al., 1998, 2006; Lachaux et al., 2005; Fisch et al., 2009), the typical positive responses to visual and motor tasks (Fig. 1B). These were characterized by two main components: a rapid increase in broadband gamma power (30–85 Hz) and a corresponding reduction in alpha and beta power (∼5–25 Hz; Fig. 1B, left) or ERD. Examination of the smaller second cluster, which included 154 electrodes, revealed a spectral signature that was approximately the inverse of the positive one, showing a rapid decrease in gamma power coupled with a complementary increase in alpha and low beta (5–20 Hz; Fig. 1B, right) power.
An important question concerns the anatomical distribution of the task-negative electrodes and their relationship to the DMN as defined by BOLD fMRI. To obtain an approximate definition of the DMN boundaries, we used an fMRI dataset obtained in healthy volunteers performing a categorization task (see Materials and Methods, above; Fig. 1A). Note that this allows only an approximate, group-level comparison, since the BOLD and ECoG recordings were conducted in separate groups. The results of this analysis are depicted in a group map in Figure 1C. Regions of the DMN can be identified through their characteristic reduction in BOLD activation compared with the resting baseline (Fig. 1C, blue), and include the IPL, posterior cingulate cortex/precuneus (PCC/PCun), LTC, and SFG.
Superimposing the electrodes from both the negative and positive clusters on the BOLD map revealed that 33% of the electrodes included in the analysis were placed inside the DMN (188 of 569 electrodes), approximately proportional to the degree of cortex occupied by the DMN. Surprisingly, a substantial fraction of negative cluster electrodes (29.9%, compared with 39.9% in the positive cluster) were located within typical task-positive areas such as visual (Fig. 1C, dotted lines) and motor (Fig. 1C, white arrow) cortices.
However, the incidence of task-negative electrodes, as determined by the clustering procedure, was significantly higher in DMN areas (i.e., among electrodes that overlapped these areas) than in non-DMN areas (36.2% vs 22.6%; n1 = 68, n2 = 86; p < 0.001, two-tailed, two-sample t test; see Materials and Methods, above). Finally, it should be noted that due to the clinical constraints, the electrode coverage of a number of DMN regions (such as the PCC/PCun) was minimal or absent altogether.
The clustering approach, while having the advantage of being unbiased and fully data driven, may incorporate a minority of noisy or erratically responding electrodes. To further verify the significance of the negative responses, we conducted a second, more direct exploration for such significant responses. In this analysis, we examined, using a shuffle test, whether at any time during the trial an electrode showed a significant reduction in high gamma power (50–85 Hz) from baseline levels (see Materials and Methods, above). By focusing on changes in high gamma power, we aimed at avoiding contamination from low-frequency responses, which are typical of task-positive electrodes and which sometimes seem to leak into the gamma band (up to frequencies of ∼40 Hz). Such reduction was seen in 151 of 569 responsive electrodes (26.5%). The results of the analysis are depicted in Figure 2. There was a substantial overlap (Fig. 2, green) between the negative electrode cluster and the set of gamma-negative electrodes, as determined by the shuffle test. Note that in contrast with the specific high gamma frequency range used by the shuffle test, the clustering measure took the entire available frequency range into account.
Of interest too were the response properties of electrodes that either belonged to the negative cluster or were gamma-negative, but not both. Negative-cluster electrodes that were not part of the gamma-negative group (Fig. 2, blue) mostly showed the strong power increase in the alpha range (5–15 Hz) typical of the entire negative cluster, but no significant decrease in gamma power. Gamma-negative electrodes belonging to the positive cluster (Fig. 2, purple) showed some negative gamma activity, but lacked the alpha power increase typical of the negative cluster, showing instead a drop in alpha and beta power similar to the ERD of positive gamma responses.
This result suggested that the two-group division may be an oversimplification of the data. To address this, we extended the cluster analysis, this time dividing the data into four, six, eight, and 10 clusters; the results are shown in Figure 3. For all cluster sizes, it appears that the data could be approximately divided into positive and negative responses. Positive responses consisted of an increase in gamma power and a decrease in alpha/beta frequencies (ERD), with the difference between clusters manifested as a difference in latency and duration of the response. Negative responses, however, all shared the decrease in gamma power, and though the degree of the reduction in power sometimes changed between clusters, the latency remained fairly constant. The main difference among the negative clusters was in the properties of the lower frequencies. Thus, in the 10-cluster analysis (Fig. 3), two of five negative clusters exhibited an increase in alpha/beta power, as was seen in the two cluster analysis, while two other clusters showed a reduction in alpha/beta power.
We next visualized the locations of these clusters on the brain to check whether the clusters had a clear anatomical organization. Positive and negative clusters spanned both the DMN and task-positive areas (Fig. 4a,c). As expected from their difference in latencies, the task-positive clusters showed a general progression from early to higher-order visual areas, then motor and frontal areas (Fig. 4a,b, positive electrodes). The negative clusters failed to show similar progression, which was to be expected due to the similarities in latencies between the different clusters (Fig. 4a,b, negative electrodes). Examining the overlap of the different clusters with regards to DMN regions revealed that negative clusters tended to overlap the DMN more than positive clusters. This tendency was particularly strong for some negative clusters, while two of the positive clusters showed an overlap with DMN similar to that of the negative clusters (Fig. 4c).
Figure 4.
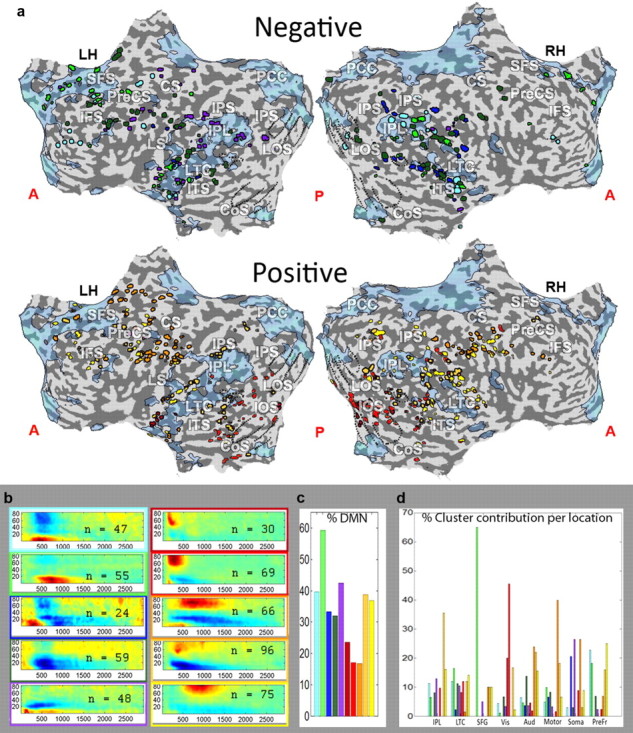
Visualization of 10-way clustering results on the cortex. a, Localization of electrodes belonging to each of the 10 clusters on a flattened cortical map. Electrodes belonging to the clusters with a gamma decrease shown on top (negative) and those belonging to clusters with a gamma increase shown on the bottom (positive) unfolded maps. Clusters are color coded as in Figure 1, with colors corresponding to the frame around the spectrogram of that cluster shown in b. b, Spectrograms of the 10 clusters shown in a, divided into positive and negative groups. c, Percentage of electrodes within each cluster that fall within the DMN. Each bar represents the percentage of DMN electrodes within that cluster. Colors same as a and b. d, A breakdown of the cluster composition of each of the eight anatomical locations according to percentage cluster contribution. Each bar represents the percent contribution of that particular cluster to the anatomically defined group. Colors as in Figure 1. PreCS, precentral sulcus; CS, central sulcus; IFS, inferior frontal sulcus; SFS, superior frontal sulcus; IPS, inferior parietal sulcus; LOS, lateral occipital sulcus; CoS, collateral sulcus; LTC, lateral temporal cortex; ITS, inferior temporal sulcus; Aud, auditory cortex; Soma, somatosensory cortex; Prefr, prefrontal cortex.
To examine further the functional organization and dynamics of the negative responses, we subdivided all 154 negative-cluster electrodes (according to the two cluster analysis) into eight groups based on overlap with cortical subdivisions (for definitions and details, see Materials and Methods, above, and Table 1). Note that the ECoG data were combined from a number of different patients and, consequently, the anatomical localization was only a rough approximation and should be treated with caution. The anatomically defined groups included IPL; LTC; SFG; and auditory, motor, prefrontal, somatosensory, and visual cortices. The first two regions, as well as part of the prefrontal group, make up a significant part of the DMN (Golland et al., 2007). Figure 5 depicts representative negative responses in each of these groups. Examining these spectrograms reveals that in all cases, there was an instance of the typical negative “signature”—i.e., reduction in gamma power and a corresponding increase in low frequencies. Importantly, we found clear instances of task-negative responses in cortical regions that are clearly outside the DMN and are part of sensory-motor cortex, such as visual areas. An examination of the 10 cluster analysis similarly showed an overlap of the negative cluster electrodes with many of these regions, although it is clear that some regions were dominated by a specific cluster or group of clusters (for instance visual and motor cortices and SFG; Fig. 4d).
To obtain an overall characterization of the groups of electrodes, ECoG signals were averaged in each of the regional groups making up the negative cluster (see Materials and Methods, above). The results are depicted in Figure 6. Similarly to the individual examples depicted in Figure 5, the averaged histograms and BLP (see Materials and Methods, above) modulation time courses revealed a common signature of the negative responses, which included negative-going changes in gamma power and positive-going changes in alpha power.
Although the clustering approach was fully data-driven, it could be argued that its outcome, as well as that of the shuffle test, was affected by noisy responses entering into the negative cluster. To avoid spurious correlations and obtain an independent estimate of signal changes, we divided the dataset into odd and even trials, and repeated both the clustering and the shuffle test procedures for finding negative electrodes using each set of trials separately. Note that any electrode that would be falsely detected as negative due to chance fluctuations in activity in its odd trials should not, in general, show the same response profile in its even trials.
Applying the analysis to the clustering procedure yielded an almost identical partition into negative and positive electrodes in all three cases; namely, odd, even, and all trials (odd and even trials both yielded a negative cluster containing exactly the same 161 electrodes, of which 149 were a subset of the original negative cluster of 154 electrodes). For the shuffle test, the overlap between the subsets of electrodes detected as being gamma-negative in the three cases was also high (of 151 gamma-negative electrodes, 134 and 129 were also detected as gamma-negative using odd trials and even trials only, respectively). We examined the responses of the electrodes detected by the shuffle test in odd (even) trials in the complementary, i.e., even (odd) set of trials, which constituted an independent dataset. Figure 7 depicts the average BLPs, in odd and even trials, of gamma-negative electrodes selected on the basis of even and odd trials, respectively, as well as the straightforward average BLP for the entire set of trials. As can be seen, the gamma BLP responses were largely unchanged. This confirms that the negative profile of responses was a genuine electrophysiological phenomenon rather than a result of random noisy fluctuations. Furthermore, this was the case in all anatomical regions rather than just DMN ones. The alpha/beta power modulations could be divided into negative and positive responses, with some areas apparently having a greater proclivity for one or the other. Importantly, negative (ERD) responses were seen in both task-positive and classic DMN regions, so this reduction in lower frequencies seems not to be limited to one network or the other.
Figure 7.
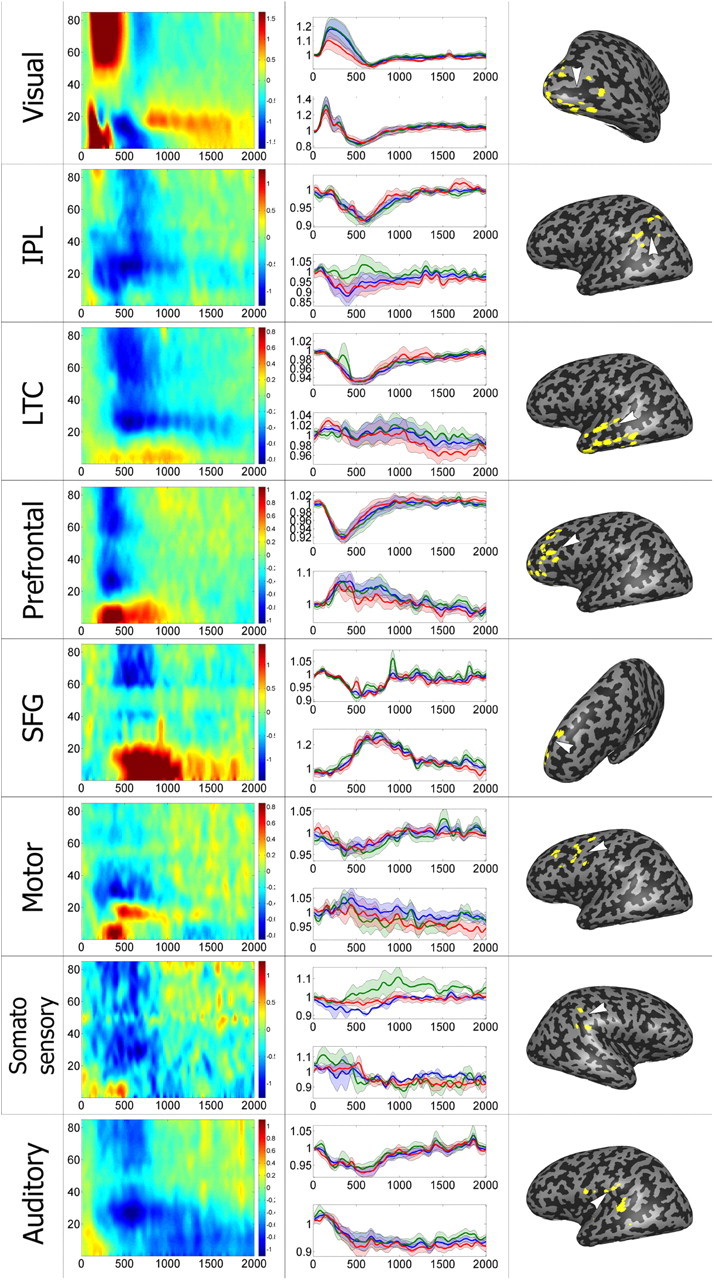
Mean negative gamma electrode response by region, with odd/even analysis. Average responses of all electrodes selected by the shuffle test, divided by anatomical region. Left, Mean time–frequency response of all region electrodes. Middle, Mean ± SEM gamma (30–85 Hz, upper graph in each panel) and alpha (5–15 Hz, lower graph) BLP response. Green (red) curve denotes average and SEM of odd (even) trial responses of electrodes detected as gamma-negative in a shuffle test using even (odd) trial responses only. Note the close similarity of these analyses conducted on independent sets of data. Blue curve depicts overall average response and SEM in electrodes detected using all trials (analogously to Fig. 6). Right, Electrode locations, as well as approximate locations of region centers, shown on inflated brain. Each row represents a different region, as defined in Figure 5.
Discussion
Widespread task-negative responses
Our results show that task-negative responses, in which neuronal activity is reduced rather than increased relative to the pretask baseline, can be readily uncovered in intracranial ECoG recordings and are widely distributed across the cortex. These responses could be detected using both a data-driven method (clustering) and direct search (shuffle test) for significant reductions in gamma power.
The clustering approach segregated ECoG electrodes into sets whose spectral responses could be categorized as positive and negative. As was reported previously (Lachaux et al., 2005; Mukamel et al., 2005; Crone et al., 2006; Fisch et al., 2009), the task-positive cluster was characterized by increased gamma (30–85 Hz) power and reduced alpha (5–15 Hz) and beta (15–25 Hz) power in the induced response. In contrast, the task-negative clusters showed more complex spectral changes: while manifesting a common reduction in gamma responses, the sign of the alpha/beta response was more variable (Figs. 3, 4).
The direct search for significant reductions in gamma power (shuffle test; see Materials and Methods, above) was intended to verify that these results were not just a by-product of the clustering method itself. The results of the two approaches overlapped in a substantial population of electrodes (the overlap made up 60.4% and 61.6% of negative cluster and gamma-negative electrodes, respectively; Fig. 2). Furthermore, applying the clustering procedure using two independent subsets of trials yielded the same partition into negative and positive clusters, whereas unbiased sampling, in which the signal was obtained from trials not included in the statistical search, again revealed a consistent pattern of task-negative responses in the shuffle analysis (Fig. 7). Furthermore, the finer-grained clustering, while revealing more complex alpha/beta power responses, upheld the basic categorization into positive and negative gamma responses. Importantly, for all negative clusters, the decrease in gamma power was similar in duration to the increase in gamma power usually seen in typical sensory task-positive responses and gamma power levels returned to baseline well before the end of the verbal response (see Materials and Methods, above; Fig. 3).
We can thus safely conclude that the task-negative profile, as observed in ECoG recordings, is a robust and consistent electrophysiological phenomenon in the human cortex. To the extent that LFP responses as measured with ECoG can be extrapolated to BOLD fMRI signals (Logothetis and Wandell, 2004; Mukamel et al., 2005), these results support the claim that negative BOLD reflects a genuine reduction in neuronal activity rather than purely hemodynamic phenomena such as “blood stealing” (Shmuel et al., 2002).
Examining the anatomical spread of the task-negative responses showed unequivocally that these responses constituted a cortex-wide phenomenon and were not confined solely to the DMN (Lachaux et al., 2008; Miller et al., 2009; Jerbi et al., 2010; Dastjerdi et al., 2011; Ossandón et al., 2011). For example, we found electrodes showing task-negative responses also in visual, auditory, somatosensory, and motor cortices—all regions typically considered to be dominated by task-positive responses in a number of single-unit recordings in animals, as well as in human patients (Bitterman et al., 2008). Visual cortex seemed to be dominated by positive gamma responses more than the other classic task-positive regions, in particular by the two early latency response clusters. Motor and somatosensory cortices exhibited far more negative gamma responses, along with areas of the prefrontal cortex that are generally also considered task-positive. However, a substantial number of task-negative responses (36.2%) indeed overlapped anatomical locations such as the IPL, LTC, and frontal cortices, which have been considered part of the DMN (Fig. 1C). SFG in particular was largely composed of electrodes from a single negative cluster, which had a small negative gamma response and a large increase in lower frequencies.
Complex responses
While we have so far emphasized the common aspects of the negative responses, there were obvious exceptions, and a substantial diversity, in individual electrodes. An example is provided by the two populations of electrodes that were found to have a negative response according to only one of the two negativity criteria, namely clustering and shuffle test (Fig. 2). The first group showed sustained increase in alpha and beta power, yet did not manifest a clear reduction in gamma power (Fig. 2, blue frame). If we consider the task-negative responses to be the rough inverse of the task-positive ones (see below), these would be the task-negative counterparts of task-positive electrodes showing reduced alpha/beta power (ERD) without a corresponding increase in gamma power, a type of response that is quite prevalent in task-positive cortical sites (Crone et al., 1998; Fisch et al., 2009). In the second group, alpha and beta power decreased, or just stayed at baseline levels, rather than increased (Fig. 2, purple frame). Dividing the data into finer clusters revealed a similar pattern, along with an even finer segmentation of the electrodes. This was particularly evident with regard to the ERD modulations, which were further divided into those with a preceding evoked response and those without (Fig. 3). However, visualizing these clusters on the brain did not provide a consistent anatomical localization of these different response profiles (Fig. 4).
Neuronal mechanisms
What could be the neuronal mechanism that underlies the spectral signature of the task-negative responses?
The potential correlation between broad-band gamma power and neuronal firing has been extensively addressed in recent research, including direct recordings from human sensory cortex (Henrie and Shapley, 2005; Mukamel et al., 2005; Nir et al., 2007; Goense and Logothetis, 2008; Manning et al., 2009).
While certainly not demonstrating a perfect correlation, these studies do converge in illustrating a robust link between broad-band gamma power and aggregate increases in firing rate within the recorded site. Of particular importance is the observation of Shmuel et al. (2006) that such coupling between gamma power and spiking activity is also evident in task-negative responses.
Assuming that gamma power indeed reflects, at least to a fair approximation, the underlying neuronal firing rate, it should be noted that the prevalence of negative gamma activations throughout the cortex, as reported here and in the above ECoG studies, provides indirect support to the claim that substantial gamma power and neuronal activity is still present during rest. Without such baseline activity, a decrease in gamma could not be manifested. This significant level of resting-state gamma activity may be related to the ultra-slow coherent fluctuations in single-unit firing and gamma activity reflected in the cortex during rest (He et al., 2008; Nir et al., 2008). However, additional research is needed to clarify this potential link.
Regarding the task-negative spectral responses, the most parsimonious explanation is that they were largely the inverse of the task-positive responses. Task-positive responses are characterized by focal increases in gamma power, superimposed on a more widely distributed reduction in alpha/beta power (ERD) (Crone et al., 1998; Fisch et al., 2009). The source of the ERD is more obscure, but its anatomical spread suggests that it is related to a more global modulatory mechanism that shifts activity between an alert and resting state of the cortical tissue. This effect may underlie, at least in visual areas, the classic Berger effect, in which alpha waves recorded with scalp EEG are suppressed during alert states (Niedermeyer and Lopes da Silva, 2005).
Thus, the gamma power reduction in the task-negative response is likely to reflect reduced neuronal firing rates in the recorded site. Similarly, the increased low-frequency power can be viewed as a release from pretask ERD, i.e., shifting from a high pretask background activity to a deeper, task-induced, idle response reflecting neuronal suppression in the task-negative cortical electrodes.
The source of the ERD seen in a subset of the task negative responses is less clear. It should be noted that, similar to the evoked responses, the ERD is driven by low frequencies, which are notoriously less localized. Thus, it is difficult to interpret the precise significance of the different alpha/beta power changes seen in the different clusters. It is possible that the ERD response reflects a long distance signal spread from remote neuronal populations having a stronger suppression response. Such spread may mask the more localized release from inhibition in the local neuronal population that contributed to the highly localized reduction in gamma power.
Thus, the overall picture suggested by the present results is of a global cortical mechanism that can modulate neuronal excitability from one extreme—the inhibitory, task-negative, suppressed state, characterized by high alpha/beta power—through the intermediate resting, baseline levels, all the way to the other extreme—the alert or task-positive excited state, characterized by suppressed alpha/beta power.
It is important to note that the relationship between the present results and previous negative BOLD responses found in the DMN should be taken with caution. In particular, the time scales are drastically different; in the present study, typical responses lasted less than a second, while a typical fMRI time scale is of several seconds. Thus, we cannot rule out the possibility that additional, slower dynamics may be revealed in the DMN using more extended sensory–motor stimulation paradigms. Optimally, a combined ECOG and fMRI methodology should be used to directly examine these issues.
To conclude, our results highlight negative responses as a robust phenomenon and the consequence of a common and widespread cortical mechanism. This modulatory mechanism is likely to play a critical role in directing information flow throughout the human cortex.
Footnotes
This study was supported by the Kimmel Award for Innovative Research and Bikura grant (to R.M.) and by the WIS-Ichilov fund (to R.M and I.F.). We thank the participants for volunteering to take part in the study, as well as D. Yossef, S. Nagar, R. Cohen, C. Yosef, G. Yehezkel, and the EEG technicians for assistance at the Tel Aviv Medical Center.
References
- Bitterman Y, Mukamel R, Malach R, Fried I, Nelken I. Ultra-fine frequency tuning revealed in single neurons of human auditory cortex. Nature. 2008;451:197–201. doi: 10.1038/nature06476. [DOI] [PMC free article] [PubMed] [Google Scholar]
- Crone NE, Miglioretti DL, Gordon B, Sieracki JM, Wilson MT, Uematsu S, Lesser RP. Functional mapping of human sensorimotor cortex with electrocorticographic spectral analysis. I. Alpha and beta event-related desynchronization. Brain. 1998;121:2271–2299. doi: 10.1093/brain/121.12.2271. [DOI] [PubMed] [Google Scholar]
- Crone NE, Sinai A, Korzeniewska A. High-frequency gamma oscillations and human brain mapping with electrocorticography. Prog Brain Res. 2006;159:275–295. doi: 10.1016/S0079-6123(06)59019-3. [DOI] [PubMed] [Google Scholar]
- Dastjerdi M, Foster BL, Nasrullah S, Rauschecker AM, Dougherty RF, Townsend JD, Chang C, Greicius MD, Menon V, Kennedy DP, Parvizi J. Differential electrophysiological response during rest, self-referential, and non-self-referential tasks in human posteromedial cortex. Proc Natl Acad Sci U S A. 2011;108:3023–3028. doi: 10.1073/pnas.1017098108. [DOI] [PMC free article] [PubMed] [Google Scholar]
- Delorme A, Makeig S. EEGLAB: an open source toolbox for analysis of single-trial EEG dynamics including independent component analysis. J Neurosci Methods. 2004;134:9–21. doi: 10.1016/j.jneumeth.2003.10.009. [DOI] [PubMed] [Google Scholar]
- Fisch L, Privman E, Ramot M, Harel M, Nir Y, Kipervasser S, Andelman F, Neufeld MY, Kramer U, Fried I, Malach R. Neural “ignition”: enhanced activation linked to perceptual awareness in human ventral stream visual cortex. Neuron. 2009;64:562–574. doi: 10.1016/j.neuron.2009.11.001. [DOI] [PMC free article] [PubMed] [Google Scholar]
- Fox MD, Snyder AZ, Vincent JL, Corbetta M, Van Essen DC, Raichle ME. The human brain is intrinsically organized into dynamic, anticorrelated functional networks. Proc Natl Acad Sci U S A. 2005;102:9673–9678. doi: 10.1073/pnas.0504136102. [DOI] [PMC free article] [PubMed] [Google Scholar]
- Gaillard R, Dehaene S, Adam C, Clémenceau S, Hasboun D, Baulac M, Cohen L, Naccache L. Converging intracranial markers of conscious access. PLoS Biol. 2009;7:e61. doi: 10.1371/journal.pbio.1000061. [DOI] [PMC free article] [PubMed] [Google Scholar]
- Goense JB, Logothetis NK. Neurophysiology of the BOLD fMRI signal in awake monkeys. Curr Biol. 2008;18:631–640. doi: 10.1016/j.cub.2008.03.054. [DOI] [PubMed] [Google Scholar]
- Goldberg II, Harel M, Malach R. When the brain loses its self: prefrontal inactivation during sensorimotor processing. Neuron. 2006;50:329–339. doi: 10.1016/j.neuron.2006.03.015. [DOI] [PubMed] [Google Scholar]
- Golland Y, Bentin S, Gelbard H, Benjamini Y, Heller R, Nir Y, Hasson U, Malach R. Extrinsic and intrinsic systems in the posterior cortex of the human brain revealed during natural sensory stimulation. Cereb Cortex. 2007;17:766–777. doi: 10.1093/cercor/bhk030. [DOI] [PubMed] [Google Scholar]
- Golland Y, Golland P, Bentin S, Malach R. Data-driven clustering reveals a fundamental subdivision of the human cortex into two global systems. Neuropsychologia. 2008;46:540–553. doi: 10.1016/j.neuropsychologia.2007.10.003. [DOI] [PMC free article] [PubMed] [Google Scholar]
- He BJ, Snyder AZ, Zempel JM, Smyth MD, Raichle ME. Electrophysiological correlates of the brain's intrinsic large-scale functional architecture. Proc Natl Acad Sci U S A. 2008;105:16039–16044. doi: 10.1073/pnas.0807010105. [DOI] [PMC free article] [PubMed] [Google Scholar]
- Henrie JA, Shapley R. LFP power spectra in V1 cortex: the graded effect of stimulus contrast. J Neurophysiol. 2005;94:479–490. doi: 10.1152/jn.00919.2004. [DOI] [PubMed] [Google Scholar]
- Jerbi K, Vidal JR, Ossandon T, Dalal SS, Jung J, Hoffmann D, Minotti L, Bertrand O, Kahane P, Lachaux JP. Exploring the electrophysiological correlates of the default-mode network with intracerebral EEG. Front Syst Neurosci. 2010;4:27. doi: 10.3389/fnsys.2010.00027. [DOI] [PMC free article] [PubMed] [Google Scholar]
- Lachaux JP, George N, Tallon-Baudry C, Martinerie J, Hugueville L, Minotti L, Kahane P, Renault B. The many faces of the gamma band response to complex visual stimuli. Neuroimage. 2005;25:491–501. doi: 10.1016/j.neuroimage.2004.11.052. [DOI] [PubMed] [Google Scholar]
- Lachaux JP, Jung J, Mainy N, Dreher JC, Bertrand O, Baciu M, Minotti L, Hoffmann D, Kahane P. Silence is golden: transient neural deactivation in the prefrontal cortex during attentive reading. Cereb Cortex. 2008;18:443–450. doi: 10.1093/cercor/bhm085. [DOI] [PubMed] [Google Scholar]
- Leopold DA, Murayama Y, Logothetis NK. Very slow activity fluctuations in monkey visual cortex: implications for functional brain imaging. Cereb Cortex. 2003;13:422–433. doi: 10.1093/cercor/13.4.422. [DOI] [PubMed] [Google Scholar]
- Le Van Quyen M, Foucher J, Lachaux J, Rodriguez E, Lutz A, Martinerie J, Varela FJ. Comparison of Hilbert transform and wavelet methods for the analysis of neuronal synchrony. J Neurosci Methods. 2001;111:83–98. doi: 10.1016/s0165-0270(01)00372-7. [DOI] [PubMed] [Google Scholar]
- Logothetis NK. The neural basis of the blood-oxygen-level-dependent functional magnetic resonance imaging signal. Philos Trans R Soc Lond B Biol Sci. 2002;357:1003–1037. doi: 10.1098/rstb.2002.1114. [DOI] [PMC free article] [PubMed] [Google Scholar]
- Logothetis NK, Wandell BA. Interpreting the BOLD signal. Annu Rev Physiol. 2004;66:735–769. doi: 10.1146/annurev.physiol.66.082602.092845. [DOI] [PubMed] [Google Scholar]
- Manning JR, Jacobs J, Fried I, Kahana MJ. Broadband shifts in local field potential power spectra are correlated with single-neuron spiking in humans. J Neurosci. 2009;29:13613–13620. doi: 10.1523/JNEUROSCI.2041-09.2009. [DOI] [PMC free article] [PubMed] [Google Scholar]
- Miller KJ, Leuthardt EC, Schalk G, Rao RP, Anderson NR, Moran DW, Miller JW, Ojemann JG. Spectral changes in cortical surface potentials during motor movement. J Neurosci. 2007;27:2424–2432. doi: 10.1523/JNEUROSCI.3886-06.2007. [DOI] [PMC free article] [PubMed] [Google Scholar]
- Miller KJ, Weaver KE, Ojemann JG. Direct electrophysiological measurement of human default network areas. Proc Natl Acad Sci U S A. 2009;106:12174–12177. doi: 10.1073/pnas.0902071106. [DOI] [PMC free article] [PubMed] [Google Scholar]
- Mukamel R, Gelbard H, Arieli A, Hasson U, Fried I, Malach R. Coupling between neuronal firing, field potentials, and FMRI in human auditory cortex. Science. 2005;309:951–954. doi: 10.1126/science.1110913. [DOI] [PubMed] [Google Scholar]
- Niedermeyer E, Lopes da Silva FH. Electroencephalography: basic principles, clinical applications, and related fields. 5th edition. Philadelphia: Lippincott Williams and Wilkins; 2005. [Google Scholar]
- Nir Y, Fisch L, Mukamel R, Gelbard-Sagiv H, Arieli A, Fried I, Malach R. Coupling between neuronal firing rate, gamma LFP, and BOLD fMRI is related to interneuronal correlations. Curr Biol. 2007;17:1275–1285. doi: 10.1016/j.cub.2007.06.066. [DOI] [PubMed] [Google Scholar]
- Nir Y, Mukamel R, Dinstein I, Privman E, Harel M, Fisch L, Gelbard-Sagiv H, Kipervasser S, Andelman F, Neufeld MY, Kramer U, Arieli A, Fried I, Malach R. Interhemispheric correlations of slow spontaneous neuronal fluctuations revealed in human sensory cortex. Nat Neurosci. 2008;11:1100–1108. doi: 10.1038/nn.2177. [DOI] [PMC free article] [PubMed] [Google Scholar]
- Ossandón T, Jerbi K, Vidal JR, Bayle DJ, Henaff MA, Jung J, Minotti L, Bertrand O, Kahane P, Lachaux JP. Transient suppression of broadband gamma power in the default-mode network is correlated with task complexity and subject performance. J Neurosci. 2011;31:14521–14530. doi: 10.1523/JNEUROSCI.2483-11.2011. [DOI] [PMC free article] [PubMed] [Google Scholar]
- Raichle ME, MacLeod AM, Snyder AZ, Powers WJ, Gusnard DA, Shulman GL. A default mode of brain function. Proc Natl Acad Sci U S A. 2001;98:676–682. doi: 10.1073/pnas.98.2.676. [DOI] [PMC free article] [PubMed] [Google Scholar]
- Saad ZS, Ropella KM, Cox RW, DeYoe EA. Analysis and use of FMRI response delays. Hum Brain Mapp. 2001;13:74–93. doi: 10.1002/hbm.1026. [DOI] [PMC free article] [PubMed] [Google Scholar]
- Shmuel A, Yacoub E, Pfeuffer J, Van de Moortele PF, Adriany G, Hu X, Ugurbil K. Sustained negative BOLD, blood flow and oxygen consumption response and its coupling to the positive response in the human brain. Neuron. 2002;36:1195–1210. doi: 10.1016/s0896-6273(02)01061-9. [DOI] [PubMed] [Google Scholar]
- Shmuel A, Augath M, Oeltermann A, Logothetis NK. Negative functional MRI response correlates with decreases in neuronal activity in monkey visual area V1. Nat Neurosci. 2006;9:569–577. doi: 10.1038/nn1675. [DOI] [PubMed] [Google Scholar]
- Talairach J, Tournoux P. Co-planar stereotaxic atlas of the human brain. New York: Thieme Medical Publishers; 1988. [Google Scholar]