Abstract
Although the amyloid-β1–42 (Aβ1–42) peptide involved in Alzheimer's disease is known to cause a dysregulation of intracellular Ca2+ homeostasis, its molecular mechanisms still remain unclear. We report that the extracellular-dependent early increase (30 min) in intracellular calcium concentration ([Ca2+]i), following Aβ1–42 exposure, caused the activation of calpain that in turn elicited a cleavage of the Na+/Ca2+ exchanger isoform NCX3. This cleavage generated a hyperfunctional form of the antiporter and increased NCX currents (INCX) in the reverse mode of operation. Interestingly, this NCX3 calpain-dependent cleavage was essential for the Aβ1–42-dependent INCX increase. Indeed, the calpain inhibitor calpeptin and the removal of the calpain-cleavage recognition sequence, via site-directed mutagenesis, abolished this effect. Moreover, the enhanced NCX3 activity was paralleled by an increased Ca2+ content in the endoplasmic reticulum (ER) stores. Remarkably, the silencing in PC-12 cells or the knocking-out in mice of the ncx3 gene prevented the enhancement of both INCX and Ca2+ content in ER stores, suggesting that NCX3 was involved in the increase of ER Ca2+ content stimulated by Aβ1–42. By contrast, in the late phase (72 h), when the NCX3 proteolytic cleavage abruptly ceased, the occurrence of a parallel reduction in ER Ca2+ content triggered ER stress, as revealed by caspase-12 activation. Concomitantly, the late increase in [Ca2+]i coincided with neuronal death. Interestingly, NCX3 silencing caused an earlier activation of Aβ1–42-induced caspase-12. Indeed, in NCX3-silenced neurons, Aβ1–42 exposure hastened caspase-dependent apoptosis, thus reinforcing neuronal cell death. These results suggest that Aβ1–42, through Ca2+-dependent calpain activation, generates a hyperfunctional form of NCX3 that, by increasing Ca2+ content into ER, delays caspase-12 activation and thus neuronal death.
Introduction
Alzheimer's disease (AD), the most common form of dementia, is characterized by abnormal amyloid-β protein (Aβ) metabolism. Aβ accumulation in the brain and synaptic synapse loss are AD pathological hallmarks. A large bulk of studies has shown that Aβ neurotoxicity is closely related to an alteration of intracellular calcium concentration ([Ca2+]i) homeostasis. These changes in [Ca2+]i homeostasis, as a result of Aβ cytotoxicity, may induce an exaggerated endoplasmic reticulum (ER) Ca2+ release with the consequent unfolded protein accumulation and the activation of the ER stress-induced apoptosis pathway (Paschen, 2003; Chakroborty et al., 2009). These transductional events may occur through calpain-mediated caspase-12 activation, a specific ER stress marker, and can also lead to caspase-3 activation (Morishima et al., 2002). Interestingly, ER stress and sustained changes in [Ca2+]i signaling occur before cognitive decline in AD (Bezprozvanny and Mattson, 2008).
The Na+/Ca2+ exchanger (NCX), a family of neuronal plasma-membrane proteins composed of three different isoforms, NCX1, NCX2, and NCX3 (Nicoll et al., 1990; Li et al., 1994; Nicoll et al., 1996; Annunziato et al., 2004), couples, in a bidirectional manner, the exchange of 3 Na+ for 1 Ca2+, thereby playing a relevant role in maintaining intracellular free Ca2+ homeostasis (Blaustein and Lederer, 1999). In particular, it has recently been demonstrated that the NCX1 isoform displays a functional relationship with Ca2+ refilling into ER (Sirabella et al., 2009). More specifically, NCX1 upregulation elicited by oxygen and glucose deprivation (OGD) is involved in Ca2+ refilling into ER, thus exerting a neuroprotective role (Sirabella et al., 2009).
Furthermore, the NCX3 isoform, which is selectively expressed in the brain and skeletal muscle (Papa et al., 2003), plays a fundamental role in buffering intracellular Ca2+ and Na+ overload occurring under physiological and pathophysiological conditions (Condrescu et al., 1995; Linck et al., 1998; Secondo et al., 2007). Indeed, neurons silenced with siRNA-NCX3 or derived from ncx3−/− mice display a remarkable vulnerability in both in vivo and in vitro hypoxic conditions (Pignataro et al., 2004; Molinaro et al., 2008). These findings suggest that NCX-induced buffering of Ca2+ overload during exposure of neurons to hypoxic conditions may exert a neuroprotective function by facilitating ER Ca2+ refilling.
Interestingly, it has been reported that during brain ischemia and excitotoxicity, NCX3 may be cleaved by the Ca2+-activated protease calpain in the Ca2+ regulatory domain (Bano et al., 2005), thus suggesting a close relationship between calpain and NCX activity. In AD, both calpain activation (Vosler et al., 2008) and changes in NCX expression and activity have been described. Indeed, in the synaptic terminals obtained from the brain cortex of AD patients, NCX activity is increased (Colvin et al., 1994), NCX2 protein expression is upregulated (Sokolow et al., 2011), NCX3 native 105 kDa band is downregulated (Sokolow et al., 2011), and NCX1, NCX2, and NCX3 colocalize with Aβ in synaptic terminals (Sokolow et al., 2011).
Owing to this evidence, by means of patch-clamp, Fura-2 acetoxymethyl-ester (Fura-2AM) microfluorometry, Western blot, chimera strategies, site-directed mutagenesis, and deletion mutagenesis, we characterized the effects of Aβ1–42 on NCX expression and activity, the molecular mechanisms underlying the Aβ1–42-mediated effects on the NCX isoforms, the molecular determinants responsible for the effects of Aβ1–42 on NCX, and the role of NCX isoforms in Ca2+ refilling into ER, caspase-12 activation, and neuronal death.
Materials and Methods
NCX3 knock-out mice.
All experiments on ncx3−/− mice, already described (Molinaro et al., 2008, 2011), were performed according to the international guidelines for animal research and approved by the Animal Care Committee of “Federico II” University of Naples, Italy.
Materials.
Aβ1–42, as well as all other unmentioned materials, was from Sigma-Aldrich. Nerve growth factor (NGF) and tetrodotoxin (TTX) were from Alomone Labs. Protease inhibitor mixture II was purchased from Calbiochem. RPMI1640, horse serum, fetal bovine serum, Dulbecco's modified Eagle's medium, nutrient mixture F-12, l-glutamine, fetal calf serum, Earle's balanced salt solution, and phosphate-buffed saline (PBS) were from Gibco-BRL. Fura-2AM and SBFI-AM were from Invitrogen.
Cell cultures.
Baby hamster kidney (BHK) cells stably transfected with canine cardiac NCX1 or rat brain NCX3 were grown on plastic dishes in a mix of DMEM and Ham's F12 medium (1:1) supplemented with 5% fetal bovine serum, 100 U/ml penicillin, and 100 μg/ml streptomycin (Linck et al., 1998). Rat pheochromocytoma (PC-12) cells were grown and differentiated as previously described (Greene and Tischler, 1976; Pannaccione et al., 2005). Hippocampal neurons were obtained from the brains of embryonic day 18 ncx3+/+ and ncx3−/− mouse embryos of either sex, as previously described (Scorziello et al., 2001). Neurons were used after 8 DIV.
Aβ treatments.
Synthetic Aβ1–42 was dissolved in PBS to obtain a 1 mm stock solution, incubated for 48 h at 37°C to pre-aggregate the peptide and was stored at −20°C (Lorenzo and Yankner, 1994). Aβ1–42 was added to the culture medium at the final concentration of 5 μm, and the cells were incubated in the presence of the pre-aggregated peptide for 24 h. In dose–response experiments, Aβ1–42 was added at final concentrations ranging from 0.01 to 10 μm. Before all experiments, we tested a pre-aggregated preparation of the Aβ1–42. SDS-PAGE was performed using monoclonal antibody 6E10, which recognizes an epitope within residues 1–17 of human Aβ (Millipore Bioscience Research Reagents). Results showed that the oligomers between 18 and 32 kDa were the major species of Aβ1–42 peptide in the preparation (data not shown).
RNA silencing.
The mammalian expression vector pSUPER.retro.puro (OligoEngine) was used to express siRNA against NCX1 and NCX3 and their mismatch sequences in PC-12 cells. These vectors were prepared as previously reported (Secondo et al., 2007). After 15 h plating, PC-12 cells were transfected with pSUPER-NCX1, pSUPER-NCX3, pSUPER-mismatch sequences by Lipofectamine 2000 (Invitrogen) standard protocol.
Generation and stable expression of wild-type, mutant, and chimeric NCX.
Dog heart NCX1.1 and rat brain NCX3.3 cDNAs, generous gifts of Dr. Kenneth D. Philipson (David Geffen School of Medicine, University of California, Los Angeles, Los Angeles, CA), were cloned into pcDNA3.1 expression vector, whereas NCX3/NCX1 chimeras were a generous gift from Dr. Takahiro Iwamoto (Fukuoka University, Fukuoka, Japan). NCX3 mutants were generated with QuikChange site-directed mutagenesis kit (Stratagene) by removing the amino acid region 292–708 from NCX3WT (NCX3Δf) or by replacing the amino acids lysin370 and lysin371 with tryptophan370 and tryptophan371 (NCX3KK370WW). All mutants were verified by whole sequencing on both DNA strands (Primm).
All cDNAs were transfected in the BHK cell line by Lipofectamine 2000 following the manufacturer's instructions. Stable cell lines were selected by G418 resistance and by a Ca2+-killing procedure (Iwamoto et al., 1998).
Electrophysiology.
NCX currents (INCX) in hippocampal mouse neurons, NGF-differentiated PC-12, and BHK cells were recorded by the patch-clamp technique in whole-cell configuration using the commercially available amplifier Axopatch200B and Digidata1322A interface (Molecular Devices), as previously described by Secondo (2009) and Molinaro (2008). INCX were recorded starting from a holding potential of −60 mV up to a short-step depolarization at +60 mV (60 ms). A descending voltage ramp from +60 mV to −120 mV was applied. INCX recorded in the descending portion of the ramp (from +60 mV to −120 mV) were used to plot the current–voltage (I–V) relation curve. The INCX magnitude was measured at the end of +60 mV (reverse mode) and at the end of −120 mV (forward mode), respectively. The Ni2+-insensitive component was subtracted from total currents to isolate INCX. The neurons were perfused with external Ringer's solution containing the following (in mm): 126 NaCl, 1.2 NaHPO4, 2.4 KCl, 2.4 CaCl2, 1.2 MgCl2, 10 glucose, and 18 NaHCO3, pH 7.4. Twenty millimolar tetraethylammonium (TEA), 50 nm TTX, and 10 μm nimodipine were added to Ringer's solution to abolish potassium, sodium, and calcium currents. The dialyzing pipette solution contained the following (in mm): 100 K-gluconate, 10 TEA, 20 NaCl, 1 Mg-ATP, 0.1 CaCl2, 2 MgCl2, 0.75 EGTA, and 10 HEPES, adjusted to pH 7.2 with Cs(OH)2. Possible changes in cell size occurring after specific treatments were calculated by monitoring the capacitance of each cell membrane, which is directly related to the membrane surface area, and by expressing the current amplitude data as current densities (pA/pF). Capacitive currents were estimated from the decay of the capacitive transient induced by 5 mV depolarizing pulses from a holding potential of −80 mV and acquired at a sampling rate of 50 kHz. The capacitance of the membrane was calculated according to the following equation: Cm = τc · Io/ΔEm(1 − I∞/Io), where Cm is membrane capacitance, τc is the time constant of the membrane capacitance, Io is the maximum capacitance current value, ΔEm is the amplitude of the voltage step, and I∞ is the amplitude of the steady state current.
[Ca2+]i and [Na+]i measurement.
[Ca2+]i was measured by single-cell computer-assisted video-imaging in hippocampal mouse neurons, NGF-differentiated PC-12, and BHK cells loaded with 10 μm Fura-2AM (Calbiochem) for 30 min at 37°C (Grynkiewicz et al., 1985; Secondo et al., 2007).
At the end of the Fura-2AM loading period, the coverslips were placed in a perfusion chamber (Medical System) mounted onto an Axiovert200 microscope (Carl Zeiss) equipped with a FLUAR 40× oil objective lens. The experiments were carried out with a digital imaging system composed of a MicroMax 512BFT cooled CCD camera (Princeton Instruments), LAMBDA10–2 filter wheeler (Sutter Instruments), and Meta-Morph/MetaFluor Imaging System software (Universal Imaging). After loading, cells were alternatively illuminated at wavelengths of 340 and 380 nm by a Xenon lamp. The emitted light was passed through a 512 nm barrier filter. Fura-2AM fluorescence intensity was measured every 3 s. Ratiometric values were automatically converted by the software to [Ca2+]i using a preloaded calibration curve obtained in preliminary experiments (Grynkiewicz et al., 1985). NCX activity was evaluated as Ca2+ uptake through the reverse mode by switching the normal Krebs medium to Na+-deficient N-methyl glucamine (NMDG+) medium (Na+-free) as follows (in mm): 5.5 KCl, 147 NMDG, 1.2 MgCl2, 1.5 CaCl2, 10 glucose, and 10 HEPES, pH 7.4. The irreversible and selective inhibitor of the sarco(endo)plasmic reticulum Ca2+ ATPase (SERCA) thapsigargin (Tg; 1 μm) was added to the medium 10 min before the beginning of the recordings, as previously described (Secondo et al., 2007). NCX activity was calculated as Δ% of peak/basal [Ca2+]i values after the perfusion with Na+-free medium. [Na+]i measurement was performed by SBFI-AM incubated at 10 mM in the presence of pluronic acid (0.02%) for 1 h at 37°C.
Assessment of neuronal death.
Cell death, detected by double staining with fluorescein diacetate (FDA) (36 μmol/L) and propidium iodide (PI) (7 μmol/L), was measured by calculating the ratio between dead and living cells, as previously described (Secondo et al., 2007).
Nuclear morphology was evaluated by using the fluorescent DNA-binding dye Hoechst 33258 already described (Pannaccione et al., 2005).
Western blot analysis.
Cells were washed in PBS and collected by gentle scraping in ice-cold RIPA buffer to detect proteins. Nitrocellulose membranes were incubated with rabbit-polyclonal antibody anti-NCX3 (1:3000; kindly provided by K. Philipson), or mouse monoclonal anti-NCX1 (1:500; Swant), or mouse monoclonal anti-tubulin (1:1000), or rabbit polyclonal antibodies anti-caspase-12 (1:1000) and goat polyclonal anti-calpain (1:500) (Santa Cruz Biotechnology). Calpain activation was assessed by immunoblot analysis using a primary antibody that recognizes the calpain large subunit domain, which is autolyzed in active calpain from the full length calpain at 130 kDa, as already reported (Goll et al., 2003; Scalia et al., 2011; Selimovic et al., 2011).
Statistical analysis.
Statistical analyses were performed with ANOVA followed by Newman–Keuls test or Student's t test. Differences were considered statistically significant at p < 0.05.
Results
Effect of Aβ1–42 on NCX activity in hippocampal neurons and NGF-differentiated PC-12 cells
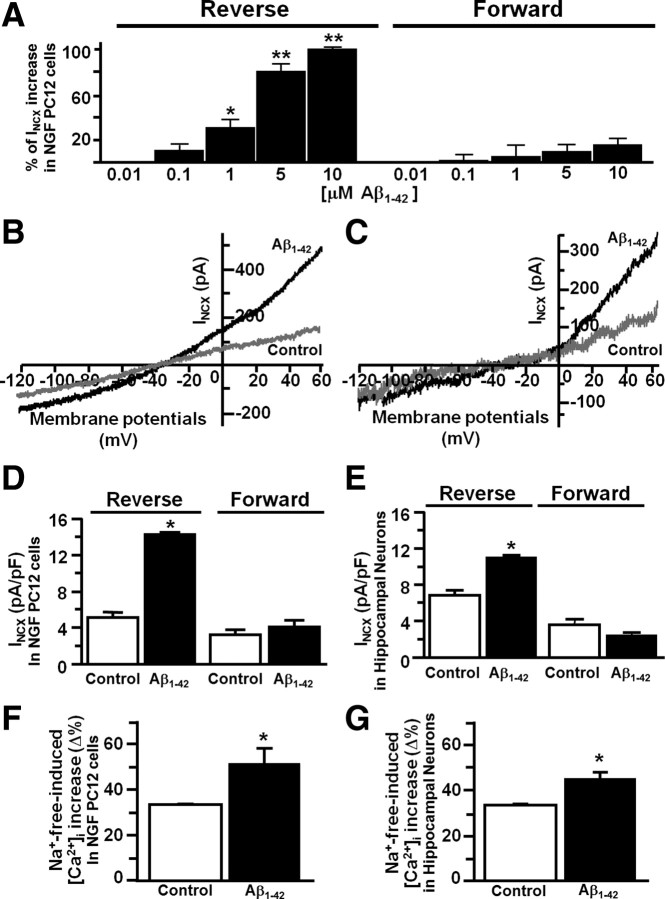
After Aβ1–42 exposure, INCX were assessed in the reverse and forward modes of operation by patch-clamp in whole-cell configuration in both hippocampal and NGF-differentiated PC-12 cells. Aβ1–42 induced a significant concentration-dependent increase only in INCX operating in the reverse mode, whereas it was ineffective on currents operating on the forward mode (Fig. 1A–E). Consistently, as revealed by Fura-2AM microfluorometry, Na+-dependent NCX activity was significantly increased in the reverse mode of operation in hippocampal neurons and in NGF-differentiated PC-12 cells treated with 5 μm Aβ1–42 for 24 h (Fig. 1F,G).
Figure 1.
Effect of Aβ1–42 on NCX activity in hippocampal neurons and NGF-differentiated PC-12 cells. A, Quantification of Aβ1–42 concentration-dependent (0.01–10 μm) effect on INCX in the reverse and forward modes of operation. Values are expressed as percentage mean ± SEM of 3 independent experimental sessions (n = 12 for each group). B, C, Representative INCX superimposed traces recorded under control conditions (gray trace) and after 24 h of 5 μm Aβ1–42 (black trace) in NGF-differentiated PC12 cells (B) and in primary hippocampal neurons (C). D, E, Quantification of INCX represented in B and C, respectively. Values are expressed as mean ± SEM of current densities of 3 independent experimental sessions (n = 16 for each group). F, G, Quantification of NCX activity in the reverse mode of operation elicited by Na+-free perfusion under control conditions and after exposure to Aβ1–42 (5 μm, 24 h) recorded in NGF-differentiated PC12 cells (F) and hippocampal neurons (G). Values are expressed as percentage mean ± SEM of 3 independent experimental sessions (n = 60 for each group). *p < 0.05 versus control group; **p < 0.05 versus control and the previous lower concentration of Aβ1–42.
Effect of NCX3 silencing or knocking-out on Aβ1–42-induced upregulation of INCX
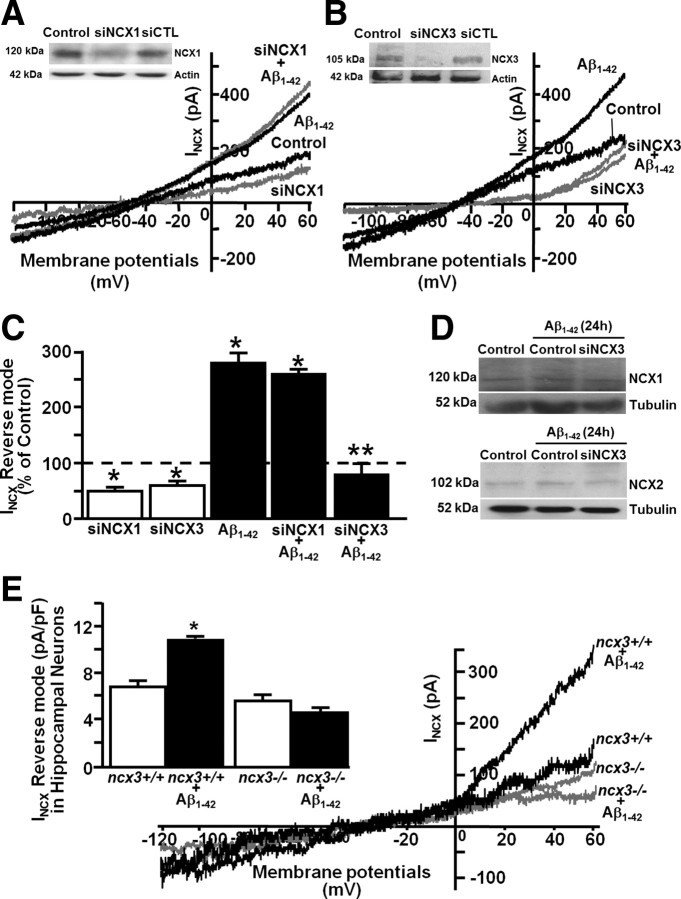
Patch-clamp experiments revealed that the silencing of NCX3, but not of NCX1, prevented the Aβ1–42-induced upregulation of INCX in the reverse mode of operation in NGF-differentiated PC-12 cells (Fig. 2A–C). Under these experimental conditions, no compensatory upregulation of NCX1 and NCX2 occurred (Fig. 2D). Interestingly, Aβ1–42 treatment failed to increase INCX in hippocampal neurons obtained from ncx3−/− mice (Fig. 2E).
Figure 2.
Effect of NCX3 silencing or knocking-out on Aβ1–42-induced upregulation of INCX in NGF-differentiated PC-12 cells and hippocampal neurons. A, Representative Western blot of NCX1 silencing (top) and superimposed representative traces of INCX recorded from control, control plus siNCX1, after 5 μm Aβ1–42 for 24 h and after 5 μm Aβ1–42 for 24 h plus siNCX1 in NGF-differentiated PC12 cells. B, Representative Western blot of siNCX3 on protein expression (top) and superimposed representative traces of INCX recorded from control, control plus siNCX3, after 5 μm Aβ1–42 for 24 h, and after 5 μm Aβ1–42 for 24 h plus siNCX3 in NGF-differentiated PC12 cells. C, Quantification of INCX represented in A and B. Values are expressed as percentage mean ± SEM of 3 independent experimental sessions (n = 15 for each group). D, Representative Western blot of NCX1 and NCX2 protein expression in NGF-differentiated PC12 cells under control conditions and after 24 h of 5 μm Aβ1–42 in the presence and in absence of siNCX3. E, Representative INCX superimposed traces recorded from ncx3+/+ and ncx3−/− primary hippocampal neurons under control conditions and after 24 h of 5 μm Aβ1–42 exposure. Inset depicts the quantification of INCX under the conditions previously reported. Values are expressed as mean ± SEM of 3 independent experimental sessions (n = 16 for each group). *p < 0.05 versus control group; **p < 0.05 versus Aβ1–42.
Effect of Aβ1–42 on calpain activation and on the generation of NCX3 proteolytic fragment
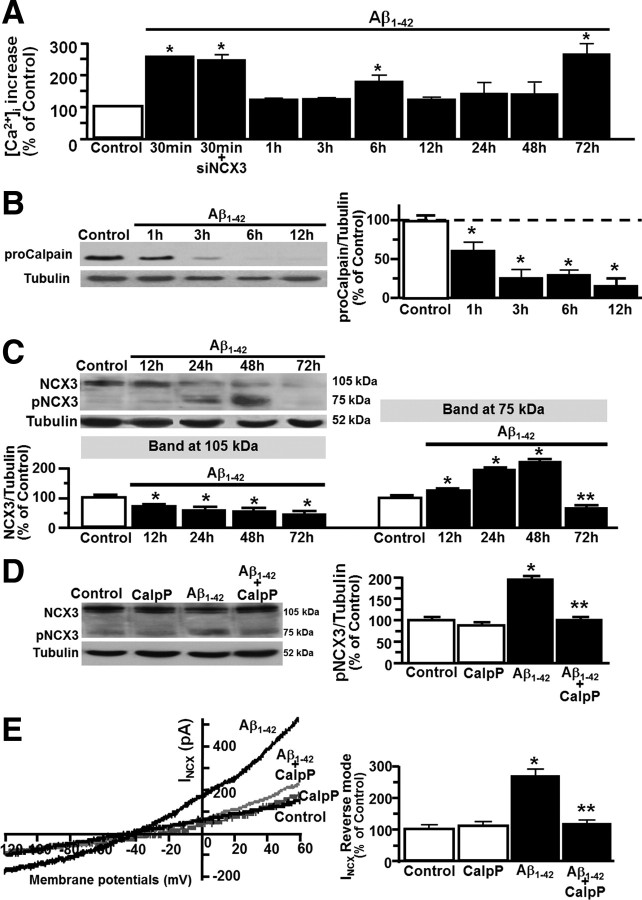
In NGF-differentiated PC-12 cells, the exposure to 5 μm Aβ1–42 caused: (a) an early increase in [Ca2+]i at 30 min, that was unaffected by NCX3 silencing (Fig. 3A) and prevented by extracellular Ca2+ removal (Pannaccione et al., 2005), (b) a second peak at 6 h, and (c) a late peak at 72 h that was coincident with the neuronal death (see Fig. 6). At the other time points examined, the [Ca2+]i returned to basal levels (Fig. 3A). Interestingly, the Aβ1–42-induced early increase in [Ca2+]i triggered the activation of calpain, which occurred at 1 h and lasted up to 12 h (Fig. 3B). Immunoblot analysis revealed that after calpain activation, the NCX3 native band, detected at ∼105 kDa, decreased at 12, 24, 48, and 72 h, whereas the proteolytic band, migrating at ∼75 kDa, increased progressively from 12 to 48 h (Fig. 3C). Thereafter, at 72 h, the proteolytic band abruptly dropped (Fig. 3C). Interestingly, the selective calpain inhibitor calpeptin (100 nm) (Lee et al., 2000) completely prevented both the Aβ1–42-induced generation of the ∼75 kDa proteolytic fragment (Fig. 3D) and the increase in INCX in the reverse mode of operation (Fig. 3E).
Figure 3.
Effect of Aβ1–42 on calpain activation and on the formation of NCX3 proteolytic fragment in NGF-differentiated PC-12 cells. A, Quantification of the time-dependent effect of Aβ1–42 on [Ca2+]i. Values are expressed as percentage mean ± SEM of 3 independent experimental sessions (n = 60 for each group). B, Representative Western blot and densitometric quantification of calpain activation under control conditions, after 1, 3, 6, and 12 h of 5 μm Aβ1–42 exposure. Values are expressed as percentage mean ± SEM of 3 independent experimental sections. C, Representative Western blot and densitometric quantification of NCX3 protein expression and its proteolytic fragment under control conditions, after 12, 24, 48, and 72 h of 5 μm Aβ1–42. Values are expressed as percentage mean ± SEM of 3 independent experimental sections. *p < 0.05 versus control group; **p < 0.05 versus Aβ1–42 12, 24, and 48 h (A–C). D, Representative Western blot and densitometric quantification of the proteolytic fragment of NCX3 in the presence and in the absence of calpeptin (CalpP, 100 nm) under control conditions and after 24 h of Aβ1–42 exposure. Values are expressed as percentage mean ± SEM of 3 independent experimental sections. E, Representative superimposed traces of INCX and quantification in the presence and in absence of CalpP under control conditions and after 24 h of Aβ1–42. Values are expressed as percentage mean ± SEM of 3 independent experimental sessions (n = 20 for each group). *p < 0.05 versus control; **p < 0.05 versus Aβ1–42 (D, E).
Figure 6.
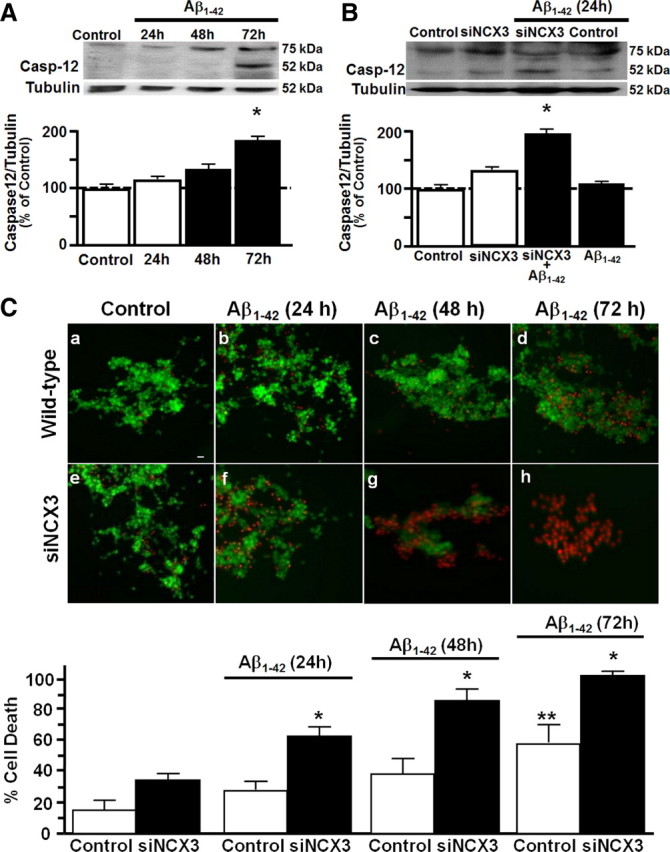
Effect of NCX3 silencing on caspase-12 activation and neuronal death, induced by Aβ1–42 in NGF-differentiated PC-12 cells. A, Representative Western blot and densitometric quantification of the time-dependent effect of 5 μm Aβ1–42 on caspase-12 activation. B, Representative Western blot and densitometric quantification of caspase-12 activation under control conditions and after 24 h of Aβ1–42 in the presence or in the absence of siNCX3. Values are expressed as mean ± SEM of 3 independent experimental sessions (n = 5). C, Cell death measured in representative fluorescent images acquired under control conditions and after 24, 48, and 72 h of Aβ1–42 in the presence (e–h) or in the absence of siNCX3 (a–d) and reported as a percentage of the ratio of the number of PI-positive cells/PI + FDA-stained-positive cells. Scale bar, 20 μm. *p < 0.05 versus respective control group; **p < 0.05 versus untreated control.
Effect of NCX3 silencing or knocking-out on Ca2+ refilling into ER induced by Aβ1–42
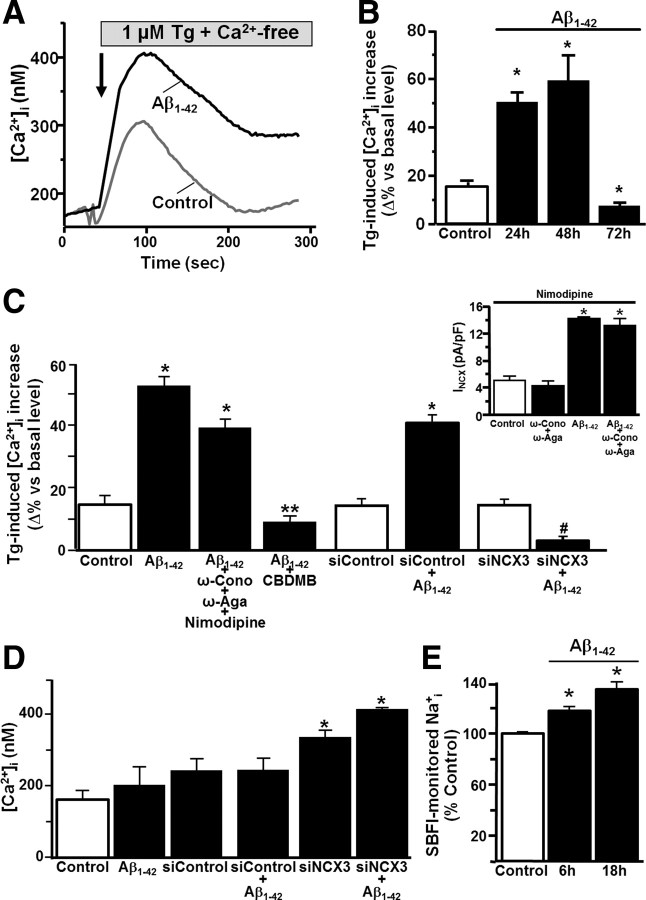
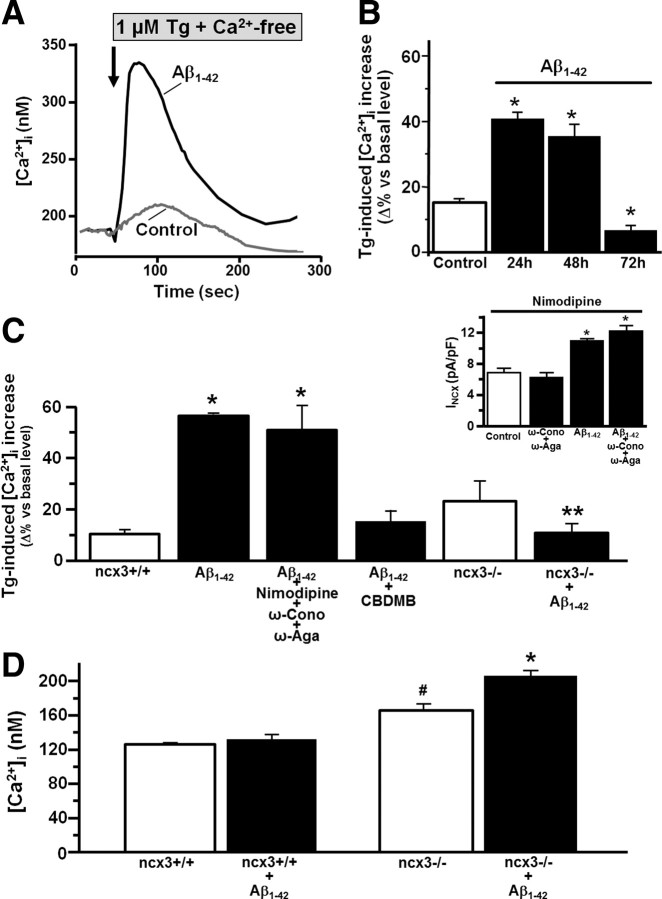
After 24 or 48 h of Aβ1–42 exposure, the SERCA inhibitor Tg induced a Ca2+ release from ER stores higher than that obtained under control conditions, both in hippocampal neurons and in NGF-differentiated PC-12 cells (Figs. 4 and 5). This demonstrated that, under these conditions, a larger accumulation of Ca2+ occurs in the ER (Figs. 4A,B and 5A,B). Subsequently, at 72 h, the increase in ER Ca2+ switched in a depletion (Figs. 4B, 5B). The larger Aβ1–42-induced ER-Ca2+ accumulation occurring at 24 and 48 h was prevented either by CB-DMB (300 nm) exposure or by silencing or knocking out of NCX3 (Figs. 4C, 5C). On the other hand, the blockade of L-, N-, and P/Q-type voltage dependent calcium channels (VDCCs) with their specific inhibitors nimodipine (10 μm), ϖ-conotoxin (200 nm), and ϖ-agatoxin (200 nm), respectively, did not prevent ER Ca2+ refilling induced by Aβ1–42 exposure (Figs. 4C, 5C). Interestingly, the patch-clamp measurements revealed that the same specific inhibitors did not modify NCX activity under control conditions or after Aβ1–42 exposure (Figs. 4C, 5C insets).
Figure 4.
Effect of NCX3 silencing on Ca2+ content in ER and [Ca2+]i in NGF-differentiated PC-12 cells exposed to Aβ1–42. A, Representative superimposed single-cell traces of the effect of 1 μm Tg on [Ca2+]i in Ca2+-free (0 Ca2+; 1.5 mm EGTA) under control conditions (gray trace) and after 24 h Aβ1–42 (black trace). B, Quantification of Aβ1–42 effect on Tg-induced [Ca2+]i release. Values are expressed as mean ± SEM of 3 independent experimental sessions (n = 50 for each group). C, Quantification of the effects of CB-DMB, several Ca2+ channel blockers, siControl, and siNCX3 after 24 h of 5 μm Aβ1–42 on Tg-induced [Ca2+]i release (n = 50 for each group). C, Inset, Quantification of the effects of Ca2+ channel blockers on NCX currents under control conditions and after 24 h 5 μm Aβ1–42 (n = 16 for each group). Values are expressed as mean ± SEM of 3 independent experimental sessions. D, Quantification of the effect of Aβ1–42 on [Ca2+]i in the presence and in the absence of siNCX3. Values are expressed as percentage mean ± SEM of 3 independent experimental sessions (n = 60 for each experimental group). E, Quantification of the time-dependent effect of Aβ1–42 on [Na+]i. Values are expressed as percentage mean ± SEM of 3 independent experimental sessions (n = 50 for each experimental group). *p < 0.05 versus their untreated controls; **p < 0.05 versus Aβ1–42 group; #p < 0.05 versus all groups.
Figure 5.
Effect of NCX3 knocking-out on Ca2+ content in ER and [Ca2+]i in primary hippocampal neurons from ncx3+/+ and ncx3−/− mice exposed to Aβ1–42. A, Representative superimposed single-cell traces of the effect of 1 μm Tg on [Ca2+]i in Ca2+-free (0 Ca2+; 1.5 mm EGTA) under control conditions (gray trace) and after 24 h Aβ1–42 (black trace). B, Quantification of Aβ1–42 effect on Tg-induced [Ca2+]i release. Values are expressed as mean ± SEM of 3 independent experimental sessions (n = 50 for each group). C, Quantification of the effects of CB-DMB, several Ca2+ channel blockers and NCX3 knock-out on Tg-induced [Ca2+]i release measured after 24 h of 5 μm Aβ1–42 (n = 50 for each experimental group). C, Inset, Quantification of the effects of Ca2+ channel blockers on NCX currents under control condition and after 24 h 5 μm Aβ1–42. Values are expressed as mean ± SEM of 3 independent experimental sessions (n = 16 for each experimental group). D, Quantification of the effect of Aβ1–42 on [Ca2+]i in the presence and in the absence of NCX3 (ncx3−/−). Values are expressed as percentage mean ± SEM of 3 independent experimental sessions (n = 60 for each experimental group). *p < 0.05 versus their respective untreated controls; **p < 0.05 versus Aβ1–42; # p < 0.05 versus ncx3+/+.
At the cytosolic level, the silencing or the knocking out of NCX3 itself caused an increase in basal [Ca2+]i, which was further enhanced after 24 h of Aβ1–42 exposure (Figs. 4D, 5D).
On the other hand, 5 μm Aβ1–42 induced an increase in SBFI-monitored intracellular Na+ levels at 6 and 18 h in NGF-differentiated PC12 cells (Fig. 4E).
Effect of NCX3 silencing on caspase-12 activation, neuronal death and nuclear morphology induced by Aβ1–42
In neuronal cells, Aβ1–42 caused at 72 h the activation of caspase-12, a specific marker of ER stress (Fig. 6A) and cell death, as revealed by measuring the ratio between dead and living cells (PI/FDA+PI ratio) (Fig. 6C). Interestingly, in these cells, when NCX3 was silenced, Aβ1–42-induced caspase-12 activation, and cell death occurred 48 h earlier (Fig. 6B,C). In addition, silencing of NCX3 hastened Aβ1–42-induced abnormal nuclear morphology at 72 h, as detected by Hoechst 33258 (data not shown).
Molecular determinants of Aβ1–42-induced increase in NCX3 activity
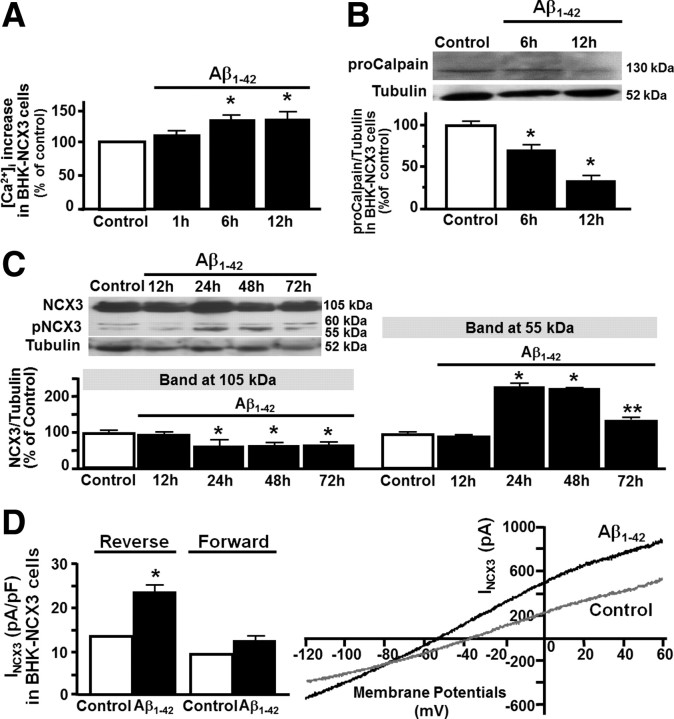
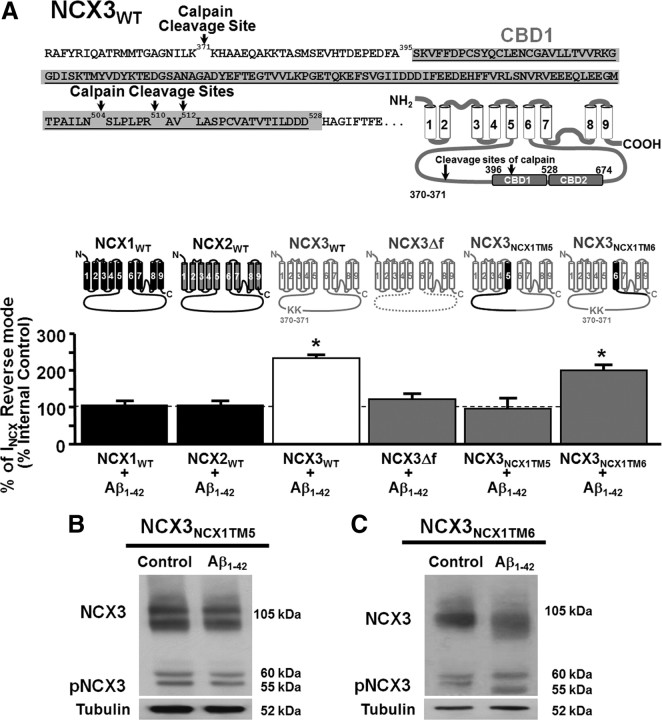
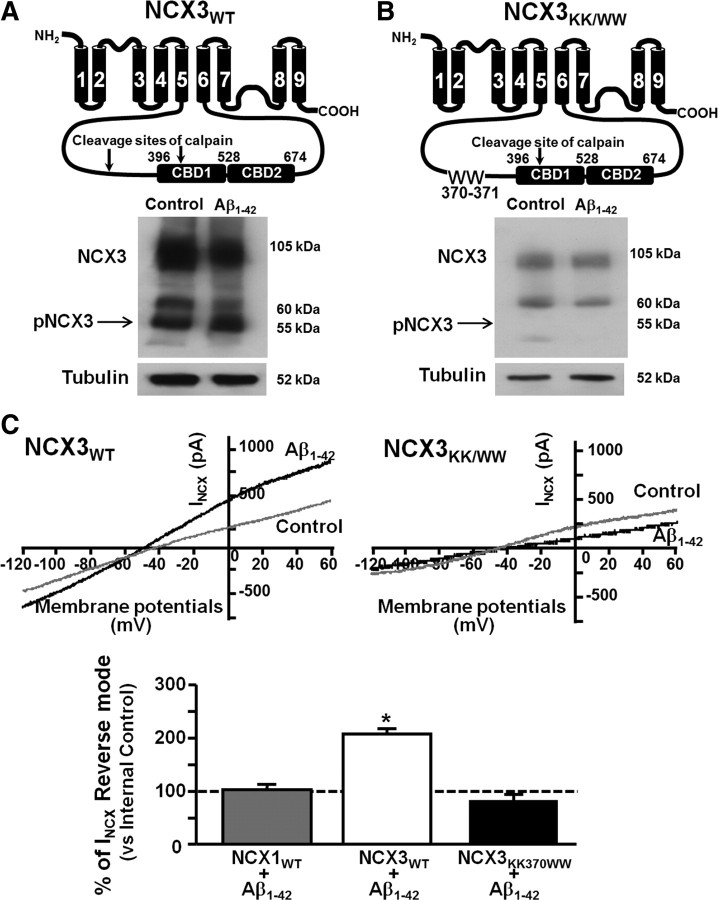
To investigate the molecular determinants of calpain-dependent effects of Aβ1–42 on NCX3 activity, the NCX3 cDNA was stably transfected in BHK cells, which do not constitutively express NCX isoforms. Similar to neuronal cells, BHK-NCX3 cells exposed to 5 μm Aβ1–42 exhibited increased [Ca2+]i levels (Fig. 7A), calpain activation (Fig. 7B), NCX3 cleavage (Fig. 7C), and increased INCX in the reverse mode of operation (Fig. 7D). Thereafter, a deletion mutant of NCX3, two NCX3/NCX1 chimeras, and a site-directed NCX3 mutant were generated to identify the amino acids involved in the Aβ1–42-induced upregulation of INCX. In particular, deletion mutagenesis of NCX3 f-loop (NCX3Δf) was made to remove calpain cleavage sites. In this mutant, as well as in BHK-NCX1 and BHK-NCX2, Aβ1–42 failed to increase INCX in the reverse mode of operation (Fig. 8A). To further characterize the region of the NCX3 f-loop involved in the Aβ1–42-induced effect, we generated two NCX3/NCX1 chimeras, NCX3NCX1TM5 and NCX3NCX1TM6. Both NCX3/NCX1 chimeras and NCX3Δf mutant were able to generate INCX similar to those carried by wild-type NCX1 and NCX3 (data now shown). The NCX3NCX1TM5 chimera, obtained by substituting the transmembrane segment TM5 and a part of the f-loop (227–469) of NCX3 with the homologous region of NCX1, was not cleaved by calpain and did not show an enhancement of its activity following Aβ1–42 exposure (Fig. 8A,B). By contrast, NCX3NCX1TM6 chimera, obtained by substituting the transmembrane segment TM6 and part of the f loop (707–776) of NCX3 with the homologous region of NCX1, was cleaved by calpain and showed an enhanced activity following Aβ1–42 exposure (Fig. 8A,C). Finally, the double substitution of Lys371 and Lys372 with two tryptophan residues in NCX3 (NCX3KK/WW) prevented calpain-induced NCX3 cleavage (Fig. 9A,B) and Aβ1–42-induced enhancement of NCX3 activity in the reverse mode of operation (Fig. 9C).
Figure 7.
Effect of Aβ1–42 on calpain activation and formation of NCX3 proteolytic fragment in stably transfected BHK-NCX3 cells. A, Quantification of the time-dependent effect of 5 μm Aβ1–42 on [Ca2+]i. Values are expressed as percentage mean ± SEM of 3 independent experimental sessions (n = 40 for each experimental group). B, Representative Western blot and densitometric quantification of calpain activation under control conditions and after 6 and 12 h of Aβ1–42 exposure. Values are expressed as percentage mean ± SEM of 4 independent experimental sections. C, Representative Western blot and densitometric quantification of NCX3 protein expression and its proteolytic fragment under control conditions, after 12, 24, 48, and 72 h of 5 μm Aβ1–42 exposure. Values are expressed as percentage mean ± SEM of 7 independent experimental sections. D, Representative superimposed traces and quantification of INCX3 recorded under control conditions (gray trace) and after 5 μm Aβ1–42 exposure for 24 h (black trace). Values are expressed as mean ± SEM of 3 independent experimental sessions (n = 20 for each group). *p < 0.05 versus respective controls; **p < 0.05 versus 24 and 48 h of Aβ1–42 exposure.
Figure 8.
Effects of Aβ1–42 on INCX in BHK cells stably transfected with NCX3 mutants and chimeras. A, NCX3 sequence containing the calpain cleavage sites (top) and quantification of the 5 μm Aβ1–42 effect on INCX recorded in BHK cells transfected with NCX1, NCX2, or NCX3 and each single chimera and mutant (bottom). Values are expressed as percentage mean ± SEM of 3 independent experimental sections (n = 15 for each group). *p < 0.05 versus respective controls. B, Representative Western blot of NCX3NCX1TM5 expression under control conditions and after 5 μm Aβ1–42 exposure for 24 h. C, Representative Western blot of NCX3NCX1TM6 expression under control conditions and after 5 μm Aβ1–42 exposure for 24 h.
Figure 9.
Effects of Aβ1–42 on INCX3 in BHK cells stably transfected with NCX3KK/WW. A, B, Representative Western blots of NCX3 and NCX3KK/WW expression under control conditions and after Aβ1–42 exposure, respectively. C, Representative superimposed traces and quantification of INCX3 recorded in BHK cells expressing wild-type NCX3 or NCX3KK/WW mutant under control conditions (gray trace) and after 24 h of 5 μm Aβ1–42 exposure (black trace). Values are expressed as percentage mean ± SEM of 3 independent experimental sections (n = 16). *p < 0.05 versus respective untreated control and all other groups.
Discussion
The results of the present study demonstrated for the first time that, in neurons, Aβ1–42 induced a concentration-dependent increase in INCX in the reverse mode of operation and that this enhancement was mediated by NCX3 but not by NCX1 and NCX2 isoforms. Indeed, this augmented activity was due to the increased formation of NCX3 hyperfunctional proteolytic fragment induced by Ca2+-dependent calpain activation. In fact, the removal of the consensus site for calpain cleavage located on the f-loop prevented the formation of the proteolytic fragment and abolished the Aβ1–42 stimulatory effect on INCX. Moreover, generation of the proteolytic fragment contributed to increasing Ca2+ content in ER, thus delaying ER stress. Formation of the NCX3 hyperfunctional proteolytic fragment may represent an initial defense mechanism against Aβ1–42-insult for it could help neurons to delay ER stress, caspase-12 activation, and, eventually, neuronal death. By contrast, in the late phase (72 h), when the NCX3 proteolytic cleavage abruptly ceased, a parallel reduction in ER Ca2+ content occurred, thus triggering ER stress, as revealed by the activation of caspase-12 and by an increase in neuronal death.
It is well known that Aβ1–42-exposure induces an increase in [Ca2+]i through several mechanisms, including VDCCs Aβ oligomers-dependent pores (Berridge, 2010; Demuro et al., 2011), and nicotinic (Chin et al., 2006), NMDA, and AMPA receptors (Alberdi et al., 2010; Berridge, 2010). The Aβ1–42-induced early increase in [Ca2+]i depends on the entrance of the ion from the extracellular compartment since its external removal prevents this early increase (Pannaccione et al., 2005). In addition, NCX3 was not involved in the early [Ca2+]i increase given that NCX3 silencing did not prevent this rise. Interestingly, the Aβ1–42-induced increase in [Ca2+]i, occurring at 30 min, was followed by calpain activation, which was seen at 1 h and lasted for 12 h. Intriguingly, a similar activation has also been found in human samples during AD and other neurodegenerative diseases (Vosler et al., 2008). Calpain activation, in turn, led to the formation of the NCX3 proteolytic fragment that appeared at 12 h and lasted up to 48 h. In fact, the NCX3 sequence contains, at the level of the f-loop, two calpain cleavage sites (Bano et al., 2005). In the present study, we found that the two lysine residues (370–371) in the f-loop of the NCX3 sequence may represent the molecular determinants of calpain cleavage and are therefore responsible for the Aβ1–42 stimulatory effect on NCX3. In fact, when the two lysines were replaced with two tryptophan residues that are not recognized by calpain (Tompa et al., 2004), the formation of the hyperfunctional proteolytic fragment was prevented. Interestingly, hyperfunctional activity of the NCX3 antiporter, elicited by calpain cleavage, is reminiscent of the results obtained by Philipson's group with the other isoform, NCX1 (Matsuoka et al., 1993). Indeed, these authors found that after α-chemotrypsin-mediated cleavage, NCX1 becomes hyperfunctional because it loses its inhibitory regulation present in the f-loop.
Since NCX activity and its modes of operation are regulated not only by [Ca2+]i but also by [Na+]i, the concentration of this ion was determined. We found that [Na+]i increased at 6 and 18 h after Aβ1–42 exposure, thus favoring the activity of NCX in the reverse mode of operation (Blaustein and Lederer, 1999; Philipson and Nicoll, 2000; Annunziato et al., 2004). The increase in [Na+]i during Aβ1–42 exposure can be explained by the results of Mattson's group (Mark et al., 1995) showing that Aβ fragments inhibit the Na+/K+ pump, one of the major mechanisms involved in Na+ extrusion. In accordance with these findings, it has been shown that in synaptosomes obtained from the brains of patients affected by AD, the activity of the Na+/K+ ATPase is markedly reduced (Chauhan et al., 1997; Hattori et al., 1998). On the other hand, it should be underscored that Aβ1–42 can induce potential changes in Na+ influx pathways. In fact, the β-amyloid peptide can induce membrane depolarization by increasing Na+ influx though the activation of TTX-sensitive Na+ channels (Mukhamedyarov et al., 2009).
More relevantly, the increased activity of the NCX3 proteolytic fragment may intervene in the ER-refilling dysregulation observed in AD. In fact, Aβ1–42 also induces ER dysregulation in other neuronal models of degeneration (Verkhratsky and Toescu, 2003). Particularly, ER seems to play a crucial role in AD pathogenesis (Guo et al., 1996; Supnet et al., 2006; Bezprozvanny and Mattson, 2008) because it is an important site for generating Aβ fragments in neurons and, because presenilin-1 and -2 proteins are both predominantly localized in this cellular compartment (Walter et al., 1996). Interestingly, Ca2+ refilling into ER seems to be a crucial early self-protective mechanism against ER stress (Verkhratsky and Toescu, 2003). In the present study, our results indicated that there exists both a temporal and a functional relationship between NCX3 and Ca2+ buffering into ER. Indeed, when NCX3 was silenced or knocked-out, the larger Aβ1–42-induced ER-Ca2+ accumulation was prevented and ER stress, [Ca2+]i increase, and cell death prematurely occurred, thus demonstrating the beneficial contribution of NCX3 to the ER-refilling process. In accordance with these results, in anoxic astrocytes (Lenart et al., 2004) and in Ca2+ oscillating muscle cells, NCX blockade prevents ER Ca2+-refilling (Fameli et al., 2007). Similarly, during OGD, the other isoform, NCX1 is upregulated in the reverse mode of operation and plays a fundamental role in the Ca2+-refilling process, thus helping neurons to prevent ER stress (Sirabella et al., 2009). Likewise, we found that increases in NCX3 activity observed after 24 and 48 h of exposure seemed to delay ER stress, caspase-12 activation, and neuronal death triggered by Aβ1–42. By contrast, in the late phase, at 72 h, when the NCX3 proteolytic fragment abruptly decreased, the effect of Aβ1–42 switched from a protective signal to a cell death one. In fact, Aβ1–42 caused a depletion of the Ca2+ content in ER and an increase in [Ca2+]i thus triggering ER stress, as evidenced by caspase-12 activation, and, ultimately, neuronal death. On the other hand, several lines of evidence have indicated that NCX3 also plays a protective role under anoxic and ischemic conditions (Condrescu et al., 1995; Linck et al., 1998; Pignataro et al., 2004; Gomez-Villafuertes et al., 2005; Boscia et al., 2006; Secondo et al., 2007; Molinaro et al., 2008).
In another study, Nicotera's group (Bano et al., 2005) showed that during brain ischemia and glutamate exposure, NCX3 can be cleaved by the Ca2+-activated calpain, thus producing similar proteolytic fragments. However, this mechanism has been interpreted as a destruction of the cellular defenses following stroke (Choi, 2005). By contrast, in our study, we demonstrated that this cleavage produced a hyperfunctional NCX3 proteolytic fragment that exerted a protective effect during the first 48 h of Aβ1–42 exposure. On the other hand, Colvin et al. (1994) already observed an increase in NCX activity in plasma membrane vesicles from human postmortem tissues of the frontal cortex, temporal cortex, and cerebellum of AD patients and hypothesized that the increased NCX activity could exert, in the early phase of the disease, a neuroprotective role in AD through a correction of intracellular calcium dysregulation.
Together, these data suggest that Aβ1–42-induced upregulation of NCX3 activity may contribute to ER Ca2+ refilling during Aβ1–42 insult, thus helping neurons to mitigate ER stress and thus delaying neuronal death. Although these results may appear as a paradox considering Aβ1–42 neurotoxicity, they might be interpreted as a survival strategy activated by neurons in an attempt to defend themselves from the death messages triggered by this peptide during the early phase of exposure.
Finally, even if drugs selectively activating NCX3 are in development and not yet available, this molecular target might be of clinical relevance and open a new, additional strategy against AD.
Footnotes
This work was supported by Grant COFIN 2008, Ricerca-Sanitaria (Grant RF-FSL352059), Ricerca finalizzata (2006), Ricerca-Oncologica (2006), Progetto-Strategico (2007), Progetto Ordinario (2007), Ricerca finalizzata (2009), and Ricerca-Sanitaria progetto Ordinario (2008) by Ministero della Salute (all L.A.). We thank Dr. Paola Merolla for the editorial revision and Pellegrino Lippiello, Vincenzo Grillo, and Carmine Capitale for their technical assistance.
References
- Alberdi E, Sánchez-Gómez MV, Cavaliere F, Pérez-Samartín A, Zugaza JL, Trullas R, Domercq M, Matute C. Amyloid beta oligomers induce Ca2+ dysregulation and neuronal death through activation of ionotropic glutamate receptors. Cell Calcium. 2010;47:264–272. doi: 10.1016/j.ceca.2009.12.010. [DOI] [PubMed] [Google Scholar]
- Annunziato L, Pignataro G, Di Renzo GF. Pharmacology of brain Na+/Ca2+ exchanger: from molecular biology to therapeutic perspectives. Pharmacol Rev. 2004;56:633–654. doi: 10.1124/pr.56.4.5. [DOI] [PubMed] [Google Scholar]
- Bano D, Young KW, Guerin CJ, Lefeuvre R, Rothwell NJ, Naldini L, Rizzuto R, Carafoli E, Nicotera P. Cleavage of the plasma membrane Na+/Ca2+ exchanger in excitotoxicity. Cell. 2005;120:275–285. doi: 10.1016/j.cell.2004.11.049. [DOI] [PubMed] [Google Scholar]
- Berridge MJ. Calcium hypothesis of Alzheimer's disease. Pflugers Arch. 2010;459:441–449. doi: 10.1007/s00424-009-0736-1. [DOI] [PubMed] [Google Scholar]
- Bezprozvanny I, Mattson MP. Neuronal calcium mishandling and the pathogenesis of Alzheimer's disease. Trends Neurosci. 2008;31:454–463. doi: 10.1016/j.tins.2008.06.005. [DOI] [PMC free article] [PubMed] [Google Scholar]
- Blaustein MP, Lederer WJ. Sodium/calcium exchange: its physiological implications. Physiol Rev. 1999;79:763–854. doi: 10.1152/physrev.1999.79.3.763. [DOI] [PubMed] [Google Scholar]
- Boscia F, Gala R, Pignataro G, de Bartolomeis A, Cicale M, Ambesi-Impiombato A, Di Renzo G, Annunziato L. Permanent focal brain ischemia induces isoform-dependent changes in the pattern of Na+/Ca2+ exchanger gene expression in the ischemic core, periinfarct area, and intact brain regions. J Cereb Blood Flow Metab. 2006;26:502–517. doi: 10.1038/sj.jcbfm.9600207. [DOI] [PubMed] [Google Scholar]
- Chakroborty S, Goussakov I, Miller MB, Stutzmann GE. Deviant ryanodine receptor-mediated calcium release resets synaptic homeostasis in presymptomatic 3xTg-AD mice. J Neurosci. 2009;29:9458–9470. doi: 10.1523/JNEUROSCI.2047-09.2009. [DOI] [PMC free article] [PubMed] [Google Scholar]
- Chauhan NB, Lee JM, Siegel GJ. Na,K-ATPase mRNA levels and plaque load in Alzheimer's disease. J Mol Neurosci. 1997;9:151–166. doi: 10.1007/BF02800498. [DOI] [PubMed] [Google Scholar]
- Chin JH, Tse FW, Harris K, Jhamandas JH. Beta-amyloid enhances intracellular calcium rises mediated by repeated activation of intracellular calcium stores and nicotinic receptors in acutely dissociated rat basal forebrain neurons. Brain Cell Biol. 2006;35:173–186. doi: 10.1007/s11068-007-9010-7. [DOI] [PubMed] [Google Scholar]
- Choi DW. Neurodegeneration: cellular defences destroyed. Nature. 2005;433:696–698. doi: 10.1038/433696a. [DOI] [PubMed] [Google Scholar]
- Colvin RA, Davis N, Wu A, Murphy CA, Levengood J. Studies of the mechanism underlying increased Na+/Ca2+ exchange activity in Alzheimer's disease brain. Brain Res. 1994;665:192–200. doi: 10.1016/0006-8993(94)91338-2. [DOI] [PubMed] [Google Scholar]
- Condrescu M, Gardner JP, Chernaya G, Aceto JF, Kroupis C, Reeves JP. ATP-dependent regulation of sodium-calcium exchange in Chinese hamster ovary cells transfected with the bovine cardiac sodium-calcium exchanger. J Biol Chem. 1995;270:9137–9146. doi: 10.1074/jbc.270.16.9137. [DOI] [PubMed] [Google Scholar]
- Demuro A, Smith M, Parker I. Single-channel Ca(2+) imaging implicates Abeta1–42 amyloid pores in Alzheimer's disease pathology. J Cell Biol. 2011;195:515–524. doi: 10.1083/jcb.201104133. [DOI] [PMC free article] [PubMed] [Google Scholar]
- Fameli N, van Breemen C, Kuo KH. A quantitative model for linking Na+/Ca2+ exchanger to SERCA during refilling of the sarcoplasmic reticulum to sustain [Ca2+] oscillations in vascular smooth muscle. Cell Calcium. 2007;42:565–575. doi: 10.1016/j.ceca.2007.02.001. [DOI] [PubMed] [Google Scholar]
- Goll DE, Thompson VF, Li H, Wei W, Cong J. The calpain system. Physiol Rev. 2003;83:731–801. doi: 10.1152/physrev.00029.2002. [DOI] [PubMed] [Google Scholar]
- Gomez-Villafuertes R, Torres B, Barrio J, Savignac M, Gabellini N, Rizzato F, Pintado B, Gutierrez-Adan A, Mellström B, Carafoli E, Naranjo JR. Downstream regulatory element antagonist modulator regulates Ca2+ homeostasis and viability in cerebellar neurons. J Neurosci. 2005;25:10822–10830. doi: 10.1523/JNEUROSCI.3912-05.2005. [DOI] [PMC free article] [PubMed] [Google Scholar]
- Greene LA, Tischler AS. Establishment of a noradrenergic clonal line of rat adrenal pheochromocytoma cells which respond to nerve growth factor. Proc Natl Acad Sci U S A. 1976;73:2424–2428. doi: 10.1073/pnas.73.7.2424. [DOI] [PMC free article] [PubMed] [Google Scholar]
- Grynkiewicz G, Poenie M, Tsien RY. A new generation of Ca2+ indicators with greatly improved fluorescence properties. J Biol Chem. 1985;260:3440–3450. [PubMed] [Google Scholar]
- Guo Q, Furukawa K, Sopher BL, Pham DG, Xie J, Robinson N, Martin GM, Mattson MP. Alzheimer's PS-1 mutation perturbs calcium homeostasis and sensitizes PC12 cells to death induced by amyloid beta-peptide. Neuroreport. 1996;8:379–383. doi: 10.1097/00001756-199612200-00074. [DOI] [PubMed] [Google Scholar]
- Hattori N, Kitagawa K, Higashida T, Yagyu K, Shimohama S, Wataya T, Perry G, Smith MA, Inagaki C. CI-ATPase and Na+/K(+)-ATPase activities in Alzheimer's disease brains. Neurosci Lett. 1998;254:141–144. doi: 10.1016/s0304-3940(98)00654-5. [DOI] [PubMed] [Google Scholar]
- Iwamoto T, Pan Y, Nakamura TY, Wakabayashi S, Shigekawa M. Protein kinase C-dependent regulation of Na+/Ca2+ exchanger isoforms NCX1 and NCX3 does not require their direct phosphorylation. Biochemistry. 1998;37:17230–17238. doi: 10.1021/bi981521q. [DOI] [PubMed] [Google Scholar]
- Lee MS, Kwon YT, Li M, Peng J, Friedlander RM, Tsai LH. Neurotoxicity induces cleavage of p35 to p25 by calpain. Nature. 2000;405:360–364. doi: 10.1038/35012636. [DOI] [PubMed] [Google Scholar]
- Lenart B, Kintner DB, Shull GE, Sun D. Na-K-Cl cotransporter-mediated intracellular Na+ accumulation affects Ca2+ signaling in astrocytes in an in vitro ischemic model. J Neurosci. 2004;24:9585–9597. doi: 10.1523/JNEUROSCI.2569-04.2004. [DOI] [PMC free article] [PubMed] [Google Scholar]
- Li Z, Matsuoka S, Hryshko LV, Nicoll DA, Bersohn MM, Burke EP, Lifton RP, Philipson KD. Cloning of the NCX2 isoform of the plasma membrane Na(+)-Ca2+ exchanger. J Biol Chem. 1994;269:17434–17439. [PubMed] [Google Scholar]
- Linck B, Qiu Z, He Z, Tong Q, Hilgemann DW, Philipson KD. Functional comparison of the three isoforms of the Na+/Ca2+ exchanger (NCX1, NCX2, NCX3) Am J Physiol. 1998;274:C415–C423. doi: 10.1152/ajpcell.1998.274.2.C415. [DOI] [PubMed] [Google Scholar]
- Lorenzo A, Yankner BA. Beta-amyloid neurotoxicity requires fibril formation and is inhibited by congo red. Proc Natl Acad Sci U S A. 1994;91:12243–12247. doi: 10.1073/pnas.91.25.12243. [DOI] [PMC free article] [PubMed] [Google Scholar]
- Mark RJ, Hensley K, Butterfield DA, Mattson MP. Amyloid beta-peptide impairs ion-motive ATPase activities: evidence for a role in loss of neuronal Ca2+ homeostasis and cell death. J Neurosci. 1995;15:6239–6249. doi: 10.1523/JNEUROSCI.15-09-06239.1995. [DOI] [PMC free article] [PubMed] [Google Scholar]
- Matsuoka S, Nicoll DA, Reilly RF, Hilgemann DW, Philipson KD. Initial localization of regulatory regions of the cardiac sarcolemmal Na(+)-Ca2+ exchanger. Proc Natl Acad Sci U S A. 1993;90:3870–3874. doi: 10.1073/pnas.90.9.3870. [DOI] [PMC free article] [PubMed] [Google Scholar]
- Molinaro P, Cuomo O, Pignataro G, Boscia F, Sirabella R, Pannaccione A, Secondo A, Scorziello A, Adornetto A, Gala R, Viggiano D, Sokolow S, Herchuelz A, Schurmans S, Di Renzo G, Annunziato L. Targeted disruption of Na+/Ca2+ exchanger 3 (NCX3) gene leads to a worsening of ischemic brain damage. J Neurosci. 2008;28:1179–1184. doi: 10.1523/JNEUROSCI.4671-07.2008. [DOI] [PMC free article] [PubMed] [Google Scholar]
- Molinaro P, Viggiano D, Nisticò R, Sirabella R, Secondo A, Boscia F, Pannaccione A, Scorziello A, Mehdawy B, Sokolow S, Herchuelz A, Di Renzo GF, Annunziato L. Na+-Ca2+ exchanger (NCX3) knock-out mice display an impairment in hippocampal long-term potentiation and spatial learning and memory. J Neurosci. 2011;31:7312–7321. doi: 10.1523/JNEUROSCI.6296-10.2011. [DOI] [PMC free article] [PubMed] [Google Scholar]
- Morishima N, Nakanishi K, Takenouchi H, Shibata T, Yasuhiko Y. An endoplasmic reticulum stress-specific caspase cascade in apoptosis: cytochrome c-independent activation of caspase-9 by caspase-12. J Biol Chem. 2002;277:34287–34294. doi: 10.1074/jbc.M204973200. [DOI] [PubMed] [Google Scholar]
- Mukhamedyarov MA, Grishin SN, Yusupova ER, Zefirov AL, Palotás A. Alzheimer's beta-amyloid-induced depolarization of skeletal muscle fibers: implications for motor dysfunctions in dementia. Cell Physiol Biochem. 2009;23:109–114. doi: 10.1159/000204099. [DOI] [PubMed] [Google Scholar]
- Nicoll DA, Longoni S, Philipson KD. Molecular cloning and functional expression of the cardiac sarcolemmal Na(+)-Ca2+ exchanger. Science. 1990;250:562–565. doi: 10.1126/science.1700476. [DOI] [PubMed] [Google Scholar]
- Nicoll DA, Quednau BD, Qui Z, Xia YR, Lusis AJ, Philipson KD. Cloning of a third mammalian Na+-Ca2+ exchanger, NCX3. J Biol Chem. 1996;271:24914–24921. doi: 10.1074/jbc.271.40.24914. [DOI] [PubMed] [Google Scholar]
- Pannaccione A, Secondo A, Scorziello A, Calì G, Taglialatela M, Annunziato L. Nuclear factor-kappaB activation by reactive oxygen species mediates voltage-gated K+ current enhancement by neurotoxic beta-amyloid peptides in nerve growth factor-differentiated PC-12 cells and hippocampal neurones. J Neurochem. 2005;94:572–586. doi: 10.1111/j.1471-4159.2005.03075.x. [DOI] [PubMed] [Google Scholar]
- Papa M, Canitano A, Boscia F, Castaldo P, Sellitti S, Porzig H, Taglialatela M, Annunziato L. Differential expression of the Na+-Ca2+ exchanger transcripts and proteins in rat brain regions. J Comp Neurol. 2003;461:31–48. doi: 10.1002/cne.10665. [DOI] [PubMed] [Google Scholar]
- Paschen W. Endoplasmic reticulum: a primary target in various acute disorders and degenerative diseases of the brain. Cell Calcium. 2003;34:365–383. doi: 10.1016/s0143-4160(03)00139-8. [DOI] [PubMed] [Google Scholar]
- Philipson KD, Nicoll DA. Sodium-calcium exchange: a molecular perspective. Annu Rev Physiol. 2000;62:111–133. doi: 10.1146/annurev.physiol.62.1.111. [DOI] [PubMed] [Google Scholar]
- Pignataro G, Gala R, Cuomo O, Tortiglione A, Giaccio L, Castaldo P, Sirabella R, Matrone C, Canitano A, Amoroso S, Di Renzo G, Annunziato L. Two sodium/calcium exchanger gene products, NCX1 and NCX3, play a major role in the development of permanent focal cerebral ischemia. Stroke. 2004;35:2566–2570. doi: 10.1161/01.STR.0000143730.29964.93. [DOI] [PubMed] [Google Scholar]
- Scalia R, Gong Y, Berzins B, Freund B, Feather D, Landesberg G, Mishra G. A novel role for calpain in the endothelial dysfunction induced by activation of angiotensin II type 1 receptor signaling. Circ Res. 2011;108:1102–1111. doi: 10.1161/CIRCRESAHA.110.229393. [DOI] [PMC free article] [PubMed] [Google Scholar]
- Scorziello A, Pellegrini C, Forte L, Tortiglione A, Gioielli A, Iossa S, Amoroso S, Tufano R, Di Renzo G, Annunziato L. Differential vulnerability of cortical and cerebellar neurons in primary culture to oxygen glucose deprivation followed by reoxygenation. J Neurosci Res. 2001;63:20–26. doi: 10.1002/1097-4547(20010101)63:1<20::AID-JNR3>3.0.CO;2-N. [DOI] [PubMed] [Google Scholar]
- Secondo A, Staiano RI, Scorziello A, Sirabella R, Boscia F, Adornetto A, Valsecchi V, Molinaro P, Canzoniero LM, Di Renzo G, Annunziato L. BHK cells transfected with NCX3 are more resistant to hypoxia followed by reoxygenation than those transfected with NCX1 and NCX2: possible relationship with mitochondrial membrane potential. Cell Calcium. 2007;42:521–535. doi: 10.1016/j.ceca.2007.01.006. [DOI] [PubMed] [Google Scholar]
- Secondo A, Pannaccione A, Molinaro P, Ambrosino P, Lippiello P, Esposito A, Cantile M, Khatri PR, Melisi D, Di Renzo G, Annunziato L. Molecular pharmacology of the amiloride analog 3-amino-6-chloro-5-[(4-chloro-benzyl)amino]-n-[[(2,4-dimethylbenzyl)-amino]iminomethyl]-pyrazinecarboxamide (CB-DMB) as a pan inhibitor of the Na+-Ca2+ exchanger isoforms NCX1, NCX2, and NCX3 in stably transfected cells. J Pharmacol Exp Ther. 2009;331:212–221. doi: 10.1124/jpet.109.152132. [DOI] [PubMed] [Google Scholar]
- Selimovic D, Ahmad M, El-Khattouti A, Hannig M, Haïkel Y, Hassan M. Apoptosis-related protein-2 triggers melanoma cell death by a mechanism including both endoplasmic reticulum stress and mitochondrial dysregulation. Carcinogenesis. 2011;32:1268–1278. doi: 10.1093/carcin/bgr112. [DOI] [PubMed] [Google Scholar]
- Sirabella R, Secondo A, Pannaccione A, Scorziello A, Valsecchi V, Adornetto A, Bilo L, Di Renzo G, Annunziato L. Anoxia-induced NF-kappaB-dependent upregulation of NCX1 contributes to Ca2+ refilling into endoplasmic reticulum in cortical neurons. Stroke. 2009;40:922–929. doi: 10.1161/STROKEAHA.108.531962. [DOI] [PubMed] [Google Scholar]
- Sokolow S, Luu SH, Headley AJ, Hanson AY, Kim T, Miller CA, Vinters HV, Gylys KH. High levels of synaptosomal Na(+)-Ca(2+) exchangers (NCX1, NCX2, NCX3) co-localized with amyloid-beta in human cerebral cortex affected by Alzheimer's disease. Cell Calcium. 2011;49:208–216. doi: 10.1016/j.ceca.2010.12.008. [DOI] [PMC free article] [PubMed] [Google Scholar]
- Supnet C, Grant J, Kong H, Westaway D, Mayne M. Amyloid-beta-(1–42) increases ryanodine receptor-3 expression and function in neurons of TgCRND8 mice. J Biol Chem. 2006;281:38440–38447. doi: 10.1074/jbc.M606736200. [DOI] [PubMed] [Google Scholar]
- Tompa P, Buzder-Lantos P, Tantos A, Farkas A, Szilágyi A, Bánóczi Z, Hudecz F, Friedrich P. On the sequential determinants of calpain cleavage. J Biol Chem. 2004;279:20775–20785. doi: 10.1074/jbc.M313873200. [DOI] [PubMed] [Google Scholar]
- Verkhratsky A, Toescu EC. Endoplasmic reticulum Ca(2+) homeostasis and neuronal death. J Cell Mol Med. 2003;7:351–361. doi: 10.1111/j.1582-4934.2003.tb00238.x. [DOI] [PMC free article] [PubMed] [Google Scholar]
- Vosler PS, Brennan CS, Chen J. Calpain-mediated signaling mechanisms in neuronal injury and neurodegeneration. Mol Neurobiol. 2008;38:78–100. doi: 10.1007/s12035-008-8036-x. [DOI] [PMC free article] [PubMed] [Google Scholar]
- Walter J, Capell A, Grünberg J, Pesold B, Schindzielorz A, Prior R, Podlisny MB, Fraser P, Hyslop PS, Selkoe DJ, Haass C. The Alzheimer's disease-associated presenilins are differentially phosphorylated proteins located predominantly within the endoplasmic reticulum. Mol Med. 1996;2:673–691. [PMC free article] [PubMed] [Google Scholar]


