Abstract
Synaptic refinement via the elimination of inappropriate synapses and strengthening of appropriate ones is crucially important for the establishment of specific, topographic neural circuits. The mechanisms driving these processes are poorly understood, particularly concerning inhibitory projections. Here, we address the refinement of an inhibitory topographic projection in the auditory brainstem in functional and anatomical mapping studies involving patch-clamp recordings in combination with minimal and maximal stimulation, caged glutamate photolysis, and single axon tracing. We demonstrate a crucial dependency of the refinement on CaV1.3 calcium channels: CaV1.3−/− mice displayed virtually no elimination of projections up to hearing onset. Furthermore, strengthening was strongly impaired, in line with a reduced number of axonal boutons. The mediolateral topography was less precise and the shift from a mixed GABA/glycinergic to a purely glycinergic transmission before hearing onset did not occur. Together, our findings provide evidence for a CaV1.3-dependent mechanism through which both inhibitory circuit formation and determination of the neurotransmitter phenotype are achieved.
Introduction
The establishment of precise, often topographically organized synaptic connections is essential for the formation of specific neuronal circuits and, ultimately, for proper brain function. Neuronal circuits are initially imprecisely formed, yet become subsequently sculptured by synaptic refinement, a developmental key process consisting of selective elimination of redundant immature synapses and strengthening of remaining ones (Kano and Hashimoto, 2009). The process critically depends on neuronal activity (Katz and Shatz, 1996; Kakizawa et al., 2000; Lichtman and Colman, 2000; Lorenzetto et al., 2009), but the molecular basis is not well understood. In the CNS, synaptic refinement has been extensively studied at excitatory projections, e.g., the retinogeniculate synapses (Chen and Regehr, 2000); the whisker-related somatosensory synapses in the brainstem (Rudhard et al., 2003), thalamus (Wang et al., 2011), and cortex (Erzurumlu and Kind, 2001); and the olivocerebellar climbing fiber–Purkinje cell synapses (Hashimoto and Kano, 2003). Refinement of inhibitory synapses has been studied much less. A very favorable model system for developmental studies of inhibitory synapses is provided in the auditory brainstem by the projection from the medial nucleus of the trapezoid body (MNTB) to the lateral superior olive (LSO) (Sanes and Friauf, 2000; Kandler, 2004). In mice, the number of axons of MNTB neurons projecting to one LSO neuron is reduced more than twofold within the first 2 postnatal weeks, accompanied by an increase of synaptic strength of the remaining ones (Kim and Kandler, 2003, 2010; Noh et al., 2010). This process is completed by hearing onset at approximately postnatal day 12 (P12) (Walcher et al., 2011). The mechanisms driving this refinement remain poorly understood.
The fact that CaV1 calcium channels (alias L-type channels) are involved in the development of glycinergic synapses (Kirsch and Betz, 1998) prompted us to analyze a role of CaV1.3 in map formation and refinement in the MNTB–LSO projection. CaV1.3 is one of the two CaV1 isoforms present in the brain (Sinnegger-Brauns et al., 2009), and functional expression in LSO neurons was shown previously (Hirtz et al., 2011). CaV1.3 and CaV1.2 are predominantly localized to the somatic and dendritic compartments (Hell et al., 1993; Sukiasyan et al., 2009). They are candidate molecules for controlling circuit refinement, as they mediate calcium influx that modulates transcription regulation (Greer and Greenberg, 2008) and are involved in synaptic plasticity (Kasyanov et al., 2004; Moosmang et al., 2005). We previously reported defects in the cytoarchitecture of auditory brainstem nuclei in CaV1.3−/− mice, implying a crucial developmental role of CaV1.3 (Hirtz et al., 2011). Here, we demonstrate a strongly impaired refinement of the topographic MNTB–LSO projection in CaV1.3−/− mice. We also show that the mediolateral topography is less precise in CaV1.3−/−. Finally, synaptic transmission in 2-week-old CaV1.3−/− mice included a GABAergic component not present in wild types (WTs). Together, our results argue for an indispensable role of CaV1.3 in the development of inhibitory circuits.
Materials and Methods
Animals.
Experiments were performed on male and female WT and CaV1.3−/− mice. The latter lack the α1 subunit of CaV1.3 (Platzer et al., 2000). Both genotypes were bred on a C57BL/6N background. Their treatment was in accordance with the German law for conducting animal experiments and followed the NIH guide for the care and use of laboratory animals.
Immunohistochemistry.
The great majority of steps were performed as described previously (Hirtz et al., 2011). Primary antibodies were as follows: rabbit-anti-vesicular amino acid transporter (VIAAT) antibody (a generous gift from B. Gasnier, Institut de Biologie Physico Chimique, CNRS, Paris, France), 1:2000; guinea-pig-anti-glycine transporter 2 (GlyT2) antibody (1:10,000; Millipore Bioscience Research Reagents); mouse-anti-MAP2 antibody (1:1000; Millipore Bioscience Research Reagents); mouse-anti-GAD65 (1:1000; Millipore); mouse-anti-GAD67 (1:2000; Millipore). Secondary antibodies (goat-anti-rabbit Alexa Fluor 488, goat-anti-guinea pig Alexa Fluor 488, goat-anti-mouse Alexa Fluor 488; goat-anti-mouse Alexa Fluor 546, goat-anti-rabbit Alexa Fluor 568, goat-anti-guinea pig Alexa Fluor 568) were obtained from Invitrogen and diluted 1:1000. Images from histological specimens were taken on an LSM 510 confocal microscope (Zeiss) equipped with an argon laser, a helium neon laser, and appropriate excitation and emission filters. A Plan-Neofluar 10×/0.3 or a Plan-Neofluar 40×/1.3 oil objective (Zeiss) was used, and pinhole settings were chosen to achieve optical sections of <12 or <1 μm thickness, respectively. Images were further processed with Zeiss LSM Image browser software 2.80 (Zeiss) and ImageJ 1.34s (NIH). To minimize the possibility of inadvertently biasing results, intensity measurements and counting of perisomatic boutons were performed without prior knowledge of the genotype. Quantification of immunosignals was done in ImageJ, with the experimenter being blind to the genotype [40× images; region of interest (ROI), 120 × 70 μm; equivalent to 328,125 pixels]. Background substraction (rolling ball radius, 20 pixels) was performed for gray value analysis (8 bit scale). To determine the number of immunoreactive boutons, threshold adjustment was done manually to obtain binary images, and the watershed routine was applied for particle separation. Particles were identified as boutons if their size ranged between 0.435 and 2.202 μm2. These values were obtained by measuring the size of particles that were identified as boutons in the original images. Larger particles were assumed to be accumulations of boutons, and their size was divided by the average bouton size to yield the bouton number.
Electrophysiology.
Patch-clamp recordings on LSO neurons were performed in the whole-cell configuration at room temperature in acutely isolated brainstem slices. Animals were decapitated and their brains were quickly removed. Coronal brainstem slices containing the superior olivary complex (270–300 μm thick, 1–2 slices per animal) were vibrocut (VT1000 or VT1200 S; Leica) in ice-cold solution [containing the following (in mm): 26 NaHCO3, 1.25 NaH2PO4, 2.5 KCl, 1 MgCl2, 2 CaCl2, 260 d-glucose, 2 Na-pyruvate, 3 myo-inositol, and 1 kynurenic acid, pH 7.4, when bubbled with 95% O2–5% CO2] and stored at 37°C for 1 h in artificial CSF [ACSF; containing the following (in mm): 125 NaCl, 25 NaHCO3, 1.25 NaH2PO4, 2.5 KCl, 1 MgCl2, 2 CaCl2, 10 d-glucose, 2 Na-pyruvate, 3 myo-inositol, and 0.44 ascorbic acid, pH 7.4, when bubbled with 95% O2–5% CO2]. Thereafter, they were stored at room temperature before being transferred into a recording chamber in which they were continually superfused with ACSF. The chamber was mounted on an upright microscope (Eclipse E600FN; Nikon) equipped with differential interference contrast optics (Nikon objectives, 4× CFI Achromat, 0.1 NA; 60× CFI Fluor W, 1.0 NA) and an infrared video camera system (CCD camera VX45, Optronics, or CCD camera VX44, PCO Computer Optics; PC frame grabber card, pciGrabber-4plus, Phytek).
Patch pipettes were pulled from borosilicate glass capillaries [GB150(F)-8P; Science Products] with a horizontal puller (P-87; Sutter Instruments). They had resistances of 3–6 MΩ when filled with intracellular solution and were connected to an EPC9 or EPC10 patch-clamp amplifier (HEKA Elektronik). Composition (in mm) of the intracellular solutions was as follows: for minimal and maximal electrical stimulation and NMDA component analysis, 72 Cs-methanesulfonate, 58 CsCl, 5 EGTA, 10 HEPES, 1 MgCl2, 5 QX314, 2 Na2ATP, 0.3 Na2GTP; [liquid junction potential (LJ), −9.7 mV]; For electrical stimulation concerning GABA and glycinergic components, 135 K-gluconate, 1 EGTA, 10 HEPES, 2 MgCl2, 0.1 CaCl2, 2 Na2ATP, 0.3 Na2GTP (LJ, −16.7 mV); for recordings from MNTB neurons and cell fills: 100 K-gluconate, 30 KCl, 5 EGTA, 10 HEPES, 1 MgCl2, 2 Na2ATP, 0.3 Na2GTP (LJ, −11.7 mV); for mapping experiments and recordings of mIPSCs, 130 KCl, 5 EGTA, 10 HEPES, 1 MgCl2, 2 Na2ATP, 0.3 Na2GTP (LJ, −3.5 mV), pH 7.2 with CsOH or KOH, respectively. Sample frequency was 10–20 kHz, and cutoff frequency of low-pass filtering was 2.8–8.3 kHz. Series resistance was routinely compensated by 50–90%. Recordings were performed in voltage-clamp mode with a holding potential of −70 mV, unless noted otherwise. For extracellular recordings of MNTB cells, patch pipettes were filled with ACSF.
To electrically evoke IPSCs, a glass electrode with a tip diameter of 15–25 μm was filled with ACSF and placed lateral to the MNTB. In case of minimal and maximal stimulation protocols, 100-μs-long monopolar pulses were applied through a programmable pulse generator (STG 1004 or STG 4002; Multi Channel Systems). Excitatory transmission was blocked with 20 μm CNQX (Ascent Scientific) and 50 μm d-AP5 (Ascent Scientific). To stimulate an axon of a single MNTB neuron, the stimulus intensity was set to a value resulting in 50% or more failures at 0.2 Hz stimulation frequency (typically 20–60 μA). The average peak amplitude of 30–85 successful responses was taken as the strength of the axon of a single MNTB neuron. Response amplitudes to minimal stimulation often showed some degree of variance (see Figs. 2, 3), as was observed previously (Noh et al., 2010). Multiple axon stimulation is unlikely, because the variance has also been demonstrated via paired recordings of MNTB and LSO neurons (Kim and Kandler, 2011). For five neurons of each group, IPSCs were identified by a second person who was blind to genotype and age: the value for the average single fiber strength per group differed not >5% between the two experimenters. Three of 63 LSO neurons displayed an unusually long decay and small synaptic responses. They most likely belonged to the nonprimary type of olivocochlear LSO neurons (Sterenborg et al., 2010) and were excluded.
Figure 2.
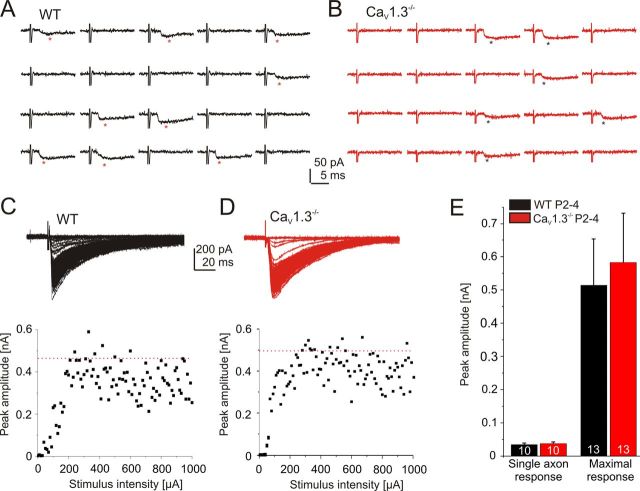
Weak single axon strength and high convergence ratio in WT and CaV1.3−/− mice at P2–P4. A, B, Stimulation of an axon from a single MNTB neuron in WT (A) and CaV1.3−/− (B) at P2–P4. Twenty consecutive stimuli at 0.2 Hz with low stimulation intensity. Each successful response is marked by an asterisk. Stimulus artifacts partly truncated (also applies to Figs. 3, 4, 9). C, D, Maximal synaptic response (indicated by red dotted line) of the MNTB–LSO projection in a WT and a CaV1.3−/− neuron. E, Statistical analysis. A comparison between WT and CaV1.3−/− at P2–P4 is shown. Numbers in bars depict the number of analyzed neurons (also applies to subsequent figures unless noted otherwise).
Figure 3.
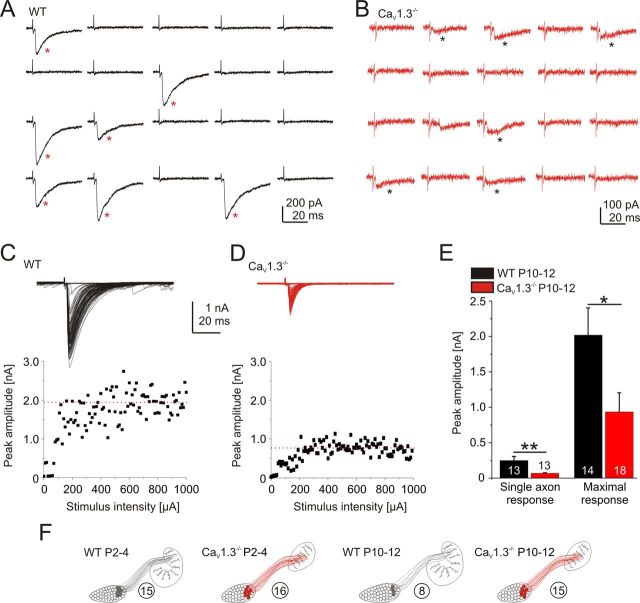
More, yet weaker, axons projecting to a single LSO neuron in CaV1.3−/− at P10–P12. A, B, Stimulation of a single MNTB axon in WT (A) and CaV1.3−/− (B) at P10–P12. C, D, Maximal synaptic response upon stimulation of the MNTB–LSO projection in a WT and a CaV1.3−/− neuron. E, Statistical analysis. A comparison between WT and CaV1.3−/− at P10–P12 is shown. F, Semischematic summary illustrating the impaired elimination of projections in CaV1.3−/−. The average number of axons converging onto one LSO neuron is depicted in circles. *p < 0.05; **p < 0.01. Details are as in Figure 2.
To activate all MNTB axons converging onto a given LSO neuron, stimulus amplitudes were increased in 10 μA steps at 0.2 Hz until a plateau was reached or further increases in stimulus strength resulted in reduced response amplitudes. In all cases, at least 900 μA were applied. To eliminate the jitter of responses, the peak amplitudes of five consecutive IPSCs were averaged with an overlap of two responses to the previous bin. The highest bin value was considered as the maximal response at which all axons converging onto a single LSO neuron were activated. For paired-pulse ratio (PPR), 10 responses evoked by 300 μA stimulation were analyzed per neuron. The PPR was calculated by dividing the second peak amplitude by the first. Experiments concerning the NMDA component of the MNTB–LSO circuit were performed with near maximal stimulation intensity at 0.2 Hz; 10 IPSCs were averaged.
In experiments concerning glycinergic and GABAergic components of IPSCs, stimulus pulses were shaped with a pulse generator (Master 8, A.M.P.I.) and applied through a stimulus isolator unit (A360; World Precision Instruments) at 1 Hz. Forty successful responses were averaged. Excitatory transmission was blocked with 5 mm kynurenic acid.
mIPSCs were recorded for 5 min in 1 μm tetrodotoxin and 5 mm kynurenic acid. To assess differences in peak amplitude, those of the first 35 mIPSCs of each neuron were pooled (limited number due to low mIPSC rates in CaV1.3−/−). Analyses of rise time and decay time constants were performed in MiniAnalysis 6.0.3 (Synaptosoft). Events were first fitted with a monoexponential decay. A biexponential decay was used if it led to an increase of the R2 value by at least 0.03. Events were rejected if the R2 value was lower than 0.5, resulting in 3001 mIPSCs from 7 WT neurons and 789 mIPSCs from 7 CaV1.3−/− neurons. For monoexponential mIPSCs, the amplitude of the slow component was considered to be 0 pA. For events evoked by electrical stimulation, the first 10–20 responses were analyzed with regard to decay time as described above, and in case of a double exponential decay, the two values were weighted with regard to their contribution in amplitude. Strychnine, gabazine, kynurenic acid, and tetrodotoxin were obtained from Sigma-Aldrich.
Mapping experiments.
MNI-caged glutamate (200 μm; Tocris Bioscience) was added to the ACSF. To reduce the consumption of MNI-caged glutamate, a total volume of 10–20 ml of ACSF was recycled for a few hours. The setup was equipped with a 378 nm laser diode (Oxxius Violet, Oxxius). The laser beam was shrunken three times (lenses and tubes from Thorlabs) before it was focused through the 60× objective. The setup was mounted on an automated positioning table (HT1111; Prior Scientific). After an LSO neuron was successfully patch clamped, MNI-caged glutamate was photolyzed in the region of the MNTB with 10-ms-long pulses of 1.8 mW laser power. The microscope was systematically moved every 0.5 s in a serpentine, zig-zag-like pattern, each time repositioning it 20 μm along a rectangular grid. By doing so, the complete MNTB was covered, resulting in 200–400 uncaging sites. A second, more focal raster was used at the sites at which uncaging led to synaptic responses in the recorded LSO neuron (“hot spots”). Here, 10 μm steps, pausing for 5 s, and 10-ms-long 1.5 mW laser pulses were used. The fine raster was programmed to cover at least the region of the initial hot spots plus 10 μm surrounding. The focus of the beam was always set 50 μm into the slice to compensate for the loss of intensity. The coordinates of ∼10 locations at the borders of MNTB and LSO given by the software of the positioning table were noted, and images of the slices were stored. Together with the coordinates of recorded neurons and input areas, this allowed the reconstruction of MNTB–LSO projection maps. Slight adjustments were made off-line to horizontally orientate the mediolateral axis of the slice.
For stimulus conditions control, uncaging was performed in an area with a 100 μm radius around an extracellularly recorded MNTB neuron. Values of step size, laser intensity, and settle time between pulses were the same as in the fine raster mapping experiments. To determine the action potential (AP) threshold of MNTB neurons, the spot of the laser diode was focused directly on the recorded MNTB neuron, and 10-ms-long uncaging pulses were given with increasing intensity (0.15 mW steps) until an AP was evoked. Experiments concerning the diameter of the AP-evoking uncaging spot were performed in whole-cell patch-clamp recordings. Despite the change in intracellular milieu, AP thresholds (WT, 1.11 ± 0.07 mW, n = 9; CaV1.3−/−, 1.16 ± 0.04 mW, n = 9) did not differ from the values obtained with extracellular recordings (WT, 1.21 ± 0.04 mW, n = 11, p = 0.22; CaV1.3−/−, 1.09 ± 0.06 mW, n = 10, p = 0.28). Therefore, we assume that the data obtained via patch-clamp recordings represent the firing behavior of MNTB neurons with native intracellular milieu.
Tracing.
Preparation and setup were as described above in Electrophysiology. A glass electrode with a tip diameter of 5–7 μm containing 10% Microruby or dextran tetramethylrhodamine (3000 molecular weight; Invitrogen) in ACSF was moved 15 μm into the MNTB. The dye was pressure injected by applying a series of 400–600 and 300-ms-long pulses (10–15 psi, 1 Hz picospritzer; PDES-2T; NPI). In some cases, single MNTB neurons were patch-clamped as described above with 0.5% biocytin (Biomol) added to the pipette solution. Current pulses of 100 ms duration and 15 pA amplitude were applied 30 times, and the patch pipette was then slowly retracted. Slices were stored in ACSF for 2–4 h, after which they were transferred into 4% PFA at 4°C and stored overnight. In case of biocytin fills, slices were stored in 25% sucrose and 10% glycerol in 0.01 m phosphate buffer, pH 7.4, and subsequently frozen at −80°C for 10 min. After thawing and rinsing in 0.5% Triton X-100/PBS, slices were blocked for 1 h in 3% bovine serum albumin, 10% goat serum, and 0.3% Triton X-100 in PBS, pH 7.4. Streptavidin conjugated with Cy3 (Jackson ImmunoResearch) was added to a final concentration of 1:200. After 90 min incubation, slices were rinsed in PBS, mounted, and air dried. Homemade mounting medium including antifading substances was used to cover the sections. Images were taken on an LSM 700 confocal microscope (Zeiss) equipped with a solid state laser (555 nm) and a 559 nm long-pass filter. A Plan-Neofluar 40×/1.3 objective (Zeiss) was used, and pinhole settings were chosen to achieve optical sections of 1 μm thickness. Typically, two to three axons showed successful tracing. Axons were reconstructed using the ImageJ plug-in Fiji medicine. Convex hull analysis was performed on MNTB arbors starting from the first branch point in the LSO using the ImageJ plug-in FracLac. For four traced axons per group, boutons were recounted by a second person who was blind to the genotype. The average count per group differed <5% between the experimenters. Overviews of the superior olivary complex were obtained with an Axioskop 2 fluorescence microscope (Zeiss) equipped with a CCD camera (DP-20; Olympus) and a Plan-Neofluar 5×/0.15 objective (Zeiss) using cell-F 3.0 (Olympus). Slight adjustments of intensity and contrast were made off-line.
Statistics.
To assess for statistical significance between all data sets except mIPSC amplitudes, data sets were checked for Gaussian distribution (Kolmogorov–Smirnov), and outliers (more than four times standard deviation above or below mean value) were excluded. Unless noted otherwise, a paired or unpaired two-tailed Student's t test was performed, with significance values of p < 0.05, p < 0.01, and p < 0.001. In case of a non-Gaussian distribution, a U test was performed with significance values as for the t test (Winstat; R. Fitch Software). Mean values and SEM are provided throughout this paper. Significant differences of mIPSC amplitudes were assessed with the Kolmogorov–Smirnov test (R software; Statistics Department of the University of Auckland, Auckland, New Zealand).
Results
Impaired developmental strengthening and elimination of MNTB–LSO projections in CaV1.3−/−
CaV1.3−/− mice (Platzer et al., 2000) display a significantly size-reduced and malformed LSO, characterized by the lack of the typical U shape present in WT (Hirtz et al., 2011). By using immunofluorescence histochemistry against the VIAAT and GlyT2, two markers for inhibitory synapses (Poyatos et al., 1997; Dumoulin et al., 1999), these abnormalities were confirmed at P12 (Fig. 1A–F) and P30 (Fig. 1G,H). Nevertheless, the presence of the markers suggested that inhibitory inputs to CaV1.3−/− LSO neurons are established.
Figure 1.
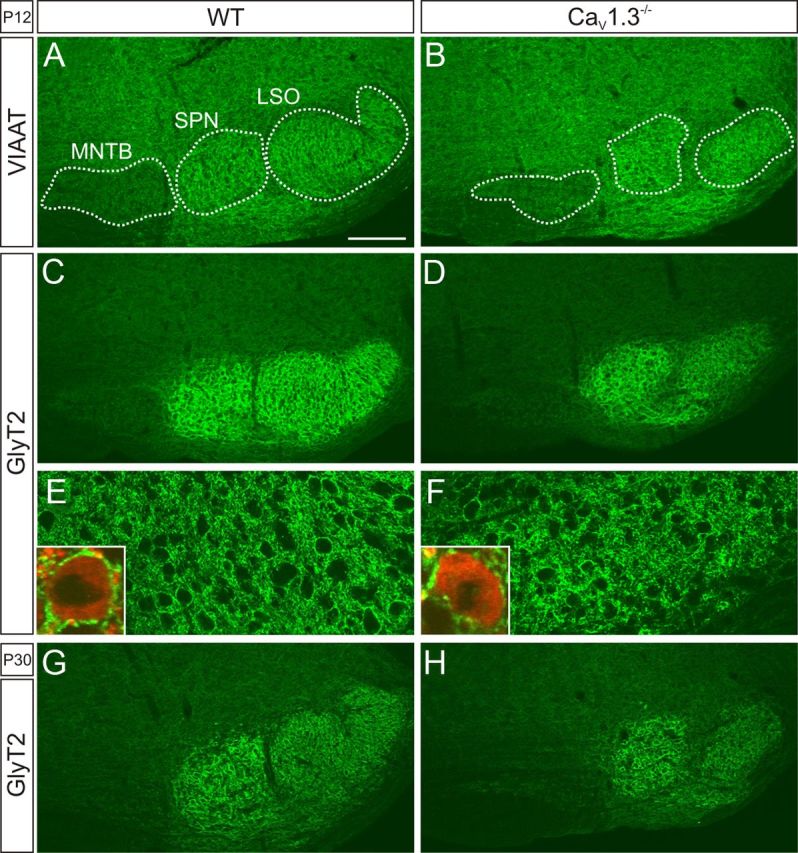
Immunohistochemical detection of inhibitory input to LSO neurons in WT and CaV1.3−/−. A–D, At P12, antibody labeling of VIAAT and GlyT2 demonstrates inhibitory synapses in the LSO of both WT and CaV1.3−/−. SPN, Superior paraolivary nucleus. E, F, GlyT2 labeling in LSO neurons at higher magnification. Insets show single LSO neurons counterstained with MAP2. G, H, In both genotypes, GlyT2 labeling was also prominent at P30. Dorsal is up, lateral to the right. Scale bar: (in A) A–D, G, H, 200 μm; E, F, 50 μm. VIAAT and GlyT2 are depicted in green; MAP2 is depicted in red.
To assess for functional inhibitory input, we performed whole-cell recordings from visually identified LSO principal neurons and electrically stimulated axons of MNTB neurons to evoke IPSCs. At P2–P4, minimal stimulation, likely to activate only a single axon (Stevens and Wang, 1994), evoked IPSCs of small and similar amplitude in both genotypes (WT, 33.6 ± 4.3 pA, n = 10; CaV1.3−/−, 35.3 ± 4.9 pA, n = 10; p = 0.8; Fig. 2A,B,E). The IPSCs represented inward currents because of the high intracellular chloride concentration used. To activate all MNTB axons converging onto a given LSO neuron, stimulus amplitudes were increased until a plateau was reached or further increases in stimulus strength resulted in reduced response amplitudes (Kim and Kandler, 2003, 2010). The maximal response amplitudes also did not differ between WT and CaV1.3−/− (WT, 0.51 ± 0.14 nA, n = 13; CaV1.3−/−, 0.58 ± 0.15 nA, n = 13; p = 0.75; Fig. 2C–E). These findings suggest normal functional inhibitory MNTB–LSO input in neonatal CaV1.3−/− mice. In contrast, P10–P12 CaV1.3−/− LSO neurons displayed fourfold weaker single axon strengths (WT, 249.0 ± 57.3 pA, n = 13; CaV1.3−/−, 64.2 ± 9.1 pA, n = 13; p = 0.0075; Fig. 3A,B,E) and twofold weaker maximal response amplitudes (WT, 2.02 ± 0.39 nA, n = 14; CaV1.3−/−, 0.94 ± 0.27 nA, n = 18; p = 0.024; Fig. 3C–E). These results suggest a drastically impaired developmental strengthening and elimination of MNTB–LSO projections in CaV1.3−/−. Interestingly, the single axon strength in WT increased sevenfold between P2 and P4 and between P10 and P12 (p = 0.0028), whereas the maximal response increased only fourfold (p = 0.0021). We estimated the average number of axons converging onto one LSO neuron by calculating the ratio between the average maximal and the average single axon response. By doing so, we determined 15 axons at P2–P4 and 8 axons at P10–P12. These values are in line with those reported by Noh et al. (2010). Results obtained from CaV1.3−/− mice were dramatically different, as the single axon strength increased merely by a factor of two between P2 and P4 and between P10 and P12 (p = 0.012). Even more strikingly, the maximal response did not increase significantly (p = 0.26). Estimation of average axon numbers yielded 16 at P2–P4 and 15 at P10–P12, demonstrating virtually no elimination of projections, in clear contrast to the WT (Fig. 3F).
Smaller mIPSC amplitudes and fewer synaptic boutons in CaV1.3−/−
The weaker single axon strength in P10–P12 CaV1.3−/− LSO neurons can result from a reduced release probability of synaptic vesicles, a smaller quantal size, postsynaptic changes, and/or a lower number of release sites. Interestingly, PPR did not differ between genotypes (WT, 0.91 ± 0.09, n = 6; CaV1.3−/−, 0.90 ± 0.06, n = 6; p = 0.91; Fig. 4A), arguing against a lower release probability. To assess for a smaller quantal size and changes in postsynaptic properties, mIPSCs were recorded from P11–P13 LSO neurons. Their rate was reduced in CaV1.3−/− (WT, 3.4 ± 1.1 s−1, n = 7; CaV1.3−/−, 0.6 ± 0.2 s−1, n = 7; p = 0.04; Fig. 4B). The distribution of mIPSC peak amplitudes (mean WT, 61.2 pA; CaV1.3−/−, 45.4 pA) was significantly different (p = 3.93 × 10⁻¹⁰, Kolmogorov–Smirnov; 35 events per neuron; Fig. 4C). The 50% value in CaV1.3−/− neurons was reduced by 36.6% (WT, 53.8 pA; CaV1.3−/−, 34.1 pA), reflecting a smaller quantal size and/or postsynaptic changes. Nevertheless, the reduction cannot fully explain the fourfold difference in single axon strength. Rather, it appears that the addition of new release sites within a single CaV1.3−/− MNTB axon is impaired. This is corroborated by the lower rate of mIPSCs in CaV1.3−/−. The idea that an addition of new release sites is the major component of the developmental increase in single fiber strength was originally proposed by Kim and Kandler (2010).
Figure 4.
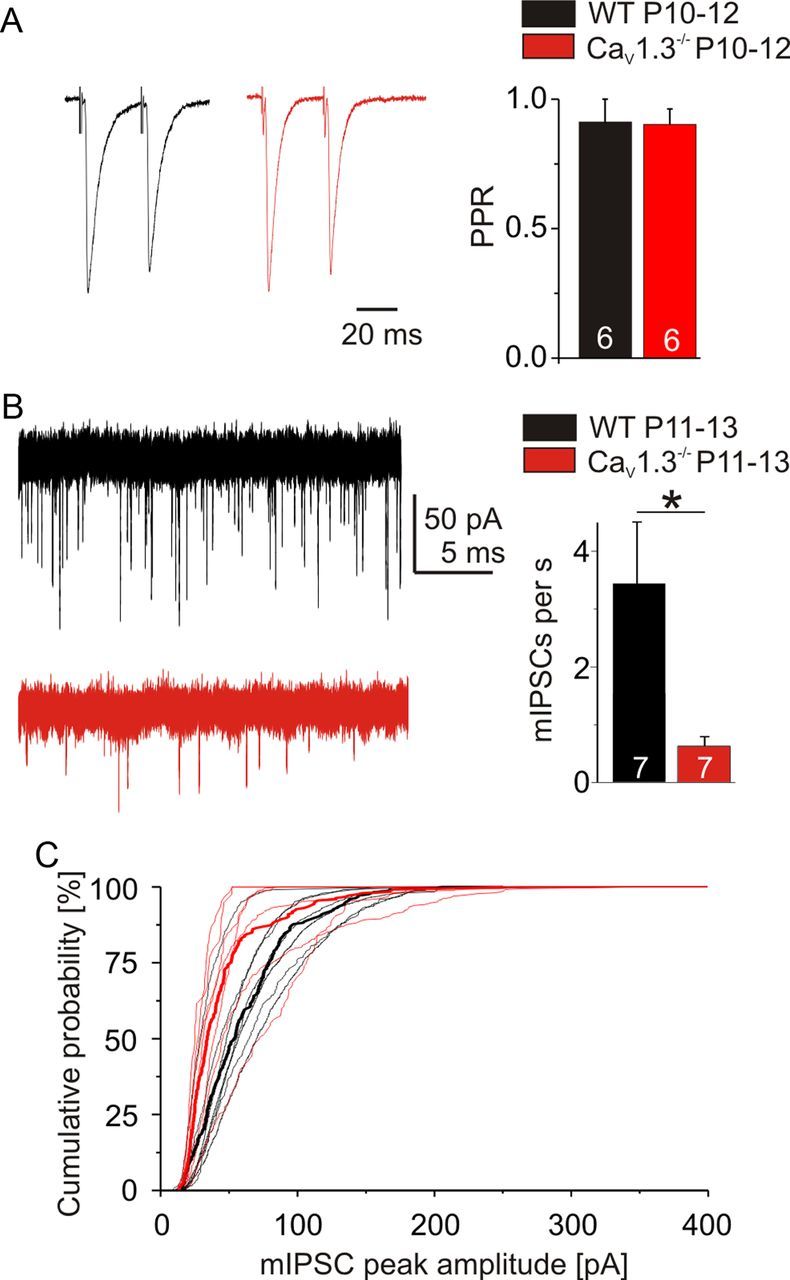
Characteristics of synaptic transmission in WT and CaV1.3−/−. A, Representative paired-pulse recordings at 30 ms pulse interval in WT (black trace) and CaV1.3−/− (red trace) at P10–P12. Averages of 40 evoked IPSCs. B, Recordings of mIPSCs in WT (black trace) and CaV1.3−/− (red trace) at P11–P13 and statistical analysis of event rate. C, Cumulative histograms of mIPSC peak amplitudes in WT (black) and CaV1.3−/− (red). Thin lines represent values of single neurons (7 for each genotype). Thick lines represent pooled amplitudes of the first 35 mIPSCs of each neuron. *p < 0.05.
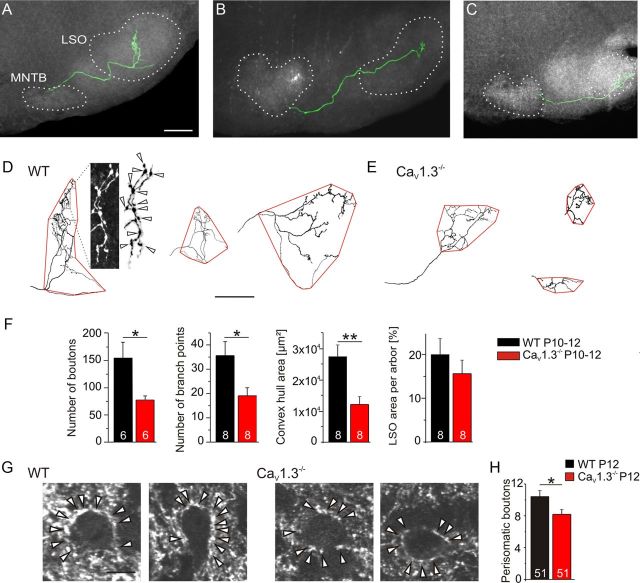
To assess the issue of release sites morphologically, axons of single MNTB neurons were traced in P10–P12 slices (Fig. 5A–C). The number of boutons on single MNTB axon arbors in the LSO was reduced by 51% in CaV1.3−/− (WT, 154 ± 28, n = 6; CaV1.3−/−, 76 ± 6, n = 6; p = 0.04; Fig. 5D–F). The number of branch points was reduced by a similar amount (47%, WT, 36 ± 6, n = 8; CaV1.3−/−, 19 ± 3, n = 8; p = 0.022; Fig. 5D–F). While these twofold reductions do not explain the fourfold lower single axon strength at a first glance, one has to take into account that a CaV1.3−/− LSO neuron at P10–P12 is innervated by approximately two times more MNTB neurons than its WT counterpart (15 vs 8, see Fig. 3F). Based on these data and our previous finding that the ratio of MNTB to LSO neurons is very similar between CaV1.3−/− and WT at P12 (1.4 vs 1.6) (Hirtz et al., 2011), a CaV1.3−/− MNTB axon most probably innervates twice as many LSO neurons as its WT counterpart. We verified a reduced number of inhibitory synapses in CaV1.3−/− by counting VIAAT-immunoreactive perisomatic boutons: on average, CaV1.3−/− LSO somata were surrounded by 21% fewer boutons (WT, 10.4 ± 0.8, n = 51; CaV1.3−/−, 8.2 ± 0.7, n = 51; p = 0.025; Fig. 5G,H).
Figure 5.
Reduced MNTB axon arbor morphology in CaV1.3−/− at P10–P12. A, Example of a traced and graphically reconstructed (green) WT MNTB axon obtained by single cell biocytin filling. Branches in nuclei other than the LSO are not shown. Borders of MNTB and LSO are outlined. B, Like A, but obtained via pressure dye injection. C, Like A, but obtained in CaV1.3−/−. D, Reconstruction of MNTB axon arbors in WT LSO, displaying the convex hull analysis (outlined in red). The first two reconstructions correspond to A and B. Details of the leftmost reconstruction are shown in a high-magnification fluorescence photomicrograph, and boutons are marked adjacent by arrowheads. E, Like D, but obtained in CaV1.3−/−. The first reconstruction corresponds to C. Dorsal is up, and lateral is to the right. F, Statistical analysis. A comparison between WT and CaV1.3−/− is shown. G, High-magnification photomicrographs of P12 WT and CaV1.3−/− LSO neurons in VIAAT-labeled sections. Perisomatic boutons are marked by arrowheads. H, Statistical analysis. Comparison of the number of perisomatic boutons between WT and CaV1.3−/−. *p < 0.05; **p < 0.01. Scale bars: (in A) A–C, 200 μm; (in D) D, E, 100 μm; G, 10 μm.
The structural development of the MNTB–LSO projection is characterized by an increase in the LSO area occupied by single MNTB axon arbors until P10–P13, with an unchanged percentage of the covered LSO area (Sanes and Siverls, 1991). The average size of the area occupied by a single CaV1.3−/− MNTB axon arbor was reduced to 43.4% (WT, 27,814 ± 3,854 μm2, n = 8; CaV1.3−/−, 12,065 ± 2,512 μm2, n = 8; p = 0.004; Fig. 5D–F), which is another indication of impaired development. As expected, the percentage of the LSO area occupied by single axon arbors did not differ between genotypes (WT, 20.0 ± 3.6%, n = 8; CaV1.3−/−, 15.6 ± 3.1%, n = 8; p = 0.38; Fig. 5F). At a first glance, this appears to be counterintuitive to a higher convergence ratio in CaV1.3−/−. However, LSO neurons are more densely packed in CaV1.3−/− mice, and bipolar CaV1.3−/− LSO neurons display a larger dendritic field (Hirtz et al., 2011), implying that changes in the cytoarchitecture of these postsynaptic neurons contribute to the higher convergence ratio.
Broader synaptic input width of LSO neurons in CaV1.3−/−
A hallmark of the development of the inhibitory MNTB–LSO map is a twofold sharpening of functional topography via elimination of projections (Kim and Kandler, 2003; Noh et al., 2010). As the elimination is impaired in CaV1.3−/− mice (Fig. 3), one would expect a larger area of the MNTB projecting to one LSO neuron. To focus on this issue, MNI-caged glutamate was photolyzed focally in the MNTB of P10–P12 animals while recording from a single LSO neuron (“mapping”). The region in which uncaging evoked synaptic responses in a fine raster protocol was defined as the input area of a single LSO neuron (for details, see Materials and Methods). In CaV1.3−/−, the input area was twofold broader along the mediolateral axis (WT, 23.5 ± 3.6 μm, n = 22; CaV1.3−/−, 42.7 ± 4.9 μm, n = 22; p = 0.0029; Fig. 6), nicely matching with the nearly twofold higher number of axons converging onto one LSO neuron. In contrast, the width along the dorsoventral axis was unchanged (WT, 42.1 ± 9.8 μm, n = 22; CaV1.3−/−, 48.7 ± 7.8 μm, n = 22; p = 0.6). Repeating the mapping in WT in some cases to test the reliability of our experimental setup revealed no differences between runs (23.4 ± 5.9 μm and 18.1 ± 5.0 μm mediolateral, n = 7; p = 0.23; 54.4 ± 25.7 μm and 59.1 ± 24.6 μm dorsoventral; p = 0.16). Normalizing the input area widths to the extent of the MNTB resulted in a higher value along the mediolateral axis (WT, 7.0 ± 1.2%, n = 22; CaV1.3−/−, 12.0 ± 1.2%, n = 22; p = 0.005), with no change in the dorsoventral axis (WT, 20.1 ± 4.5%, n = 22; CaV1.3−/−, 32.7 ± 5.0%, n = 22; p = 0.07; Fig. 6B). These data again demonstrate a failure of the refinement of the MNTB–LSO projection in CaV1.3−/−.
Figure 6.
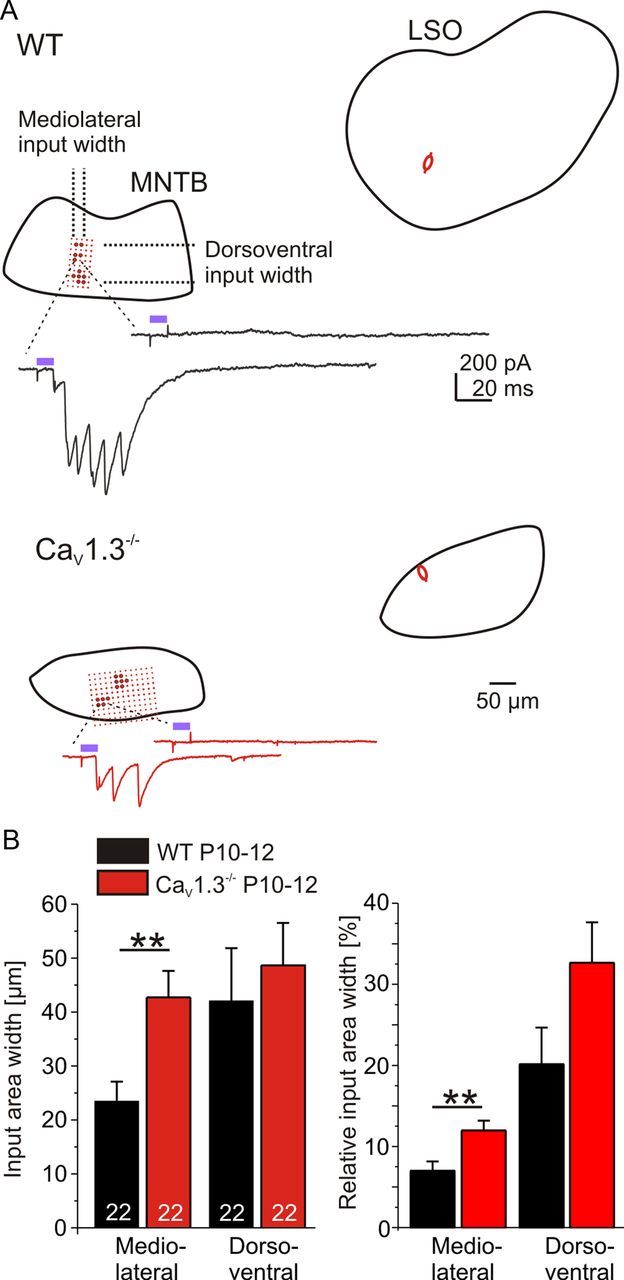
Broader synaptic input width to LSO neurons in CaV1.3−/− at P10–P12. A, Exemplary results from mapping experiments in WT and CaV1.3−/−. Spots in the MNTB mark the uncaging sites in the focal raster protocol. The focal raster had been initially determined by scanning the complete MNTB using a coarse raster. Big spots in the MNTB mark positions at which photolysis of MNI-caged glutamate led to IPSCs in the patch-clamped LSO neuron, whose position is depicted by a schematic cell. For each genotype, current traces of a successful and an unsuccessful stimulation are shown exemplarily. Violet bars in example traces depict laser pulse duration. B, Statistical analysis. A Comparison between WT and CaV1.3−/− is shown. Relative input area width depicts values normalized to the MNTB extent. **p < 0.01.
To assess possible changes in stimulus conditions in CaV1.3−/−, cell-attached recordings were made from P10–P12 MNTB neurons. MNI-caged glutamate was photolyzed around the recorded MNTB neuron (Fig. 7A). The widths of the area in which uncaging evoked APs in the MNTB neuron did not differ between genotypes along either the mediolateral or dorsoventral axis are as follows: mediolateral, WT, 20.0 ± 3.8 μm (n = 7); CaV1.3−/−, 23.8 ± 1.8 μm (n = 8; p = 0.37); dorsoventral, WT, 14.3 ± 2.0 μm (n = 7); CaV1.3−/−, 21.3 ± 4.4 μm (n = 8; p = 0.19; Fig. 7B). Likewise, the laser intensity needed to reach the AP threshold did not differ between genotypes (WT, 1.21 ± 0.04 mW, n = 11; CaV1.3−/−, 1.09 ± 0.06 mW, n = 10; p = 0.092; Fig. 7B). These results demonstrated unchanged stimulus conditions in CaV1.3−/−.
Figure 7.
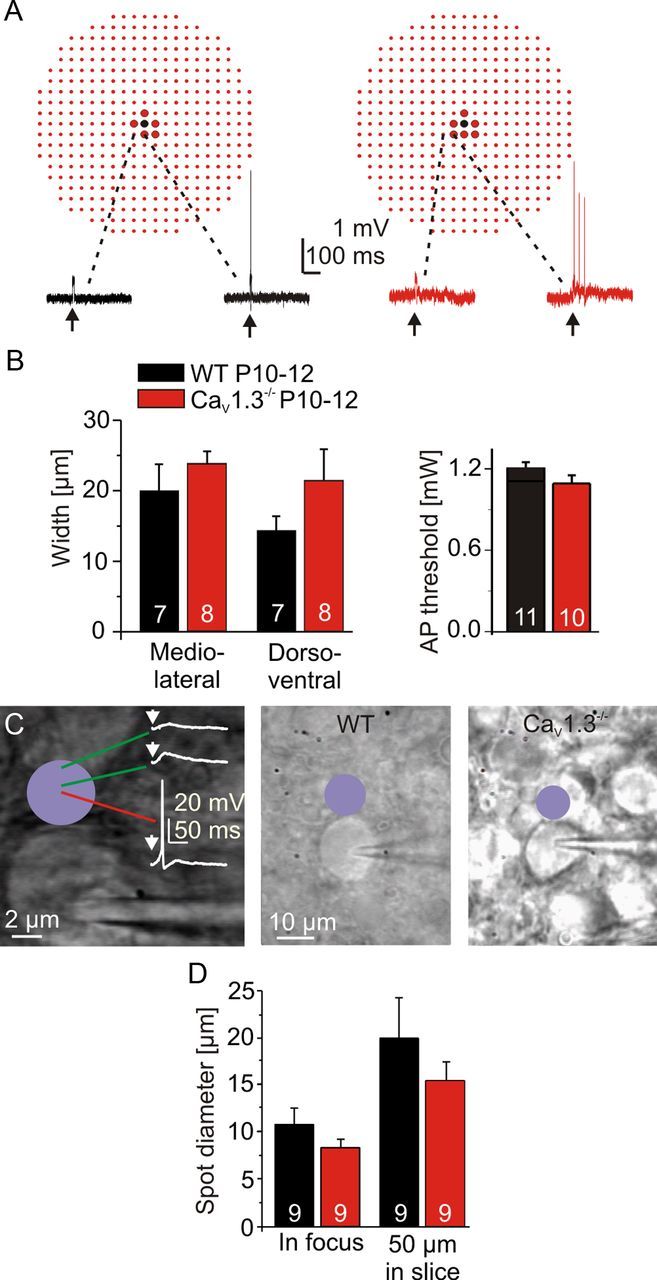
Unchanged mapping stimulus conditions in CaV1.3−/− at P10–P12. A, Extracellular recordings of two MNTB neurons (black traces, WT; red traces, CaV1.3−/−). Spots (10 μm distance) depict locations at which MNI-caged glutamate was photolyzed; black spot marks location of soma. Big spots depict locations at which APs were evoked, and small spots depict unsuccessful sites. Activation of the laser is marked by arrows. B, Statistical analysis of AP-evoking area and AP threshold between WT and CaV1.3−/−. C, To determine the AP-evoking spot diameter of an uncaging pulse, the spot was moved in 0.5 μm steps toward a patch-clamped MNTB neuron until an AP was evoked. Activation of the laser is marked by arrows. D, Statistical analysis of spot diameters at two different focal planes between WT and CaV1.3−/−.
To determine the spatial resolution of the uncaging setup, we estimated the diameter of the AP-evoking uncaging spot. To do so, the uncaging spot was moved in 0.5 μm steps toward the soma of the recorded MNTB neuron until APs were evoked (Fig. 7C,D). The size of the AP-evoking spot was similar in WT (10.9 ± 1.7 μm; n = 9) and CaV1.3−/− (8.4 ± 0.9 μm; n = 9; p = 0.22) when the spot was in focus of the MNTB soma. The focus was then set 50 μm into the slice as done in the mapping experiments to compensate for the loss of intensity in the tissue. As expected, the diameter of the spot increased to 20.0 ± 4.3 μm (n = 9) in WT and 15.5 ± 2.0 μm (n = 9) in CaV1.3−/−, but it did not differ between genotypes (p = 0.36).
Imprecise mediolateral topography of the MNTB–LSO projection in CaV1.3−/−
The data obtained in the mapping experiments allowed a reconstruction of the MNTB–LSO projection, in which the straight mediolateral pattern in the MNTB is mapped onto a curved mediolateral pattern in the LSO (Guinan et al., 1972; Sanes and Siverls, 1991). Taking the medial and lateral border as 0 and 100%, respectively, the percentile was assigned to both the LSO soma and the center of the corresponding input area within the MNTB (Fig. 8A,B). As the CaV1.3−/− LSO is uncurved, we assumed a straight topographic axis. As expected, the locations of input areas and LSO neurons highly correlated in P10–P12 WT mice (R2 = 0.87; Fig. 8C). In comparison, CaV1.3−/− maps displayed an R2 value of 0.64, demonstrating a roughly mediolateral topography, albeit less ordered (Fig. 8D). Although a straight line is a reasonable first-order assumption, it is also possible that the tonotopic axis is still curved in the CaV1.3−/− LSO. To take this caveat into account, we projected U-shaped axes into the CaV1.3−/− LSOs. We obtained an R2 value of 0.66, which did not differ from the one obtained in the straight map, indicating that the caveat is of no concern. The positions of the recorded LSO neurons were not correlated with the mediolateral input widths, neither in WT (R2 = 0.03) nor in CaV1.3−/− (R2 = 0.13, straight tonotopic axis). The same holds true for the dorsoventral input widths (WT, R2 = 0.06; CaV1.3−/−, R2 = 0.03). This implies that there is no topographic gradient of the number of MNTB neurons projecting to one LSO neuron.
Figure 8.
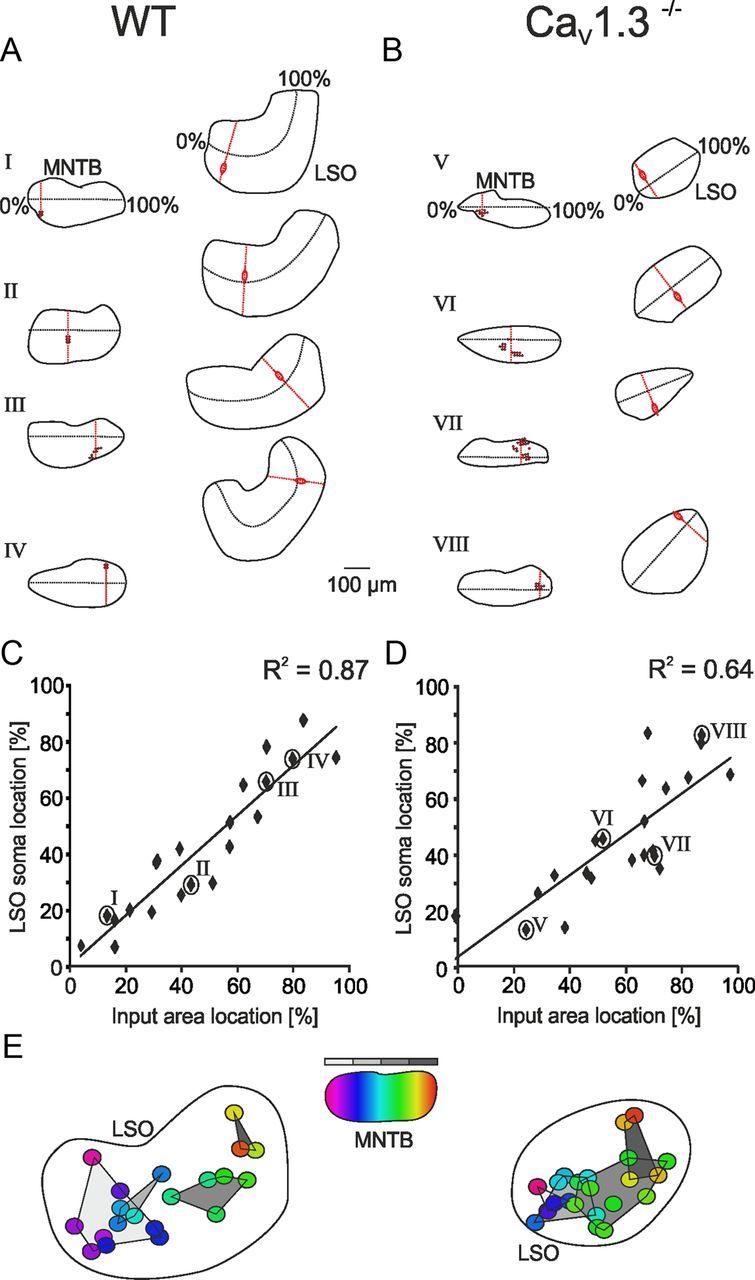
Imprecise topography of the MNTB–LSO projection in P10–P12 CaV1.3−/− mice. A, B, Exemplary results from mapping experiments in WT and CaV1.3−/−. Black stippled lines depict presumed topographic axes. Note aberrant topography in map VII in CaV1.3−/−. C, D, Correlation between center of input areas within the MNTB and location of recorded LSO neurons. Percentage values and roman numerals as depicted in A and B. E, Semischematic overlay of all LSO somata, with a color code with respect to the center of the input area in MNTB (purple and red correspond to medial and lateral, respectively). Gray areas depict projections originating from the four mediolateral MNTB quarters (light and dark gray correspond to medial and lateral, respectively).
Generating an overlay of all maps and assigning a color code to each LSO soma that corresponds to the appropriate location of its input area clearly visualized the impaired topographic precision in CaV1.3−/−. In WT, projections from the mediolateral MNTB quarters terminated in confined LSO regions with very little overlap (Fig. 8E). Overlap occurred only between quarter one and two, which shared 5.9% in common. In contrast, projections from the MNTB quarters terminated in a less confined manner in the CaV1.3−/− LSO, as evidenced by considerable overlap between adjacent quarters (one/two, 10.4%; two/three, 8.9%; three/four, 9.9%).
Impaired downregulation of GABAergic component in CaV1.3−/− around hearing onset
Synaptic responses of the MNTB–LSO projection become briefer during development (Nabekura et al., 2004; Kim and Kandler, 2010). The decay time constant of IPSCs evoked by minimal stimulation decreased markedly with age in WT, but not in CaV1.3−/− (WT, P2–P4, 17.8 ± 2.5 ms, n = 7; P10–P12, 6.4 ± 0.7 ms, n = 13; p = 0.0033; CaV1.3−/−, P2–P4, 16.9 ± 2.5 ms, n = 10; P10–P12, 10.8 ± 1.7 ms, n = 13; p = 0.05, Fig. 9A,B). Whereas both genotypes did not differ at P2–P4 (p = 0.79), responses at P10–P12 lasted longer in CaV1.3−/− than in WT (p = 0.023). The 10–90% rise time value decreased with age both in WT and CaV1.3−/− (WT, P2–P4, 1.72 ± 0.26 ms, n = 7; P10–P12, 1.09 ± 0.16 ms, n = 13; p = 0.046; CaV1.3−/−, P2–P4, 2.32 ± 0.3 ms, n = 10; P10–P12, 1.33 ± 0.19 ms, n = 13; p = 0.008) but did not differ between genotypes (P2–P4, p = 0.18; P10–P12, p = 0.34).
Figure 9.
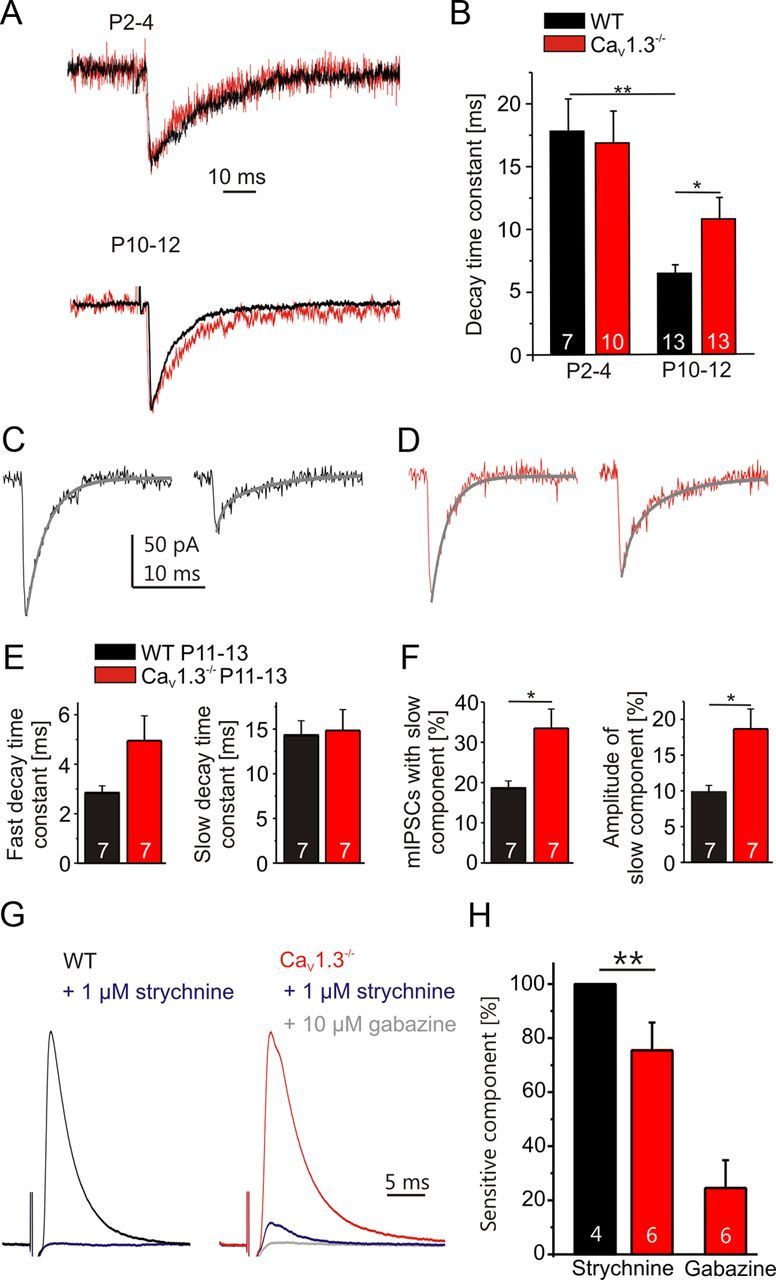
GABAergic component in CaV1.3−/− close to hearing onset. A, Representative peak-aligned synaptic responses from single axon stimulation in WT (black traces) and CaV1.3−/− (red traces). B, Statistical analysis of decay time constants obtained after minimal stimulation. C, Examples of a monoexponential mIPSC (left) and a biexponential mIPSC (right) in P12 WT. The fit is shown in gray. D, As in C, but for P12 CaV1.3−/−. E, Statistical analysis of the fast and slow mIPSC decay time constants. F, Statistical analysis of the percentage of biexponential mIPSCs as well as the contribution of the slow component to the peak amplitude of all mIPSCs. G, Pharmacological analysis of electrically evoked IPSCs (averages of 40 responses) in WT and CaV1.3−/−. Synaptic responses are normalized to the recordings in the absence of drugs. H, Statistical analysis of drug-sensitive components. *p < 0.05; **p < 0.01.
During early development, the MNTB–LSO projection involves a combination of GABAergic and glycinergic transmission, with the GABAergic component becoming reduced with age (Kotak et al., 1998; Nabekura et al., 2004). In mice, only the glycinergic transmission remains around hearing onset (Kim and Kandler, 2010). As GABA receptors display slower kinetics than glycine receptors (Jonas et al., 1998), our results of IPSC kinetics may be explained by an impaired downregulation of the GABAergic component in CaV1.3−/−. To assess the contribution of a fast and a slow component to synaptic transmission, all P11–P13 mIPSCs were best fitted concerning their decay characteristics (monoexponential or biexponential) (for details, see Materials and Methods). Both genotypes displayed monoexponential and biexponential mIPSCs (Fig. 9C,D). The fast decay time constant (pooled monosynaptic decays and fast component of biexponential decays) did not differ between genotypes (WT, 2.8 ± 0.3 ms, n = 7; CaV1.3−/−, 5.0 ± 1.0 ms, n = 7; p = 0.082; Fig. 9E), and the same result was found for the slow decay time constant of biexponential mIPSCs (WT, 14.3 ± 1.6 ms, n = 7; CaV1.3−/−, 14.9 ± 2.3 ms, n = 7; p = 0.85; Fig. 9E). However, the fraction of biexponential mIPSCs was twofold larger in CaV1.3−/− (WT, 18.6 ± 1.8%, n = 7; CaV1.3−/−, 33.5 ± 4.8%, n = 7; p = 0.02; Fig. 9F). Likewise, the contribution of the slow component to the peak amplitude was twofold larger in CaV1.3−/−, pointing toward a considerable GABAergic component in CaV1.3−/− close to hearing onset (WT, 9.8 ± 1.0%, n = 7; CaV1.3−/−, 18.7 ± 2.8%, n = 7; p = 0.019; Fig. 9F).
In the next set of experiments, we again elicited IPSCs in LSO neurons by electrically stimulating MNTB axons. Because of the low intracellular chloride concentration used, IPSCs were outward currents. In P11–P13 WT neurons, the responses were completely blocked by 1 μm strychnine (n = 4), whereas they were incompletely blocked in age-matched CaV1.3−/− neurons (75.5 ± 10.3%; n = 6; p = 0.0083; U test; Fig. 9G,H). The strychnine-resistant component was completely blocked by the addition of 10 μm gabazine. These results imply an impaired developmental downregulation of the GABAergic component in the MNTB–LSO projection in CaV1.3−/−. Nevertheless, an impaired developmental change of the glycine receptor subunits, which would hinder the fastening of decay kinetics (Takahashi et al., 1992; Singer et al., 1998), may also be involved. Together, the results from our pharmacological/electrophysiological experiments corroborate the conclusion of impaired inhibitory neurotransmission in the MNTB–LSO projection of CaV1.3−/− mice.
Immunohistochemical analysis of GABAergic and glycinergic synapses in the LSO
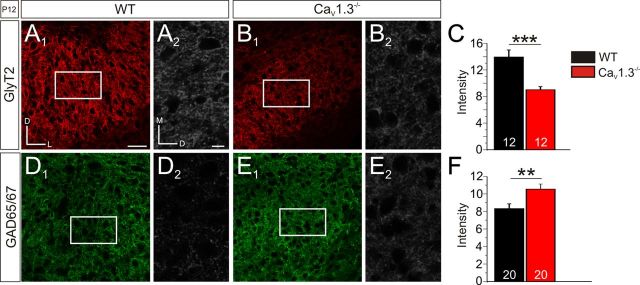
To further address the issue of an impaired developmental downregulation of GABAergic neurotransmission in the LSO of CaV1.3−/− mice, we extended our study toward an anatomical analysis and performed quantitative immunohistochemical experiments. To do so, we used antibodies against GAD65/GAD67 (glutamate decarboxylase isoforms 65 and 67) and GlyT2 as specific markers for GABAergic and glycinergic synapses, respectively. Quantification of the GlyT2 immunofluorescent signals (gray value analysis; ROI in the central LSO; size, 120 × 70 μm) at P12 revealed 1.5-fold higher values for WT than for CaV1.3−/− mice (WT, 13.9 ± 1.1, n = 12 ROIs in 3 animals; CaV1.3−/−, 9.1 ± 0.5, n = 12 ROIs in 3 animals; p = 0.0007; Fig. 10A–C). The reverse pattern was found for GAD65/67, as immunoreactivity was significantly higher in CaV1.3−/− (WT, 8.3 ± 0.5, n = 20 ROIs in 3 animals; CaV1.3−/−, 10.5 ± 0.6, n = 20 ROIs in 3 animals; p = 0.008; Fig. 10D--F). Together, these results are consistent with the electrophysiological findings of an impaired downregulation of GABAergic transmission upon loss of CaV1.3 function.
Figure 10.
Reduced GlyT2 and increased GAD65/67 levels in the LSO of P12 CaV1.3−/−. A, B, Representative coronal sections through the LSO, illustrating GlyT2 immunosignals and the rectangular ROIs (70 × 120 μm) used for gray value analysis in WT (A1, A2) and CaV1.3−/− (B1, B2). Notice that the high-magnification frames in A2 and B2 have been rotated clockwise by 90°. C, Statistical analysis. A comparison of the GlyT2 immunosignal intensity between WT and CaV1.3−/− is shown (8 bit scale). D–F, Like A–C, but obtained for GAD65/67. Scale bars: (in A1) A1, B1, D1, E1, 50 μm; (in A2) A2, B2, D2, E2, 10 μm. **p < 0.01; ***p < 0.001. Numbers in bars depict the number of analyzed ROIs. Dorsal is up, and lateral to the right in A1, B1, D1, and E1.
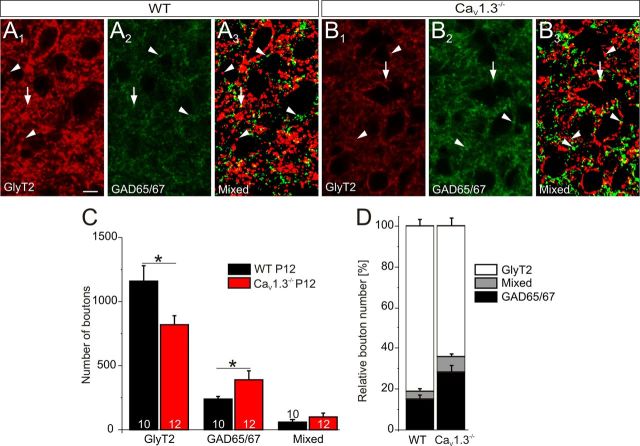
In a second approach, we determined the number of immunoreactive synaptic boutons at P12, again by analyzing ROIs in the central LSO (120 × 70 μm2). We distinguished between a purely GlyT2-immunopositive, a purely GAD65/67-immunopositive, and a mixed phenotype (Fig. 11A1–B3). In CaV1.3−/−, the number of purely GlyT2-immunopositive boutons was 1.4-fold lower than in WT (WT, 1161.6 ± 116.8, n = 12 ROIs in 3 animals; CaV1.3−/−, 815.6 ± 71.5, n = 12 ROIs in 3 animals; p = 0.018; Fig. 11C), In contrast, GAD65/67-immunopositive boutons were ∼1.7-fold more abundant in CaV1.3−/− compared to WT (WT, 234.1 ± 28.2; n = 12 ROIs in 3 animals; CaV1.3−/−, 390.6 ± 64.9; n = 12 ROIs in 3 animals; p = 0.044; Fig. 11C). Both results are in line with the gray value analysis. No significant difference was found for coimmunopositive boutons (WT, 60.3 ± 14.4, n = 12 ROIs in 3 animals; CaV1.3−/−, 103.4 ± 25.5, n = 12 ROIs in 3 animals; p = 0.166; Fig. 11C). The relative frequency of the three bouton types amounted to 28% GAD65/67, 65% GlyT2, 7% mixed in CaV1.3−/− versus 15% GAD65/67, 81% GlyT2, 4% mixed in WT (Fig. 11D), further illustrating the difference between genotypes. In summary, the immunohistochemical results provided further evidence that the shift from GABAergic to glycinergic transmission in the MNTB–LSO projection is controlled by CaV1.3 activity.
Figure 11.
Decreased number of GlyT2-immunopositive boutons, yet increased number of GAD65/67-immunopositive boutons and in the LSO neuropil of P12 CaV1.3−/−. A1–A3, Representative confocal images of WT LSO neurons, illustrating immunosignals for GlyT2 (A1), GAD65/67 (A2), and the overlay of binary images (A3). Arrowheads depict purely GlyT2- or purely GAD65/67-immunopositive boutons, whereas arrows depict those with a mixed phenotype. B1–B3, Like A1–A3, but obtained for CaV1.3−/−. C, Statistical analysis. A comparison between WT and CaV1.3−/− is shown. Numbers in bars depict the number of analyzed ROIs. D, Relative contribution of the three types of synaptic boutons in WT and CaV1.3−/−. Scale bar: (in A1) A1–B3, 10 μm. *p < 0.05.
Unchanged NMDA component of the MNTB–LSO circuit
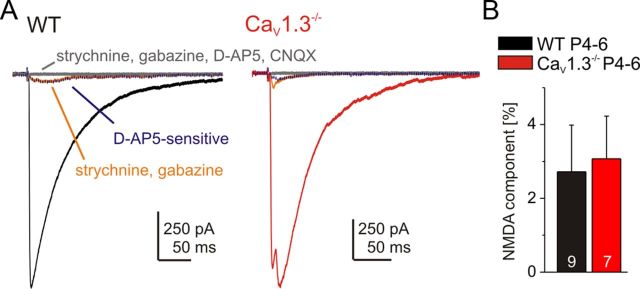
Early in postnatal development, neurotransmission in the MNTB–LSO synapses involves glutamate corelease (Gillespie et al., 2005; Case and Gillespie, 2011) which is crucially important for synapse refinement, suggesting that NMDA receptors play an important role in this process (Noh et al., 2010). As impaired NMDA receptor function may underlie the observed developmental defects in CaV1.3−/−, we assessed whether NMDA receptor-mediated transmission from MNTB to LSO is changed in CaV1.3−/−. In P4–P6 animals, MNTB axons were stimulated in Mg2+-free ACSF in the absence of any drugs. The glutamatergic component in the PSCs was isolated by application of 1 μm strychnine and 10 μm gabazine. Then, 50 μm NMDA receptor antagonist d-AP5 was applied, and the sensitive component was obtained by digital subtraction (Fig. 12A, blue traces). In some cases, a remaining component was observed, which was blocked by addition of the AMPA/kainate receptor antagonist CNQX (20 μm). Remarkably, the NMDA receptor-mediated component did not differ between the genotypes (WT, 2.7 ± 1.3%, n = 9; CaV1.3−/−, 3.1 ± 1.2%, n = 7; p = 0.84; Fig. 12B). We cannot exclude the possibility that NMDA receptor mediated transmission is altered at a later stage of development. However, the glutamatergic component of the MNTB–LSO circuit declines after the first postnatal week (Case and Gillespie, 2011), implying that we examined NMDA receptor function within the time window in which it is most crucially needed for refinement of the MNTB–LSO circuit. Together, our results argue against the idea that impaired NMDA receptor function underlies the observed defects seen in CaV1.3−/−.
Figure 12.
Unchanged NMDA receptor-mediated component in MNTB–LSO transmission of CaV1.3−/−. A, Stepwise isolation of the NMDA receptor-mediated component in WT and CaV1.3−/−. The d-AP5-sensitive trace (stippled blue line) was obtained through digital subtraction. Traces are the average of 10 responses. IPSC amplitudes in the absence of drugs were normalized. B, Statistical analysis. A comparison between WT and CaV1.3−/− is shown.
Discussion
We have investigated the development of an inhibitory neuronal map in the presence and absence of functional CaV1.3 calcium channels. Using patch-clamp recordings in combination with minimal and maximal stimulation or caged glutamate photolysis, and using single axon tracing of the auditory MNTB–LSO projection and immunohistochemistry, three major findings were obtained. First, strengthening and elimination of synaptic connections, the two major processes underlying topographic refinement in this brainstem pathway, were severely impaired in CaV1.3−/− mice at the time of hearing onset. The lower single axon strength in CaV1.3−/− was in line with reduced mIPSC amplitudes and a smaller number of boutons on single MNTB axons. Second, the mediolateral topography was less precise. Third, the developmental shift from a mixed GABA/glycinergic to a purely glycinergic transmission before hearing onset did not occur in CaV1.3−/−. Our findings establish that the development of the inhibitory MNTB–LSO projection crucially depends on functional CaV1.3 channels, providing new mechanistic insight into the maturation of inhibitory circuits.
Strengthening and elimination of synaptic connections
Our results show that both components of synaptic refinement, elimination of redundant synapses and strengthening of the remaining ones, are affected in the MNTB–LSO projection of CaV1.3−/− mice. This illustrates a mechanistic role of functional CaV1.3 channels in each of these two opposing key steps and their central importance for activity-related formation of inhibitory circuits. The central role of CaV1.3 is in contrast to the situation of the glutamatergic whisker relay synapses in the thalamus, where deletion of the glutamate receptor subunits GluA3 and/or GluA4 resulted in impaired strengthening of synapses, whereas elimination proceeded normally (Wang et al., 2011), implying that the two processes are dissociated at the level of GluA3/GluA4 signaling. Whether elimination and strengthening remain mechanistically related in the MNTB–LSO projection or become dissociated downstream of the CaV1.3-mediated signaling remains to be demonstrated. Likewise, it is unclear whether strengthening of immature GABA/glycinergic MNTB–LSO synapses precedes the elimination of redundant inputs, as was observed in other systems (Hashimoto and Kano, 2003; Coleman et al., 2010).
Our results add a new and intriguing facet to the overall mosaic that calcium channels form a molecular basis for triggering activity-dependent changes in synaptic strength. This is best known for calcium-permeable NMDA receptors in the hippocampus (Bliss and Collingridge, 1993), yet it was also reported for L-type channels in the hippocampus (Kasyanov et al., 2004), NMDA receptors in the brainstem (Rudhard et al., 2003), NMDA receptors and L-type channels in the superior colliculus (Lo and Mize, 2000; Zhao et al., 2006) and CaV1.1 L-type channels in the neuromuscular system (Chen et al., 2011), as well as CaV2.1 P/Q-type channels in the cerebellum (Hashimoto et al., 2011). To regulate the transcription machinery, calcium signals have to be conveyed from the site of their generation in the cytoplasm to the cell nucleus. Obviously, this occurs via different routes and possibly with different kinetics, depending on the source and amplitude of calcium influx (Greer and Greenberg, 2008).
Spontaneous activity and peripheral or central location of CaV1.3 channels
As the impaired synaptic refinement of the inhibitory MNTB–LSO projection in the absence of CaV1.3 channels becomes manifest before hearing onset, the activity-related role of these channels must be associated with spontaneous activity. Spontaneous cochlear activity before hearing onset, involving Ca2+ spikes that trigger glutamate release from inner hair cells (IHCs), is well documented (Beutner and Moser, 2001; Tritsch et al., 2007). Remarkably, the CaV1.3 channels are indispensable for exocytosis (Platzer et al., 2000; Brandt et al., 2003), leading to a deprivation of the central auditory system from peripheral activity in CaV1.3−/− mice. Thus, it is tempting to conclude that the impaired synaptic refinement results from the lack of cochlea-driven activity. However, we question this scenario because otoferlin−/− mice display no impaired MNTB–LSO circuit development until hearing onset (nothing is known thereafter) (Noh et al., 2010). Synaptic transmission from IHCs is otoferlin dependent (Roux et al., 2006; Beurg et al., 2010); therefore, otoferlin−/− mice are deprived of cochlea-driven spontaneous activity, like CaV1.3−/− mice. Alternatively, we postulate that proper calcium influx via CaV1.3 channels located directly in the MNTB–LSO circuit (on-site) is crucially required for normal circuit development. We also think it unlikely that alterations upstream of the MNTB–LSO circuit are pivotal, as synaptic transmission from the cochlear nuclear complex to MNTB neurons appears to be only slightly altered in CaV1.3−/− close to hearing onset, becoming more strongly altered thereafter (Erazo-Fischer et al., 2007). A striking malformation of the LSO, as observed in CaV1.3−/− (Hirtz et al., 2011), is also obvious in brainstem-specific CaV1.3 knock-out mice (Satheesh et al., 2012), providing further arguments for an essential contribution of on-site channel loss to the impaired development. Interestingly, the brainstem-specific CaV1.3 knock-out mice display altered auditory brainstem responses which, in case of increased amplitudes in wave III, point toward a higher excitability of superior olivary complex neurons (Satheesh et al., 2012). Based on our data, the higher excitability may be well explained by an impaired development of the inhibitory MNTB–LSO circuit. A final differentiation between the roles of peripheral versus central CaV1.3 channels will require cochlea-specific deletion of CaV1.3, and the generation of such knock-out mice is underway.
As LSO neurons express functional CaV1.3 channels (Hirtz et al., 2011), it is likely that the lack of CaV1.3 in the LSO neurons themselves is the crucial factor generating the observed defects. What may cause opening of postsynaptic CaV1.3 channels in the inhibitory MNTB–LSO circuit? At least two scenarios are to be considered. First, the GABA/glycinergic synapses in the MNTB–LSO pathway are depolarizing until P5–P8 due to a high intracellular chloride concentration in LSO neurons (Friauf et al., 2011). As a consequence, they provide a robust excitatory source and can activate CaV channels (Kullmann et al., 2002). Second, immature GABA/glycinergic MNTB–LSO synapses also release glutamate, which activates postsynaptic NMDA receptors (Gillespie et al., 2005). The glutamatergic component may also indirectly activate CaV1.3 channels. Its developmental importance is demonstrated by mice lacking the vesicular glutamate transporter 3: these mice also display an impaired refinement of the MNTB–LSO projection (Noh et al., 2010). In the present work, we demonstrate that the NMDA receptor-mediated component itself is unchanged in CaV1.3−/−, arguing against the idea that impaired NMDA receptor function underlies the observed defects.
To open CaV1.3 channels postsynaptically, the MNTB neurons must be electrically active. The lack of glutamate release from IHCs of CaV1.3−/− mice does not necessarily result in silencing of all central auditory regions, as another element along the neural path could generate similar activity when the primary pacemaker-like element is disrupted (Blankenship and Feller, 2010). Indeed, spontaneous activity in the cochlear nuclear complex has been reported in mice with a dysfunctional cochlea (Youssoufian et al., 2008). Interestingly, CaV1.3 channels may fulfill a slightly different role than CaV1.2 channels to provide activity-related signaling for gene regulation, because they open already at −55 mV, which is 20–25 mV lower than the value for CaV1.2 (Lipscombe et al., 2004). Thus, they can mediate long-lasting calcium influx upon relatively weak depolarization.
Imprecise topography and remaining GABAergic component
Our findings of a crude mediolateral topography in CaV1.3−/− at P10–P12, and a similar number of MNTB axons projecting to one LSO neuron at P2–P4 in WT and CaV1.3−/−, corroborate the general view that the formation of a coarse topographic map is largely independent of neural activity, and rather the result of predetermined genetic programs. Not much is known about the mechanisms that establish an initially crude topography in the auditory brainstem, but Eph protein signaling appears to be involved (Huffman and Cramer, 2007). Which steps of the development of topography in the auditory brainstem are influenced by cochlea-driven activity is subject to an ongoing discussion (Kandler et al., 2009). Our results of a less precise topography in CaV1.3−/− than in WT provide further evidence for the role of activity in fine tuning neuronal circuitry.
The immature MNTB–LSO projection involves corelease of GABA and glycine in mice, but only the faster glycinergic component remains during development (Nabekura et al., 2004; Kim and Kandler, 2010). The change is reflected by a downregulation of GAD65 (Nabekura et al., 2004) and an upregulation of GlyT2 (Friauf et al., 1999). Corelease of both transmitters is the main mode of inhibitory transmission in the immature spinal cord and brainstem (Jonas et al., 1998; O'Brien and Berger, 1999; Chéry and de Koninck, 1999; Russier et al., 2002), and a shift from GABAergic to glycinergic neurotransmission is common for these structures (Gao and Ziskind-Conhaim, 1995; Kotak et al., 1998; Keller et al., 2001; Turecek and Trussell, 2002; Nabekura et al., 2004). To the best of our knowledge, we provide the first experimental evidence that this shift may be governed by CaV1.3 channels. Moreover, our physiological and histological results imply that the specification of particular inhibitory neurotransmitter phenotype may be activity dependent.
In summary, we conclude that L-type channels of the CaV1.3 type are essential for the development of inhibitory projections, including synaptic refinement as well as the achievement of topographic precision and neurotransmitter phenotype.
Footnotes
This work was supported by Deutsche Forschungsgemeinschaft (DFG) Grant FR 1784/11-1 (E.F.), the DFG Research Training Group GRK 845 (Molecular, physiological and pharmacological analysis of cellular membrane transport), and the Marie Curie Research Training Network “CaVNET,” Contract MRTN-CT-2006-035367. We thank Dr. J. Striessnig for Cacna1d−/− mice, Dr. B. Gasnier for the VIAAT antibody, J. Winkelhoff and T. Kehrwald for excellent technical assistance, and K. Eubler for help with the decay time analysis. We are grateful to Drs. J. W. Deitmer, C. Lohr, and D. Schrenk for providing necessary facility access to the confocal microscopes. Finally, we thank Drs. M. B. Rust and F. Felmy for helpful comments on this manuscript.
References
- Beurg M, Michalski N, Safieddine S, Bouleau Y, Schneggenburger R, Chapman ER, Petit C, Dulon D. Control of exocytosis by synaptotagmins and otoferlin in auditory hair cells. J Neurosci. 2010;30:13281–13290. doi: 10.1523/JNEUROSCI.2528-10.2010. [DOI] [PMC free article] [PubMed] [Google Scholar]
- Beutner D, Moser T. The presynaptic function of mouse cochlear inner hair cells during development of hearing. J Neurosci. 2001;21:4593–4599. doi: 10.1523/JNEUROSCI.21-13-04593.2001. [DOI] [PMC free article] [PubMed] [Google Scholar]
- Blankenship AG, Feller MB. Mechanisms underlying spontaneous patterned activity in developing neural circuits. Nat Rev Neurosci. 2010;11:18–29. doi: 10.1038/nrn2759. [DOI] [PMC free article] [PubMed] [Google Scholar]
- Bliss TV, Collingridge GL. A synaptic model of memory: long-term potentiation in the hippocampus. Nature. 1993;361:31–39. doi: 10.1038/361031a0. [DOI] [PubMed] [Google Scholar]
- Brandt A, Striessnig J, Moser T. CaV1.3 channels are essential for development and presynaptic activity of cochlear inner hair cells. J Neurosci. 2003;23:10832–10840. doi: 10.1523/JNEUROSCI.23-34-10832.2003. [DOI] [PMC free article] [PubMed] [Google Scholar]
- Case DT, Gillespie DC. Pre- and postsynaptic properties of glutamatergic transmission in the immature inhibitory MNTB-LSO pathway. J Neurophysiol. 2011;106:2570–2579. doi: 10.1152/jn.00644.2010. [DOI] [PubMed] [Google Scholar]
- Chen C, Regehr WG. Developmental remodeling of the retinogeniculate synapse. Neuron. 2000;28:955–966. doi: 10.1016/s0896-6273(00)00166-5. [DOI] [PubMed] [Google Scholar]
- Chen F, Liu Y, Sugiura Y, Allen PD, Gregg RG, Lin W. Neuromuscular synaptic patterning requires the function of skeletal muscle dihydropyridine receptors. Nat Neurosci. 2011;14:570–577. doi: 10.1038/nn.2792. [DOI] [PMC free article] [PubMed] [Google Scholar]
- Chéry N, de Koninck Y. Junctional versus extrajunctional glycine and GABAA receptor-mediated IPSCs in identified lamina I neurons of the adult rat spinal cord. J Neurosci. 1999;19:7342–7355. doi: 10.1523/JNEUROSCI.19-17-07342.1999. [DOI] [PMC free article] [PubMed] [Google Scholar]
- Coleman JE, Nahmani M, Gavornik JP, Haslinger R, Heynen AJ, Erisir A, Bear MF. Rapid structural remodeling of thalamocortical synapses parallels experience-dependent functional plasticity in mouse primary visual cortex. J Neurosci. 2010;30:9670–9682. doi: 10.1523/JNEUROSCI.1248-10.2010. [DOI] [PMC free article] [PubMed] [Google Scholar]
- Dumoulin A, Rostaing P, Bedet C, Lévi S, Isambert MF, Henry JP, Triller A, Gasnier B. Presence of the vesicular inhibitory amino acid transporter in GABAergic and glycinergic synaptic terminal boutons. J Cell Sci. 1999;112:811–823. doi: 10.1242/jcs.112.6.811. [DOI] [PubMed] [Google Scholar]
- Erazo-Fischer E, Striessnig J, Taschenberger H. The role of physiological afferent nerve activity during in vivo maturation of the calyx of Held synapse. J Neurosci. 2007;27:1725–1737. doi: 10.1523/JNEUROSCI.4116-06.2007. [DOI] [PMC free article] [PubMed] [Google Scholar]
- Erzurumlu RS, Kind PC. Neural activity: sculptor of “barrels” in the neocortex. Trends Neurosci. 2001;24:589–595. doi: 10.1016/s0166-2236(00)01958-5. [DOI] [PMC free article] [PubMed] [Google Scholar]
- Friauf E, Aragón C, Löhrke S, Westenfelder B, Zafra F. Developmental expression of the glycine transporter GLYT2 in the auditory system of rats suggests involvement in synapse maturation. J Comp Neurol. 1999;412:17–37. [PubMed] [Google Scholar]
- Friauf E, Rust MB, Schulenborg T, Hirtz JJ. Chloride cotransporters, chloride homeostasis, and synaptic inhibition in the developing auditory system. Hear Res. 2011;279:96–110. doi: 10.1016/j.heares.2011.05.012. [DOI] [PubMed] [Google Scholar]
- Gao BX, Ziskind-Conhaim L. Development of glycine- and GABA-gated currents in rat spinal motoneurons. J Neurophysiol. 1995;74:113–121. doi: 10.1152/jn.1995.74.1.113. [DOI] [PubMed] [Google Scholar]
- Gillespie DC, Kim G, Kandler K. Inhibitory synapses in the developing auditory system are glutamatergic. Nat Neurosci. 2005;8:332–338. doi: 10.1038/nn1397. [DOI] [PubMed] [Google Scholar]
- Greer PL, Greenberg ME. From synapse to nucleus: calcium-dependent gene transcription in the control of synapse development and function. Neuron. 2008;59:846–860. doi: 10.1016/j.neuron.2008.09.002. [DOI] [PubMed] [Google Scholar]
- Guinan JJ, Norris BE, Guinan SS. Single auditory units in the superior olivary complex. II: Locations of unit categories and tonotopic organization. Int J Neurosci. 1972;4:147–166. [Google Scholar]
- Hashimoto K, Kano M. Functional differentiation of multiple climbing fiber inputs during synapse elimination in the developing cerebellum. Neuron. 2003;38:785–796. doi: 10.1016/s0896-6273(03)00298-8. [DOI] [PubMed] [Google Scholar]
- Hashimoto K, Tsujita M, Miyazaki T, Kitamura K, Yamazaki M, Shin HS, Watanabe M, Sakimura K, Kano M. Postsynaptic P/Q-type Ca2+ channel in purkinje cell mediates synaptic competition and elimination in developing cerebellum. Proc Natl Acad Sci U S A. 2011;108:9987–9992. doi: 10.1073/pnas.1101488108. [DOI] [PMC free article] [PubMed] [Google Scholar]
- Hell JW, Westenbroek RE, Warner C, Ahlijanian MK, Prystay W, Gilbert MM, Snutch TP, Catterall WA. Identification and differential subcellular localization of the neuronal class C and class D L-type calcium channel alpha 1 subunits. J Cell Biol. 1993;123:949–962. doi: 10.1083/jcb.123.4.949. [DOI] [PMC free article] [PubMed] [Google Scholar]
- Hirtz JJ, Boesen M, Braun N, Deitmer JW, Kramer F, Lohr C, Müller B, Nothwang HG, Striessnig J, Löhrke S, Friauf E. Cav1.3 calcium channels are required for normal development of the auditory brainstem. J Neurosci. 2011;31:8280–8294. doi: 10.1523/JNEUROSCI.5098-10.2011. [DOI] [PMC free article] [PubMed] [Google Scholar]
- Huffman KJ, Cramer KS. EphA4 misexpression alters tonotopic projections in the auditory brainstem. Dev Neurobiol. 2007;67:1655–1668. doi: 10.1002/dneu.20535. [DOI] [PubMed] [Google Scholar]
- Jonas P, Bischofberger J, Sandkühler J. Corelease of two fast neurotransmitters at a central synapse. Science. 1998;281:419–424. doi: 10.1126/science.281.5375.419. [DOI] [PubMed] [Google Scholar]
- Kakizawa S, Yamasaki M, Watanabe M, Kano M. Critical period for activity-dependent synapse elimination in developing cerebellum. J Neurosci. 2000;20:4954–4961. doi: 10.1523/JNEUROSCI.20-13-04954.2000. [DOI] [PMC free article] [PubMed] [Google Scholar]
- Kandler K. Activity-dependent organization of inhibitory circuits: lessons from the auditory system. Curr Opin Neurobiol. 2004;14:96–104. doi: 10.1016/j.conb.2004.01.017. [DOI] [PubMed] [Google Scholar]
- Kandler K, Clause A, Noh J. Tonotopic reorganization of developing auditory brainstem circuits. Nat Neurosci. 2009;12:711–717. doi: 10.1038/nn.2332. [DOI] [PMC free article] [PubMed] [Google Scholar]
- Kano M, Hashimoto K. Synapse elimination in the central nervous system. Curr Opin Neurobiol. 2009;19:154–161. doi: 10.1016/j.conb.2009.05.002. [DOI] [PubMed] [Google Scholar]
- Kasyanov AM, Safiulina VF, Voronin LL, Cherubini E. GABA-mediated giant depolarizing potentials as coincidence detectors for enhancing synaptic efficacy in the developing hippocampus. Proc Natl Acad Sci U S A. 2004;101:3967–3972. doi: 10.1073/pnas.0305974101. [DOI] [PMC free article] [PubMed] [Google Scholar]
- Katz LC, Shatz CJ. Synaptic activity and the construction of cortical circuits. Science. 1996;274:1133–1138. doi: 10.1126/science.274.5290.1133. [DOI] [PubMed] [Google Scholar]
- Keller AF, Coull JA, Chery N, Poisbeau P, de Koninck Y. Region-specific developmental specialization of GABA-glycine cosynapses in laminas I-II of the rat spinal dorsal horn. J Neurosci. 2001;21:7871–7880. doi: 10.1523/JNEUROSCI.21-20-07871.2001. [DOI] [PMC free article] [PubMed] [Google Scholar]
- Kim G, Kandler K. Elimination and strengthening of glycinergic/GABAergic connections during tonotopic map formation. Nat Neurosci. 2003;6:282–290. doi: 10.1038/nn1015. [DOI] [PubMed] [Google Scholar]
- Kim G, Kandler K. Synaptic changes underlying the strengthening of GABA/glycinergic connections in the developing lateral superior olive. Neuroscience. 2010;171:924–933. doi: 10.1016/j.neuroscience.2010.09.054. [DOI] [PMC free article] [PubMed] [Google Scholar]
- Kim G, Kandler K. Paired recordings from distant inhibitory neuron pairs by a sequential scanning approach. J Neurosci Methods. 2011;200:185–189. doi: 10.1016/j.jneumeth.2011.06.005. [DOI] [PMC free article] [PubMed] [Google Scholar]
- Kirsch J, Betz H. Glycine-receptor activation is required for receptor clustering in spinal neurons. Nature. 1998;392:717–720. doi: 10.1038/33694. [DOI] [PubMed] [Google Scholar]
- Kotak VC, Korada S, Schwartz IR, Sanes DH. A developmental shift from GABAergic to glycinergic transmission in the central auditory system. J Neurosci. 1998;18:4646–4655. doi: 10.1523/JNEUROSCI.18-12-04646.1998. [DOI] [PMC free article] [PubMed] [Google Scholar]
- Kullmann PH, Ene FA, Kandler K. Glycinergic and GABAergic calcium responses in the developing lateral superior olive. Eur J Neurosci. 2002;15:1093–1104. doi: 10.1046/j.1460-9568.2002.01946.x. [DOI] [PMC free article] [PubMed] [Google Scholar]
- Lichtman JW, Colman H. Synapse elimination and indelible memory. Neuron. 2000;25:269–278. doi: 10.1016/s0896-6273(00)80893-4. [DOI] [PubMed] [Google Scholar]
- Lipscombe D, Helton TD, Xu W. L-Type calcium channels: the low down. J Neurophysiol. 2004;92:2633–2641. doi: 10.1152/jn.00486.2004. [DOI] [PubMed] [Google Scholar]
- Lo FS, Mize RR. Synaptic regulation of L-type Ca(2+) channel activity and long-term depression during refinement of the retinocollicular pathway in developing rodent superior colliculus. J Neurosci. 2000;20:RC58. doi: 10.1523/JNEUROSCI.20-03-j0003.2000. [DOI] [PMC free article] [PubMed] [Google Scholar]
- Lorenzetto E, Caselli L, Feng G, Yuan W, Nerbonne JM, Sanes JR, Buffelli M. Genetic perturbation of postsynaptic activity regulates synapse elimination in developing cerebellum. Proc Natl Acad Sci U S A. 2009;106:16475–16480. doi: 10.1073/pnas.0907298106. [DOI] [PMC free article] [PubMed] [Google Scholar]
- Moosmang S, Haider N, Klugbauer N, Adelsberger H, Langwieser N, Müller J, Stiess M, Marais E, Schulla V, Lacinova L, Goebbels S, Nave KA, Storm DR, Hofmann F, Kleppisch T. Role of hippocampal Cav1.2 Ca2+ channels in NMDA receptor-independent synaptic plasticity and spatial memory. J Neurosci. 2005;25:9883–9892. doi: 10.1523/JNEUROSCI.1531-05.2005. [DOI] [PMC free article] [PubMed] [Google Scholar]
- Nabekura J, Katsurabayashi S, Kakazu Y, Shibata S, Matsubara A, Jinno S, Mizoguchi Y, Sasaki A, Ishibashi H. Developmental switch from GABA to glycine release in single central synaptic terminals. Nat Neurosci. 2004;7:17–23. doi: 10.1038/nn1170. [DOI] [PubMed] [Google Scholar]
- Noh J, Seal RP, Garver JA, Edwards RH, Kandler K. Glutamate co-release at GABA/glycinergic synapses is crucial for the refinement of an inhibitory map. Nat Neurosci. 2010;13:232–238. doi: 10.1038/nn.2478. [DOI] [PMC free article] [PubMed] [Google Scholar]
- O'Brien JA, Berger AJ. Cotransmission of GABA and glycine to brain stem motoneurons. J Neurophysiol. 1999;82:1638–1641. doi: 10.1152/jn.1999.82.3.1638. [DOI] [PubMed] [Google Scholar]
- Platzer J, Engel J, Schrott-Fischer A, Stephan K, Bova S, Chen H, Zheng H, Striessnig J. Congenital deafness and sinoatrial node dysfunction in mice lacking class D L-type Ca2+ channels. Cell. 2000;102:89–97. doi: 10.1016/s0092-8674(00)00013-1. [DOI] [PubMed] [Google Scholar]
- Poyatos I, Ponce J, Aragón C, Giménez C, Zafra F. The glycine transporter GLYT2 is a reliable marker for glycine-immunoreactive neurons. Brain Res Mol Brain Res. 1997;49:63–70. doi: 10.1016/s0169-328x(97)00124-1. [DOI] [PubMed] [Google Scholar]
- Roux I, Safieddine S, Nouvian R, Grati M, Simmler MC, Bahloul A, Perfettini I, Le Gall M, Rostaing P, Hamard G, Triller A, Avan P, Moser T, Petit C. Otoferlin, defective in a human deafness form, is essential for exocytosis at the auditory ribbon synapse. Cell. 2006;127:277–289. doi: 10.1016/j.cell.2006.08.040. [DOI] [PubMed] [Google Scholar]
- Rudhard Y, Kneussel M, Nassar MA, Rast GF, Annala AJ, Chen PE, Tigaret CM, Dean I, Roes J, Gibb AJ, Hunt SP, Schoepfer R. Absence of whisker-related pattern formation in mice with NMDA receptors lacking coincidence detection properties and calcium signaling. J Neurosci. 2003;2337:2323–2332. doi: 10.1523/JNEUROSCI.23-06-02323.2003. [DOI] [PMC free article] [PubMed] [Google Scholar]
- Russier M, Kopysova IL, Ankri N, Ferrand N, Debanne D. GABA and glycine co-release optimizes functional inhibition in rat brainstem motoneurons in vitro. J Physiol (Lond) 2002:123–137. doi: 10.1113/jphysiol.2001.016063. [DOI] [PMC free article] [PubMed] [Google Scholar]
- Sanes DH, Friauf E. Development and influence of inhibition in the lateral superior olivary nucleus. Hear Res. 2000;147:46–58. doi: 10.1016/s0378-5955(00)00119-2. [DOI] [PubMed] [Google Scholar]
- Sanes DH, Siverls V. Development and specificity of inhibitory terminal arborizations in the central nervous system. J Neurobiol. 1991;22:837–854. doi: 10.1002/neu.480220805. [DOI] [PubMed] [Google Scholar]
- Satheesh SV, Kunert K, Rüttiger L, Zuccotti A, Schönig K, Friauf E, Knipper M, Bartsch D, Nothwang HG. Retrocochlear function of the peripheral deafness gene Cacna1d. Hum Mol Genet. 2012;21:3896–3909. doi: 10.1093/hmg/dds217. [DOI] [PubMed] [Google Scholar]
- Singer JH, Talley EM, Bayliss DA, Berger AJ. Development of glycinergic synaptic transmission to rat brain stem motoneurons. J Neurophysiol. 1998;80:2608–2620. doi: 10.1152/jn.1998.80.5.2608. [DOI] [PubMed] [Google Scholar]
- Sinnegger-Brauns MJ, Huber IG, Koschak A, Wild C, Obermair GJ, Einzinger U, Hoda JC, Sartori SB, Striessnig J. Expression and 1,4-dihydropyridine-binding properties of brain L-type calcium channel isoforms. Mol Pharmacol. 2009;75:407–414. doi: 10.1124/mol.108.049981. [DOI] [PubMed] [Google Scholar]
- Sterenborg JC, Pilati N, Sheridan CJ, Uchitel OD, Forsythe ID, Barnes-Davies M. Lateral olivocochlear (LOC) neurons of the mouse LSO receive excitatory and inhibitory synaptic inputs with slower kinetics than LSO principal neurons. Hear Res. 2010;270:119–126. doi: 10.1016/j.heares.2010.08.013. [DOI] [PubMed] [Google Scholar]
- Stevens CF, Wang Y. Changes in reliability of synaptic function as a mechanism for plasticity. Nature. 1994;371:704–707. doi: 10.1038/371704a0. [DOI] [PubMed] [Google Scholar]
- Sukiasyan N, Hultborn H, Zhang M. Distribution of calcium channel Ca(V)1.3 immunoreactivity in the rat spinal cord and brain stem. Neuroscience. 2009;159:217–235. doi: 10.1016/j.neuroscience.2008.12.011. [DOI] [PubMed] [Google Scholar]
- Takahashi T, Momiyama A, Hirai K, Hishinuma F, Akagi H. Functional correlation of fetal and adult forms of glycine receptors with developmental changes in inhibitory synaptic receptor channels. Neuron. 1992;9:1155–1161. doi: 10.1016/0896-6273(92)90073-m. [DOI] [PubMed] [Google Scholar]
- Tritsch NX, Yi E, Gale JE, Glowatzki E, Bergles DE. The origin of spontaneous activity in the developing auditory system. Nature. 2007;450:50–55. doi: 10.1038/nature06233. [DOI] [PubMed] [Google Scholar]
- Turecek R, Trussell LO. Reciprocal developmental regulation of presynaptic ionotropic receptors. Proc Natl Acad Sci U S A. 2002;99:13884–13889. doi: 10.1073/pnas.212419699. [DOI] [PMC free article] [PubMed] [Google Scholar]
- Walcher J, Hassfurth B, Grothe B, Koch U. Comparative post-hearing development of inhibitory inputs to the lateral superior olive in gerbils and mice. J Neurophysiol. 2011;106:1443–1453. doi: 10.1152/jn.01087.2010. [DOI] [PubMed] [Google Scholar]
- Wang H, Liu H, Zhang ZW. Elimination of redundant synaptic inputs in the absence of synaptic strengthening. J Neurosci. 2011;31:16675–16684. doi: 10.1523/JNEUROSCI.4569-11.2011. [DOI] [PMC free article] [PubMed] [Google Scholar]
- Youssoufian M, Couchman K, Shivdasani MN, Paolini AG, Walmsley B. Maturation of auditory brainstem projections and calyces in the congenitally deaf (dn/dn) mouse. J Comp Neurol. 2008;506:442–451. doi: 10.1002/cne.21566. [DOI] [PubMed] [Google Scholar]
- Zhao JP, Phillips MA, Constantine-Paton M. Long-term potentiation in the juvenile superior colliculus requires simultaneous activation of NMDA receptors and L-type Ca2+ channels and reflects addition of newly functional synapses. J Neurosci. 2006;26:12647–12655. doi: 10.1523/JNEUROSCI.3678-06.2006. [DOI] [PMC free article] [PubMed] [Google Scholar]


