

Abstract
Neural processes are explored through macroscopic neuroimaging and microscopic molecular measures, but the two levels remain primarily detached. The identification of direct links between the levels would facilitate use of imaging signals as probes of genetic function and, vice versa, access to molecular correlates of imaging measures. Neuroimaging patterns have been mapped for a few isolated genes, chosen based on their connection with a clinical disorder. Here we propose an approach that allows an unrestricted discovery of the genetic basis of a neuroimaging phenotype in the normal human brain. The essential components are a subject population that is composed of relatives and selection of a neuroimaging phenotype that is reproducible within an individual and similar between relatives but markedly variable across a population. Our present combined magnetoencephalography and genome-wide linkage study in 212 healthy siblings demonstrates that auditory cortical activation strength is highly heritable and, specifically in the right hemisphere, regulated oligogenically with linkages to chromosomes 2q37, 3p12, and 8q24. The identified regions delimit as candidate genes TRAPPC9, operating in neuronal differentiation, and ROBO1, regulating projections of thalamocortical axons. Identification of normal genetic variation underlying neurophysiological phenotypes offers a non-invasive platform for an in-depth, concerted capitalization of molecular and neuroimaging levels in exploring neural function.
Introduction
Modern neuroimaging can ideally provide reliable and stable non-invasive measures of human brain function. The neurophysiological basis of the measured signals can be examined, but their correspondence with molecular-level phenomena remains difficult to explore. Genetic influences on brain structure and function provide a promising, indirect route to the molecular mechanisms of imaging signals. The heritability of brain macrostructures and cortical patterning (Bartley et al., 1997; Baaré et al., 2001; Thompson et al., 2001; Geschwind et al., 2002; Schmitt et al., 2008), as well as brain functions (van Beijsterveldt et al., 1996; Koten et al., 2009), has been widely explored by means of twin studies. Such studies cannot, however, propose links between specific genes and neuroimaging measures. These connections have been sought by associating single-nucleotide polymorphisms (SNPs) of predefined candidate genes with neuroimaging mappings, especially in clinical populations (Egan et al., 2001; Meyer-Lindenberg, 2010) and increasingly also in healthy subjects (Smolka et al., 2005; Mueller et al., 2011). However, this approach leaves open the role of other genes in the observed neuroimaging effect.
Here, we apply a markedly different approach by studying genome-wide linkage in healthy young adults to discover involvement of hitherto unsuspected genes in normal neurophysiology. The crucial starting point for the present strategy is the choice of an imaging phenotype that is stable and robust but highly variable between individuals. An auditory cortical activation that is generated at ∼100 ms after sound onset and widely used to probe reactivity of the auditory cortices in electroencephalographic (EEG) and magnetoencephalographic (MEG) recordings provides such a candidate. The 100 ms responses (N100 in EEG and N100m in MEG) can be evoked by any change in the auditory environment, but they also reflect stimulus-specific neural activity (Hari, 1990). N100m compiles activity mainly from the area posterior to the primary auditory cortex in the Heschl's gyrus, thereby including the planum temporale (PT) (Godey et al., 2001); intracranial recordings of the homologous response in monkeys suggest a current source in the cortical lamina III (Steinschneider et al., 1994). N100 response amplitudes are highly heritable (Anokhin et al., 2007; Turetsky et al., 2008), although salient environmental effects have also been demonstrated, e.g., use-dependent functional reorganization of N100m responses to piano tones in musicians (Pantev et al., 1998). In clinical populations, N100/N100m responses are affected, e.g., in schizophrenia (Roth et al., 1980), Parkinson's disease (Pekkonen et al., 1995), and dyslexia (Helenius et al., 2002).
In the present study, MEG responses to tones presented alternately to the right and left ear were measured in 212 healthy volunteer siblings. Subsequently, a genome-wide linkage analysis was conducted to identify genetic loci underlying the measured phenotypes of N100m. Crucial for bridging the gap between micro- and macro-level neuroscience, uncovering of genetic determinants for the N100m response provides, to our knowledge, the first non-invasive method of describing normal variation in molecular mechanisms of human cortical reactivity.
Materials and Methods
Subjects.
Two hundred twelve Finnish-speaking adults gave their informed consent to participate in the study. The subject group consisted of 92 full-sibling pairs, eight families with three siblings, and one family with four siblings (mean ± SEM age, 30 ± 1 years; 148 females, 64 males; 208 right-handed, three ambidextrous, and one left-handed; no monozygotic twins). None of the subjects had a history of hearing, neurological, or psychiatric disorders. All participants gave their written informed consent, and the study had previous approval from the Ethical Committee of the Hospital District of Helsinki and Uusimaa.
MEG experiment.
Auditory evoked fields were recorded in a magnetically shielded room while the subject remained seated with the head supported against the helmet-shaped bottom of the 306-channel Vectorview (Elekta Oy) neuromagnetometer. The device contains 102 identical triple sensors, comprising two orthogonal planar first-order gradiometers that measure the tangential derivatives ∂Bz/∂x and ∂Bz/∂y of the magnetic field component normal to the helmet surface at the sensor location and one magnetometer, each of them coupled to a superconducting quantum interference device.
Tones of 50 ms, 1 kHz (rise and fall times of 15 ms) were delivered alternately to the left and right ear at an interstimulus interval of 2 s. Hearing thresholds were determined separately for each ear before the measurement, and, during the MEG experiment, the sounds were delivered at 65 dB (sensation level) through plastic tubes and ear pieces.
The MEG signals were bandpass filtered at 0.03–200 Hz and sampled at 600 Hz. Four head-position-indicator coils were attached to the scalp, and their positions were measured with a three-dimensional digitizer; the head coordinate frame was anchored to the two periauricular points and the nasion. The head position with respect to the sensor array was determined by briefly feeding current to the marker coils before the actual measurement. The horizontal and vertical electro-oculograms were recorded to discard data contaminated by eyeblinks and movements. The experiment was conducted in two ∼5 min blocks, separated by 15–20 min. The replicability of the responses was ensured by visually comparing the overlaid responses from the two measurement blocks in each individual. The MEG responses were averaged across trials, for a time window extending from 200 ms before the stimulus onset to 1000 ms after it, and they were digitally low-pass filtered at 40 Hz. A minimum of 80 responses were averaged for each subject.
Response amplitudes (with respect to the base level in the 200 ms prestimulus interval) and normalized response durations (peak latency divided by the duration from +50 to −50% of the maximum activation on the ascending/descending sides) of the N100m response were determined from the channel pair showing the maximum response—as vector sum of the gradients —separately for each hemisphere. Such sensor-level measurements are well replicable and in accordance with results obtained by source modeling approaches (Virtanen et al., 1998). Importantly, these measures can be obtained with minimal subjective decisions on the data. Subsequently, the measured values were submitted to statistical testing, including a heritability analysis (see below).
Genotyping.
DNA was extracted from blood samples with Qiagen FlexiGene DNA Kit and genotyped on Affymetrix 250K StyI SNP array. Genotype calling was done in Affymetrix Genotyping Console software using the BRLLM algorithm for samples with an initial success >92.9%. Additional quality control filtering was done using Plink version 1.07 [http://pngu.mgh.harvard.edu/purcell/plink/ (Purcell et al., 2007)]: the exclusion criteria were as follows: (1) genotyping success <95% per sample and <98% per SNP; (2) minor allele frequency <5%; and (3) deviation from Hardy–Weinberg equilibrium in two subsets of 101 unrelated samples with p < 0.0001. The relatedness of individuals was checked based on identity-by-state similarity. After quality control, 207 individuals and 149,998 autosomal SNPs remained; the overall genotyping success was 99.8%, and lowest success per individual was 98.1%.
Heritability and linkage analysis.
Phenotype heritabilities were calculated based on all successfully phenotyped individuals (n = 212) using the variance component option of Merlin 1.1.2 (Abecasis et al., 2002). Before the analysis, the normality of the phenotype distributions was tested from a subset of unrelated individuals; the phenotypes were logarithmically transformed when this improved their normality.
The genotypes were checked using the error detection and correction option of Merlin, and the likely erroneous genotypes were coded as missing. A linkage analysis (n = 207) was conducted with the variance component option in Merlin, using the built-in linkage disequilibrium (LD) correction feature to account for the density of SNPs (Abecasis and Wigginton, 2005).
For comparison, the analysis was conducted on a subset of 28,218 SNPs that had been pruned for LD (r2 < 0.1 in Plink), excluding the sibling pairs that were not of the same sex, and by using a regression-based linkage approach (Sham et al., 2002).
The genome-wide significance of the observed logarithm of odds (LOD) scores was determined by simulations. Three hundred datasets without any genetic linkages but with phenotypes, relatedness between individuals, and missing genotype patterns identical to the real data were simulated in Merlin. For each simulation and phenotype, the highest simulated LOD score per chromosome was recorded, resulting in an empirical distribution of LOD scores. The significance of the observed LOD scores was evaluated by counting from the distribution of simulated LODs the expected number of peaks (nexp) with a LOD score equal or higher to the observed LOD score. Thus, we estimated how many times per simulation, on average, a LOD score exceeding the observed one was detected. The lower the nexp, the less likely it is to obtain as high a LOD score by chance, without the involvement of any genes. According to the standard guidelines by Lander and Kruglyak (1995), observed LOD scores with nexp < 0.05 were declared significant and those with nexp < 1 suggestive.
Because linkage scans were performed for several phenotypes, the overall significance level was corrected for multiple comparisons by calculating the proportion of the simulations in which the four highest scores across the phenotypes exceeded the observed four suggestive or significant LOD scores.
Results
MEG responses
The N100m responses peaked at 91 ± 1 ms (mean ± SEM) and 99 ± 1 ms for opposite-sided (contralateral) versus same-sided (ipsilateral) stimuli in the left auditory cortex and at 87 ± 1 and 96 ± 1 ms in the right auditory cortex. The responses were overall stronger in male than female subjects (p < 0.01), in accordance with previous studies (Salmelin et al., 1999).
The responses between the two experimental runs, overlaid, were visually compared in each individual: The within-subject variability between the measurement sessions was very small, whereas the response strengths varied by >10-fold across subjects (Fig. 1). The responses were quantified by measuring their absolute amplitudes, the amplitude ratios of ipsilateral versus contralateral responses, and the normalized response durations (peak latency divided by response duration).
Figure 1.
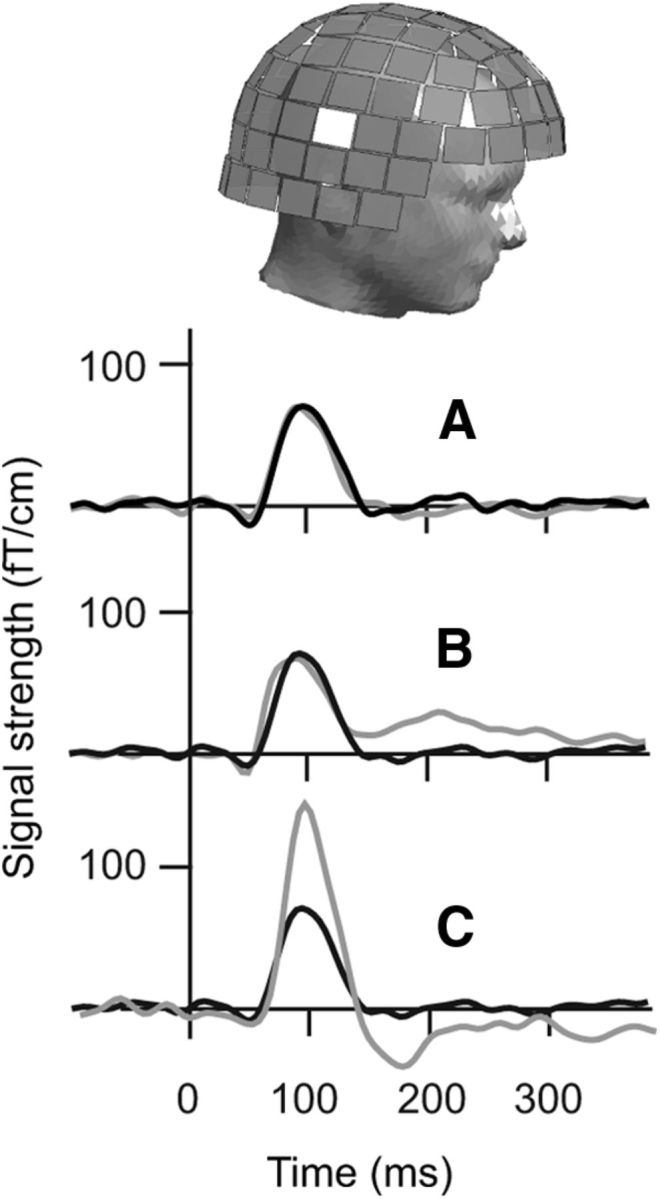
MEG signals. Responses at the sensor that displayed the maximum signal strength over the right hemisphere, when the auditory stimulus was given to the left ear. A, Subject S1: signals from two recordings separated by 20 min, overlaid (black and gray). B, The response of subject S1 (black) at ∼100 ms after stimulus onset (time 0) and the corresponding response of her sibling (gray) are remarkably similar. C, Marked differences are apparent between the responses of subject S1 (black) and an unrelated subject (gray).
Heritability analysis
All four response amplitudes (left/right hemisphere, ipsilateral/contralateral stimulation) showed statistically significant correlations across siblings (p < 0.001, Bonferroni corrected; Fig. 2); the heritability estimates h2 varied between 0.68 and 0.83. Heritability did not exceed 0.5 for any of the amplitude ratios or the normalized response durations (Table 1).
Figure 2.

MEG phenotypes. The logarithmically transformed MEG amplitudes in all sibling pairs (horizontal axis, Sibling #1; vertical axis, Sibling #2; femtoteslas per centimeter) and the correlation coefficients R. All four response amplitudes (left/right hemisphere, ipsilateral/contralateral stimulation) were statistically significantly correlated across siblings (p < 0.001).
Table 1.
The heritability estimates (from Merlin) for all measured MEG phenotypes (n = 212)
| Phenotype | h2 value |
|---|---|
| LH contralateral amplitude | 0.81 |
| LH ipsilateral amplitude | 0.83 |
| LH ipsilateral/contralateral amplitude | 0.38 |
| LH contralateral response duration | 0.30 |
| LH ipsilateral response duration | 0.06 |
| RH contralateral amplitude | 0.68 |
| RH ipsilateral amplitude | 0.73 |
| RH ipsilateral/contralateral amplitude | 0.28 |
| RH contralateral response duration | 0.46 |
| RH ipsilateral response duration | 0.48 |
| LH contralateral/RH ipsilateral amplitude | 0.34 |
| RH contralateral/LH ipsilateral amplitude | 0.10 |
LH, left hemisphere; RH, right hemisphere. Bold font denotes values exceeding 0.5.
Genome-wide linkage analysis
A variance component-based linkage analysis between the four amplitude value phenotypes and ∼150,000 autosomal SNPs revealed linkage for the right-hemispheric but not for the left-hemispheric amplitudes (Fig. 3).
Figure 3.
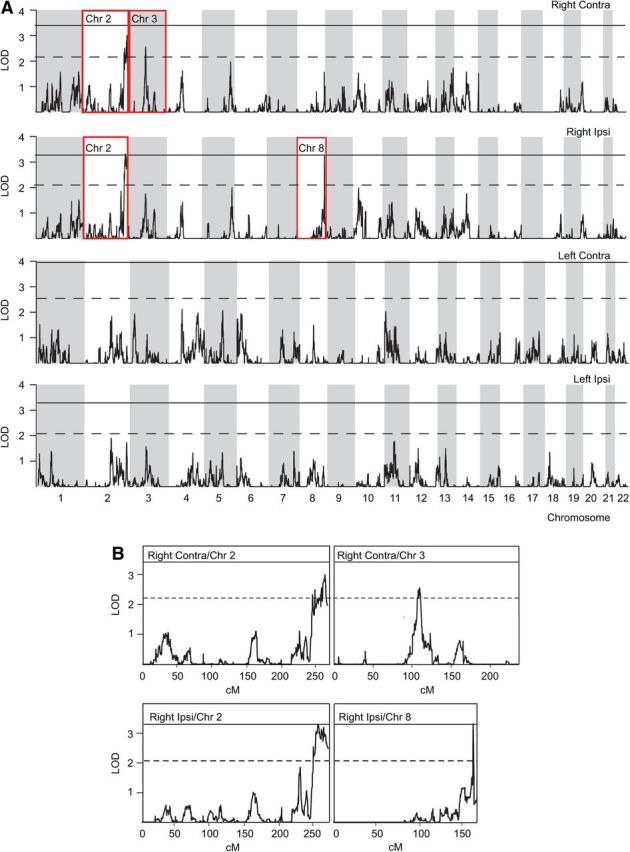
Linkage analysis. A, LOD scores of variance component-based linkage analysis between the four amplitude-value phenotypes and ∼150,000 autosomal SNPs, plotted against genomic location in centimorgan units. The threshold LOD scores for significant and suggestive results are indicated by continuous and dashed lines, respectively. The white and gray shading denotes even- and odd-numbered chromosomes. B, The insets provide an enlarged view of the chromosomes with significant or suggestive linkage, highlighted with red rectangles in A.
A locus on chromosome 2q37.2–37.3 was significantly linked to right-hemispheric ipsilateral amplitudes (LOD score = 3.32, nexp = 0.040) and suggestively linked to right-hemispheric contralateral amplitudes (LOD = 3.01, nexp = 0.14). Furthermore, a locus on chromosome 3p12.2–12.3 was suggestively linked to the right-hemispheric contralateral amplitudes (LOD = 2.55, nexp = 0.43) and a locus on chromosome 8q24.3 to the ipsilateral amplitudes (LOD = 3.27, nexp = 0.053). The overall probability of observing an equally significant result by chance in four linkage scans was p = 0.037. The genes located in the chromosome areas with significant or suggestive LOD scores and their currently proposed functions are listed in Table 2.
Table 2.
Genes with Online Mendelian Inheritance in Man (OMIM) number and their demonstrated functions, located within the three linkage peak areas with a suggestive or significant LOD score in the present study
| Gene symbol | Gene name | OMIM number(s) | Information in OMIM |
|---|---|---|---|
| Peak 2q37.2 - 2q37.3a | |||
| SH3BP4 | SH3-domain binding protein 4 | 605611 | Ubiquitously expressed |
| AGAP1 | Centaurin, gamma-2 | 608651 | Membrane traffic and actin cytoskeleton dynamics |
| GBX2 | Homeobox protein GBX-2 | 601135 | Embryonal development including the brain |
| CXCR7 | Chemokine (C-X-C motif) receptor 7 | 610376 | Cell growth, survival and adhesion |
| COL6A3 | Collagen, type VI, alpha 3 | 120250, 158810, 254090 | Collagen subunit encoding; related to Bethlem myopathy and Ullrich congenital muscular dystrophy (UCMD) |
| MLPH | Melanophilin | 606526, 609227 | Pigmentation; related to Griscelli syndrome type 3 (GS3) |
| PRLH | Prolactin releasing hormone | 602663 | Regulation of lactation and pregnancy |
| RAB17 | RAB17, member RAS oncogene family | 602206 | Regulation of membrane trafficking in the epithelium |
| LRRFIP1 | Leucine rich repeat in FLII-interacting protein 1 | 603256 | Regulation of transcription |
| RAMP1 | Receptor activity modifying protein 1 | 605153 | Constituent and modifier of a calcitonin-related receptor |
| SCLY | Selenocysteine lyase | 611056 | Selenium metabolism |
| HES6 | Hairy and enhancer of split 6 (Drosophila) | 610331 | Transcriptional regulation during development |
| PER2 | Period homolog 2 (Drosophila) | 603426, 604348 | Circadian rhythm regulation; related to familial advanced sleep-phase syndrome |
| TRAF3IP1 | TRAF3-interacting protein 1 | 607380 | Formation and function of microtubules and zebrafish cilia |
| ASB1 | Ankyrin repeat and SOCS box containing 1 | 605758 | Regulation of signal transduction via suppression of cytokine signaling |
| TWIST2 | Twist homolog 2 (Drosophila) | 607556, 227260 | Cytokine signaling regulation; related to Setleis syndrome |
| HDAC4 | Histone deacetylase 4 | 605314, 600430 | Transcription repression via histone deacetylation; related to brachydactyly-mental retardation syndrome (BDMR) |
| NDUFA10 | NADH-ubiquinone oxidoreductase 1 alpha subcomplex, 10 | 603835, 256000 | Electron transport chain of mitochondria; related to the neurodegenerative Leigh syndrome (LS) |
| OTOS | Otospiralin | 607877 | Synthesized by fibrocytes in the inner ear; related to deafness in guinea pigs |
| GPC1 | Glypican 1 | 600395 | Endostatin binding |
| RNPEPL1 | Arginyl aminopeptidase-like 1 | 605287 | Ubiquitously expressed |
| CAPN10 | Calpain 10 | 605286, 601283 | Susceptibility gene for type II diabetes (NIDDM) |
| GPR35 | G-protein-coupled receptor 35 | 602646 | Transduction of signals into intracellular effects |
| AQP12A | Aquaporin 12A | 609789 | Pancreas-specific expression |
| KIF1A | Kinesin family member 1A | 601255, 610357, 614213, 614255 | Transport of synaptic-vesicle precursors along axons; related to autosomal dominant mental retardation (MRD9), hereditary sensory neuropathy type IIC (HSN2C) and autosomal recessive spastic paraplegia (SPG30) |
| AGXT | Alanine-glyoxylate aminotransferase | 604285, 259900 | Peroxisomal liver enzyme; related to type I primary hyperoxaluria (HP1) |
| PASK | PAS domain containing serine/threonine kinase | 607505 | Glycogen synthesis; Drosophila homolog involved in wrapping of axons by glial cells |
| PPP1R7 | Protein phosphatase 1, regulatory subunit 7 | 602877 | Constituent and modifier of a protein phosphatase |
| ANO7 | Anoctamin 7 | 605096 | Expressed in prostate |
| HDLBP | High-density lipoprotein binding protein | 142695 | Binds high-density lipoprotein molecules, may remove excess cellular cholesterol |
| SEPT2 | Septin 2 | 601506 | Coupling of DNA damage response regulation to the cytoskeleton |
| STK25 | Serine/threonine protein kinase 25 | 602255 | Epithelial and neuronal cell polarity and axon outgrowth |
| BOK | BCL2-related ovarian killer | 605404 | Apoptosis in the ovary |
| THAP4 | THAP domain containing 4 | 612533 | Protein coding |
| ATG4B | ATG4 autophagy related 4 homolog B (S. cerevisiae) | 611338 | Autophagy (in yeast) |
| DTYMK | Deoxythymidylate kinase | 188345 | Phosphorylation catalyzing enzyme in DNA synthesis |
| ING5 | Inhibitor of growth family, member 5 | 608525 | Regulation of cell cycle |
| D2HGDH | d-2-hydroxyglutarate dehydrogenase | 609186, 600721 | Dehydrogenase enzyme; related to d-2-hydroxyglutaric aciduria (D2HGA1) |
| GAL3ST2 | Galactose-3-O-sulfotransferase 2 | 608237 | Sulfate group transfering enzyme |
| NEU4 | Sialidase 4/neuraminidase 4 | 608527 | Enzyme cleaving terminal sialic acid residues |
| PDCD1 | Programmed cell death 1 | 600244, 126200, 152700, 605218 | Cell surface receptor involved in immunomodulation; related to systemic lupus erythematosus and multiple sclerosis |
| Peak in 3p12.2 - 3p12.3b | |||
| ROBO2 | Roundabout, axon guidance receptor, homolog 2 (Drosophila) | 602431, 610878 | Axon guidance receptor; related to vesicoureteral reflux 2 (VUR2) |
| ROBO1 | Roundabout, axon guidance receptor, homolog 1 (Drosophila) | 602430, 606896 | Axon guidance receptor; candidate gene for dyslexia susceptibility 5 (DYX5) |
| GBE1 | Glucan (1,4-α-), branching enzyme 1 | 607839, 232500 | Glycogen synthesis; related to glycogen storage disease IV |
| Peak in 8q24.3c | |||
| TRAPPC9 | Trafficking protein particle complex 9 | 611966, 613192 | Neuronal signaling pathway; related to autosomal recessive mental retardation (MRT13) |
a+59 genes without OMIM information: 9 pseudogenes, 7 micro-RNAs, 17 hypothetical loci, 2 open reading frames, and 24 others.
b+9 genes without OMIM information: seven pseudogenes, one microRNA, and one other.
c+3 genes without OMIM information: two hypothetical loci and one pseudogene.
Highly concordant results to the variance-component analysis were obtained by alternative or complementary methods, such as regression analysis, by using SNPs pruned for LD and when including data from same-sex sibling pairs only. When sex was used as a covariate in the linkage analysis, three of the previously observed peaks were reproduced: right-hemispheric ipsilateral amplitudes were significantly linked to chromosome 8q24.3 (LOD = 3.81, nexp = 0.027) and suggestively to chromosome 2q37.3 (LOD = 3.18, nexp = 0.15). Right-hemispheric contralateral amplitudes were suggestively linked to chromosome 2q37.3 (LOD = 2.98, nexp = 0.56), whereas the linkage between right-hemispheric contralateral amplitudes and chromosome 3 remained nonsignificant (LOD = 2.58, nexp = 1.11). Moreover, the analysis yielded additional suggestive peaks on chromosome 4q13.2–13.3 for left-hemispheric contralateral amplitudes (LOD = 2.71, nexp = 0.82) and on chromosomes 5q35.2 (LOD = 2.53, nexp = 0.70) and 11p11.2 (LOD = 2.43, nexp = 0.85) for right-hemispheric ipsilateral amplitudes.
Discussion
Our results demonstrate high heritability of the auditory cortical N100m response strength in normal population, with specific linkages to genome areas on chromosomes 2, 3, and 8. Our results thus confirm the previous EEG results on the heritability of N100 responses (Anokhin et al., 2007; Turetsky et al., 2008). Notably, however, whereas heritability analyses may include effects stemming from the shared environment of the experimental subjects, our finding of genetic correlates for the neuromagnetic responses implicates a true genetic component in the observed effect.
The human auditory cortices, located bilaterally at the supratemporal plane, receive input from both ears, with stronger and earlier neural responses in the hemisphere opposite to the stimulated ear (Reite et al., 1981). We found genetic linkages for the right-hemispheric N100m responses, although both left- and right-hemispheric responses were highly heritable. On the one hand, this observed difference between the hemispheres may indicate a larger environmental component on the left-hemispheric processes. On the other hand, the result may reflect influence of a larger number of genes on the left- than right-hemispheric processes, with any one gene having an effect that is too small to be detected by the linkage analysis. The auditory cortices at the right versus left superior temporal gyri differ anatomically and functionally, with denser and more heterogeneous subsystems in the left hemisphere both at the microcellular and macrocellular level. Pyramidal cells at the left PT are larger in size and density (Hutsler and Gazzaniga, 1996), and the left PT can contain more subsystems than the right PT within the same volume, suggesting superior fine-grained intrinsic connectivity (Galuske et al., 2000). Similarly at the macroscopic level, white-matter tracts linking temporal and frontal lobes are more widespread and greater in volume in the left hemisphere (Powell et al., 2006; Rilling et al., 2008). From the functional point of view, several neuroimaging studies have pointed to asymmetries in the temporal cortices, especially in language-related tasks. The right and left auditory cortices have been suggested to be predominantly sensitive to spectral and temporal changes, respectively (Zatorre and Belin, 2001; Obleser et al., 2008), with the right auditory cortex having a more constrained computational role (Obleser et al., 2008). Furthermore, the left-hemispheric responses are affected by linguistic background, in a gender-related manner (Salmelin et al., 1999). Such findings are suggestive of a more complex genetic influence on the left auditory cortical responses, likely requiring a larger experimental subject population than was available in the present study for linkage detection.
The amplitude of an evoked response is thought to reflect the size of the active neuronal population or the degree of neuronal synchrony within the cortical area. The remarkable similarity of the response latencies across sibling pairs in the present study suggests that variation in neural synchrony was not a major factor. Rather, genetic influence seems to be reflected in the number of activated neurons. Human auditory areas comprise multiple fields with different cytoarchitectures (Galaburda and Sanides, 1980; Rivier and Clarke, 1997). The N100m likely integrates activation from several close-by fields, and thus—in addition to general auditory onset detection (Näätänen, 1988)—reflects functions needed for combining auditory stimulus features and for binaural interaction (McEvoy et al., 1994). The current genetic finding could thus be reflected in either the microanatomy or macroanatomy (or both) of the auditory cortical areas. However, establishing causal relationships between detailed neuronal architecture and non-invasively measured responses is likely to require intracortical approaches, especially in the auditory areas in which comparisons of cytoarchitectonic maps relative to macroanatomic landmarks have demonstrated considerable individual variation (Rademacher et al., 2001).
The regions emerging in the genome-wide linkage analysis contain several genes relevant to brain function. At the location of the suggestive linkage on chromosome 8, TRAPPC9 encodes NIBP (NIK- and IKK-β-binding protein) that is expressed in neurons and participates in the nuclear factor-κB signaling pathway involved in synaptic plasticity and neuronal differentiation (Hu et al., 2005). Homozygous truncating mutation of TRAPPC9 has been detected recently in patients with autosomal recessive mental retardation, mild cerebral white-matter hypoplasia, and thin corpus callosum (Mir et al., 2009; Mochida et al., 2009).
The linkage peak on chromosome 2, near the long-arm telomere in a typically gene-rich region, contains >60 genes and several micro-RNA loci. The peak is broad and does not allow the pinpointing of specific genes. However, this region contains genes of considerable interest for their known functions, such as GBX2 (gastrulation brain homeobox 2), GPR35 (G-protein receptor 35), KIF1A (axonal transporter of synaptic vesicles), and OTOS (otospiralin). We suggest that any of these genes might serve as a functional candidate for the linkage to chromosome 2q.
On chromosome 3p12.3, the suggestive linkage was observed around the centromere, peaking at the axon guidance receptor gene ROBO1. ROBO1 is a member of the roundabout family of midline axon guidance receptors (Kidd et al., 1998). Robo1 knock-out mice have defects in corticothalamic and thalamocortical signaling, and at least one copy of the gene is required for the formation of corpus callosum and other commissures (Andrews et al., 2006); callosal connections contribute to auditory N100m responses via input from the contralateral to ipsilateral auditory cortex (Mäkelä and Hari, 1992). In humans, ROBO1 has been implicated as a susceptibility gene for dyslexia (Hannula-Jouppi et al., 2005), and its polymorphisms are associated with phonological buffer deficits (Bates et al., 2011). Dyslexic subjects show diminished right-hemispheric ipsilateral N100m auditory responses (Parviainen et al., 2005).
The current study was designed to evoke prominent N100m responses in all subjects. The other obligatory components of the auditory evoked magnetic field at ∼50 ms (P50m) and ∼200 ms (P200m) were also evident in the data but, because of their low amplitude and thus small between-subject variability, were not included in the analyses. The middle-latency component P50 has been suggested to show heritable effects in EEG settings (Young et al., 1996; Hall et al., 2006; Anokhin et al., 2007). The genetic layout of P50m could be addressed in future studies optimally designed to increase its prominence with respect to the late cortical components.
Separate components of the auditory evoked responses mature at different rates during the development, possibly reflecting changes in axon myelination and synaptic mechanisms that may play a role more generally across sensory systems (Eggermont, 1988). Because two of the candidate genes in the current study, ROBO1 and TRAPPC9, are associated with such processes in the CNS, the current results prompt comparative analyses of their influence on evoked responses in other sensory modalities. Similarly, the complex interaural interactions after binaural auditory stimulation could be addressed in future experiments, especially because ROBO1 has been suggested recently to play a role in altered interaural interaction in dyslexic individuals with ROBO1 deficiency (Lamminmäki et al., 2012).
In conclusion, our current approach provides a promising platform (1) for elucidating the molecular basis of cortical phenotypes, via genetic mapping and, vice versa, (2) for exploiting neuroimaging to track down functionally relevant genes whose exact roles may then be examined using molecular techniques. For example, developmental dyslexia with a strong behavioral manifestation of problems in reading and phonological processing has been associated, on the one hand, with a complex genetic predisposition including ROBO1 and, on the other hand, with functional brain imaging correlates, such as diminished auditory N100m responses. Our present data suggest a direct link between ROBO1 and auditory cortical responses in normal neurophysiology. This combination of imaging and genetic data can thus yield insights into human brain development and its various behavioral manifestations.
Footnotes
This study was supported by the Academy of Finland, Sigrid Jusélius Foundation, Finnish Cultural Foundation, Swedish Royal Bank Tercentennial Foundation, Swedish Brain Foundation (Hjärnfonden), Knut and Alice Wallenberg Foundation, and Center for Biosciences at Karolinska Institute. We thank Riitta Lehtinen and Ingegerd Fransson for expert technical assistance and Elisabet Einarsdottir, Lotta Koskinen, and Päivi Onkamo for their advice on the computational analysis.
References
- Abecasis GR, Wigginton JE. Handling marker-marker linkage disequilibrium: pedigree analysis with clustered markers. Am J Hum Genet. 2005;77:754–767. doi: 10.1086/497345. [DOI] [PMC free article] [PubMed] [Google Scholar]
- Abecasis GR, Cherny SS, Cookson WO, Cardon LR. Merlin—rapid analysis of dense genetic maps using sparse gene flow trees. Nat Genet. 2002;30:97–101. doi: 10.1038/ng786. [DOI] [PubMed] [Google Scholar]
- Andrews W, Liapi A, Plachez C, Camurri L, Zhang J, Mori S, Murakami F, Parnavelas JG, Sundaresan V, Richards LJ. Robo1 regulates the development of major axon tracts and interneuron migration in the forebrain. Development. 2006;133:2243–2252. doi: 10.1242/dev.02379. [DOI] [PubMed] [Google Scholar]
- Anokhin AP, Vedeniapin AB, Heath AC, Korzyukov O, Boutros NN. Genetic and environmental influences on sensory gating of mid-latency auditory evoked responses: a twin study. Schizophr Res. 2007;89:312–319. doi: 10.1016/j.schres.2006.08.009. [DOI] [PubMed] [Google Scholar]
- Baaré WF, Hulshoff Pol HE, Boomsma DI, Posthuma D, de Geus EJ, Schnack HG, van Haren NE, van Oel CJ, Kahn RS. Quantitative genetic modeling of variation in human brain morphology. Cereb Cortex. 2001;11:816–824. doi: 10.1093/cercor/11.9.816. [DOI] [PubMed] [Google Scholar]
- Bartley AJ, Jones DW, Weinberger DR. Genetic variability of human brain size and cortical gyral patterns. Brain. 1997;120:257–269. doi: 10.1093/brain/120.2.257. [DOI] [PubMed] [Google Scholar]
- Bates TC, Luciano M, Medland SE, Montgomery GW, Wright MJ, Martin NG. Genetic variance in a component of the language acquisition device: ROBO1 polymorphisms associated with phonological buffer deficits. Behav Genet. 2011;41:50–57. doi: 10.1007/s10519-010-9402-9. [DOI] [PubMed] [Google Scholar]
- Egan MF, Goldberg TE, Kolachana BS, Callicott JH, Mazzanti CM, Straub RE, Goldman D, Weinberger DR. Effect of COMT Val108/158 Met genotype on frontal lobe function and risk for schizophrenia. Proc Natl Acad Sci U S A. 2001;98:6917–6922. doi: 10.1073/pnas.111134598. [DOI] [PMC free article] [PubMed] [Google Scholar]
- Eggermont JJ. On the rate of maturation of sensory evoked potentials. Electroencephalogr Clin Neurophysiol. 1988;70:293–305. doi: 10.1016/0013-4694(88)90048-x. [DOI] [PubMed] [Google Scholar]
- Galaburda A, Sanides F. Cytoarchitectonic organization of the human auditory cortex. J Comp Neurol. 1980;190:597–610. doi: 10.1002/cne.901900312. [DOI] [PubMed] [Google Scholar]
- Galuske RA, Schlote W, Bratzke H, Singer W. Interhemispheric asymmetries of the modular structure in human temporal cortex. Science. 2000;289:1946–1949. doi: 10.1126/science.289.5486.1946. [DOI] [PubMed] [Google Scholar]
- Geschwind DH, Miller BL, DeCarli C, Carmelli D. Heritability of lobar brain volumes in twins supports genetic models of cerebral laterality and handedness. Proc Natl Acad Sci U S A. 2002;99:3176–3181. doi: 10.1073/pnas.052494999. [DOI] [PMC free article] [PubMed] [Google Scholar]
- Godey B, Schwartz D, de Graaf JB, Chauvel P, Liégeois-Chauvel C. Neuromagnetic source localization of auditory evoked fields and intracerebral evoked potentials: a comparison of data in the same patients. Clin Neurophysiol. 2001;112:1850–1859. doi: 10.1016/s1388-2457(01)00636-8. [DOI] [PubMed] [Google Scholar]
- Hall MH, Schulze K, Rijsdijk F, Picchioni M, Ettinger U, Bramon E, Freedman R, Murray RM, Sham P. Heritability and reliability of P300, P50 and duration mismatch negativity. Behav Genet. 2006;36:845–857. doi: 10.1007/s10519-006-9091-6. [DOI] [PubMed] [Google Scholar]
- Hannula-Jouppi K, Kaminen-Ahola N, Taipale M, Eklund R, Nopola-Hemmi J, Kääriäinen H, Kere J. The axon guidance receptor gene ROBO1 is a candidate gene for developmental dyslexia. PLoS Genet. 2005;1:e50. doi: 10.1371/journal.pgen.0010050. [DOI] [PMC free article] [PubMed] [Google Scholar]
- Hari R. The neuromagnetic method in the study of the human auditory cortex. In: Grandori F, Hoke M, Romani GL, editors. Auditory evoked magnetic fields and electric potentials. Basel: Karger; 1990. pp. 222–282. [Google Scholar]
- Helenius P, Salmelin R, Richardson U, Leinonen S, Lyytinen H. Abnormal auditory cortical activation in dyslexia 100 msec after speech onset. J Cogn Neurosci. 2002;14:603–617. doi: 10.1162/08989290260045846. [DOI] [PubMed] [Google Scholar]
- Hu WH, Pendergast JS, Mo XM, Brambilla R, Bracchi-Ricard V, Li F, Walters WM, Blits B, He L, Schaal SM, Bethea JR. NIBP, a novel NIK and IKK(beta)-binding protein that enhances NF-(kappa)B activation. J Biol Chem. 2005;280:29233–29241. doi: 10.1074/jbc.M501670200. [DOI] [PMC free article] [PubMed] [Google Scholar]
- Hutsler JJ, Gazzaniga MS. Acetylcholinesterase staining in human auditory and language cortices: regional variation of structural features. Cereb Cortex. 1996;6:260–270. doi: 10.1093/cercor/6.2.260. [DOI] [PubMed] [Google Scholar]
- Kidd T, Brose K, Mitchell KJ, Fetter RD, Tessier-Lavigne M, Goodman CS, Tear G. Roundabout controls axon crossing of the CNS midline and defines a novel subfamily of evolutionarily conserved guidance receptors. Cell. 1998;92:205–215. doi: 10.1016/s0092-8674(00)80915-0. [DOI] [PubMed] [Google Scholar]
- Koten JW, Jr, Wood G, Hagoort P, Goebel R, Propping P, Willmes K, Boomsma DI. Genetic contribution to variation in cognitive function: An fMRI study in twins. Science. 2009;323:1737–1740. doi: 10.1126/science.1167371. [DOI] [PubMed] [Google Scholar]
- Lamminmäki S, Massinen S, Nopola-Hemmi J, Kere J, Hari R. Human ROBO1 regulates interaural interaction in auditory pathways. J Neurosci. 2012;32:966–971. doi: 10.1523/JNEUROSCI.4007-11.2012. [DOI] [PMC free article] [PubMed] [Google Scholar]
- Lander E, Kruglyak L. Genetic dissection of complex traits: guidelines for interpreting and reporting linkage results. Nat Genet. 1995;11:241–247. doi: 10.1038/ng1195-241. [DOI] [PubMed] [Google Scholar]
- Mäkelä JP, Hari R. Neuromagnetic auditory evoked responses after a stroke in the right temporal lobe. Neuroreport. 1992;3:94–96. doi: 10.1097/00001756-199201000-00025. [DOI] [PubMed] [Google Scholar]
- McEvoy L, Mäkelä JP, Hämäläinen M, Hari R. Effect of interaural time differences on middle-latency and late auditory evoked magnetic fields. Hear Res. 1994;78:249–257. doi: 10.1016/0378-5955(94)90031-0. [DOI] [PubMed] [Google Scholar]
- Meyer-Lindenberg A. Imaging genetics of schizophrenia. Dialogues Clin Neurosci. 2010;12:449–456. doi: 10.31887/DCNS.2010.12.4/amlindenberg. [DOI] [PMC free article] [PubMed] [Google Scholar]
- Mir A, Kaufman L, Noor A, Motazacker MM, Jamil T, Azam M, Kahrizi K, Rafiq MA, Weksberg R, Nasr T, Naeem F, Tzschach A, Kuss AW, Ishak GE, Doherty D, Ropers HH, Barkovich AJ, Najmabadi H, Ayub M, Vincent JB. Identification of mutations in TRAPPC9, which encodes the NIK- and IKK-beta-binding protein, in nonsyndromic autosomal-recessive mental retardation. Am J Hum Genet. 2009;85:909–915. doi: 10.1016/j.ajhg.2009.11.009. [DOI] [PMC free article] [PubMed] [Google Scholar]
- Mochida GH, Mahajnah M, Hill AD, Basel-Vanagaite L, Gleason D, Hill RS, Bodell A, Crosier M, Straussberg R, Walsh CA. A truncating mutation of TRAPPC9 is associated with autosomal-recessive intellectual disability and postnatal microcephaly. Am J Hum Genet. 2009;85:897–902. doi: 10.1016/j.ajhg.2009.10.027. [DOI] [PMC free article] [PubMed] [Google Scholar]
- Mueller EM, Makeig S, Stemmler G, Hennig J, Wacker J. Dopamine effects on human error processing depend on catechol-O-methyltransferase VAL158MET genotype. J Neurosci. 2011;31:15818–15825. doi: 10.1523/JNEUROSCI.2103-11.2011. [DOI] [PMC free article] [PubMed] [Google Scholar]
- Näätänen R. Implications of ERP data for psychological theories of attention. Biol Psychol. 1988;26:117–163. doi: 10.1016/0301-0511(88)90017-8. [DOI] [PubMed] [Google Scholar]
- Obleser J, Eisner F, Kotz SA. Bilateral speech comprehension reflects differential sensitivity to spectral and temporal features. J Neurosci. 2008;28:8116–8123. doi: 10.1523/JNEUROSCI.1290-08.2008. [DOI] [PMC free article] [PubMed] [Google Scholar]
- Pantev C, Oostenveld R, Engelien A, Ross B, Roberts LE, Hoke M. Increased auditory cortical representation in musicians. Nature. 1998;392:811–814. doi: 10.1038/33918. [DOI] [PubMed] [Google Scholar]
- Parviainen T, Helenius P, Salmelin R. Cortical differentiation of speech and nonspeech sounds at 100 ms: implications for dyslexia. Cereb Cortex. 2005;15:1054–1063. doi: 10.1093/cercor/bhh206. [DOI] [PubMed] [Google Scholar]
- Pekkonen E, Jousmäki V, Reinikainen K, Partanen J. Automatic auditory discrimination is impaired in Parkinson's disease. Electroencephalogr Clin Neurophysiol. 1995;95:47–52. doi: 10.1016/0013-4694(94)00304-4. [DOI] [PubMed] [Google Scholar]
- Powell HW, Parker GJ, Alexander DC, Symms MR, Boulby PA, Wheeler-Kingshott CA, Barker GJ, Noppeney U, Koepp MJ, Duncan JS. Hemispheric asymmetries in language-related pathways: a combined functional MRI and tractography study. Neuroimage. 2006;32:388–399. doi: 10.1016/j.neuroimage.2006.03.011. [DOI] [PubMed] [Google Scholar]
- Purcell S, Neale B, Todd-Brown K, Thomas L, Ferreira MA, Bender D, Maller J, Sklar P, de Bakker PI, Daly MJ, Sham PC. PLINK: a toolset for whole-genome association and population-based linkage analysis. Am J Hum Genet. 2007;81:559–575. doi: 10.1086/519795. [DOI] [PMC free article] [PubMed] [Google Scholar]
- Rademacher J, Morosan P, Schormann T, Schleicher A, Werner C, Freund HJ, Zilles K. Probabilistic mapping and volume measurement of human primary auditory cortex. Neuroimage. 2001;13:669–683. doi: 10.1006/nimg.2000.0714. [DOI] [PubMed] [Google Scholar]
- Reite M, Zimmerman JT, Zimmerman JE. Magnetic auditory evoked fields: interhemispheric asymmetry. Electroencephalogr Clin Neurophysiol. 1981;51:388–392. doi: 10.1016/0013-4694(81)90102-4. [DOI] [PubMed] [Google Scholar]
- Rilling JK, Glasser MF, Preuss TM, Ma X, Zhao T, Hu X, Behrens TE. The evolution of the arcuate fasciculus revealed with comparative DTI. Nat Neurosci. 2008;11:426–428. doi: 10.1038/nn2072. [DOI] [PubMed] [Google Scholar]
- Rivier F, Clarke S. Cytochrome oxidase, acetylcholinesterase, and NADPH-diaphorase staining in human supratemporal and insular cortex: evidence for multiple auditory areas. Neuroimage. 1997;6:288–304. doi: 10.1006/nimg.1997.0304. [DOI] [PubMed] [Google Scholar]
- Roth WT, Horvath TB, Pfefferbaum A, Kopell BS. Event-related potentials in schizophrenics. Electroencephalogr Clin Neurophysiol. 1980;48:127–139. doi: 10.1016/0013-4694(80)90299-0. [DOI] [PubMed] [Google Scholar]
- Salmelin R, Schnitzler A, Parkkonen L, Biermann K, Helenius P, Kiviniemi K, Kuukka K, Schmitz F, Freund H. Native language, gender, and functional organization of the auditory cortex. Proc Natl Acad Sci U S A. 1999;96:10460–10465. doi: 10.1073/pnas.96.18.10460. [DOI] [PMC free article] [PubMed] [Google Scholar]
- Schmitt JE, Lenroot RK, Wallace GL, Ordaz S, Taylor KN, Kabani N, Greenstein D, Lerch JP, Kendler KS, Neale MC, Giedd JN. Identification of genetically mediated cortical networks: a multivariate study of pediatric twins and siblings. Cereb Cortex. 2008;18:1737–1747. doi: 10.1093/cercor/bhm211. [DOI] [PMC free article] [PubMed] [Google Scholar]
- Sham PC, Purcell S, Cherny SS, Abecasis GR. Powerful regression-based quantitative-trait linkage analysis of general pedigrees. Am J Hum Genet. 2002;71:238–253. doi: 10.1086/341560. [DOI] [PMC free article] [PubMed] [Google Scholar]
- Smolka MN, Schumann G, Wrase J, Grüsser SM, Flor H, Mann K, Braus DF, Goldman D, Büchel C, Heinz A. Catechol-O-methyltransferase val158met genotype affects processing of emotional stimuli in the amygdala and prefrontal cortex. J Neurosci. 2005;25:836–842. doi: 10.1523/JNEUROSCI.1792-04.2005. [DOI] [PMC free article] [PubMed] [Google Scholar]
- Steinschneider M, Schroeder CE, Arezzo JC, Vaughan HG., Jr Speech-evoked activity in primary auditory cortex: effects of voice onset time. Electroencephalogr Clin Neurophysiol. 1994;92:30–43. doi: 10.1016/0168-5597(94)90005-1. [DOI] [PubMed] [Google Scholar]
- Thompson PM, Cannon TD, Narr KL, van Erp T, Poutanen VP, Huttunen M, Lönnqvist J, Standertskjöld-Nordenstam CG, Kaprio J, Khaledy M, Dail R, Zoumalan CI, Toga AW. Genetic influences on brain structure. Nat Neurosci. 2001;4:1253–1258. doi: 10.1038/nn758. [DOI] [PubMed] [Google Scholar]
- Turetsky BI, Greenwood TA, Olincy A, Radant AD, Braff DL, Cadenhead KS, Dobie DJ, Freedman R, Green MF, Gur RE, Gur RC, Light GA, Mintz J, Nuechterlein KH, Schork NJ, Seidman LJ, Siever LJ, Silverman JM, Stone WS, Swerdlow NR, Tsuang DW, Tsuang MT, Calkins ME. Abnormal auditory N100 amplitude: a heritable endophenotype in first-degree relatives of schizophrenia probands. Biol Psychiatry. 2008;64:1051–1059. doi: 10.1016/j.biopsych.2008.06.018. [DOI] [PMC free article] [PubMed] [Google Scholar]
- van Beijsterveldt CE, Molenaar PC, de Geus EJ, Boomsma DI. Heritability of human brain functioning as assessed by electroencephalography. Am J Hum Genet. 1996;58:562–573. [PMC free article] [PubMed] [Google Scholar]
- Virtanen J, Ahveninen J, Ilmoniemi RJ, Näätänen R, Pekkonen E. Replicability of MEG and EEG measures of the auditory N1/N1m-response. Electroencephalogr Clin Neurophysiol. 1998;108:291–298. doi: 10.1016/s0168-5597(98)00006-9. [DOI] [PubMed] [Google Scholar]
- Young DA, Waldo M, Rutledge JH, 3rd, Freedman R. Heritability of inhibitory gating of the P50 auditory-evoked potential in monozygotic and dizygotic twins. Neuropsychobiology. 1996;33:113–117. doi: 10.1159/000119260. [DOI] [PubMed] [Google Scholar]
- Zatorre RJ, Belin P. Spectral and temporal processing in human auditory cortex. Cereb Cortex. 2001;11:946–953. doi: 10.1093/cercor/11.10.946. [DOI] [PubMed] [Google Scholar]