

Abstract
Oscillatory activity in sensory cortices reflects changes in local excitation–inhibition balance, and recent work suggests that phase signatures of ongoing oscillations predict the perceptual detection of subsequent stimuli. Low-frequency oscillations are also entrained by dynamic natural scenes, suggesting that the chance of detecting a brief target depends on the relative timing of this to the entrained rhythm. We tested this hypothesis in humans by implementing a cocktail-party-like scenario requiring subjects to detect a target embedded in a cacophony of background sounds. Using EEG to measure auditory cortical oscillations, we find that the chance of target detection systematically depends on both power and phase of theta-band (2–6 Hz) but not alpha-band (8–12 Hz) oscillations before target. Detection rates were higher and responses faster when oscillatory power was low and both detection rate and response speed were modulated by phase. Intriguingly, the phase dependency was stronger for miss than for hit trials, suggesting that phase has a inhibiting but not ensuring role for detection. Entrainment of theta range oscillations prominently occurs during the processing of attended complex stimuli, such as vocalizations and speech. Our results demonstrate that this entrainment to attended sensory environments may have negative effects on the detection of individual tokens within the environment, and they support the notion that specific phase ranges of cortical oscillations act as gatekeepers for perception.
Introduction
Oscillatory activity in cortical networks is believed to index neural mechanisms underlying perception and cognition (Fries et al., 2007; Vanrullen et al., 2011). It reflects changes in the local excitation–inhibition balance and provides insights about network state changes that correlate with behavioral aspects of information processing (Fries et al., 2007; Rajkai et al., 2008; Sirota et al., 2008). For example, psychophysical perceptual performance correlates with specific states of spontaneous prestimulus oscillations, as shown by correlations between alpha-band power and visual detection rates (Romei et al., 2008; van Dijk et al., 2008) and dependencies of detection rates on the phase of ongoing oscillations (Busch et al., 2009; Mathewson et al., 2009; Busch and VanRullen, 2010). Such effects of prestimulus oscillatory state on perception can be further enhanced by expectation or attention (Lakatos et al., 2008; Schroeder and Lakatos, 2009; Stefanics et al., 2010; Besle et al., 2011) and also manifest in occulomotor responses (Drewes and VanRullen, 2011). These findings promote speculations about a periodic processing mode of sensation (Vanrullen et al., 2011; Giraud and Poeppel, 2012; Jensen et al., 2012), whereby discrete windows of opportunity control the entry of stimuli to cognition. This may effectively partition sensation into discrete “perceptual moments” that can be indexed by specific oscillatory states (Vanrullen et al., 2011; Jensen et al., 2012).
In addition, it has been shown that oscillations in sensory cortices can entrain to dynamic natural inputs. Low-frequency rhythms in visual cortex time-lock to the presentation of video clips (Montemurro et al., 2008), and delta and theta oscillations in auditory cortex are found to entrain to the envelope of natural sounds (Luo and Poeppel, 2007; Howard and Poeppel, 2010). This auditory entrainment can be sufficiently precise and reliable that individual stimulus epochs can be reliably discriminated from oscillatory phase patterns (Luo and Poeppel, 2007; Ng et al., 2012), suggesting that it may serve as a key mechanism for segmenting auditory scenes and the integration of auditory information over time (Giraud and Poeppel, 2012; Zion Golumbic et al., 2012).
The observations of phase-dependent stimulus perception and phase entrainment to dynamic stimuli together suggest that the phase of slow oscillations may better reflect the mechanisms underlying sensory processing than the same oscillations amplitude (Vanrullen et al., 2011; Ng et al., 2012). However, they also make a clear prediction: when oscillations in a sensory cortex are entrained by dynamic inputs, the phase dependency of perception should result in stimulus-locked epochs of enhanced and reduced stimulus detection. Hence, the capability of the brain to entrain to the sensory environment inevitably should have periodic adverse effects on perception.
We here directly demonstrate such a dependency of stimulus detection on stimulus-entrained oscillations. Studying the auditory cortex, we implemented a cocktail-party-like auditory detection scenario (Bregman, 1994) whereby subjects were required to detect an acoustic target embedded in an ongoing cacophony of background sounds. Our results demonstrate a stimulus-locked variability in detection rates and uncover an inhibiting but not ensuring role of slow (2–6 Hz) oscillations for stimulus detection.
Materials and Methods
EEG recordings and data preprocessing.
Twelve subjects were paid to participate in the experiment (four female; median age, 25.5 years). All reported normal hearing and gave informed consent before participation. The experiments were approved by the joint ethics committee of the University Clinic and the Max Planck Institute Tübingen. Sixty-four-channel EEG signals were continuously recorded using an actiCAP (Brain Products) with Ag/AgCl electrodes placed according to the standard 10–20 system. Recordings were referenced to an electrode placed on the nose tip, and the ground electrode was placed in position AFz. A third electrode was placed over the lower left orbit to register eye movements. Electrode impedance was kept <10 kΩ. Signals were amplified using BrainAmp amplifiers (Brain Products), and data were acquired at a sampling rate of 500 Hz using a bandpass filter of 0.318–250 Hz. The experiment was conducted in a sound-attenuated room while the acoustic stimulus was presented using a Sennheiser In-Ear headphone (model PMX 80).
Acoustic stimulus and experimental design.
Acoustic stimuli consisted of a target sound that was presented at different positions embedded within a complex acoustic scene. Before the experiments, a set of 20 backgrounds (each 4 s long) was generated by linear superposition of 80 simultaneous sound snippets randomly selected from a set of 384 naturalistic sound clips comprising animal calls and noises (mammals, birds, insects, >50% of the sounds), environmental sounds (natural elements, weather, ambient sounds), and sounds made by everyday objects of human life (<15% of sounds). Sound snippets were scaled to same root-mean-square intensity, and the length of each snippet was chosen as the minimum of the snippets length and a random value between 1.4 and 2 s (median of effectively used values 1.6 s). The random length of each snippet ensured that their superposition did not produce periodic structures in the background resulting from the onset times of different snippets (this was confirmed by inspection of the frequency spectrum of onset times, which was flat between 1 and 100 Hz). For each subject, three to four background sounds were randomly selected. The subjects task was to detect a target sound (sound of a camera “click,” 200 ms) embedded within the background, which they indicated using a button press on the computer keyboard (Fig. 1A). On each trial, the target was presented at one of six possible positions relative to background onset (Fig. 1B), whereby target positions were equally spaced between 1.5 and 2.5 s after background onset. This temporal uncertainty of the target was introduced to avoid habituation effects and to sample different phase angles of cortical oscillations presumably entrained to the auditory background. The intensity of the target relative to background was scaled for each subject individually to achieve a detection performance near 50%. This scaling was calibrated at the beginning of each experimental session. Backgrounds altered pseudorandomly on a trial-by-trial basis. After familiarization with the task and sound calibration, each subject performed a total of six blocks, each comprising 180 target trials, 30 catch trials devoid of a target and six catch trials containing a loud and clearly audible target. Catch trials were used to monitor performance over the time course of the experiments. Across subjects, the false-alarm rate on target-absent trials was 5.5 ± 3.1%, and detection performance for loud targets was >98%, indicating the subjects' consistent performance. Sounds were presented binaurally at 65 dB SPL. Each trial was subject initiated (button press), triggering a 0.8–1.3 s variable interval until sound onset. We found that, for each subject, the average detection performance varied between backgrounds. Because our goal was to compare neural activity with regard to differences between trials on which the target was detected or missed, we selected only the background for which detection performance was closest to 50% for each subject for subsequent analysis. This ensured a good balance between hit and miss trials (57.3 ± 4.0% hit trials).
Figure 1.

Acoustic target detection paradigm. A, A 4-s-long naturalistic background sound (gray) was played after trial initiation. Subjects were asked to detect a short target sound (200 ms, red) embedded within the background (gray). The relative target intensity was scaled for each subject to achieve a hit rate of ∼50%. B, Acoustic stimulation is thought to induce phase entrainment of slow (e.g., theta band) oscillations in auditory cortex. Target onsets (red dotted lines) were equally spaced within a time window (1.5–2.5 s after stimulus onset) to facilitate the sampling of different phase angles of such entrained oscillations. C, Average detection performance across subjects (n = 12, mean ± SEM). D, Relative hit rates for three subjects (left) as a function of target position (with 1 corresponding to the subjects mean hit rate). E, Subject-averaged hit rates (left, mean ± SEM) and reaction times (right).
In a control analysis, we analyzed whether sound features before the observed neural effects correlate with the subjects target detection. For this analysis, we computed the sound envelope using a Hilbert transform applied to the sound wave and subsequently calculated the average envelope intensity in 50 ms time bins. We then computed the temporal change (derivative) of this sound envelope as the difference in subsequent 50 ms bins in a time window of 400–200 ms before target. These temporal envelope changes were obtained for all target positions, and we subsequently correlated them with the (trial-averaged) hit rate for that target position. Correlations were computed across target positions and subjects (6 × 12 = 72 data points).
Data analyses.
Behavioral data were analyzed by computing hit rates and reaction times (relative to target onset) for each possible target position and subject (Fig. 1C–E). For individual subjects, this revealed a performance level that varied systematically with target position (Fig. 1D). To compare behavioral data across subjects, we computed normalized hit rates and reaction times, which were obtained by dividing the average value at each target position by the subjects overall average value.
EEG data was analyzed in MATLAB partly using functions from the EEGLAB toolbox (Delorme and Makeig, 2004). Individual trials were rejected as containing artifacts if the amplitude on any of the central channels (FC1–FC4,C1–C4,CP1–CP4, FCz, CPz, Cz) exceeded 8 SDs of the signal for a period longer than 50 ms. The remaining trials were kept and re-referenced to a global reference. Low-frequency oscillations were extracted from the broadband EEG signal using third-order Butterworth filters. Relevant epochs relating to task performance (−1 to 4 s relative to background onset) were extracted from the continuous signal and resampled to 125 Hz. Because sound-locked auditory cortical activity is highest on central electrodes in concordance with known dipole projections from the auditory cortex EEG (Nunez and Srinivasan, 2006; Burkard et al., 2007; Stefanics et al., 2010), we averaged the signals from the seven central electrodes with the highest phase coherence to serve as auditory cortical-related signal for subsequent analysis (Ng et al., 2012). Oscillatory phase and power were calculated using the Hilbert transform of the filtered signal: power was defined as the squared absolute value and phase as the angular component of the Hilbert transform. Trials were grouped by detection performance (hits, misses), and we computed three measures of interest for each group: 1) the average power; 2) the intertrial phase coherence (ITC), a measure of phase concentration across trials, defined as ITC = |〈 exp(i × φ(t)) > 〉|, where 〈… 〉 denotes the trial average, φ the phase, and |… | the absolute value; and 3) the phase bifurcation index (Busch et al., 2009), defined as bifurcation index = (ITChits − ITCall) × (ITCmiss − ITCall). This index compares the phase concentration for hit and miss trials to the overall phase distribution. It assumes negative values if one group of trials exhibits more phase concentration than the other and positive values when both groups exhibit phase concentration around distinct phase angles, and it is close to zero when neither group exhibits phase concentration or when both groups exhibit the same phase concentration.
Differences in power, ITC, and bifurcation index between hit and miss trials were tested for statistical significance using two-sided paired t tests across subjects at each time bin (8 ms) in a 400 ms pre-target period. To visualize systematic differences in the phase concentration between hit and miss trials, we computed histograms of the single-trial phase at selected time points separately for hit, miss, and all available trials for each subject (using eight phase bins from −π to π; see Figs. 3, 4D). Each histogram was normalized relative to the total number of trials within each condition and circularly smoothed with a Hamming window of length 3. Because the most likely phase for hit or miss trials differed between subjects, we realigned histograms across subjects by shifting (taking the cyclic nature of the phase into account) each histogram such that the most likely phase of the miss histogram was set to bin φ = 0 (for a similar procedure, see Busch et al., 2009). We then computed the difference between hit and miss for each subject (see Figs. 3E, 5E). An ANOVA across subjects was used as statistical test of a significant effect of phase angle on performance. To calculate the ANOVA, we skipped the bin that was used for cross-subject alignment.
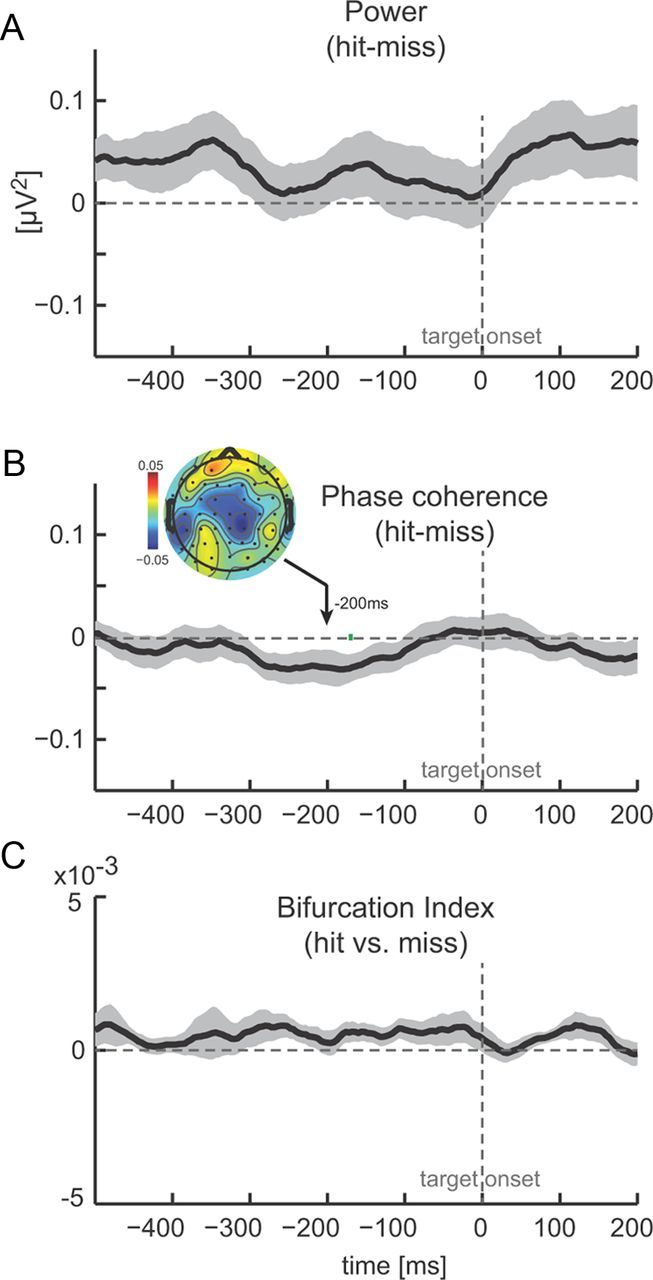
Figure 3.
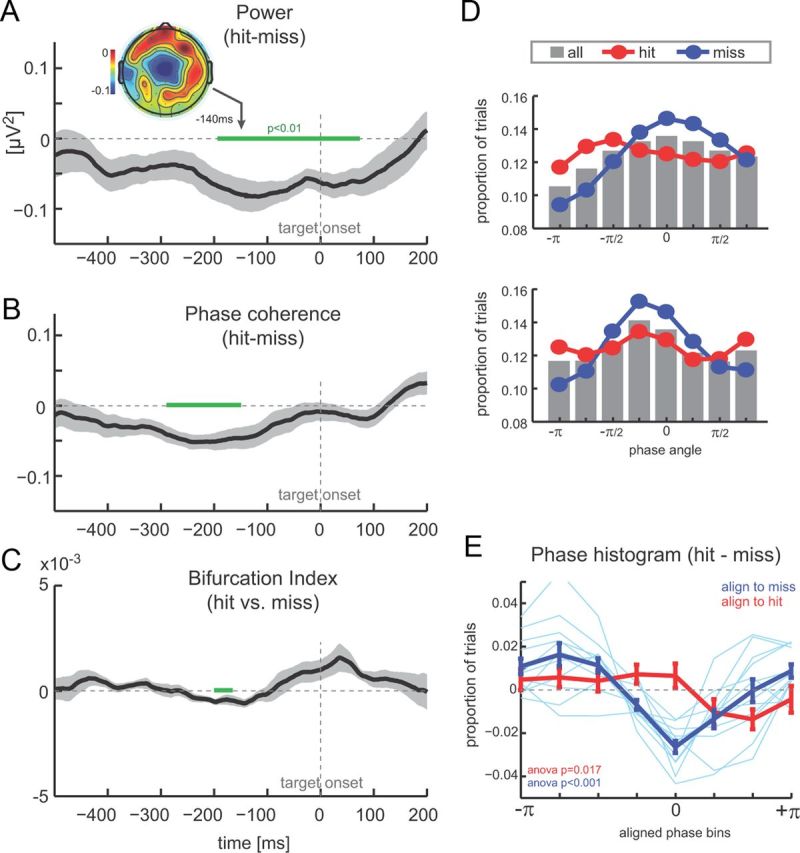
Pre-target oscillations and detection performance. A, Difference between hit and miss trials in theta band (2–6 Hz) power (n = 12, mean ± SEM). Negative values indicate higher power during miss trials. Time 0 corresponds to target onset, and green bars delineate epochs with a significant difference between hit and miss trials (paired t test, p < 0.01). Inset shows the topography of power difference. B, Difference (hit − miss) in theta band (2–6 Hz) phase coherence. Same conventions as in A. C, Phase bifurcation index (hit vs missed trials). Negative values indicate stronger phase locking in one condition versus the other. D, Example phase histograms from two subjects showing the distribution of phase angles across all trials (gray bars), hit trials (red), and miss trials (blue) at t = −200 ms. E, Difference between phase histograms for hit and miss trials, after histograms were aligned across subjects using the peak of hit (red) or miss (blue) distributions (mean ± SEM). Light blue lines display single-subject data.
Figure 4.
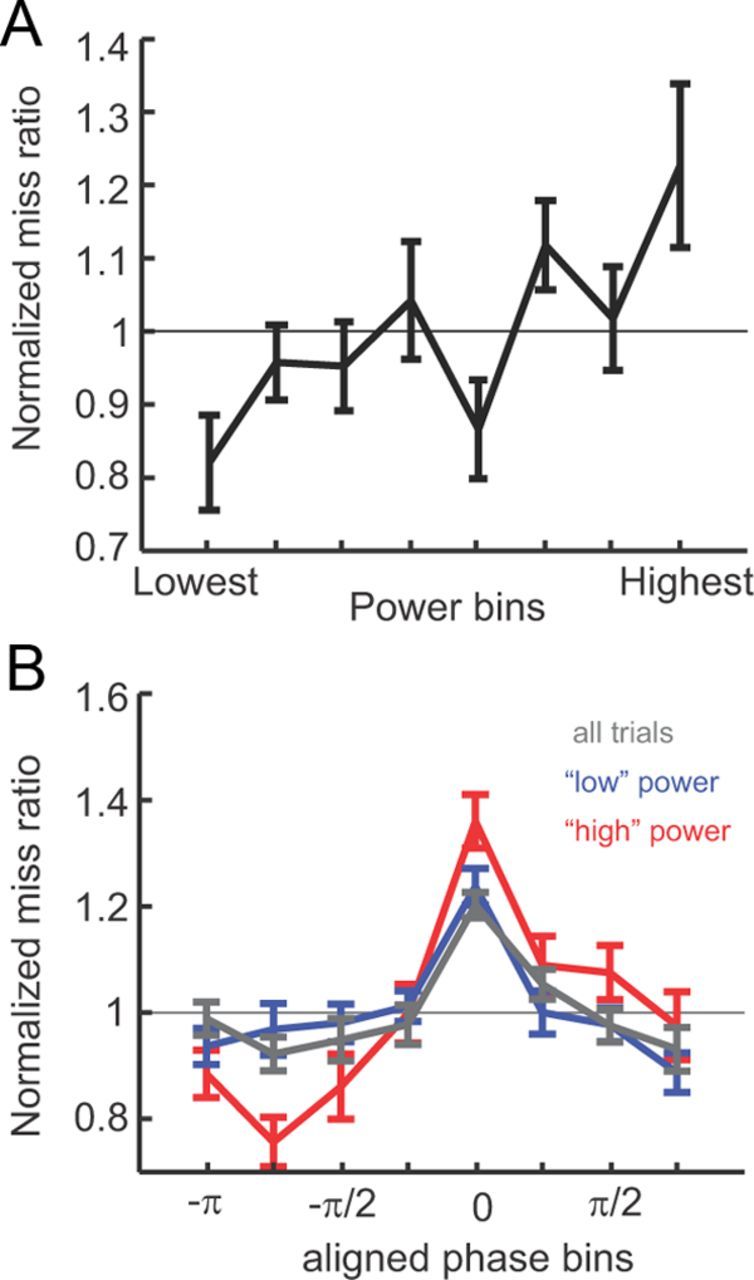
Impact of power and phase on detection rates. A, Miss rate as a function of (binned) power across subjects (mean ± SEM) at the time point when power effects were maximal (t = −132 ms). Histograms are normalized to the mean miss ratio per subject. B, Miss rate as a function of phase at the time point when power effects were maximal (t = −200) for all trials (black) and for “high-power” and “low-power” trials (above or below 50th percentile, red and blue traces respectively). Histograms were aligned across subjects (aligned to bin 0).
Figure 5.
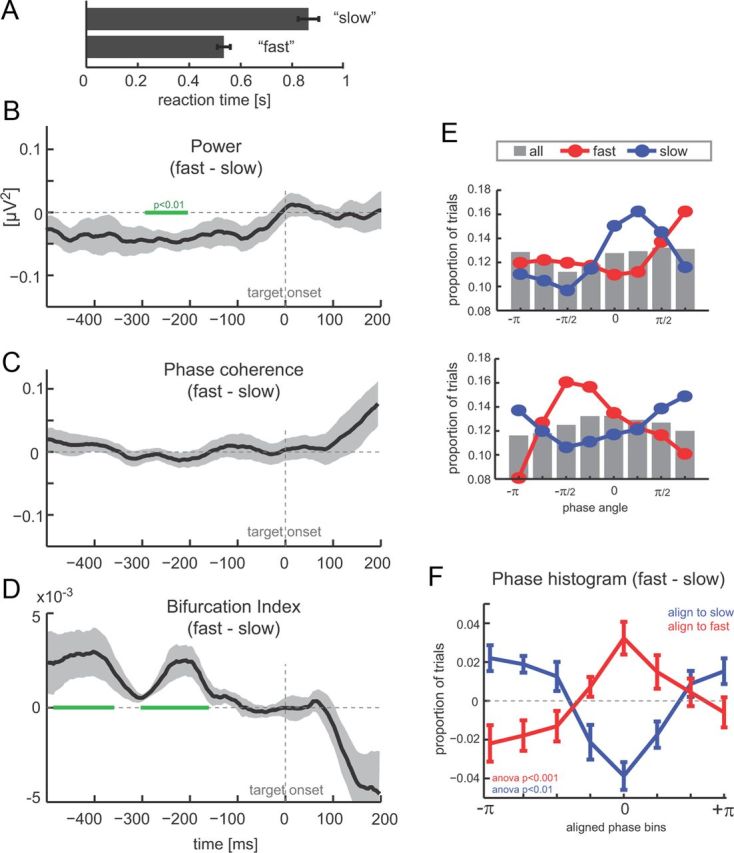
Pre-target oscillations and reaction times. A, Reaction times in “fast” and “slow” hit trials (based on top and bottom 40th percentiles). B, Difference between fast and slow trials in theta-band (2–6 Hz) power (n = 12, mean ± SEM). Time 0 corresponds to target onset, and green bars delineate epochs with a significant difference between hit and miss trials (paired t test, p < 0.01). C, Difference (fast − slow) in theta-band (2–6 Hz) phase coherence. D, Phase bifurcation index (fast vs slow trials). Negative values indicate stronger phase-locking in one condition versus the other. E, Example phase histograms from two subjects showing phase angle distributions over all hit trials (gray bars), fast trials (red), and slow trials (blue) at t = −208 ms. F, Difference between phase histograms for fast and slow trials, after histograms were aligned across subjects using the peak of fast (red) or slow (blue) distributions (mean ± SEM).
To quantify how perceptual performance depends separately on power or phase (see Fig. 4), we calculated the miss rate as a function of power and phase values individually for each subject. As above, phase histograms were realigned to their most likely phases (as described previously). The magnitude of the influence of power or phase on perceptual performance was quantified as the maximum modulation of the respective histogram (maximum − minimum value).
The global field power (GFP) was calculated separately for hit and miss trials as an index of general changes in pre-target and post-target activity. The GFP was defined as SD of instantaneous voltage across all channels (Lehmann and Skrandies, 1986; Skrandies, 1990).
Selection of optimal frequency band.
The optimal frequency band for quantifying auditory-driven oscillations was determined as the frequency band exhibiting strongest entrainment (phase-locking) to natural sounds. Previous work has shown that entrainment of auditory oscillations derived from EEG, MEG, or intracortical data is strongest between 2 and 9 Hz (Luo and Poeppel, 2007; Kayser et al., 2009; Howard and Poeppel, 2010; Ding and Simon, 2012; Ng et al., 2012). For our experimental setup and natural sounds, we determined the optimal band using data acquired in a previous study (Ng et al., 2012), in which we presented a series of naturalistic sounds (a subset of those used to construct the background cacophony in the present study) for a prolonged period of time (52 s). This long stimulus presentation allowed a more accurate and reliable estimate of phase entrainment than the short period available in the present data (only 1.5 s of background before target, which leaves ∼1 s after discarding the evoked component). We quantified entrainment using the ITC systematically for a range of frequency bands from 1 to 18 Hz. This revealed strongest ITC for the 2–6 Hz band (Fig. 2A). In addition, we repeated the subsequent analyses also for alpha-band oscillations (8–12 Hz), which have been implicated in shaping phase-dependent perception in several studies on the visual system (Busch et al., 2009; Mathewson et al., 2009; Busch and VanRullen, 2010).
Figure 2.
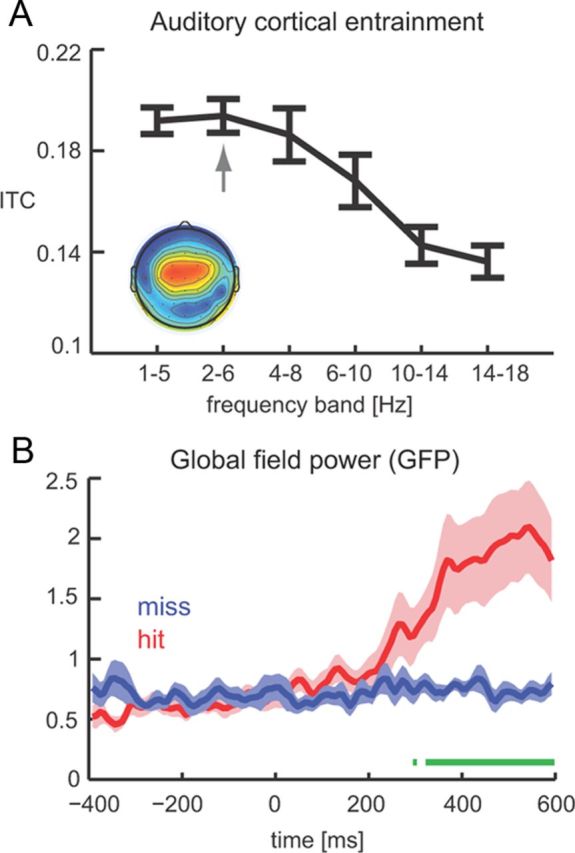
The state of cortical oscillations during sensory stimulation. A, Phase coherence as a function of frequency band demonstrating that peak entrainment occurs in the 2–6 Hz band. We used data from a previous study (Ng et al., 2012) because the prolonged stimulation allows for a more accurate estimation of phase entrainment. B, GFP for hit (red) and miss (blue) trials reveals no state change from pre-target to post-target epochs during miss trials. Time 0 corresponds to target onset, and green bars delineate epochs with a significant difference between hit and miss trials (paired t test, p < 0.01).
A model of precluding and ensuring roles of oscillations.
An important result of our study is that prestimulus phase was more concentrated around a specific phase regimen during miss compared with hit trials in the population result. We interpret this as evidence that the phase rather has a “precluding” rather than an “ensuring” impact on perception. To formalize these notions of precluding and ensuring roles more concretely and to show how our findings readily emerge from the hypothesis of a precluding role, we performed the following model-based analysis. We assume that the chance of target detection depends on a phase-dependent gating mechanism, which defines the probability of target perception as a function of phase, plus additional phase-independent mechanism. Formally, this can be expressed as P(detection) ≈ P(φ) × rand, with P(φ) being the gating function and rand reflecting additional (possibly stochastic) but phase-independent processes (see Fig. 7A). We formalized an ensuring mechanism as one in which target detection is high at a particular phase epoch around some specific phase value φopt and flat for the remaining phase values (i.e., a function with distinct peak; see Fig. 7B). Similarly, we formalized a precluding mechanism as one in which detection is low around a specific phase value φbad and flat for the remaining phases (i.e., a function with distinct dip). We then simulated responses of 20 subjects separately for both mechanisms assuming independent and randomly drawn φopt (or φbad) values across subjects, corresponding to presumed phase-dependent hit rates of 20 subjects. We then subjected these to the same group analysis used for the actual data (Fig. 3E). Specifically, we computed the subject-averaged phase-aligned performance curves (hit rates) when aligning the data of individual subjects on either the peak of the hit rate or the peak of the miss rate (i.e., the minimal hit rate).
Figure 7.
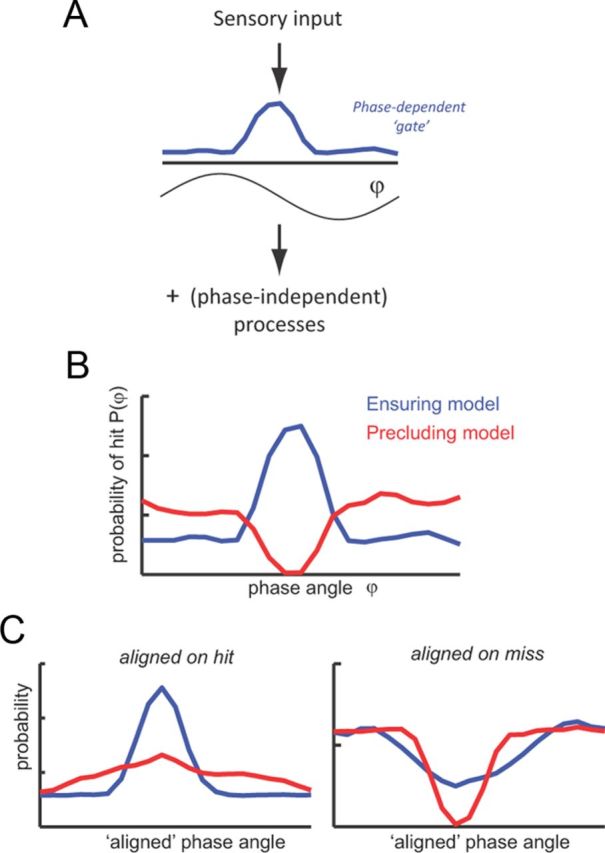
Conceptual model of ensuring and precluding roles of oscillation for auditory detection. A, Schematic of the model, which assumes that the chance for target detection P(φ) depends on a phase-dependent gating function and additional (phase-independent) processes. B, An ensuring role of oscillations is described by a gating function P(φ) that peaks for a specific phase range φopt and is flat otherwise. A precluding role is described by a detection probability that is especially low for a specific phase range φbad and flat otherwise. C, Subject-averaged hit rates were computed by assuming independent and uniformly distributed values of φopt and φbad. As the experimental data (see Fig. 3E), we calculated subject-averaged results by aligning individual subject data both on peak hit rates and peak miss rates. The ensuring model yields stronger modulation when aligned to hit (compared with aligned to miss), whereas the precluding model yields the opposite. The latter is consistent with our experimental data.
Results
The goal of our study was to determine the impact of sound-entrained low-frequency oscillatory activity in auditory cortex on perceptual performance. Previous work has shown that auditory entrainment prevails for oscillations <10 Hz (Luo and Poeppel, 2007; Kerlin et al., 2010; Ding and Simon, 2012; Ng et al., 2012). For our experimental setup, we found that centrally located auditory driven oscillations between 2 and 6 Hz exhibited the strongest entrainment as measured using the oscillatory ITC (see Materials and Methods and Fig. 2A). The main analysis of EEG data was hence based on this 2–6 Hz band. In our experiment, subjects (n = 12) performed a task requiring the detection of a target sound within a complex background. This task mimics requirements for the auditory system to detect sounds from a complex acoustic cacophony, similar to cocktail-party-like acoustic scenarios that pose a challenge to everyday listening. Specifically, subjects were required to detect a brief target presented randomly at one of six positions within a background cacophony of diverse natural sounds (Fig. 1B). Individual target positions were separated by 200 ms to sample distinct phase epochs of the presumed auditory cortical theta band (∼4 Hz) oscillations as depicted in Figure 1B. Before the experiment, the relative target intensity was selected for each subject to achieve performance values ∼50%. Indeed, in the actual experiments, subjects successfully detected the target in approximately half of the trials (hit rate, 57.0 ± 3.5%, mean ± SEM), and they did so with low false-alarm rate as determined from catch trials (5.5 ± 3.1%; Fig. 1C).
Behavioral data
The behavioral data revealed an intriguing dependency on detection performance on target position within the background cacophony, consistent with a dependency of target detection on stimulus-entrained low-frequency oscillations. Individual target positions were separated to sample distinct phase epochs of slow oscillations as depicted in Figure 1B, with different target positions possibly sampling different phase regimens of the oscillation. Figure 1D shows the hit rate (normalized to each subject's average performance) for three subjects and reveals a clear dependency of performance across target positions. This position-dependent performance was also visible in the subject-averaged data (Fig. 1E), demonstrating a systematic and significant dependency of hit rate on target position (ANOVA, F(5,66) = 3.5, p < 0.01). A similar analysis on reaction times also revealed a significant effect of target position (F = 3.4, p < 0.01; Fig. 1E). The behavioral data hence suggests that whether a target will be detected relative to a background cacophony depends on the exact position of the target relative to the background. This result is in concordance with the prediction that perception is modulated by the phase of cortical oscillations that are directly entrained by the acoustic background, as depicted in the schematic of Figure 1B. However, one should note that the scenario of Figure 1B only schematizes the underlying oscillatory processes, and the exact alignment of targets to auditory cortical oscillations and the specific oscillation frequency might vary between subjects. To directly link target detection and oscillations, we analyze target detection relative to EEG-derived auditory cortical oscillations in the following.
Impact of prestimulus oscillatory state on target detection
To determine the impact of entrained cortical oscillations on target detection, we extracted data epochs aligned to target onset and computed the power, phase coherence, and bifurcation index of the 2–6 Hz band separately for hit and miss trials. Before doing so, we verified that, during miss trials, the post-target brain state resembles the pre-target state, consistent with the hypothesis that, in the case of a target miss, subjects should be similarly listening to the cacophony in search for the target even after its occurrence. To this end, we computed the GFP, which is a measure of electrophysiological activity independent of particular choices of electrodes or reference (Skrandies, 1990; Murray et al., 2008). Figure 2B displays the GFP normalized to the pre-target period for hit and miss trials. Significant differences between hit and miss trials were only found at post-target periods (paired t tests, p < 0.01; Fig. 2B, green bar). In addition, an ANOVA using five pre-target and five post-target time bins (spaced 50 ms) revealed a significant effect of time only for hit trials (F(9,119) = 4.54, p < 10−3) but not for miss trials (F = 0.65, p > 0.05).
We found significant differences in pre-target low-frequency oscillatory states between hit and miss trials. Figure 3A displays the time course of the power difference between trial types. Significant differences between hit and miss (paired t tests, p < 0.01; Fig. 3A, green line) were found in an extended period from ∼200 ms before target until 100 ms after target, whereby power was weaker on hit and stronger on miss trials. The topography of this differential effect was in agreement with generators in auditory cortex and was localized to those central electrodes showing stimulus-driven entrainment (Fig. 3A). In addition, around the same pre-target epoch, we also found significant differences in oscillatory phase coherence (Fig. 3B, significant differences from −300 to −150 ms before target). The difference between ITC was negative, indicating stronger phase concentration on trials on which the target was missed. This difference in pre-target phase pattern was also visible as a significant effect in the bifurcation index (Fig. 3C, significant difference from −204 to −192 ms), which directly compares the degree of intertrial phase alignment between hit and miss trials within the context of the collective set of trials (Busch et al., 2009).
To further scrutinize the dependency of perceptual performance on oscillation phase, we computed histograms of the pre-target phase separately for hits, miss, and all trials using the time point at which phase coherence effects were maximal (−200 ms). The negative difference in phase coherence would predict more concentrated phase distributions for miss trials. This was indeed visible in single-subject data. Figure 3D displays histograms from two subjects, both of which reveal a strongly modulated phase histogram for miss trials (blue) and a considerably less modulated histogram for hit trials. For comparison, gray bars represent the phase distribution across all trials, revealing a rather uniform sampling of oscillatory phase across trials. To average these histograms across subjects, we took into account that the “preferred” phase, i.e., the one with the highest proportion of hit (or miss) trials, differed between subjects. We thus shifted (taking the cyclic nature into account) individual subject's histograms to align these preferred phase angles in the center bin (phase zero). The result reveals a stunning difference between hit and miss trials (Fig. 3E). When aligning these phase-performance histograms according to the preferred phase for hit trials, only a minor modulation emerged across subjects in the difference between hit and miss histograms (red curve); an ANOVA reveals a just significant effect of phase bins (F(6,77) = 2.77, p = 0.017). However, when aligning the phase-performance histograms according to the preferred phase for miss trials (blue curve), a clear and systematic phase modulation was obtained across subjects (F(6,77) = 7.52, p < 0.001). Together with the higher phase coherence for miss trials, this lets us conclude that the phase structure of auditory cortical oscillations has a stronger effect on precluding target detection on individual trials (ensuring a miss) rather than facilitating target detection (ensuring a hit). Hence, the phase seems to have an inhibiting rather than facilitating effect on target detection.
One may conceive that the relationship between increased power and phase coherence before a target miss is induced by an acoustic feature in the background that causes an evoked response (and hence the observed increase in power and phase coherence) and that subsequently reduces the sensitivity of the auditory system as a result of adaptation or some form of refractoriness. This, however, seems unlikely for several reasons. First, such acoustic events would have to reliably occur relative to different target positions and in most of the randomly generated background sounds. Second, the backgrounds were by construction homogenous over time (Fig. 1A) and hence devoid of isolated envelope modulations that may drive significant evoked responses. To further rule out such a sensory cause for the relationship between oscillatory activity and target detection, we performed an analysis relating the structure of the background sound in a time period of 400 to 200 ms before target to the behavioral performance (see Material and Methods). Specifically, we correlated changes in sound intensity in this time window with the hit rate across target positions and subjects. The resulting correlations were small (<0.1) and insignificant (p > 0.6) for all time windows tested between 400 and 200 ms before target. It therefore seems very unlikely that specific acoustic events in the background sound caused both the subsequent oscillatory effects and the target miss.
We further examined the effects that power and phase independently exert on behavioral performance by computing power and phase histograms across all trials at selected time points that coincide with the maximal effect of power t = −132 ms and t = −200 ms. Because the effect of phase was more prominent on miss trials, we computed miss rates as a function of power and phase and normalized the resulting distributions for each subject. Figure 4A displays miss rate versus power and reveals larger miss rates for higher oscillatory power. This effect was significant (ANOVA, F(7,88) = 3.24, p < 0.005) and shows that variations in power can account for up to 40.6% of the variability in the detection performance. Figure 4B displays the miss rate versus phase (after across-subject alignment of phase ranges) and reveals a systematic influence of phase on detection performance (ANOVA, F(7,88) = 7.42, p < 0.001), which accounts for up to 28.0% of the variability (black trace). Finally, to identify possible interactions between power and phase to jointly affect performance, we divided trials into two sets according to high or low power (50th percentile) and recalculated miss-rate histograms as before. Both histograms were significantly modulated (low power, F(7,88) = 7.93, p < 0.001; high power, F(7,88) = 11.62, p < 0.001; Fig. 4B) and reveal a stronger impact of phase when oscillatory power was high (60.3 vs 35.0% of the variability; p < 0.05, paired t test).
Impact of prestimulus oscillatory state on response speed
We also found an impact of pre-target oscillatory state on response speed on those trials in which the target was detected. We compared power, phase coherence, and bifurcation index between groups of trials composed of the 40% fastest and 40% slowest trials (obtained by sorting hit trials for each subject according reaction time). Across subjects, reaction times differed significantly between “slow” and “fast” groups (Fig. 5A; fast, 0.53 ± 0.03 s; slow, 0.93 ± 0.06 s, mean ± SEM; paired t test, p < 0.001).
As with detection rates above, we found a significant difference in pre-target power between fast and slow trials (Fig. 5B, −240 to −232 ms, p < 0.01). Oscillation power was stronger for trials with slow reaction times and weaker for fast trials. This observation matches the above finding that low power generally enhances the subject's ability to detect the target and hence also to respond faster. Phase coherence was stronger for slow trials (albeit this was not significant), also in concordance with the above that phase concentration was higher on trials with reduced or slow target detection (Fig. 5C). The bifurcation index revealed a significant difference around the same epoch as the effect in power (Fig. 5D, −300 to −180 ms, p < 0.05) and also earlier (−400 to −390 ms). The positive bifurcation index suggests that phase histograms for fast and slow trials are both structured (increased phase coherence compared with all trials combined) but with different preferred phase angles. This opposite structuring of phase histograms for fast and slow trials was also visible at the single-subject level. The example data in Figure 5E shows that phase histograms for fast (red) and slow (blue) trials are more structured than the histogram accumulated across all hit trials (gray bars) and cluster around distinct phase angles. The subject-averaged (after phase alignment) differences between fast and slow phase histograms further confirmed this (Fig. 5F), and clearly peaked difference curves were obtained both when alignment was performed using slow (F(6,77) = 6.49, p < 0.001) and fast (F(6,77) = 3.16, p < 0.01) trials. This demonstrates that the oscillatory phase at prestimulus times affects reaction times on those trials in which the target was detected.
Impact of alpha-band activity on target detection
The above analysis focused on theta-band (2–6 Hz) signals because auditory cortical entrainment was strongest in this band in our EEG signals and because several previous studies have implied mechanistic roles of theta-band oscillations in auditory processing and perception (Luo and Poeppel, 2007; Schroeder et al., 2008; Schroeder and Lakatos, 2009; Giraud and Poeppel, 2012). However, previous studies on the visual system have found that the chance of detecting faint targets can be modulated by phase or power of alpha-band (8–12 Hz) oscillations rather than the more slower theta signal (Busch et al., 2009; Mathewson et al., 2009; Busch and VanRullen, 2010). To facilitate comparison with this previous work in the visual domain, we repeated the above analysis on alpha-band signals. Figure 6 displays the results in the same format as shown in Figure 3 for theta. Overall, we found little impact of alpha-band oscillations on target detection, and the difference time courses between hit and miss trials were mostly flat. Only phase coherence showed a trend toward higher phase coherence for miss trials (same as for theta above), but this reached statistical significance only at a single time point (Fig. 6B). We take these observations to suggest that alpha-band activity over auditory cortex plays little role in target detection in the present paradigm and that auditory perception is dominated by lower-frequency (i.e., theta) oscillations.
Figure 6.
Prestimulus alpha oscillations do not influence detection performance. A, Difference between hit and miss trials in alpha-band (8–12 Hz) power (n = 12, mean ± SEM). Negative values indicate higher power during miss trials. Time 0 corresponds to target onset, and green bars delineate epochs with a significant difference between hit and miss trials (paired t test, p < 0.01). B, Difference (hit − miss) in theta band (2–6 Hz) phase coherence. Same conventions as in A. Inset shows the topography of phase coherence difference. C, Phase bifurcation index (hit vs missed trials).
Discussion
We found that the probability of detecting a difficult target within a complex acoustic environment depends on the power and phase of theta (2–6 Hz) oscillations 200 ms before target but not on the state of auditory cortical alpha oscillations (8–12 Hz). Detection rates were higher and responses faster when theta power was low and both were modulated by pre-target phase. Intriguingly, this phase dependency was stronger for miss than for hit trials. The entrainment of slow cortical activity to dynamic environments is considered a critical feature for attentional selection, sensory amplification, and scene segregation (Schroeder and Lakatos, 2009; Giraud and Poeppel, 2012; Zion Golumbic et al., 2012). Our results suggest that this entrainment has negative implications, because stimuli may be systematically missed when inappropriately timed relative to sensory-entrained and attention-enhanced oscillations.
Role of oscillatory state for perception
Several studies showed that the oscillatory state of cortical networks critically influences the detection of upcoming stimuli (Busch et al., 2009; Vanrullen et al., 2011; Jensen et al., 2012). Such oscillatory-dependent detection was extensively explored in visual studies in the context of ongoing (spontaneous) prestimulus oscillations. The detection of faint targets was found to depend on the power (van Dijk et al., 2008; Romei et al., 2012) and phase (Busch et al., 2009; Mathewson et al., 2009) of alpha oscillations, and, using transcranial magnetic stimulation, it was shown that the phase of spontaneous oscillations directly modulates cortical excitability (Dugu é et al., 2011). Auditory studies have similarly investigated the impact of pre-target oscillatory state but did so mostly in paradigms in which oscillations were driven by discrete and periodic stimuli. These auditory studies found effects mostly at lower frequencies, such as the delta and theta bands (Luo and Poeppel, 2007; Lakatos et al., 2009; Schroeder and Lakatos, 2009; Stefanics et al., 2010; Besle et al., 2011; Ding and Simon, 2012). Our results reiterate this importance of theta-band over alpha-band oscillations in auditory cortex for stimulus detection.
The contrasting impact of theta and alpha oscillations in visual and auditory studies may have several causes. Visual studies often emphasize spatial tasks, and the alpha band has been especially implicated in mediating spatial attention (Busch and VanRullen, 2010; Bauer et al., 2012; Jensen et al., 2012). Hence, although alpha oscillations may reflect the deployment of spatial attention possibly also across sensory modalities, this alpha signal is not phase-locked to the acoustic environment. Indeed, many studies found reduced auditory entrainment in alpha compared with theta oscillations (Luo and Poeppel, 2007; Schroeder et al., 2008; Ding and Simon, 2012; Ng et al., 2012). Furthermore, although alpha signals may shape external attentional control on auditory cortex (Kerlin et al., 2010), the alpha rhythm of the auditory cortex itself does not seem crucial for the temporal hierarchy of oscillations implied in auditory scene analysis, which likely reflects the prominent timescales of natural sounds and speech (Ghitza, 2011). Future work is required to fully elucidate whether the differential importance of theta and alpha signals reflects intrinsic properties of either sensory systems or whether additional attributes of the oscillatory state (e.g., entrained vs spontaneous) shape the impact of theta and alpha phase for stimulus detection.
A precluding role of phase on target detection
An interesting result is that the prestimulus phase was more concentrated during miss compared with hit trials. This can best be interpreted as evidence that the oscillatory phase has a precluding rather than ensuring impact on perception: precluding because stimuli occurring during a “bad” phase regimen are likely missed, whereas stimuli occurring during other phases are subject to additional processing steps (e.g., beyond auditory cortex) that determine whether the target will be detected or not. An ensuring role of phase would imply the opposite scenario whereby a “good” phase regimen implies a high chance of target detection. We formalized these notions in a simple model consisting of a phase-dependent gating mechanism that determines the chance of target detection (Fig. 7). This model calculation shows that a precluding but not the ensuring gating function reproduces our observations of a stronger phase dependency of performance across subjects when aligned to each subject's phase of highest miss rate than when aligned to each subject's phase of highest hit rate (Fig. 7C). In previous studies of ongoing oscillatory phase, prestimulus phase were often found to exert both ensuring and precluding influences in stimulus detection (Busch et al., 2009; Mathewson et al., 2009), especially with the deployment of attention (Busch and VanRullen, 2010). Hence, our results support previous speculations about slow oscillations controlling the entry of sensory stimuli to perception while highlighting the existence of “windows of no-opportunity” rather than previously suggested “windows of opportunity” in stimulus-entrained oscillations.
Entrainment of oscillations to dynamic environments
We studied the impact of oscillatory phase on perception in a scenario in which oscillations were driven by the sensory environment. Slow delta and theta oscillations entrain to sound sequences or speech, as evidenced by studies on humans (Luo and Poeppel, 2007; Howard and Poeppel, 2010; Ng et al., 2012; Pasley et al., 2012) or animals (Lakatos et al., 2008; Kayser et al., 2009). One possibility by which entrainment can arise is that slow envelope modulations prominent in many natural sounds directly imprint on periodic excitability changes in cortical networks and effectively provide an intrinsic copy of the slow stimulus dynamics (Howard and Poeppel, 2010; Ding and Simon, 2012; Zion Golumbic et al., 2012). However, it could also well be that entrainment is induced by finer-grained (e.g., spectral) features of acoustic stimuli or higher-order properties of the temporal modulation spectrum, even in the absence of clearly visible envelope modulations (Ghitza, 2011). The causal mechanisms behind the entrainment of cortical oscillations clearly require additional investigation in future studies.
Entrainment has been observed across many experimental paradigms and supposedly directly reflects the feedforward afferent stimulus drive to sensory cortices. Not surprisingly, theories on auditory perception assign a vital role to stimulus-entrained oscillations (Schroeder and Lakatos, 2009; Giraud and Poeppel, 2012; Zion Golumbic et al., 2012). Entrained oscillations and the underlying periodic network changes create a direct alignment between sensory environment and neural excitability on those timescales relevant for communication sounds and speech. Auditory neurons phase-lock to slow rhythms (Kayser et al., 2009), creating temporally chunked spiking responses that are aligned with the acoustic environment. Theta oscillations may hence provide an intrinsic temporal reference for the sequencing and integration of information over time (Panzeri et al., 2010; Giraud and Poeppel, 2012): spiking activity and gamma oscillations may reflect individual sensory features with high temporal precision (Lisman, 2005; Fries et al., 2007), and their nesting into different phase ranges of theta oscillations may reflect the temporal organization of this information over time (Kwag et al., 2011). That theta cycles constitute a key computational unit for the representation of information is suggested by single-neuron recordings in cortical structures (Panzeri et al., 2010), and psychophysical studies have provided key evidence that speech perception involves integrative mechanisms on the scale of theta oscillations (Ghitza, 2011; Zion Golumbic et al., 2012). When interpreting our results, these theories suggest that enhanced theta activity may favor an integrated neural representation over the representation of individual constituent sensory features, hence the representation of the “whole” rather than acoustic details. This may explain why the target, one of many tokens embedded within the complex environment, was more likely to be missed after enhanced theta oscillations.
Attention modulates rhythms and target detection
Previous studies suggest that the degree to which oscillatory phase can impact perception is under cognitive control. Schroeder and colleagues advocated that attention determines the input stream to which slow oscillations entrain and thereby enhance the processing of appropriately timed stimuli by controlling the timing of cortical low-frequency oscillations (Lakatos et al., 2008; Schroeder and Lakatos, 2009; Stefanics et al., 2010; Besle et al., 2011). In our experiment, subjects were required to perform a difficult task requiring the detection of a brief target embedded somewhere within a complex background. However, in contrast to classical studies on attention that use multiple auditory streams (Elhilali et al., 2009; Ahveninen et al., 2011), the target in the present study was essentially part of the sound cacophony and not distinguished from this by distinct spatial or spectral features. Because attention to the auditory scene was crucial for the task, our results are best interpreted as highlighting the impact of oscillatory phase on stimulus detection under attentional load rather than in the context of attentional competition. Increased oscillatory power and phase coherence before target may be interpreted as periods of enhanced attention to the auditory scene (Schroeder and Lakatos, 2009; Besle et al., 2011; Ding and Simon, 2012). Consequently, the observed trial-by-trial variations in target detection are consistent with an interpretation whereby attention-enhanced oscillatory entrainment precludes the detection of targets that are inappropriately timed relative to the entraining environment. Hence, our results show that attentional enhancement of stimulus-entrained oscillations comes at the benefit of possibly enhancing the processing of some and possibly expected targets (Schroeder and Lakatos, 2009; Stefanics et al., 2010) but also comes at the cost of missing other, perhaps more surprising, stimuli.
Footnotes
This work was supported by the Max Planck Society and the Bernstein Center for Computational Neuroscience Tübingen, funded by the German Federal Ministry of Education and Research Grant FKZ 01GQ1002. We are grateful to Andreas Bartels for advice and help with the EEG experiments.
References
- Ahveninen J, Hämäläinen M, Jääskeläinen IP, Ahlfors SP, Huang S, Lin FH, Raij T, Sams M, Vasios CE, Belliveau JW. Attention-driven auditory cortex short-term plasticity helps segregate relevant sounds from noise. Proc Natl Acad Sci U S A. 2011;108:4182–4187. doi: 10.1073/pnas.1016134108. [DOI] [PMC free article] [PubMed] [Google Scholar]
- Bauer M, Kluge C, Bach D, Bradbury D, Heinze HJ, Dolan RJ, Driver J. Cholinergic enhancement of visual attention and neural oscillations in the human brain. Curr Biol. 2012;22:397–402. doi: 10.1016/j.cub.2012.01.022. [DOI] [PMC free article] [PubMed] [Google Scholar]
- Besle J, Schevon CA, Mehta AD, Lakatos P, Goodman RR, McKhann GM, Emerson RG, Schroeder CE. Tuning of the human neocortex to the temporal dynamics of attended events. J Neurosci. 2011;31:3176–3185. doi: 10.1523/JNEUROSCI.4518-10.2011. [DOI] [PMC free article] [PubMed] [Google Scholar]
- Bregman AS. Auditory scene analysis: the perceptual organization of sound. Cambridge, MA: Massachusetts Institute of Technology; 1994. [Google Scholar]
- Burkard RF, Eggermont JJ, Don M. Auditory evoked potentials: basic principles and clinical application. Baltimore: Lippincott Williams and Wilkins; 2007. [Google Scholar]
- Busch NA, VanRullen R. Spontaneous EEG oscillations reveal periodic sampling of visual attention. Proc Natl Acad Sci U S A. 2010;107:16048–16053. doi: 10.1073/pnas.1004801107. [DOI] [PMC free article] [PubMed] [Google Scholar]
- Busch NA, Dubois J, VanRullen R. The phase of ongoing EEG oscillations predicts visual perception. J Neurosci. 2009;29:7869–7876. doi: 10.1523/JNEUROSCI.0113-09.2009. [DOI] [PMC free article] [PubMed] [Google Scholar]
- Delorme A, Makeig S. EEGLAB: an open source toolbox for analysis of single-trial EEG dynamics. J Neurosci Methods. 2004;134:9–21. doi: 10.1016/j.jneumeth.2003.10.009. [DOI] [PubMed] [Google Scholar]
- Ding N, Simon JZ. Neural coding of continuous speech in auditory cortex during monaural and dichotic listening. J Neurophysiol. 2012;107:78–89. doi: 10.1152/jn.00297.2011. [DOI] [PMC free article] [PubMed] [Google Scholar]
- Drewes J, VanRullen R. This is the rhythm of your eyes: the phase of ongoing electroencephalogram oscillations modulates saccadic reaction time. J Neurosci. 2011;31:4698–4708. doi: 10.1523/JNEUROSCI.4795-10.2011. [DOI] [PMC free article] [PubMed] [Google Scholar]
- Dugu é L, Marque P, VanRullen R. The phase of ongoing oscillations mediates the causal relation between brain excitation and visual perception. J Neurosci. 2011;31:11889–11893. doi: 10.1523/JNEUROSCI.1161-11.2011. [DOI] [PMC free article] [PubMed] [Google Scholar]
- Elhilali M, Xiang J, Shamma SA, Simon JZ. Interaction between attention and bottom-up saliency mediates the representation of foreground and background in an auditory scene. PLoS Biol. 2009;7:e1000129. doi: 10.1371/journal.pbio.1000129. [DOI] [PMC free article] [PubMed] [Google Scholar]
- Fries P, Nikolić D, Singer W. The gamma cycle. Trends Neurosci. 2007;30:309–316. doi: 10.1016/j.tins.2007.05.005. [DOI] [PubMed] [Google Scholar]
- Ghitza O. Linking speech perception and neurophysiology: speech decoding guided by cascaded oscillators locked to the input rhythm. Front Psychol. 2011;2:130. doi: 10.3389/fpsyg.2011.00130. [DOI] [PMC free article] [PubMed] [Google Scholar]
- Giraud AL, Poeppel D. Cortical oscillations and speech processing: emerging computational principles and operations. Nat Neurosci. 2012;15:511–517. doi: 10.1038/nn.3063. [DOI] [PMC free article] [PubMed] [Google Scholar]
- Howard MF, Poeppel D. Discrimination of speech stimuli based on neuronal response phase patterns depends on acoustics but not comprehension. J Neurophysiol. 2010;104:2500–2511. doi: 10.1152/jn.00251.2010. [DOI] [PMC free article] [PubMed] [Google Scholar]
- Jensen O, Bonnefond M, VanRullen R. An oscillatory mechanism for prioritizing salient unattended stimuli. Trends Cogn Sci. 2012;16:200–206. doi: 10.1016/j.tics.2012.03.002. [DOI] [PubMed] [Google Scholar]
- Kayser C, Montemurro MA, Logothetis NK, Panzeri S. Spike-phase coding boosts and stabilizes information carried by spatial and temporal spike patterns. Neuron. 2009;61:597–608. doi: 10.1016/j.neuron.2009.01.008. [DOI] [PubMed] [Google Scholar]
- Kerlin JR, Shahin AJ, Miller LM. Attentional gain control of ongoing cortical speech representations in a “cocktail party.”. J Neurosci. 2010;30:620–628. doi: 10.1523/JNEUROSCI.3631-09.2010. [DOI] [PMC free article] [PubMed] [Google Scholar]
- Kwag J, McLelland D, Paulsen O. Phase of firing as a local window for efficient neuronal computation: tonic and phasic mechanisms in the control of theta spike phase. Front Hum Neurosci. 2011;5:3. doi: 10.3389/fnhum.2011.00003. [DOI] [PMC free article] [PubMed] [Google Scholar]
- Lakatos P, Karmos G, Mehta AD, Ulbert I, Schroeder CE. Entrainment of neuronal oscillations as a mechanism of attentional selection. Science. 2008;320:110–113. doi: 10.1126/science.1154735. [DOI] [PubMed] [Google Scholar]
- Lakatos P, O'Connell MN, Barczak A, Mills A, Javitt DC, Schroeder CE. The leading sense: supramodal control of neurophysiological context by attention. Neuron. 2009;64:419–430. doi: 10.1016/j.neuron.2009.10.014. [DOI] [PMC free article] [PubMed] [Google Scholar]
- Lehmann D, Skrandies W. Time segmentation of evoked potentials (EPs) based on spatial scalp field configuration in multichannel recordings. Electroencephalogr Clin Neurophysiol Suppl. 1986;38:27–29. [Google Scholar]
- Lisman J. The theta/gamma discrete phase code occurring during the hippocampal phase precession may be a more general brain coding scheme. Hippocampus. 2005;15:913–922. doi: 10.1002/hipo.20121. [DOI] [PubMed] [Google Scholar]
- Luo H, Poeppel D. Phase patterns of neuronal responses reliably discriminate speech in human auditory cortex. Neuron. 2007;54:1001–1010. doi: 10.1016/j.neuron.2007.06.004. [DOI] [PMC free article] [PubMed] [Google Scholar]
- Mathewson KE, Gratton G, Fabiani M, Beck DM, Ro T. To see or not to see: prestimulus alpha phase predicts visual awareness. J Neurosci. 2009;29:2725–2732. doi: 10.1523/JNEUROSCI.3963-08.2009. [DOI] [PMC free article] [PubMed] [Google Scholar]
- Montemurro MA, Rasch MJ, Murayama Y, Logothetis NK, Panzeri S. Phase-of-firing coding of natural visual stimuli in primary visual cortex. Curr Biol. 2008;18:375–380. doi: 10.1016/j.cub.2008.02.023. [DOI] [PubMed] [Google Scholar]
- Murray MM, Brunet D, Michel CM. Topographic ERP analyses: a step-by-step tutorial review. Brain Topogr. 2008;20:249–264. doi: 10.1007/s10548-008-0054-5. [DOI] [PubMed] [Google Scholar]
- Ng BS, Logothetis NK, Kayser C. EEG phase patterns reflect the selectivity of neural firing. Cereb Cortex. 2012 doi: 10.1093/cercor/bhs031. [DOI] [PubMed] [Google Scholar]
- Nunez PL, Srinivasan R. Electric fields of the brain: the neurophysics of EEG. New York: Oxford UP; 2006. [Google Scholar]
- Panzeri S, Brunel N, Logothetis NK, Kayser C. Sensory neural codes using multiplexed temporal scales. Trends Neurosci. 2010;33:111–120. doi: 10.1016/j.tins.2009.12.001. [DOI] [PubMed] [Google Scholar]
- Pasley BN, David SV, Mesgarani N, Flinker A, Shamma SA, Crone NE, Knight RT, Chang EF. Reconstructing speech from human auditory cortex. PLoS Biol. 2012;10:e1001251. doi: 10.1371/journal.pbio.1001251. [DOI] [PMC free article] [PubMed] [Google Scholar]
- Rajkai C, Lakatos P, Chen CM, Pincze Z, Karmos G, Schroeder CE. Transient cortical excitation at the onset of visual fixation. Cereb Cortex. 2008;18:200–209. doi: 10.1093/cercor/bhm046. [DOI] [PubMed] [Google Scholar]
- Romei V, Brodbeck V, Michel C, Amedi A, Pascual-Leone A, Thut G. Spontaneous fluctuations in posterior alpha-band EEG activity reflect variability in excitability of human visual areas. Cereb Cortex. 2008;18:2010–2018. doi: 10.1093/cercor/bhm229. [DOI] [PMC free article] [PubMed] [Google Scholar]
- Romei V, Gross J, Thut G. Sounds reset rhythms of visual cortex and corresponding human visual perception. Curr Biol. 2012;22:807–813. doi: 10.1016/j.cub.2012.03.025. [DOI] [PMC free article] [PubMed] [Google Scholar]
- Schroeder CE, Lakatos P. Low-frequency neuronal oscillations as instruments of sensory selection. Trends Neurosci. 2009;32:9–18. doi: 10.1016/j.tins.2008.09.012. [DOI] [PMC free article] [PubMed] [Google Scholar]
- Schroeder CE, Lakatos P, Kajikawa Y, Partan S, Puce A. Neuronal oscillations and visual amplification of speech. Trends Cogn Sci. 2008;12:106–113. doi: 10.1016/j.tics.2008.01.002. [DOI] [PMC free article] [PubMed] [Google Scholar]
- Sirota A, Montgomery S, Fujisawa S, Isomura Y, Zugaro M, Buzsáki G. Entrainment of neocortical neurons and gamma oscillations by the hippocampal theta rhythm. Neuron. 2008;60:683–697. doi: 10.1016/j.neuron.2008.09.014. [DOI] [PMC free article] [PubMed] [Google Scholar]
- Skrandies W. Global field power and topographic similarity. Brain Topogr. 1990;3:137–141. doi: 10.1007/BF01128870. [DOI] [PubMed] [Google Scholar]
- Stefanics G, Hangya B, Hernádi I, Winkler I, Lakatos P, Ulbert I. Phase entrainment of human delta oscillations can mediate the effects of expectation on reaction speed. J Neurosci. 2010;30:13578–13585. doi: 10.1523/JNEUROSCI.0703-10.2010. [DOI] [PMC free article] [PubMed] [Google Scholar]
- van Dijk H, Schoffelen JM, Oostenveld R, Jensen O. Prestimulus oscillatory activity in the alpha band predicts visual discrimination ability. J Neurosci. 2008;28:1816–1823. doi: 10.1523/JNEUROSCI.1853-07.2008. [DOI] [PMC free article] [PubMed] [Google Scholar]
- Vanrullen R, Busch NA, Drewes J, Dubois J. Ongoing EEG phase as a trial-by-trial predictor of perceptual and attentional variability. Front Psychol. 2011;2:60. doi: 10.3389/fpsyg.2011.00060. [DOI] [PMC free article] [PubMed] [Google Scholar]
- Zion Golumbic EM, Poeppel D, Schroeder CE. Temporal context in speech processing and attentional stream selection: a behavioral and neural perspective. Brain Lang. 2012 doi: 10.1016/j.bandl.2011.12.010. [DOI] [PMC free article] [PubMed] [Google Scholar]