

Abstract
Feature-based attention is known to operate in a spatially global manner, in that the selection of attended features is not bound to the spatial focus of attention. Here we used electromagnetic recordings in human observers to characterize the spatiotemporal signature of such global selection of an orientation feature. Observers performed a simple orientation-discrimination task while ignoring task-irrelevant orientation probes outside the focus of attention. We observed that global feature-based selection, indexed by the brain response to unattended orientation probes, is composed of separable functional components. One such component reflects global selection based on the similarity of the probe with task-relevant orientation values (“template matching”), which is followed by a component reflecting selection based on the similarity of the probe with the orientation value under discrimination in the focus of attention (“discrimination matching”). Importantly, template matching occurs at ∼150 ms after stimulus onset, ∼80 ms before the onset of discrimination matching. Moreover, source activity underlying template matching and discrimination matching was found to originate from ventral extrastriate cortex, with the former being generated in more anterolateral and the latter in more posteromedial parts, suggesting template matching to occur in visual cortex higher up in the visual processing hierarchy than discrimination matching. We take these observations to indicate that the population-level signature of global feature-based selection reflects a sequence of hierarchically ordered operations in extrastriate visual cortex, in which the selection based on task relevance has temporal priority over the selection based on the sensory similarity between input representations.
Introduction
The neural mechanisms underlying feature-based attention (FBA) have been intensively investigated with single-cell recordings in animals. A way to document FBA effects in such studies is to assess the firing response to feature probes presented in the receptive field (RF) of a cell away from the spatial focus of attention. This experimental setup showed that FBA is reflected by an enhancement of firing gain of feature-selective cells (Motter, 1994; McAdams and Maunsell, 1999, 2000; Treue and Martínez Trujillo, 1999; Bichot et al., 2005; Cohen and Maunsell, 2011). Moreover, it demonstrated that FBA operates in a spatially global way, that is, outside the spatial focus of attention (Maunsell and Treue, 2006). Signatures of global FBA were also documented at the neural population level with fMRI and electromagnetic recordings [electroencephalogram (EEG)/magnetoencephalogram (MEG)] in humans (Saenz et al., 2002; Hopf et al., 2004; Zhang and Luck, 2009; Boehler et al., 2011a; Jehee et al., 2011). For example, Saenz et al. (2002) showed that attention to color or motion direction in one visual hemifield increased the BOLD response in striate and extrastriate cortex contralateral to a matching color or motion direction in the unattended visual hemifield. EEG/MEG recordings in subjects performing a visual search task revealed that a task-relevant orientation feature was selected throughout the visual field (VF) before spatial focusing onto the target—a form of global selection that was indexed by an early-latency negative-polarity modulation of the event-related potential (ERP) (Hopf et al., 2004).
Still, at the population level, the mechanisms underlying global FBA are characterized in less detail than at the single-neuron level. In the monkey, the modulation of the firing gain underlying FBA was shown to be a multiplicative function of the similarity between the tuning of a cell and the attended feature outside its RF [feature-similarity gain account (Treue and Martínez Trujillo, 1999)] but not a function of the degree of similarity between a feature probe inside the RF of the cell and the feature presented in the focus of attention (Martinez-Trujillo and Treue, 2004). This refers to an important yet unsettled issue of experiments demonstrating global FBA at the population level: what is the exact type of matching operation giving rise to global FBA? Specifically, does global FBA arise as a result of the similarity between a feature presented outside the spatial focus of attention and task-relevant feature descriptions held in memory, or as a result of a match between a feature and the actual feature discriminated inside the focus of attention? The first alternative refers to a match against a feature template (“template matching”), whereas the second refers to the physical match between attended features of simultaneously presented items, no matter whether they match the target descriptions in memory or not (“discrimination matching”).
Here, we report data from experiments aimed at dissociating between these alternatives in the domain of attention to orientation. We show that global FBA reflects both similarity relations, operating in sequence. Global selection as a result of template matching arises ∼80 ms before global selection because of discrimination matching in separate regions of the occipital–temporal cortex, consistent with a hierarchical priority order of selection.
Materials and Methods
Subjects.
Twenty-one subjects participated in experiment 1 (19 females; mean age, 25.8 years; one left-handed), 36 in experiment 2 (28 females; mean age, 25.3 years; all right-handed), and 18 in experiment 3 (15 females; mean age, 25.8 years; all right-handed). All subjects were students of the University of Magdeburg (Magdeburg, Germany), gave informed consent, and were paid for participation. The experiments were approved by the ethics board of the University of Magdeburg. All subjects were neurologically normal students with normal or corrected-to-normal visual acuity.
Experiment 1: experimental procedure.
On each trial, subjects viewed two oriented gratings (Fig. 1), one in the left (LVF) and one in the right (RVF) VF. The grating in the LVF always served as the target and the one in the RVF as an orientation feature probe (in short, “probe”). The target was either vertical (0°) or horizontal (90°), and subjects had to report its orientation with a two-alternative button press (index and middle fingers of the right hand). The simultaneously presented probe differed from the target in a range of orientations from no difference (0° orientation difference; OD0°) to orthogonal (OD90°) in steps of 15°. The OD variation was used to assess the brain response to the probe as a function of orientation similarity between the probe and the target on a given trial (discrimination matching), as well as between the probe and the target descriptions held in memory (template matching). At OD0° and OD90°, the probe matched the target description held in memory but, on a given trial, was either matching the orientation of the target (OD0°) or was at maximum mismatch with the orientation of the target (OD90°). As illustrated in the diagram in Figure 1, accounts in terms of discrimination matching (open circles) and template matching (filled circles) make similar predictions for OD0°–OD45° because both decrease with increasing OD. In contrast, in the OD45°-OD90° range, the probe-to-target similarity is further reduced, whereas the probe-to-template similarity increases to match the orientation template at OD90° (implicitly assuming that probe-to-template similarity is determined by the one template-orientation that is most similar to the probe). Hence, the OD45°–OD90° range permits us to dissociate between the alternative matching relationships. If global FBA arises as a result of template matching, it should appear for both the OD0° and the OD90°, with OD45° showing the smallest response. Alternatively, if global FBA arises as a result of plain discrimination matching, OD90° should yield a smaller response than OD45°.
Figure 1.

Experimental conditions and predictions of experiment 1. While fixating the central fixation cross, subjects attended the LVF (dashed circle) for discriminating the orientation of a target grating (shown left to fixation). The target was either vertical or horizontal (template) and paired with a task-irrelevant orientation probe in the unattended RVF (black gratings). The orientation of the probe differed from the orientation of the target by seven possible orientation differences (OD0°, OD15°, OD30°, OD45°, OD60°, OD75°, and OD90°), here shown with reference to a vertical target. The diagram sketches the predictions of experiment 1, with the predicted brain response to the probe being plotted in the y direction. If the probe response reflects the similarity between the orientation of the probe and the template (template matching), the response should be largest for OD0° and OD90° trials, with OD45° showing the smallest response (filled circles). In contrast, if the probe response reflects the similarity between the orientation of the probe and the actual orientation of the target on a given trial (discrimination matching), the response should be largest for OD0°, intermediate for OD45°, and smallest for OD90° trials (open circles).
Experiment 1: stimuli.
The gratings were circular patches (2.3° of visual angle in diameter) of high-contrast black/white alternating stripes with a spatial frequency of 1.52 cycles per degree of visual angle and presented 4.0° lateral (LVF and RVF) and 2.3° below the fixation cross in the center of the screen (eye-to-screen distance of 100 cm). Gratings were presented for 700 ms in a trial-by-trial manner with a jittered intertrial stimulus onset asynchrony of 1500–2000 ms (rectangular distribution). Subjects performed six blocks of 280 trials, amounting to a total of 240 trials per OD condition.
Experiment 2: stimuli and procedure.
Stimuli and stimulation protocol were identical to experiment 1 except for the following modifications introduced to change the set of task-relevant orientation features held in memory. As in experiment 1, the orientation of the probe varied randomly from trial to trial in a range of seven orientations (0°, 15°, 30°, 45°, 60°, 75°, and 90°). The target, however, varied between two orientations differing only by 15° (either from horizontal or from vertical). Specifically, for half of the subjects, the target orientation was either vertical or 15° tilted clockwise, whereas for the other half of the subjects, the target was either horizontal or 15° tilted counterclockwise. A given subject performed only vertical or horizontal and the corresponding tilt to avoid that orthogonal (OD90°) probes gain some overall relevance above that of OD45° probes throughout the experimental session. Each subject performed six trial blocks containing 280 trials, resulting in a total of 120 trials per experimental condition.
Experiment 3: stimuli and procedure.
Stimuli and stimulation protocol were identical to experiment 1 except for two important modifications. (1) To assess the passive responsiveness of the cortex corresponding to the VF of probe presentation, we interrupted the probe presentation between 150 and 200 ms after probe onset randomly on 50% of the trials. The gap elicits a response on its own (gap response) and was isolated by subtracting the response to trials without a gap (probe-only trials) from trials with a gap (probe-gap trials) of the same OD condition. The gap response was then analyzed as a function of the OD variation between the target and the probe. (2) Because this halved the number of trials per OD condition, we used only three essential OD conditions (OD0°, OD45°, OD90°) sufficient to characterize the effect of global FBA. Subjects performed five blocks of 280 trials, amounting to a total of 140 trials per OD and gap condition.
Data recording.
The EEG was recorded using a 32-electrode cap (Ag/AgCl electrodes; Falk Minow Services) and a EPA-6 amplifier system (Sensorium). The MEG was recorded with a 248-channel BTI Magnes whole-head magnetometer system (4-D Neuroimaging Magnes WH 3600). EEG and MEG were simultaneously recorded in a magnetically shielded (Mu-metal) recording chamber, sampled at 508 Hz after applying online analog low-pass filtering (direct current to 50 Hz). The rejection of environmental magnetic artifacts was performed online based on a reference environmental coil system (described by Robinson, 1989). The EEG signal was recorded with reference to the right mastoid and offline re-referenced to the algebraic mean of the left and right mastoid. Impedances were kept <5 kΩ, and an electrode placed at FPZ served as ground. For monitoring eye-movement artifacts, an electro-oculogram (EOG) was recorded with bipolar montages of electrodes at the left and right outer canthies, as well as above and below the right eye. Fixation performance was also monitored with a custom-made zoom lens infrared camera system.
Data analyses.
EEG and MEG were continuously recorded and subsequently separated into epochs spanning from 200 ms before to 700 ms after stimulus onset. Before averaging, offline artifact rejection (eye movements, muscle tension artifacts, etc.) was performed based on a peak-to-peak amplitude threshold criterion (EOG, 90 μV; MEG, 2.5 pT). ERP and event-related magnetic field (ERMF) responses were then computed by selective averaging of epochs elicited by the experimental conditions of interest, relative to a baseline interval of 200 ms before stimulus onset. Epochs containing eye movements, artifacts, or incorrect responses were excluded from averaging. For statistical data validation, repeated-measures ANOVA (rANOVA) were performed on mean amplitude measures in time ranges of interest. If necessary, violations of data sphericity were controlled for by applying Greenhouse–Geisser epsilon correction (corrected p values reported). To determine the temporal onset of waveform differences, a sliding-window ANOVA approach was used (Guthrie and Buchwald, 1991), in which mean amplitudes in a 20 ms time window were tested for consecutive time samples of a time range of interest. The first of at least three consecutive time samples showing significant effects was taken as the temporal onset of a waveform difference. Waveforms and amplitude measures will be reported for the electrode site showing the maximum grand-average amplitude variation as a function of OD condition contralateral to the VF of probe presentation.
Note that the pattern of simultaneously recorded ERMF responses was fully consistent with the ERP results. Respective waveforms will, however, not be discussed below to keep data presentation succinct. The MEG waveforms do not add qualitatively new information to what is revealed by the ERP waveforms. Nonetheless, because of a number of favorable physical properties, MEG data are likely to improve current source localization analyses when combined with the ERP data (Hämäläinen et al., 1993). Both datasets were therefore combined for source localization.
Current source localization.
For localizing current sources, distributed source models were computed on the combined EEG and MEG signal by using the minimum-norm least-squares method (Hämäläinen and Ilmoniemi, 1984; Fuchs et al., 1999) as implemented in the multimodal neuroimaging software Curry 6.0 (Compumedics Neuroscan). Inverse modeling was constrained by realistic anatomical models of the volume conductor and the current source compartment, obtained from segmentations [boundary element method (BEM) (Fuchs et al., 1998) as provided with Curry 6.0] of high-resolution MR scans. For the grand-average data (over subjects), segmentations of the MNI brain (Montreal Neurological Institute, average 152 T1-weighted stereotaxic volumes of the ICBM project, ICBM152) were used. Source-density estimates in individual subjects were constrained by segmentations of individual anatomical data (T1-weighted three-dimensional spoiled gradient echo sequence; 256 × 256 matrix; field of view, 25 × 25 cm; 124 slices; slice thickness, 1.5 mm; in-plane resolution, 0.97 × 0.97 mm; echo time, 8 ms; repetition time, 24 ms; flip angle, 30°) if available. Individual MR scans were not available in nine subjects of experiment 1 and in 17 subjects of experiment 2. In these cases, source localization was based on segmentations of the MNI brain after transforming the subjects' individual localization coordinates into the MNI reference space.
A three-layer BEM consisting of triangularizations of the CSF space, the skull bone, and the skull skin served as model for the volume conductor. A one-layer 3D segmentation of the gray-matter served as source compartment. To provide anatomical constraints on source modeling of grand-average data, analogous segmentations of the MNI brain (Montreal Neurological Institute, average 152 T1-weighted stereotaxic volumes of the ICBM project, ICBM152) were used. To coregister MEG sensor positions with EEG electrode positions, five magnetic localizers (spatial marker coils) were placed at defined locations in the EEG cap. In each subject, the position of those marker coils was digitized together with the position of electrode locations. Finally, to coregister anatomical data (individual anatomical models of the volume conductor and cortical source compartment) and functional data (EEG/MEG), individual anatomical landmarks were digitized (Polhemus 3Space Fastrak system) and then brought into reference with corresponding anatomical landmarks identified in the MR data. For the grand average across subjects, the landmark coordinate system of each individual subject was adjusted to the most prototypical subject's reference system, by coregistering anatomical fiducial points defined by the left and right pre-auricular points and the nasion.
Results
Experiment 1
Behavioral performance
Figure 2a summarizes the mean response time (RT) and accuracy data for the different OD conditions of experiment 1. RT varies among conditions, with fastest responses appearing for the OD45° condition. With the exception of OD60°, responses become faster as they approach OD45° and become slower as they approach OD90°. An rANOVA with a seven-level factor OD validates the overall presence of RT effects (F(6,120) = 16.84, p < 0.0001). The results of subsequent pairwise comparisons are summarized by the matrix chart to the top right of the bar graph. Significant comparisons (p < 0.05, Bonferroni's corrected for multiple comparisons) are highlighted by gray squares. Performance accuracy (Fig. 2a, right) was generally high and varied as a function of OD, with OD75° and OD90° showing slight performance decrements relative to all other OD conditions. This is confirmed by an overall rANOVA (F(6,120) = 9.29, p < 0.0001), as well as by subsequent pairwise comparisons summarized in the corresponding matrix chart. The slight drop in accuracy appears to suggest an effect of discrimination matching, but it is only significant for OD90° and may rather be an effect of response compatibility because target and probe orientation map onto response alternatives. However, this pattern is not reflected by the RT data, which should then show faster responses for OD0° than OD90°. Conversely, responses to OD45° are faster relative to OD0° and OD90°, with no difference between the latter—a pattern fitting with an effect of template matching.
Figure 2.

Behavioral performance of experiment 1 (a), experiment 2 (b), and experiment 3 (c). a, b, Mean RT (left) and proportion (percentage) of correct responses (right) are shown separately for the seven different probe-target orientation differences (probe-target ODs: 0°, 15°, 30°, 45°, 60°, 75°, and 90°). The vertical lines show the SEM. The matrix chart to the top right of each bar graph summarizes the results of corresponding pairwise statistical comparisons (t tests) between OD conditions. Gray indexes significant (p < 0.05, Bonferroni's corrected for multiple comparisons) differences. n.s., Not significant. c, Mean RT (left) and percentage correct responses (right) of the three probe-target orientation differences of experiment 3. Performance data are shown separately for probe-only (bright gray) and probe-gap (dark gray) trials. The charts to the right show the results of corresponding pairwise comparisons of OD conditions between probe-only and probe-gap trials (squares within the bold frame), as well as within probe-only and probe-gap trials (squares flanking the bold frame).
Electromagnetic recordings
Figure 3a shows the ERP response recorded from a parieto-occipital electrode site over the left hemisphere (PO7) contralateral to the VF of probe presentation. Note that, because of the contralateral retinotopic organization of the visual cortex, left hemisphere electrode sites will primarily reflect activity elicited by stimuli in the RVF, that is, activity corresponding with the probe. Shown are selected waveforms elicited by probes that differed from the target by 0° (thick solid), 45° (thin solid), and 90° (dashed). Although the three waveforms display a similar sequence of components, there are significant amplitude differences arising in the time range of the N1 (150–200 ms), the N2 (230–330 ms), and also in a later time range. An overall one-way rANOVA with a seven-level factor OD (0°, 15°, 30°, 45°, 60°, 75°, 90°) on mean-amplitude measures in these time ranges confirms this by yielding significant effects between 150 and 200 ms (F(6,120) = 3.62, p < 0.005), between 230 and 330 ms (F(6,120) = 6.06, p < 0.005), and in the subsequent time range of the P3 component between 350 and 600 ms (F(6,120) = 9.07, p < 0.0005). To determine the exact temporal onset of OD-related amplitude modulations, a sliding-window rANOVA analysis performed in a time range between 0 and 500 ms (see Materials and Methods), which revealed that the first significant amplitude effect (p < 0.05, black horizontal bar in a) arises at 150 ms after stimulus onset. This amplitude effect is characterized by a negative voltage enhancement for OD0° relative to OD45° until ∼200 ms (bright gray area between traces)—a negativity resembling the modulation known to index global FBA in previous reports (Hopf et al., 2004). A pairwise comparison of the mean amplitude of the OD45° and OD0° conditions between 150 and 200 ms yielded a significant effect (p < 0.05). Importantly, in the N1 time range, the OD90° condition does also show a negative enhancement relative to OD45° (p < 0.05), but there is no significant difference between the OD0° and the OD90° conditions (p = 0.33). This is further summarized in b, showing a bar plot of the average negative enhancement between 150 and 200 ms separately for the different OD conditions relative to the amplitude of the OD45° condition. The negativity to the OD0° is largest and falls to a minimum, with increasing OD toward OD45°. Critically, at OD90°, the negative response is large, thereby approaching the effect size at OD15°, a pattern clearly in line with template matching underlying the amplitude modulation in the N1 time range.
Figure 3.

Average ERP waveforms (average across subjects) and amplitude measures of experiment 1 (a–c) and experiment 2 (d–f). a, Waveforms of the OD0° (solid thick line), OD45° (solid thin line), and OD90° (dashed line) conditions recorded from a left parietal–occipital electrode showing maximum effect size (PO7) in experiment 1. Amplitude effects reflecting global FBA in the N1 and N2 time range are highlighted by the bright and dark gray areas between curves, respectively. The black horizontal bars index periods of significant amplitude differences (p < 0.05, sliding-window F test). The bar plots on the right show mean amplitude measures of all OD conditions in the N1 (b) and N2 (c) time ranges. Data are referenced to the amplitude of the OD45° condition. The vertical lines show the SEM. d shows average ERP waveforms from electrode site PO9 showing maximum effect size in experiment 2. Modulation effects reflecting global FBA are highlighted in light gray (N1 time range) and dark gray (N2 time range). The bar plots on the right show corresponding mean amplitude measures (again referenced to the OD45° condition) for the different OD conditions in the N1 (e) and N2 (f) time ranges.
In contrast, when inspecting the subsequent N2 time range (230–330 ms, dark gray area in a), the pattern of response amplitude variation is qualitatively different from the previous N1 time range. As shown in c, the negative modulation to the OD0° condition is largest and becomes smaller toward OD45° (pairwise comparison OD0° vs OD45°, p < 0.05). From OD45° to OD90°, however, the response to the probe becomes even less negative (pairwise comparison OD0° vs OD90°, p < 0.0001), turning into a positive modulation relative to the OD45° condition. To further validate the different amplitude patterns in the N1 and N2 time range, a two-way rANOVA with a factor latency range (150–200 and 230–330 ms) and a seven-level factor OD was computed, which yielded significant main effects of latency range (F(1,20) = 97.6, p < 0.0001) and OD (F(6,120) = 5.2, p < 0.005) but most importantly also a significant interaction (F(6,120) = 3.7, p < 0.05). Hence, in view of our predictions, the pattern of amplitude modulations in the N2 time window is consistent with discrimination matching being the critical determinant of global FBA. In contrast, the amplitude pattern between 150 and 200 ms suggests that template matching is the mechanism underlying global FBA in the N1 time range.
Source localization analysis
Figure 4 shows the distribution maps of source activity underlying the global FBA effect, which is represented by the electromagnetic field difference OD0° − OD45° and OD45° − OD90°. Shown is the distribution of the grand average (a, c) as well as the distribution of individually estimated source-density maxima (b, d) rendered onto a cortical surface segmentation of the MNI brain. The distribution maps in a show estimates of the OD0° − OD45° difference at 190 ms (left) and 245 ms (right) after stimulus onset. c shows corresponding estimates of the OD90° − OD45° difference. At both time points, source-density maxima of the difference are located in the posterior lateral and ventral occipital cortex. However, a closer inspection of the maps in a and c suggests that the maxima at 245 ms (green and yellow circles) are positioned at a slightly more posterior and ventral location than the maxima at 190 ms (red and blue circles), which locate to a more anterior and lateral region. To evaluate whether this represents a systematic difference, the localization of source-density maxima was estimated in each individual subject based on individual anatomical data (if available; see Materials and Methods) and then transformed into the MNI reference space (see Materials and Methods). Figure 4b shows scatter plots of the maxima of the OD0° − OD45° difference in the N1 time range (150–200 ms, red dots) and in the N2 time range (230–330 ms, green). d shows analogous scatter plots for the OD90° − OD45° difference (blue, yellow). Maxima in the N2 time range (green, yellow) pool more posteriorly than the maxima in the N1 time range (red, blue), suggesting that source activity reflecting discrimination matching indeed arises from a more posterior cortical locus in ventral extrastriate cortex than source activity reflecting template matching. To further validate this topographical difference, we computed two-way rANOVAs with the factors “OD difference” (OD0° − OD45° and OD90° − OD45°) and “time point” (190 and 250 ms) on MNI coordinate measures along the x, y, and z directions. These analyses revealed significant main effects of time point along the x and y direction (x, p < 0.0001; y, p < 0.0001) but no effect of OD difference (x, p = 0.26; y, p = 0.21). Along the z direction, no clearly significant effect was seen, for neither time point (p = 0.08) nor OD difference (p = 0.98).
Figure 4.

Source localization results of experiment 1. a, Source-density distributions estimated for the OD0° − OD45° difference of the grand-averaged (over subjects) electromagnetic field response at representative time points in the N1 (190 ms, left) and N2 (245 ms, right) time ranges rendered onto 3D surface segmentations of the MNI brain. The red and green dots index source-density maxima in the early and late time ranges, respectively. The red dashed line highlights the location of the source-density maximum at 190 ms maximum in the 245 ms map. b shows respective source-density maxima (OD0° − OD45° difference) in the N1 (red) and N2 (green) time ranges of each individual subject taking part in experiment 1. c, Source-density estimates of the OD90° − OD45° difference. The blue dashed line highlights the location of the source-density maximum at 190 ms in the 245 ms map. d, Scatter plot of source-density maxima in the N1 (blue) and N2 (yellow) time ranges computed based on individual subject data.
In summary, experiment 1 shows that the electromagnetic signature of global FBA reflects both template and discrimination matching. Notably, these operations are dissociated in time during early visual processing, with selection based on template matching appearing before selection based on discrimination matching. Finally, the distribution of underlying cortical source activity in ventral extrastriate cortex differs such that template matching arises in a more anterolateral region relative to source activity reflecting discrimination matching.
Experiment 2
The observations of the first experiment suggest that global FBA proceeds in a sequence of different selection processes, with an initial process reflecting the degree of match against the attentional template, followed by a process reflecting the degree of match between object features that are discriminated in the focus of attention. Given such dissociation, it should be possible to influence the two phases of modulation independently. For example, an experimental manipulation that changes the set of orientation templates without altering the similarity relationships between the target and the probe would be expected to cause amplitude changes in the early N1 but not in the subsequent N2 time range. This prediction was addressed in experiment 2 with the simple manipulation of only having 15° between the two target orientations. In other words, we replaced OD90° with OD15° now matching the target definition, with the prediction that if, the negative enhancement in the N1 time range reflects template matching, it should now be absent for OD90° probes. As reported below, this is exactly what we observed.
Behavioral performance
Figure 2b shows mean RT and accuracy data for the different OD conditions of experiment 2. RT varies between conditions, with fastest responses appearing for the OD45° condition. An rANOVA with a seven-level factor OD validates the overall presence of RT effects (F(6,210) = 25.7, p < 0.0001). The results of subsequent pairwise comparisons are summarized in the corresponding matrix chart. Performance accuracy was generally high but did not vary significantly as a function of OD (F(6,210) = 1.62, p = 0.14). Subsequent pairwise comparisons are summarized in the adjacent matrix chart. As in experiment 1, RT performance is fastest for OD45° trials but does not show a pattern that would otherwise link in a systematic way with the experimental conditions.
Electromagnetic recordings
As visible in Figure 3d, the first OD-related ERP modulation appeared in the N1 time range between 160 and 200 ms (sliding-window ANOVA with a seven-level factor of OD). Like in experiment 1, the effect is characterized by an enhanced negativity to probes with the target orientation (bright gray area between curves in d) relative to the OD45° condition. This is confirmed by significant pairwise comparisons of mean amplitude measures in the N1 time range (OD0° vs OD45°, p < 0.01; OD15° vs OD45°, p < 0.05). However, in contrast to experiment 1, the response to OD90° probes in this time range is not enhanced relative to OD45° (p = 0.87). This is also visible in e, which summarizes mean amplitude measures between 160 and 200 ms of the different OD conditions relative to the amplitude of the OD45° condition. Hence, in line with our prediction, removing OD90° from the target description eliminates the respective negative enhancement of the N1, confirming that the amplitude modulation in this time range reflects template matching. Compared with experiment 1 (b), the N1 amplitude profile of experiment 2 shows a strong abrupt reduction at OD30° relative to OD15° and OD0°, with no difference between OD30° and OD45° (e). This change in profile is notable because it may reflect a narrower tuning (relative to experiment 1) of feature selectivity underlying template matching as a result of a much smaller orientation difference between the target orientations in experiment 2 (15° vs 90° in experiment 1). Such interpretation would align with the recent demonstration (in the motion domain) that feature attention can alter feature space to optimize the separation between relevant and irrelevant feature values (Zirnsack and Hamker, 2010). Of course, this observation needs to be validated by additional experiments explicitly addressing this possibility.
Finally, as predicted, the response in the subsequent N2 time range (230–320 ms) closely resembles the pattern seen in the first experiment (f). That is, the negativity decreases with increasing OD, in line with this phase reflecting discrimination matching. An rANOVA with the factor OD revealed that the amplitude variation in the N2 time range is significant (F(6,210) = 9.4, p < 0.0001). Furthermore, pairwise comparisons confirmed that the response to OD0° was significantly more negative than to OD45° (p < 0.05), to OD90° (p < 0.0001), and that the response to OD45° was more negative than OD90° (p < 0.005).
Source localization analysis
Figure 5a shows the distribution of source-density maxima of the OD0° − OD45° difference at 195 ms (left) and 255 ms (right) of the grand average across all subjects (n = 36). b shows the distribution of individual subjects' source-density maxima of the OD0° − OD45° difference in the N1 and N2 time range rendered onto a cortical surface segmentation of the MNI brain. As in experiment 1, source-density maxima arise in ventral lateral extrastriate cortex, with the first maximum in the N1 range being located more anteriorly than the maximum in the N2 time range. This difference in localization along the anteroposterior extension of the ventrolateral occipital–temporal cortex is also visible in b, in which the subjects' individual maxima in the N1 (red) and N2 (green) time range are plotted. Consistently, a one-way rANOVA comparing subjects' individual MNI coordinate measures in the N1 versus N2 time range along the x, y, and z directions revealed a significant effect along all axes (x, F(1,35) = 63.7, p < 0.0001; y, F(1,35) = 47.4, p < 0.0001; z, F(1,35) = 4.1, p < 0.05). Furthermore, a comparison of localization maxima of the OD0° − OD45° condition in the N1 time range with the maxima of the OD90° − OD45° condition in the N2 time range revealed significant differences along the x-axis (F(1,35) = 14.0, p < 0.001) and y-axis (F(1,35) = 15.6, p < 0.0005), indicating that the relative effect of discrimination matching of OD45° versus OD90° in the N2 time range does again arise from more posteromedial ventral extrastriate cortex than the effect of template matching in the N1 time range. No significant difference was observed along the z-axis.
Figure 5.

Source localization results of experiment 2. a, Source-density distributions estimated for the OD0° − OD45° difference of the grand-averaged electromagnetic field response at representative time points in the N1 (195 ms, left) and N2 (255 ms, right) time ranges rendered onto 3D surface segmentations of the MNI brain. The red and green dots index source-density maxima in the early and late time ranges, respectively. b shows respective source-density maxima in the N1 (red) and N2 (green) time ranges of each individual subject taking part in experiment 2. c, Source-density estimates of the grand-averaged OD90° − OD45° difference. d, Source-density maxima estimated from the OD90° − OD45° difference of each individual subject in the N2 time range (yellow).
In summary, the results of experiment 2 confirm our prediction that replacing the orthogonal with the 15° tilted orientation in the target description eliminates the enhanced negative modulation in the N1 time range seen in experiment 1 for OD90° probes, consistent with template matching being responsible for respective modulation to arise. Moreover, the source localization results of experiment 2 replicate the topographical dissociation of source-density maxima seen in experiment 1, in which template matching corresponded with more anterolateral sources, whereas discrimination matching was associated with more posteroventral sources in ventrolateral extrastriate cortex.
Experiment 3
In the previous experiments, the ERP response in the N2 time range was characterized by a systematic decrease of the negativity with decreasing probe-to-target similarity. The implicit assumption was that the size of the negativity reflects the degree of processing bias for the orientation of the probe entailed by the discrimination of the target (discrimination matching). Although this interpretation is straightforward in the context of the present experiments, an alternative possibility needs to be addressed. During visual search, it has been shown that focusing attention onto the target elicits a component called N2pc: a negative-going modulation in the N2 time range measurable over the posterior scalp contralateral to the target (Luck and Hillyard, 1994). The N2pc is an index of attentional focusing onto the target (Woodman and Luck, 1999), but it is also known to reflect the attenuation of interference from distractors (Luck et al., 1997; Hopf et al., 2002; Hickey et al., 2009; Boehler et al., 2011b). Because the N2pc amplitude becomes larger with increasing feature overlap between target and distractor, it is possible that, in the present experiments, increasing the similarity between target and probe may have invoked an N2pc-like distractor inhibition process based on increased interference. In other words, the variation seen in the N2 time range may represent an N2pc response becoming larger the more the probe matches the target because more attenuation of the probe is needed to eliminate distraction.
In experiment 3, we explored whether the effects driving the N2 modulation in the above experiments reflect enhanced or attenuated processing with a post-probe stimulation protocol. To this end, we used the general setup of experiment 1 but interrupted the presentation of the probe for 50 ms starting 150 ms after probe onset on half of the trials. Such a gap elicits a response on its own and can be analyzed as a function of probe-to-target similarity. To isolate the response to the gap proper (gap response), we subtracted the response to a probe without a gap (probe-only trials) from the response to the same probe followed by a gap (probe-gap trials). Given the usual delay of at least ∼80 ms for reaching extrastriate cortex [if we take the macaque as a reference (Schmolesky et al., 1998)], the gap response is expected to start entering into processing of the probe after ∼230 ms, that is, in the time range of the N2 response. Our reasoning was that, if the effect of discrimination matching in the N2 time range reflects distractor attenuation, the initial feedforward response elicited by the gap should be reduced with increasing similarity. Probe-to-target similarity was varied as in experiment 1, but we simplified the setup by retaining only three essential OD conditions (OD0°, OD45°, and OD90°) sufficient for characterizing the effect of template and discrimination matching.
Behavioral performance
Figure 2c shows mean RT and accuracy data for the three different OD conditions of probe-only (bright gray) and probe-gap trials (dark gray). As in experiment 1, on probe-only trials RTs were faster for the OD45° condition relative to the OD0° and OD90° conditions. However, for probe-gap trials, responses to the OD45° condition are slower than to the OD0° condition. The difference of RT patterns of probe-only versus probe-gap trials is confirmed by a two-way rANOVA with the factor OD (OD0°, OD45°, and OD90°) and gap presence (present and absent), which yielded a significant main effect of gap presence (F(1,17) = 5.8, p < 0.05), a significant gap presence × OD interaction (F(2,34) = 22.7, p < 0.001), but no main effect of OD. The results of pairwise comparisons between all conditions are summarized in the corresponding matrix chart. Performance accuracy was generally high as in experiment 1 but showed a decrement for OD90° in probe-only trials. A respective rANOVA yielded a significant main effect of OD (F(2,43) = 4.6, p < 0.05) but no effect of probe presence and no gap presence × OD interaction. To summarize, the presentation of a gap altered neither response accuracy nor the RT measures for the target-defining orientation values. The only change associated with presenting the gap was an RT increase of the OD45° condition. Notably, consistent with experiment 1, no-gap trials were associated with slower responses for the OD0° and OD90° conditions relative to the OD45° condition, with no difference between OD0° and OD90°—a pattern that parallels template matching, in that a task-relevant probe orientation entails a slowing of the responses, no matter whether that orientation is actually under discrimination in the focus of attention.
Electromagnetic recordings
Response to the feature probes.
Figure 6a summarizes the effects of probe similarity in the early N1 time range (for all probe types) and in the N2 time range (no-gap probes only; probe-gap trials were excluded from the analysis because they are contaminated by the gap response in this time range) at electrode site PO7. For the N1 time range (150–200 ms), the effect of template matching seen in experiment 1 is replicated. The negativity to both the OD0° and OD90° probes is clearly larger than to OD45°. This is confirmed by a significant rANOVA with the three-level factor OD (F(2,34) = 4.33, p < 0.05), as well as by subsequent pairwise comparisons, which yield significant differences when comparing OD0° versus OD45° (p = 0.042) and OD90° versus OD45° (p = 0.036). The difference between OD0° versus OD90° probes, however, is not significant (p = 0.3). In the N2 time range (220–320 ms), the effect of discrimination matching is also replicated (F(2,34) = 8.32, p < 0.005), with the negativity to OD90° being even smaller than to OD45° probes. Pairwise comparisons indicate that the response to OD0° probes is significantly more negative than to OD45° (p < 0.05) and to OD90° probes (p < 0.001). The small reduction for OD90° relative to OD45° probes is not significant (p = 0.18).
Figure 6.
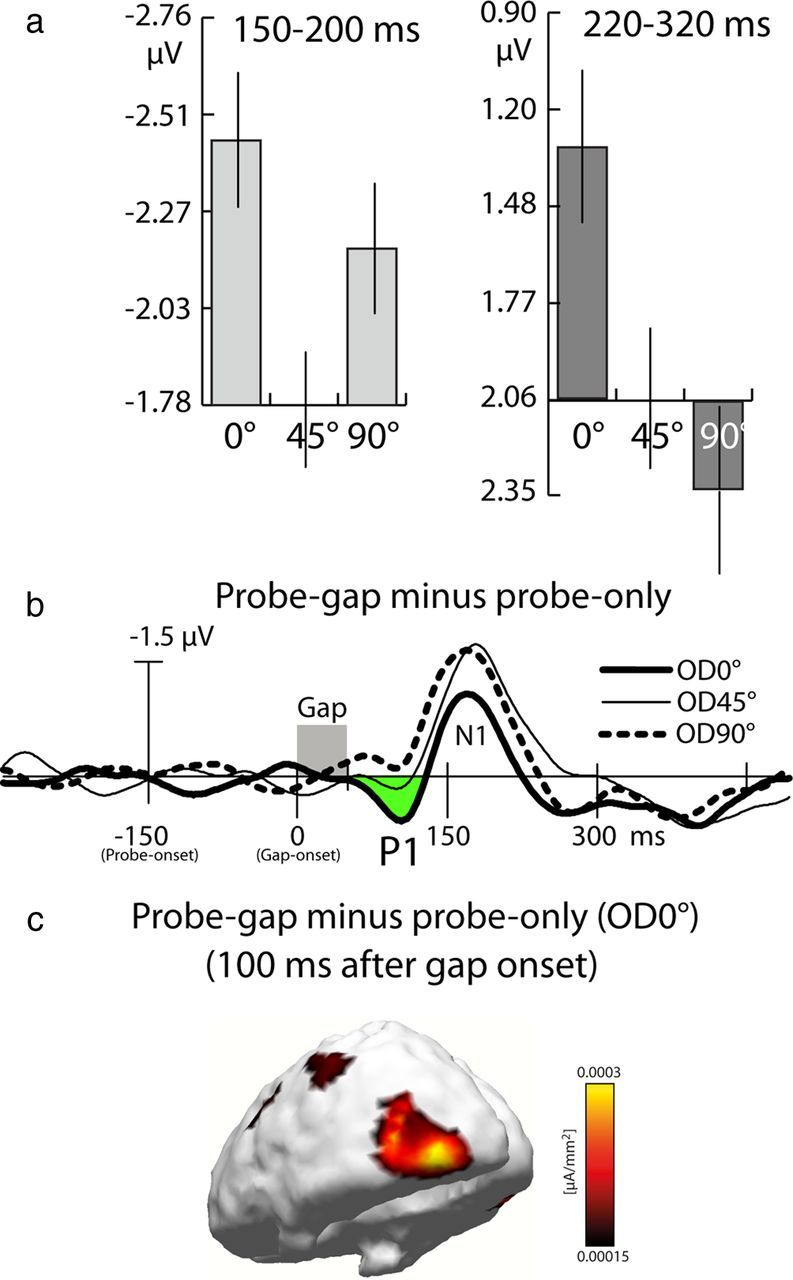
Results of experiment 3. a, Bar plots showing mean amplitude measures of the three OD conditions in the N1 (left) and N2 (right) time ranges at electrode site PO7 showing maximum variation. Data are referenced to the amplitude of the OD45° conditions. The vertical lines show the SEM. b, Difference waveforms (probe-gap − probe-only difference) recorded from P7 showing the gap-elicited response for the three OD conditions. The P1 enhancement of the OD0° condition is highlighted in green. Time point 0 ms refers to the onset of the gap 150 ms after probe onset. c, Distribution of current source-density estimates computed for the grand-averaged P1 effect (probe-gap − probe-only difference) of the OD0° condition 100 ms after gap onset.
Response to the gap.
Figure 6b shows the response to the gap (probe gap − probe-only difference waves recorded at P7) time locked to probe onset 150 ms before the gap of the three OD conditions. The first modulation of the gap response as a function of OD arises ∼80 ms after the gap onset (sliding-window rANOVA with three-level factor OD, p < 0.05). The modulation is driven by a positive enhancement of the P1 component after OD0° probes (green area under the curve), with a maximum ∼100 ms. c shows the current source underlying this P1 effect, which originates in left posterior ventrolateral occipital cortex, consistent with the VF of gap presentation. In contrast, no such P1 enhancement is seen for the OD45° and OD90° conditions. Hence, the initial response to the gap is enhanced when the orientation of the probe matches the target, indicating that the probe-related N2 enhancement in experiments 1 and 2 indeed reflects enhanced rather than attenuated processing attributable to probe-to-target similarity. It should be noted that, in a later time range, the N1 elicited by the gap is reduced after OD0° probes—an amplitude effect seemingly consistent with response attenuation. However, this amplitude reduction may be a consequence of a sustained positivity starting with the P1 enhancement. In fact, such sustained positive enhancement has been documented under related experimental conditions (Zhang and Luck, 2009). Despite the nature of the gap-related response in the N1 time range, it is important to see that what is relevant and informative with respect to assessing the state of cortical responsiveness after the probe (in the N2 time range after probe onset) is the initial modulation of the gap-elicited forward response as indexed by the P1.
Discussion
The reported observations add to a growing number of studies showing with different methodologies that attention to features operates in a spatially global manner (Maunsell and Treue, 2006). In the present experiments, the global nature of this selection was indexed by negative amplitude enhancements of the occipital N1 and N2 components over the hemisphere contralateral to the VF of probe presentation, with underlying source activity being consistently localized in left ventrolateral extrastriate cortex. More importantly, the present experiments clearly extend previous studies into global FBA by addressing an important yet open issue: does global biasing arise because features at unattended locations match task-relevant descriptions held in memory (template matching) or because they match features currently under discrimination in the focus of attention (discrimination matching)? Our results indicate that both types of matching occur, with template matching arising between 150 and 200 ms (N1 time range) after stimulus onset and ∼80 ms before discrimination matching between ∼230 and 320 ms (N2 time range). Further emphasizing a functional dissociation, both operations were found to arise from separate regions of the ventrolateral extrastriate visual cortex.
The fact that global FBA (at the neural population level) is characterized by a sequence of different selection processes represents an important and novel observation, which adds general support to the view that attention involves multiple operations that unfold over time (Luck, 1995; Kastner and Pinsk, 2004; Hopf et al., 2005; Roelfsema et al., 2007). Moreover, the specific temporal order of selection operations progressing from higher-tier (anatomically “late”) to lower-tier (anatomically “early”) areas fits with theories proposing that explicit visual perception proceeds in a recurrent top-down manner (Di Lollo et al., 2000; Lamme and Roelfsema, 2000; Bullier, 2001; Deco and Zihl, 2001; Spratling and Johnson, 2004; Compte and Wang, 2006; Tsotsos, 2011). A key common feature of those theories is that abstract categorical selection in higher-level visual cortex appears before selection based on more detailed input representations in lower-level visual areas (reverse hierarchy model; Hochstein and Ahissar, 2002). Our source localization results provide particular support for this notion. Given that, in humans, the hierarchical level of representation in ventral extrastriate visual cortex increases toward more anterior and lateral regions (Sereno et al., 1995; Grill-Spector and Malach, 2004; Orban et al., 2004), the spatiotemporal distribution of current sources progressing from more anterior/lateral to more posterior/medial is compatible with global FBA operating in a “reversed direction” from abstract-to-detailed selection through the visual hierarchy. This observation complements analogous findings in spatial selection (Martínez et al., 1999; Olson et al., 2001; Noesselt et al., 2002; Hopf et al., 2006; Boehler et al., 2009; Buffalo et al., 2010) and during face recognition (Sugase et al., 1999). Note, however, that the relative time course of processes underlying global feature selection may not be fixed and depend on the state of attentional focusing in a flexible way. For example, probing global feature selection after feature attention is already deployed turns out to modulate the P1 component—an early-latency ERP modulation indexing feature selection already during the feedforward sweep of processing (see experiment 3; Zhang and Luck, 2009).
The fact that, in the present experiments, the feature bias reflecting categorical selection/template matching arises before the feature bias underlying discrimination matching lines up with a number of reports showing that stimulus identification based on categorical discrimination is faster than identification requiring more thorough stimulus discrimination. For example, neural correlates of high-level object identification in natural scenes have been shown to arise very rapidly, ∼150 ms after scene onset (Thorpe et al., 1996; Fabre-Thorpe et al., 2001; VanRullen and Thorpe, 2001; Rousselet et al., 2002; Fize et al., 2005). Importantly, the rapidity of selection was attributed to the possibility to select “disjunctive sets of unbound features of a target category” (Evans and Treisman, 2005). That is, rapid selection as early as 150 ms after stimulus onset comes at the cost of feature selection remaining spatially unbound. Template matching as indexed by the N1 enhancement between 150 and 200 ms fits this property.
Regarding polarity, topography, and time course, the negative enhancement indexing global FBA in the N1 and N2 time range is similar to modulations seen in previous experiments investigating feature selection in visual search (Hopf et al., 2004). In these experiments, the selection of the search target was associated with a negative-polarity modulation contralateral to distractor items carrying a target-defining orientation feature. This modulation started ∼140 ms after search frame onset, which is comparable with the onset latency of the initial FBA effect in the present experiments. In the study by Hopf et al. (2004), feature selection started ∼40 ms before spatial focusing onto the target, leading to the hypothesis that neural processing underlying this initial negative modulation may be suited to provide a spatial map of target-defining features for guiding spatial focusing onto the target. The present observations qualify this interpretation. The location of the target is known and continuously attended, which preempts feature-guided target localization. Nonetheless, effects of global FBA arise with a similar latency in the N1 time range, suggesting that they reflect a more direct correlate of target selection in the focus of attention driven by a categorical match with task-relevant item descriptions. Consistent with this timing, single-unit recordings in the macaque revealed that the onset of firing enhancements to the presentation of target features in cells with RF outside the focus of attention appeared ∼150–200 ms after stimulus onset (Motter, 1994).
After template matching in the N1 time range, the modulation in the subsequent N2 time range is found to reflect the match between features presented inside and outside the focus of attention (discrimination matching). Indeed, although the set of target-defining orientation values changed between experiments 1 and 2, the same gradual reduction of the negativity with increasing orientation difference is observed in the N2 time range. That is, the negative response enhancement in this time range indexes a selection bias for orientation as a direct function of the similarity between the orientation of the probe and the target, independent of whether the orientation of the probe matches task-relevant orientation values. Hence, the effect of global feature selection in this time range relates to the discrimination of the actual orientation of the target, presumably driven by a selective bias of the gain of cells coding the orientation under discrimination.
A potential issue with this interpretation relates to reports that negative-polarity modulations in the N2 time range reflect the operation of distractor suppression. Specifically, in visual search tasks, it has been shown that a modulation, typically referred to as N2pc, reflects the attenuation of interference from distractors that share target features (Luck et al., 1997; Hopf et al., 2002; Hickey et al., 2009; Boehler et al., 2011b; Hilimire et al., 2012). It is possible that increasing the orientation similarity between target and probe rendered the latter more effective in attracting spatial attention away from the target. As a consequence, stronger attenuation of the probe associated with a bigger N2pc may account for the negative enhancement in the N2 time range seen in experiments 1 and 2. The results of experiment 3 speak against this possibility. In experiment 3, we analyzed the response to a short disruption of the probe between 150 and 200 ms after probe onset (gap response) as a function of probe-to-target similarity. If the neural operation giving rise to the N2 enhancement reflects the attenuation of the distracting probe, the sensory response to the gap should be reduced for probes matching target orientation relative to probes not matching. This is not what we observed. The response to matching probes in the P1 time range is significantly enhanced, indicating that sensory processing of the probe is actually amplified (Hillyard et al., 1998). In fact, such P1 enhancement has been shown recently to reflect the immediate bias of selecting an attended feature (color) during the feedforward sweep of processing in visual cortex (Zhang and Luck, 2009). Hence, the negative enhancement in the N2 time range is unlikely to represent distractor attenuation. Moreover, there is evidence that the subcomponent of the N2pc reflecting distractor attenuation is a relative positivity [distractor positivity (Pd)] contralateral to the distractor receiving suppression (Hickey et al., 2009; Hilimire et al., 2012). Accordingly, more attenuation of the probe would be associated with an increased contralateral positivity, contrary to what we observed here.
Finally, not all ERP studies into feature attention (color, motion direction) were able to document spatially global selection effects (Hillyard and Münte, 1984; Anllo-Vento and Hillyard, 1996). For example, Hillyard and Münte (1984) reported effects of feature selection inside the focus of attention but no such effects outside, which is in clear contrast to the present observations. However, there are differences in experimental design that may explain the absence of such effects in these previous studies. (1) Stimulus duration was very short (32 ms) compared with present experiments (700 ms). It is possible that effects of global feature selection require the feature to be present for a longer time to develop. (2) The previous studies used single-item presentation, which emphasized the attentional capture by the stimuli in the unattended VF. The presentation of irrelevant singletons at unattended locations was shown recently to elicit a Pd component in the time range of the typical selection negativities (Sawaki and Luck, 2010), and the Pd is believed to index the suppression of input from distractor locations (Hickey et al., 2009; Hilimire et al., 2012). Because subjects in the study by Hillyard and Münte (1984) were to withhold the response to distractors in the unattended VF, capture may have been stronger and the associated Pd larger for distractors drawn in the target color. This may have cancelled the negative amplitude modulations indexing global feature selection. Of course, more experimental work is required to clarify the discrepancy.
Conclusions
The three reported experiments suggest that global feature-based selection of orientation involves a sequence with at least two functionally distinct components. An initial component (∼150–200 ms) reflecting the match between the orientation of the probe and task-relevant response alternatives (independent of whether the target and probe actually matched in orientation) is followed by a second phase (∼230–330 ms) reflecting the similarity of the orientation of the probe with the actual orientation of the target presented on a given trial. Experiment 3 rules out the possibility that the second component merely reflects an effect of distractor attenuation (N2pc-like response) as a function of feature similarity. Together, the present observations suggest that global feature-based selection (as assessed at the neural population level) may not represent a single operation but a sequence in which the selection based on task relevance has temporal and hierarchical priority over the selection based on the sensory similarity of the input.
Footnotes
This research was made possible by Grant SFB779/TPA1.
References
- Anllo-Vento L, Hillyard SA. Selective attention to the color and direction of moving stimuli: electrophysiological correlates of hierarchical feature selection. Percept Psychophys. 1996;58:191–206. doi: 10.3758/bf03211875. [DOI] [PubMed] [Google Scholar]
- Bichot NP, Rossi AF, Desimone R. Parallel and serial neural mechanisms for visual search in macaque area V4. Science. 2005;308:529–534. doi: 10.1126/science.1109676. [DOI] [PubMed] [Google Scholar]
- Boehler CN, Tsotsos JK, Schoenfeld MA, Heinze HJ, Hopf JM. The center-surround profile of the focus of attention arises from recurrent processing in visual cortex. Cereb Cortex. 2009;19:982–991. doi: 10.1093/cercor/bhn139. [DOI] [PubMed] [Google Scholar]
- Boehler CN, Schoenfeld MA, Heinze HJ, Hopf JM. Object-based selection of irrelevant features is not confined to the attended object. J Cogn Neurosci. 2011a;23:2231–2239. doi: 10.1162/jocn.2010.21558. [DOI] [PubMed] [Google Scholar]
- Boehler CN, Tsotsos JK, Schoenfeld MA, Heinze HJ, Hopf JM. Neural mechanisms of surround attenuation and distractor competition in visual search. J Neurosci. 2011b;31:5213–5224. doi: 10.1523/JNEUROSCI.6406-10.2011. [DOI] [PMC free article] [PubMed] [Google Scholar]
- Buffalo EA, Fries P, Landman R, Liang H, Desimone R. A backward progression of attentional effects in the ventral stream. Proc Natl Acad Sci U S A. 2010;107:361–365. doi: 10.1073/pnas.0907658106. [DOI] [PMC free article] [PubMed] [Google Scholar]
- Bullier J. Feedback connections and conscious vision. Trends Cogn Sci. 2001;5:369–370. doi: 10.1016/s1364-6613(00)01730-7. [DOI] [PubMed] [Google Scholar]
- Cohen MR, Maunsell JH. Using neuronal populations to study the mechanisms underlying spatial and feature attention. Neuron. 2011;70:1192–1204. doi: 10.1016/j.neuron.2011.04.029. [DOI] [PMC free article] [PubMed] [Google Scholar]
- Compte A, Wang XJ. Tuning curve shift by attention modulation in cortical neurons: a computational study of its mechanisms. Cereb Cortex. 2006;16:761–778. doi: 10.1093/cercor/bhj021. [DOI] [PubMed] [Google Scholar]
- Deco G, Zihl J. A neurodynamical model of visual attention: feedback enhancement of spatial resolution in a hierarchical system. J Comput Neurosci. 2001;10:231–253. doi: 10.1023/a:1011233530729. [DOI] [PubMed] [Google Scholar]
- Di Lollo V, Enns JT, Rensink RA. Competition for consciousness among visual events: the psychophysics of reentrant visual processes. J Exp Psychol Gen. 2000;129:481–507. doi: 10.1037//0096-3445.129.4.481. [DOI] [PubMed] [Google Scholar]
- Evans KK, Treisman A. Perception of objects in natural scenes: is it really attention free? J Exp Psychol Hum Percept Perform. 2005;31:1476–1492. doi: 10.1037/0096-1523.31.6.1476. [DOI] [PubMed] [Google Scholar]
- Fabre-Thorpe M, Delorme A, Marlot C, Thorpe S. A limit to the speed of processing in ultra-rapid visual categorization of novel natural scenes. J Cogn Neurosci. 2001;13:171–180. doi: 10.1162/089892901564234. [DOI] [PubMed] [Google Scholar]
- Fize D, Fabre-Thorpe M, Richard G, Doyon B, Thorpe SJ. Rapid categorization of foveal and extrafoveal natural images: associated ERPs and effects of lateralization. Brain Cognition. 2005;59:145–158. doi: 10.1016/j.bandc.2005.06.002. [DOI] [PubMed] [Google Scholar]
- Fuchs M, Drenckhahn R, Wischmann HA, Wagner M. An improved boundary element method for realistic volume-conductor modeling. IEEE Trans Biomed Eng. 1998;45:980–997. doi: 10.1109/10.704867. [DOI] [PubMed] [Google Scholar]
- Fuchs M, Wagner M, Köhler T, Wischmann HA. Linear and nonlinear current density reconstructions. J Clin Neurophysiol. 1999;16:267–295. doi: 10.1097/00004691-199905000-00006. [DOI] [PubMed] [Google Scholar]
- Grill-Spector K, Malach R. The human visual cortex. Annu Rev Neurosci. 2004;27:649–677. doi: 10.1146/annurev.neuro.27.070203.144220. [DOI] [PubMed] [Google Scholar]
- Guthrie D, Buchwald JS. Significance testing of difference potentials. Psychophysiology. 1991;28:240–244. doi: 10.1111/j.1469-8986.1991.tb00417.x. [DOI] [PubMed] [Google Scholar]
- Hämäläinen M, Ilmoniemi RJ. Interpreting measured magnetic fields of the brain: estimates of current distributions. Helsinki: Helsinki University of Technology; 1984. Technical Report TKK-F-A559. [Google Scholar]
- Hämäläinen M, Hari R, Ilmoniemi RJ, Knuutila J, Lounasmaa OV. Magnetoencephalography—theory, instrumentation, and applications to noninvasive studies of the working human brain. Rev Mod Phys. 1993;65:413–497. [Google Scholar]
- Hickey C, Di Lollo V, McDonald JJ. Electrophysiological indices of target and distractor processing in visual search. J Cogn Neurosci. 2009;21:760–775. doi: 10.1162/jocn.2009.21039. [DOI] [PubMed] [Google Scholar]
- Hilimire MR, Hickey C, Corballis PM. Target resolution in visual search involves the direct suppression of distractors: evidence from electrophysiology. Psychophysiology. 2012;49:504–509. doi: 10.1111/j.1469-8986.2011.01326.x. [DOI] [PubMed] [Google Scholar]
- Hillyard SA, Münte TF. Selective attention to color and location: an analysis with event-related brain potentials. Percept Psychophys. 1984;36:185–198. doi: 10.3758/bf03202679. [DOI] [PubMed] [Google Scholar]
- Hillyard SA, Vogel EK, Luck SJ. Sensory gain control (amplification) as a mechanism of selective attention: electrophysiological and neuroimaging evidence. Phil Trans R Soc Lond B Biol Sci. 1998;353:1257–1270. doi: 10.1098/rstb.1998.0281. [DOI] [PMC free article] [PubMed] [Google Scholar]
- Hochstein S, Ahissar M. View from the top: hierarchies and reverse hierarchies in the visual system. Neuron. 2002;36:791–804. doi: 10.1016/s0896-6273(02)01091-7. [DOI] [PubMed] [Google Scholar]
- Hopf JM, Boelmans K, Schoenfeld AM, Heinze HJ, Luck SJ. How does attention attenuate target-distractor interference in vision? Evidence from magnetoencephalographic recordings. Brain Res Cogn Brain Res. 2002;15:17–29. doi: 10.1016/s0926-6410(02)00213-6. [DOI] [PubMed] [Google Scholar]
- Hopf JM, Boelmans K, Schoenfeld MA, Luck SJ, Heinze HJ. Attention to features precedes attention to locations in visual search: evidence from electromagnetic brain responses in humans. J Neurosci. 2004;24:1822–1832. doi: 10.1523/JNEUROSCI.3564-03.2004. [DOI] [PMC free article] [PubMed] [Google Scholar]
- Hopf JM, Schoenfeld MA, Heinze HJ. The temporal flexibility of attentional selection in the visual cortex. Curr Opin Neurobiol. 2005;15:183–187. doi: 10.1016/j.conb.2005.03.008. [DOI] [PubMed] [Google Scholar]
- Hopf JM, Luck SJ, Boelmans K, Schoenfeld MA, Boehler CN, Rieger J, Heinze HJ. The neural site of attention matches the spatial scale of perception. J Neurosci. 2006;26:3532–3540. doi: 10.1523/JNEUROSCI.4510-05.2006. [DOI] [PMC free article] [PubMed] [Google Scholar]
- Jehee JF, Brady DK, Tong F. Attention improves encoding of task-relevant features in the human visual cortex. J Neurosci. 2011;31:8210–8219. doi: 10.1523/JNEUROSCI.6153-09.2011. [DOI] [PMC free article] [PubMed] [Google Scholar]
- Kastner S, Pinsk MA. Visual attention as a multilevel selection process. Cogn Affect Behav Neurosci. 2004;4:483–500. doi: 10.3758/cabn.4.4.483. [DOI] [PubMed] [Google Scholar]
- Lamme VA, Roelfsema PR. The distinct modes of vision offered by feedforward and recurrent processing. Trends Neurosci. 2000;23:571–579. doi: 10.1016/s0166-2236(00)01657-x. [DOI] [PubMed] [Google Scholar]
- Luck SJ. Multiple mechanisms of visual-spatial attention: recent evidence from human electrophysiology. Behav Brain Res. 1995;71:113–123. doi: 10.1016/0166-4328(95)00041-0. [DOI] [PubMed] [Google Scholar]
- Luck SJ, Hillyard SA. Electrophysiological correlates of feature analysis during visual search. Psychophysiology. 1994;31:291–308. doi: 10.1111/j.1469-8986.1994.tb02218.x. [DOI] [PubMed] [Google Scholar]
- Luck SJ, Girelli M, McDermott MT, Ford MA. Bridging the gap between monkey neurophysiology and human perception: an ambiguity resolution theory of visual selective attention. Cogn Psychol. 1997;33:64–87. doi: 10.1006/cogp.1997.0660. [DOI] [PubMed] [Google Scholar]
- Martínez A, Anllo-Vento L, Sereno MI, Frank LR, Buxton RB, Dubowitz DJ, Wong EC, Hinrichs H, Heinze HJ, Hillyard SA. Involvement of striate and extrastriate visual cortical areas in spatial attention. Nat Neurosci. 1999;2:364–369. doi: 10.1038/7274. [DOI] [PubMed] [Google Scholar]
- Martinez-Trujillo JC, Treue S. Feature-based attention increases the selectivity of population responses in primate visual cortex. Curr Biol. 2004;14:744–751. doi: 10.1016/j.cub.2004.04.028. [DOI] [PubMed] [Google Scholar]
- Maunsell JH, Treue S. Feature-based attention in visual cortex. Trends Neurosci. 2006;29:317–322. doi: 10.1016/j.tins.2006.04.001. [DOI] [PubMed] [Google Scholar]
- McAdams CJ, Maunsell JH. Attention to both space and feature modulates neuronal responses in macaque area V4. J Neurophysiol. 2000;83:1751–1755. doi: 10.1152/jn.2000.83.3.1751. [DOI] [PubMed] [Google Scholar]
- McAdams CJ, Maunsell JH. Effects of attention on orientation-tuning functions of single neurons in macaque cortical area V4. J Neurosci. 1999;19:431–441. doi: 10.1523/JNEUROSCI.19-01-00431.1999. [DOI] [PMC free article] [PubMed] [Google Scholar]
- Motter BC. Neural correlates of attentive selection for color or luminance in extrastriate area V4. J Neurosci. 1994;14:2178–2189. doi: 10.1523/JNEUROSCI.14-04-02178.1994. [DOI] [PMC free article] [PubMed] [Google Scholar]
- Noesselt T, Hillyard SA, Woldorff MG, Schoenfeld A, Hagner T, Jäncke L, Tempelmann C, Hinrichs H, Heinze HJ. Delayed striate cortical activation during spatial attention. Neuron. 2002;35:575–587. doi: 10.1016/s0896-6273(02)00781-x. [DOI] [PubMed] [Google Scholar]
- Olson IR, Chun MM, Allison T. Contextual guidance of attention: human intracranial event-related potential evidence for feedback modulation in anatomically early temporally late stages of visual processing. Brain. 2001;124:1417–1425. doi: 10.1093/brain/124.7.1417. [DOI] [PubMed] [Google Scholar]
- Orban GA, Van Essen D, Vanduffel W. Comparative mapping of higher visual areas in monkeys and humans. Trends Cogn Sci. 2004;8:315–324. doi: 10.1016/j.tics.2004.05.009. [DOI] [PubMed] [Google Scholar]
- Robinson SE. Environmental noise cancellation for biomagnetic measurements. In: Williamson SJ, Hoke M, Stroink G, Kotani M, editors. Advances in biomagnetism. New York: Plenum; 1989. pp. 721–724. [Google Scholar]
- Roelfsema PR, Tolboom M, Khayat PS. Different processing phases for features, figures, and selective attention in the primary visual cortex. Neuron. 2007;56:785–792. doi: 10.1016/j.neuron.2007.10.006. [DOI] [PubMed] [Google Scholar]
- Rousselet GA, Fabre-Thorpe M, Thorpe SJ. Parallel processing in high-level categorization of natural images. Nat Neurosci. 2002;5:629–630. doi: 10.1038/nn866. [DOI] [PubMed] [Google Scholar]
- Saenz M, Buracas GT, Boynton GM. Global effects of feature-based attention in human visual cortex. Nat Neurosci. 2002;5:631–632. doi: 10.1038/nn876. [DOI] [PubMed] [Google Scholar]
- Sawaki R, Luck SJ. Capture versus suppression of attention by salient singletons: electrophysiological evidence for an automatic attend-to-me signal. Atten Percept Psychophys. 2010;72:1455–1470. doi: 10.3758/APP.72.6.1455. [DOI] [PMC free article] [PubMed] [Google Scholar]
- Schmolesky MT, Wang Y, Hanes DP, Thompson KG, Leutgeb S, Schall JD, Leventhal AG. Signal timing across the macaque visual system. J Neurophysiol. 1998;79:3272–3278. doi: 10.1152/jn.1998.79.6.3272. [DOI] [PubMed] [Google Scholar]
- Sereno MI, Dale AM, Reppas JB, Kwong KK, Belliveau JW, Brady TJ, Rosen BR, Tootell RB. Borders of multiple visual areas in humans revealed by functional magnetic resonance imaging. Science. 1995;268:889–893. doi: 10.1126/science.7754376. [DOI] [PubMed] [Google Scholar]
- Spratling MW, Johnson MH. A feedback model of visual attention. J Cogn Neurosci. 2004;16:219–237. doi: 10.1162/089892904322984526. [DOI] [PubMed] [Google Scholar]
- Sugase Y, Yamane S, Ueno S, Kawano K. Global and fine information coded by single neurons in the temporal visual cortex. Nature. 1999;400:869–873. doi: 10.1038/23703. [DOI] [PubMed] [Google Scholar]
- Thorpe S, Fize D, Marlot C. Speed of processing in the human visual system. Nature. 1996;381:520–522. doi: 10.1038/381520a0. [DOI] [PubMed] [Google Scholar]
- Treue S, Martínez Trujillo JC. Feature-based attention influences motion processing gain in macaque visual cortex. Nature. 1999;399:575–579. doi: 10.1038/21176. [DOI] [PubMed] [Google Scholar]
- Tsotsos JK. A computational perspective on visual attention. Cambridge, MA: Massachusetts Institute of Technology; 2011. [Google Scholar]
- VanRullen R, Thorpe SJ. The time course of visual processing: from early perception to decision-making. J Cogn Neurosci. 2001;13:454–461. doi: 10.1162/08989290152001880. [DOI] [PubMed] [Google Scholar]
- Woodman GF, Luck SJ. Electrophysiological measurement of rapid shifts of attention during visual search. Nature. 1999;400:867–869. doi: 10.1038/23698. [DOI] [PubMed] [Google Scholar]
- Zhang W, Luck SJ. Feature-based attention modulates feedforward visual processing. Nat Neurosci. 2009;12:24–25. doi: 10.1038/nn.2223. [DOI] [PubMed] [Google Scholar]
- Zirnsak M, Hamker FH. Attention alters feature space in motion processing. J Neurosci. 2010;30:6882–6890. doi: 10.1523/JNEUROSCI.3543-09.2010. [DOI] [PMC free article] [PubMed] [Google Scholar]