

Abstract
High-γ amplitude (80–150 Hz) represents motor information, such as movement types, on the sensorimotor cortex. In several cortical areas, high-γ amplitudes are coupled with low-frequency phases, e.g., α and θ (phase–amplitude coupling, PAC). However, such coupling has not been studied in the sensorimotor cortex; thus, its potential functional role has yet to be explored. We investigated PAC of high-γ amplitude in the sensorimotor cortex during waiting for and the execution of movements using electrocorticographic (ECoG) recordings in humans. ECoG signals were recorded from the sensorimotor cortices of 4 epilepsy patients while they performed three different hand movements. A subset of electrodes showed high-γ activity selective to movement type around the timing of motor execution, while the same electrodes showed nonselective high-γ activity during the waiting period (>2 s before execution). Cross frequency coupling analysis revealed that the high-γ amplitude during waiting was strongly coupled with the α phase (10–14 Hz) at the electrodes with movement-selective high-γ amplitudes during execution. This coupling constituted the high-γ amplitude peaking around the trough of the α oscillation, and its strength and phase were not predictive of movement type. As the coupling attenuated toward the timing of motor execution, the high-γ amplitude appeared to be released from the α phase to build a motor representation with phase-independent activity. Our results suggest that PAC modulates motor representation in the sensorimotor cortex by holding and releasing high-γ activity in movement-selective cortical regions.
Introduction
Neuronal oscillations in the sensorimotor cortex are characteristically modulated according to motor functions (Crone et al., 1998a; Cheyne et al., 2008; Miller et al., 2010; Muthukumaraswamy, 2010). Notably, the amplitudes of the high-γ (80–150 Hz; Canolty et al., 2006) and low-frequency bands, such as α (8–13 Hz) and β (13–30 Hz), have been shown to be important for motor functions. The high-γ amplitude represents motor information such as the type of movement and onset timing (Crone et al., 1998b; Yanagisawa et al., 2011). The amplitudes of the low-frequency bands have been attributed to cortical excitability, disengagement of task-irrelevant cortical areas, and maintenance of the status quo (Neuper and Pfurtscheller, 2001; Tamura et al., 2005; Engel and Fries, 2010; Saleh et al., 2010; Haegens et al., 2011b). However, it is not understood how these oscillations relate to each other and how their relationship affects the encoding of motor information.
It has been demonstrated that high-γ amplitude is modulated by the phase of low-frequency oscillations, such as θ (Canolty et al., 2006; Sirota et al., 2008; He et al., 2010) and α (8–13 Hz; Osipova et al., 2008), across multiple cortical and subcortical sites (Pineda, 2005; Cohen et al., 2009; Axmacher et al., 2010; Canolty and Knight, 2010; Voytek et al., 2010). Moreover, such phase–amplitude coupling (PAC) has a variety of functional roles in cortical processing, such as working memory (Axmacher et al., 2010) and sensory processing (Luo and Poeppel, 2007; Lakatos et al., 2008; Saleh et al., 2010). However, the functional role of PAC in the sensorimotor cortex during the preparation and execution of movements remains unknown. The main issues to be uncovered are as follows: (1) does PAC exist in the sensorimotor cortex during movement tasks and (2) how does the coupling affect the motor information represented by the high-γ amplitude?
To address these questions, we recorded electrocorticographic (ECoG) signals in the sensorimotor cortices of epilepsy patients while they executed three types of simple hand movements. First, using multichannel decoding and univariate statistical analyses, we show that the high-γ amplitudes during motor execution encode the information of movement type in a subset of electrodes. Next, we performed PAC analysis using the synchronization index (SI; Cohen, 2008) and found that high-γ activity during the waiting period was strongly coupled with a particular phase of the α oscillation. On the basis of these analyses, we discovered a remarkable similarity between the spatial patterns of electrodes with movement selectivity at execution and those with strong PAC during waiting. We further examined the phase-conditioned high-γ amplitudes to characterize the dynamics of high-γ activity and the motor representation modulated by α oscillations.
Materials and Methods
Study subjects.
Four patients with subdural electrodes participated in this study (1 male and 3 females; Table 1). All participants and their guardians were informed of the purpose and possible consequences of this study, and written informed consent was obtained. The present study was approved by the Ethics Committee of Osaka University Hospital.
Table 1.
Clinical profiles
| Patient number | Age (years)/ sex | Diagnosis | Number of electrodes |
|---|---|---|---|
| 1 | 34/F | R epilepsy | 30 |
| 2 | 14/M | R epilepsy | 15 |
| 3 | 22/F | R epilepsy | 30 |
| 4 | 20/F | L epilepsy | 20 |
F, Female; M, male; R, right; L, left.
Tasks.
The experiments were performed at ∼1 week after electrode placement in an electromagnetically shielded room. After >30 s of resting, during which time the patients were asked to stay quiet without moving, the patients selected and performed one of three types of movement every 5.5 s (Fig. 1A). The three types of movement consisted of grasping, pinching, and opening the hand. In each trial, the patient selected one of the three types of movement voluntarily. The movements were performed by the hand contralateral to the implanted electrodes. Three beep sounds were presented at 1 s intervals, and the patient was instructed to perform the movement immediately after the presentation of the third sound. The patient returned his or her hand to a resting position immediately after the movement. In the resting period, the patient relaxed his or her hand with slightly flexed joints. The patient repeated the trials ∼120 times. Thus, each type of movement was performed ∼40 times. In the control experiment, patients 1 and 2 performed a language task. After >30 s of resting, the patient was asked to voluntarily select and pronounce one of five Japanese vowels at an arbitrary timing.
Figure 1.
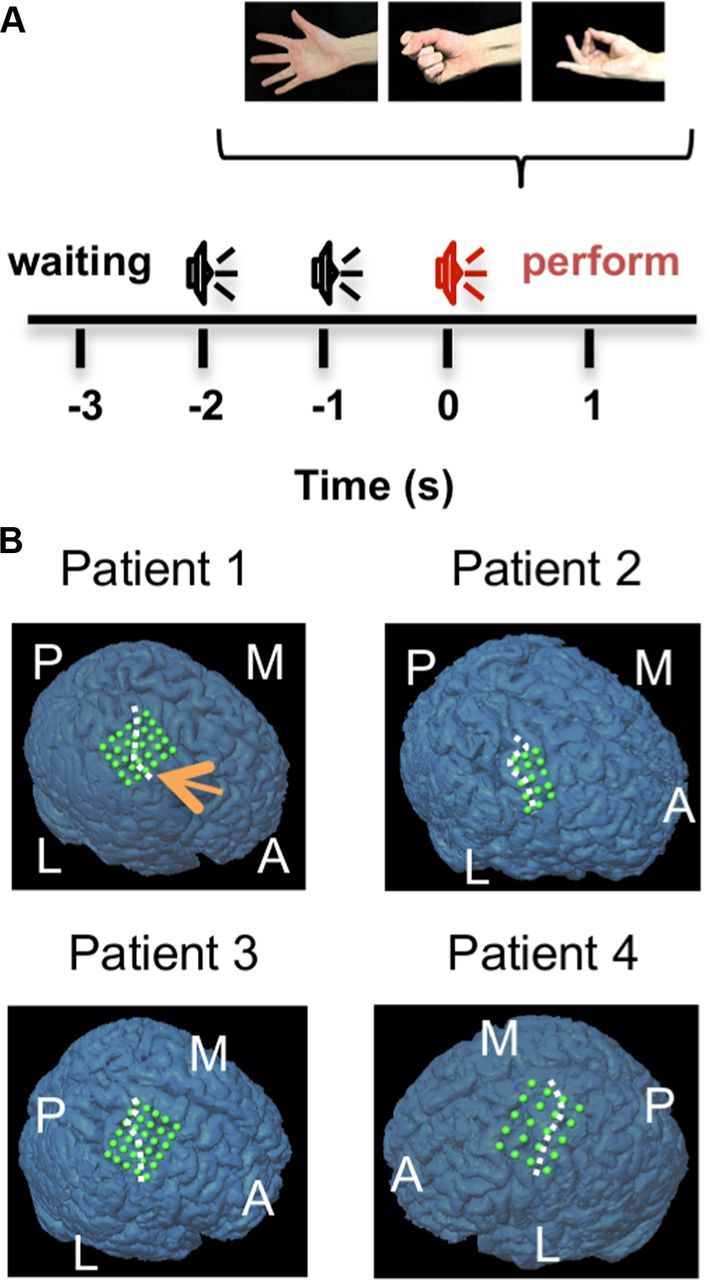
Task paradigm and location of the electrodes. A, The patients selected and executed one of three movements in accordance with three sound cues. B, The location of the implanted electrodes is indicated by the green circles on the 3-dimensional brain rendering of the MRI volume of each patient. The white dashed line indicates the location of the central sulcus. A, Anterior; L, lateral; M, medial; P, posterior.
ECoG recordings.
In each patient, 15–30 planar-surface platinum grid electrodes (3 × 5, 4 × 5, or 5 × 6 array; Unique Medical) were placed over the sensorimotor cortex (Fig. 1B). The electrodes covered the precentral gyrus and postcentral gyrus centering around the “hand knob” for all patients. Most of the electrodes were placed on the precentral gyrus. The electrodes had a diameter of 3 mm and an interelectrode distance of 7 or 10 mm center to center. The location of the implanted electrodes was identified by standard neurosurgical techniques both anatomically and electrophysiologically. Preoperative structural magnetic resonance imaging (MRI) was performed on all patients using a 1.5-T or 3.0-T MRI scanner. Computed tomography (CT) scans were acquired postoperatively with subdural electrodes in place, clearly showing the position of the electrodes with respect to skull geometry. For an estimation of the position of the implanted electrodes through the use of BrainLAB, coregistration between the postoperative CT and preoperative MRI scans was obtained to create 3-dimensional brain renderings of the MRI volume overlaid with the coregistered CT volume for an initial estimate of the position of the electrodes. As necessary, these coregistrations were manually corrected using the position of the electrodes from intraoperative photographs.
Data collection and preprocessing.
ECoG signals were measured using a 128-channel digital EEG system (EEG 2000; Nihon Koden Corporation) and digitized at a sampling rate of 1000 Hz. All subdural electrodes were referenced to a scalp electrode placed on the nasion. Before any further processing, channels with a low signal-to-noise ratio were identified and deleted. For the analysis, the ECoG signals were digitally re-referenced to a common average. The bandpass filter for the data analysis was set to 0.16–300 Hz. We analyzed ECoG signals time-locked to the third beep.
Extraction of amplitude and phase features.
The ECoG signals of each electrode were bandpass-filtered using a two-way least-squares finite impulse response filter (eegfilt.m from the EEGLAB toolbox). Then, the Hilbert transformation was performed on the filtered signals to obtain the complex-valued analytic signals of each frequency band, Xω[t]. Here, ω denotes the frequency band. The amplitude of each frequency band, Aω[t], was calculated from the absolute value of the complex-valued signals using Equation 1. Similarly, the phase of each frequency band, φω[t], was calculated from the analytic phase of the complex-valued signals. The phase time series, φω[t], assumes values within (0, 2π) radians with a cosine phase such that π radians correspond to the trough and 0 radians correspond to the peak
 |
The amplitudes of each frequency band during the movement task were z-normalized using the mean and SD of the amplitudes during the 30 s resting period before the movement task. For the main analysis, the normalized amplitudes were averaged over a 1 s time window, and the center of the window was shifted by 100 ms. For the phase-conditioned analysis, we divided the α phase into 6 intervals of 60° without overlaps: 0° ± 30°, 60° ± 30°, 120° ± 30°, 180° ± 30°, 240° ± 30°, and 300° ± 30°. In a 1 s time window, high-γ amplitudes were averaged within each phase interval.
PAC analysis.
The SI was used to measure the strength of PAC between the high-γ amplitude and the low-frequency phases (Cohen, 2008). The high-γ amplitude was bandpass filtered by the low-frequency band ω using the finite impulse response filter to obtain Aγω[t]. Then, the Hilbert transformation was applied to Aγω[t] to obtain the analytic phase φγω[t]. The synchronization index SIγω[t] was obtained by
 |
where N is the number of time points during each 1 s time window. To determine whether the SI values were statistically significant, we calculated SI values using phase-shuffled data, in which the time series of the low-frequency phase was shuffled by permuting randomly partitioned segments. SI values were regarded as statistically significant if they were higher than those calculated using randomized phases with p < 0.05 (Student's t test).
Evaluation of selectivity to movement type.
The motor information represented by the amplitudes of multiple electrodes was evaluated by decoding analysis using a linear support vector machine (Kamitani and Tong, 2005; Yanagisawa et al., 2009, 2011). Fivefold cross-validation was conducted in each patient to evaluate the generalization performance of the classifier (Breiman, 1996; Bengio and Grandvalet, 2004). For the decoding analysis using the PAC features, we used SI values and the phase differences between the α oscillation and the α component of the high-γ amplitude (φα[t] − φγα[t]) averaged over a 1 s time window. For the evaluation of motor information in each electrode, the F value (one-way ANOVA statistic) was used to quantify how much the amplitude varied among the movement types.
Results
High-γ amplitudes represent movement types around the timing of motor execution at movement-selective cortical areas
To visualize the frequency components of the ECoG signals in the sensorimotor cortex associated with the hand movements, we first averaged the normalized amplitudes of each frequency band and their timing across all electrodes and trials in four patients (Fig. 2A). The averaged amplitudes showed that during motor execution, the ECoG signals increased in the high-γ range (80–150 Hz) and decreased in the α and β (8–30 Hz) range (p < 0.01, ANOVA). To reveal at which frequency and timing the specific movement types were represented, we performed decoding analysis using the amplitude pattern of all electrodes at a particular frequency and timing to predict one among three movement types. Decoding performance was evaluated on a trial-by-trial basis using a cross-validation procedure. As shown in Figure 2B, high decoding accuracy was found in the high-γ range around the timing of motor execution (p < 0.01, ANOVA). These results confirm that the movement types are represented by high-γ amplitudes around the timing of motor execution (Yanagisawa et al., 2012).
Figure 2.

Motor representation by high-γ amplitude. A, The normalized amplitude of each frequency band of 4 Hz width, which ranged from 2 to 200 Hz, was averaged across all trials and electrodes in all patients. The mean normalized amplitude of 1 s intervals centered at every 100 ms was color-coded at each frequency band and time. Time 0 corresponds to the sound cue to start the movement. B, Movement classification was performed using the mean normalized amplitude of 1 s intervals at all electrodes for each frequency band, time, and patient (the number of input features for decoding was the number of electrodes of each patient). The percentage correct of the movement classification was averaged among the four patients and color-coded at each frequency and time. C, The F value (one-way ANOVA) for the high-γ amplitude (80–150 Hz) of each electrode at time 0.5 s (0–1 s) among the movement types was color-coded to the location of the electrode for each patient. D, The mean high-γ amplitude with a 95% confidence interval (95% CI) is shown for the three types of movement at a movement-selective electrode with a high F value of p < 0.01. The location of the electrode is indicated by the orange arrow in Figure 1B.
The movement selectivity of the high-γ amplitudes varied among the electrodes. Figure 2C shows F values (one-way ANOVA F statistic) that compute the variability of the high-γ amplitudes across movement types relative to the trial-by-trial variability within movement types at each electrode and patient, and thus quantify the selectivity to movement types. Only a subset of electrodes showed high F values (movement selectivity), and all patients showed different spatial patterns of F values across electrodes. In the following analyses, we focus, though not exclusively, on the electrodes with high movement selectivity with F values of p < 0.01 (one-way ANOVA) at 0.5 s. We call them “movement-selective electrodes” or “movement-selective cortical areas.”
Figure 2D shows an example of high-γ signals at a movement-selective electrode of patient 1. The high-γ signals increased or decreased around the timing of motor execution depending on the movement type, while the high-γ amplitude during the waiting period (>2 s before execution) was not selective to the movement type. It should be noted that the high-γ amplitudes were not zero even during the waiting period. This can also be seen in Figure 2A in which a substantial amount of high-γ activity was found during the waiting period, though not as pronounced as during the execution period. This led us to characterize high-γ activity during the waiting period.
High-γ amplitude during waiting is coupled with the α phase at movement-selective cortical areas
To characterize high-γ activity during waiting, we performed PAC analysis using the SI. At each movement-selective electrode, we calculated the SI value between the high-γ amplitude and the phase of the low-frequency bands (2-30 Hz, 4 Hz width). Figure 3A shows the SI values at each coupling frequency and timing averaged across the movement-selective electrodes of all subjects. High SI values were found at the α phase (10–14 Hz) during the waiting period (>2 s before execution), indicating that high-γ activity during waiting is strongly coupled with the α phase (p < 0.01, ANOVA).
Figure 3.
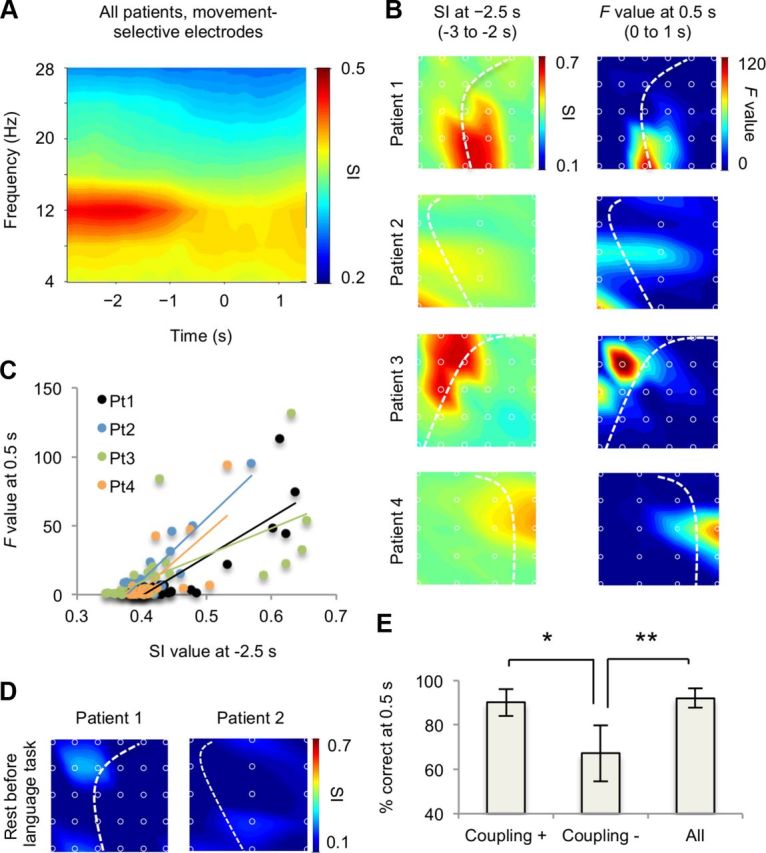
High-γ amplitude during the waiting period was coupled with the α phase at movement-selective cortical areas. A, Significant SI values between the high-γ amplitude and each low-frequency phase (2–30 Hz, 4 Hz width) of 1 s intervals centered at every 100 ms were averaged across the movement-selective electrodes of all patients. The mean SI value was color-coded at each time and low-frequency band. B, The mean SI value at −2.5 s (−3 to −2 s) (Left) and the F value at 0.5 s (Right) are color-coded to the location of the electrodes for each patient. C, The mean SI values at −2.5 s and the F values at 0.5 s for each electrode are shown for each patient. Each color corresponds to each patient. D, The mean SI values during the resting period of the language task are color-coded to the location of the electrodes for patients 1 and 2. E, The classification accuracy using the mean normalized high-γ amplitude of 1 s intervals centered at 0.5 s was compared among three groups of electrodes (*p < 0.05, **p < 0.01; error bar, 95% CI). Coupling (+): electrodes with significant SI values at −2.5 s, Coupling (−): electrodes without significant SI values at −2.5 s. All, All electrodes.
We next examined the distribution of the SI values between the high-γ amplitude and α phase (10–14 Hz) across electrodes during waiting. Interestingly, the spatial pattern of the SI values at −2.5 s (−3 to −2 s, waiting) in each patient (Fig. 3B, left) look similar to that of the F values at 0.5 s (0–1 s, execution; Fig. 3B, right), which indicate movement selectivity. Figure 3C shows the SI values at −2.5 s and F values at 0.5 s at each electrode and patient. The scatter plot reveals a high correlation between SI and F (correlation coefficients for patients 1-4, 0.85, 0.90, 0.63, and 0.73, respectively; p < 0.01 for all, corrected for multiple comparison). Notably, the distribution of the SI values was not the same in different tasks. For example, during the waiting period before the language task in which patients 1 and 2 were asked to voluntarily pronounce some Japanese vowels, the SI values were not correlated to the F values at 0.5 s for the movement tasks (correlation coefficients for patients 1 and 2, 0.07 and 0.09, respectively). These results suggest that the coupling of high-γ activity with the α phase during waiting for movement is restricted in the movement-selective area with movement-selective high-γ activity during execution.
The high correlation between the SI at waiting and F at execution allows us to select effective electrodes for multichannel decoding. We divided the electrodes into two groups: electrodes with significant SI values at −2.5 s (Coupling (+)) and others (Coupling (-)). The significance was defined by a t test comparing the mean SI values with an unshuffled and shuffled α phase (p < 0.05). Multichannel decoding analysis using high-γ amplitudes at 0.5 s revealed that the decoding accuracy of Coupling (+) was significantly higher than that of Coupling (-) (p < 0.05 corrected for multiple comparison, t test), and was comparable to the performance using all electrodes (Fig. 3D). This finding further confirms that PAC during waiting signals movement-selective cortical areas.
High-γ amplitude at movement-selective areas peaks around the trough of the α oscillation during waiting
To further characterize the coupling between the α phase and the high-γ amplitude, we plotted the time courses of SI and α amplitudes averaged across trials, movement-selective electrodes, and patients. The SI value was largest at −1.7 s and gradually decreased toward the timing of motor execution (p < 0.01, ANOVA; Fig. 4A). The α amplitude followed a similar time course (p < 0.01, ANOVA), suggesting that the coupling of the high-γ amplitude is modulated by the amplitude of the α oscillation. It should be noted that the SI is independent of the amplitude of the frequency component defining the phase (α in this case), although in noisy conditions, low signal amplitudes could lead to a poor phase estimation resulting in small SI values. Our simulation using synthetic α and high-γ oscillations with added noise confirmed that when the α amplitude was varied, the SI remained constant at all amplitudes except at extremely low amplitudes (data not shown). Therefore, the similarity of the time courses of the SI and α amplitude is unlikely to be an artifact arising from the definition of the SI and the signal-to-noise-ratio.
Figure 4.

High-γ amplitude during waiting peaked around the trough of the α oscillation. A, The mean SI value and the mean α amplitude of all trials were averaged among the movement-selective electrodes of four patients (error bar, 95% CI). The averaged SI value and the averaged α amplitude were significantly decreased during the execution of the movements (p < 0.01, one-way ANOVA). B, Top, The high-γ amplitudes were averaged over each of the 6 phase intervals of 10–14 Hz oscillations for 1 s intervals centered at −2.5 s or 0.5 s of all trials (α phase-conditioned high-γ amplitude). The α phase-conditioned high-γ amplitudes were averaged across the movement-selective electrodes of four patients at each time (error bar, 95% CI). The α phase-conditioned high-γ amplitudes varied significantly among the 6 phase intervals at −2.5 s (p = 0.019, one-way ANOVA), though not significant at 0.5 s (p = 0.998, one-way ANOVA). Bottom, The α oscillation, which was the ECoG signals bandpass filtered at 10–14 Hz, was averaged over each of the 6 phase intervals of 10–14 Hz oscillation for 1 s intervals centered at −2.5 s (left) or 0.5 s (right) of all trials. The α oscillations were averaged among the movement-selective electrodes of four patients at each time (error bar, 95% CI).
While the SI quantifies the “strength” of PAC, it does not indicate with which phase the amplitude is coupled. To reveal the α phase at which high-γ activity is enhanced, we calculated the high-γ amplitude and α phase at −2.5 s in each trial using the movement-selective electrodes, and averaged the high-γ amplitudes within each of the 6 bins of the α phase (60° width). We found that the α phase-conditioned high-γ amplitudes varied significantly among the phase bins (p = 0.019, one-way ANOVA), and that strong high-γ activity was observed at the trough of the α oscillation (180° ± 30°; Fig. 4B, left). When the same analysis was performed at 0.5 s, the α phase-conditioned high-γ amplitudes were not significantly different across the α phase bins (p = 0.998, ANOVA; Fig. 4B, right).
PAC does not represent movement type
We have seen that the high-γ amplitudes during waiting are not selective to, and not predictive of, movement type (Fig. 2), while the strength of PAC during waiting in each electrode is correlated with the movement-selectivity during execution. However, it is still possible that the ECoG features associated with PAC during waiting may be selective to or predictive of movement type. To test this, we examined the spatial patterns of (1) the SI values and (2) the phase differences between α and the α component of high-γ amplitude modulation (φα[t] − φγα[t]) for each movement type and performed multielectrode decoding using these as input features. Figure 5A illustrates an example of the SI values and phase differences of patient 1 at −2.5 s. The spatial distribution of the SI values and phase differences did not show a clear difference across the movement types. Decoding accuracy was close to the chance level during both the waiting and execution periods in all patients (Fig. 5B). It should be noted that our experimental design did not control the timing of when the patient decides to perform the movement type. Therefore, the failure to decode movement types early in the waiting period could simply be due to the fact that the decision was not made yet. These results suggest that PAC does not directly represent movement types while modulating high-γ amplitudes in movement-selective areas independently of movement type.
Figure 5.
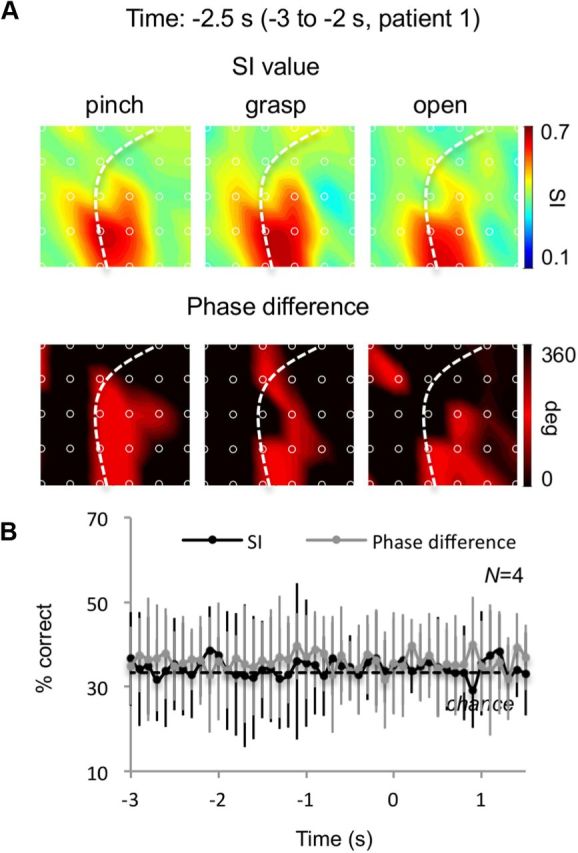
PAC did not represent movement type. A, The SI value and the phase difference of each electrode were averaged over a 1 s interval centered at −2.5 s for each of the three types of movement of patient 1. The mean SI value and the phase differences were color-coded to the location of the electrode. B, The percentage correct of the movement classifications using the spatial distribution of the mean SI value or the mean phase difference of 1 s intervals centered at every 100 ms was averaged among 4 patients (error bar, 95% CI). The dotted line shows the chance-level accuracy of 33.3%.
Hold-and-release regulation of the high-γ amplitude by PAC
Finally, we characterized the dynamics of high-γ activity throughout a movement trial using phase-conditioned plots. Figure 6A shows examples of the time courses of α phase-conditioned high-γ amplitudes (six phase bins) averaged within each movement type (for one electrode with the highest F value in each patient). During the waiting period, α phase-conditioned high-γ activity showed varying amplitudes across the phase bins with high amplitude in the 180° bin. However, toward the timing of motor execution, the high-γ activity of all phases converged on three different values depending on the movement type. This time course of high-γ activity is consistent with the results shown in Figure 4B. Figure 6B shows F (movement selectivity) and SI (strength of PAC) values averaged across the movement-selective electrodes of four patients. Movement selectivity (F) appeared to arise when PAC (SI) was attenuated for all phase bins. A negative correlation between the F and SI values was found in the data averaged across all subjects and movement-selective electrodes (correlation coefficients for all phase bins r < −0.7). Interestingly, while the spatial distributions (across electrodes) of the F values during execution and SI values during waiting were positively correlated (Fig. 3), the F and SI values were negatively correlated in the time domain. These results suggest that while PAC occurs during the waiting period only at movement-selective areas, it modulates high-γ activity to hold the amplitude at a fixed state during waiting, and then to release it to movement-specific states.
Figure 6.
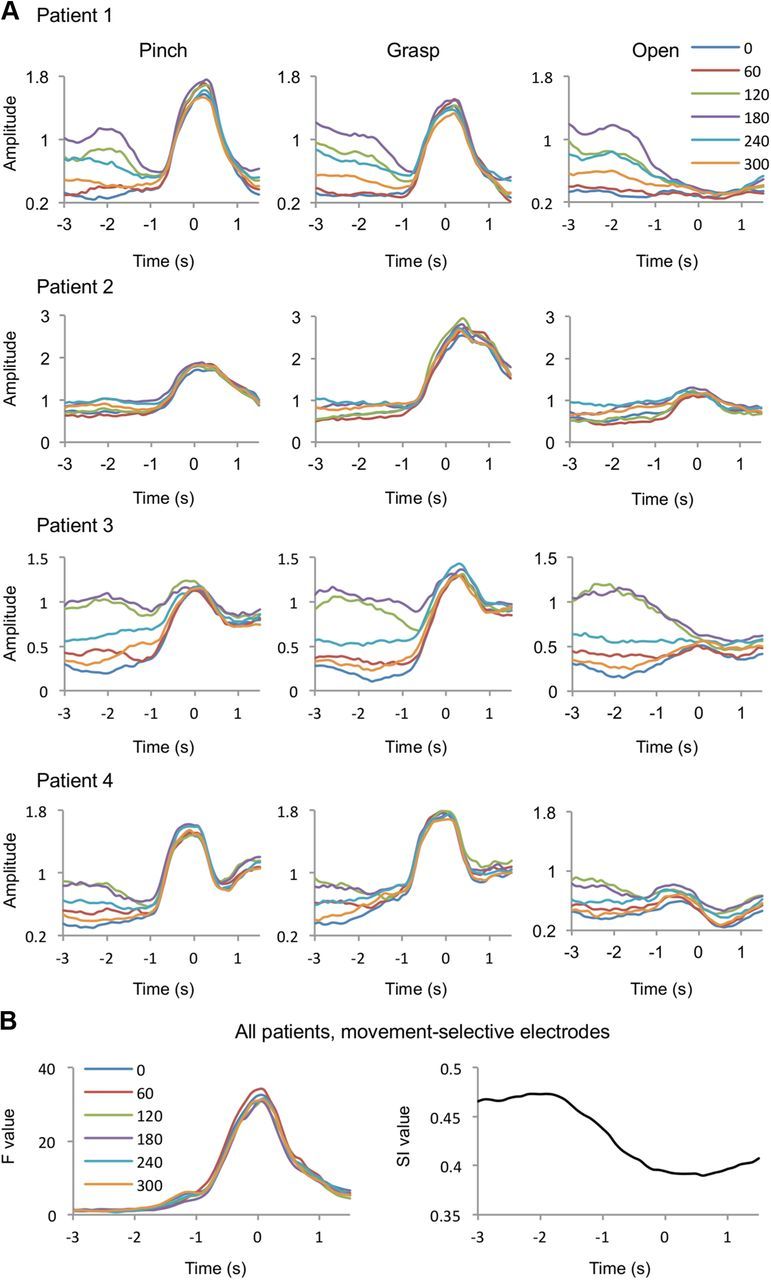
Hold-and-release regulation of the high-γ amplitude by PAC. A, The mean α phase-conditioned high-γ amplitudes of each phase bin are shown for each movement type at the electrode with the highest F value for each patient. Each color corresponds to each α phase bin. B, The mean F values (one-way ANOVA) for the α phase-conditioned high-γ amplitude among the movement types at the movement-selective electrodes of 4 patients are shown for each α phase bin (left). The time course of the mean SI value of the movement-selective electrodes of 4 patients is shown on the right.
Discussion
In the current study, we explored PAC on the sensorimotor cortex and its relation to the motor representation by the high-γ amplitude. The high-γ amplitudes in the movement-selective electrodes were shown to be strongly coupled with the α phase during the waiting period for the movement task. The coupling held the high-γ amplitude at the phase-dependent status in which the amplitude did not represent the movement type. While the coupling was attenuated toward the execution of the movements, the high-γ amplitude was released from the phase-dependent status to have some particular values depending on the movement type. The strength of the coupling was negatively correlated with the movement-selectivity of high-γ activity along the time course of the task. These results support the idea that PAC on the sensorimotor cortex critically affected the behavior of the high-γ amplitude to modulate the motor representation.
Hold-and-release model of high-γ amplitude
We found that the large high-γ amplitude was locked to the trough of the α oscillation (10–14 Hz) before hand movements. Recently, it was shown that neuronal spiking on the sensorimotor cortex was locked to the trough of the α oscillation (8–14 Hz) on the sensorimotor cortex during a vibrotactile discrimination task (Haegens et al., 2011b). Our finding is consistent with this observation because the high-γ amplitude has been shown to be correlated with the firing rate (Ray et al., 2008; Quian Quiroga and Panzeri, 2009). The PAC between the high-γ amplitude and the α phase might reflect a local mechanism in which neuronal firing is modulated by the ongoing α oscillation (Klimesch et al., 2007; Mathewson et al., 2011). Notably, previous studies on phase-amplitude coupling of α oscillation has mostly focused on the visual/sensory domain, while our study demonstrated that the coupling and related neuronal processing can be extended to the motor domain (Haegens et al., 2011b; Jensen et al., 2012).
Here, we provided an insight into how the motor representation by the high-γ amplitude was modulated by the α oscillation through PAC. It was demonstrated that PAC inhibited the motor representation by restricting the high-γ amplitude in the phase-dependent state. The coupling was strong at the movement-selective cortical areas and diminished with the attenuation of the α amplitude to hold-and-release the high-γ amplitude. Some previous studies have suggested that the attenuation of α oscillation facilitates processing in task-relevant cortical regions to improve task performance, whereas increased α oscillation suppresses distracting input in task-irrelevant regions (Palva and Palva, 2007; Mazaheri and Jensen, 2010; Gould et al., 2011; Haegens et al., 2011a,b). These findings are consistent with our results showing that the strong coupling with larger α oscillation suppresses cortical processing by restricting the high-γ amplitude and that the attenuation of the coupling with smaller α oscillation facilitates motor representation by releasing the high-γ amplitude. Since the coupling during the waiting period was limited to the electrodes showing high movement selectivity during motor execution, the α oscillation may selectively hold-and-release the high-γ amplitude at the movement-selective regions to modulate motor representation.
Functional roles of PAC during preparation
The functional roles of PAC have been a matter of speculation. In some previous studies, PAC has been shown to have a variety of functional roles in various cortical regions, such as working memory in the hippocampus (Axmacher et al., 2010) and sensory processing in the auditory cortex, primary visual cortex and primary motor cortex (Luo and Poeppel, 2007; Lakatos et al., 2008; Saleh et al., 2010). Although the functional role of the coupling in the sensorimotor cortex has not been elucidated, some previous studies have shown that low-frequency oscillations are related to the performance of movement tasks and maintenance of the status quo (Gilbertson et al., 2005; Engel and Fries, 2010; Haegens et al., 2011b). The coupling might contribute to these functions by modulating the high-γ amplitude.
Our results revealed that the high-γ amplitude was activated at the trough of the α oscillation even before the movements, although the mean high-γ amplitude was small. The high-γ amplitude on a particular α phase might contribute to control muscle contractions for the maintenance of the status quo. Furthermore, the coupling might be related to the preparation of movements without sufficient information of the actual movement type. Recently, it was shown that neural activity for the preparation of movements was not simply a subthreshold form of movement activity and provided the initial state of a dynamic system whose evolution produced movement activity (Churchland et al., 2010). The strong PAC might provide the initial state for the activation of the high-γ amplitude to represent the motor information.
In previous studies, the maintenance of the status quo has often been attributed to β rhythms (Engel and Fries, 2010). In additional analysis, we examined the functional similarity between the PAC and β activity by calculating the correlation coefficient between the spatial distributions of the β amplitudes (22–26 Hz) during the waiting period and the F values of high-γ amplitudes during execution (Fig. 3C; except that the SI values were replaced with β amplitudes, as). We did not find consistently high correlations between the β amplitudes and the F values across the patients (patients 1–4: 0.14, 0.63, −0.27, −0.06, respectively), in contrast to the consistently high correlations between the SI and F values (patients 1–4: 0.85, 0.90, 0.63, 0.73, respectively; Fig. 3C). Thus, the β amplitude was not selectively activated in the movement-selective cortical regions in most patients. These observations suggest that PAC serves more localized functions in motor preparation than β activity. However, it should be noted that although we focused on the PAC of the α range, high SI values before movements were not limited to the α range, but also extended over the β range (Fig. 3A). Therefore, β oscillations, together with α oscillations, may be involved in spatially localized functions in motor preparation via PAC with high-γ oscillations.
High-γ amplitude was coupled with the α/μ phase in the sensorimotor cortex
PAC has been observed across multiple cortical areas under a variety of experimental conditions in humans (Bruns and Eckhorn, 2004; Vanhatalo et al., 2004; Mormann et al., 2005; Pineda, 2005; Canolty et al., 2006; Osipova et al., 2008; Cohen et al., 2009; Händel and Haarmeier, 2009; Axmacher et al., 2010; He et al., 2010; Sadaghiani et al., 2010). Notably, the dominant low-frequency rhythms providing the phase for PAC depend on the region and task. For example, θ–γ coupling was predominant in the anterior frontal and temporal cortices during an auditory task, whereas α-γ coupling was strong over occipital areas during a visual task (Voytek et al., 2010). In addition to these findings, our results have shown that α-γ coupling was predominant in the sensorimotor cortex during a motor task, adding further diversity to PAC. It should be noted that in the human sensorimotor cortex, the α oscillation is also known as the μ rhythm, which is characterized by large amplitudes before movements and attenuation during movements (Sabate et al., 2012).
Implications for brain-machine interfaces
Although our results suggest that the features of PAC are not predictive of future movements, this coupling could be applied to improve brain-machine interfaces (Yanagisawa et al., 2012). PAC may be used to select the cortical area that is relevant for movement classification. By selecting electrodes with strong PAC, the cortical area representing motor information could be effectively identified even before the execution of a movement. The selection of electrodes or regions based on PAC might help to reduce the number of model parameters, and thus improve the efficiency of model training. It may also be useful to compress signals for real-time transmission in brain-machine interface systems.
Footnotes
This work was supported in part by the Strategic Research Program for Brain Sciences of MEXT, KAKENHI (22700435, 23390347, 24650106, 24700419), the Ministry of Health, Labor and Welfare (18261201, 23100101), the Brain Science Foundation, and a contract with the National Institute of Information and Communications Technology.
The authors declare no competing financial interests.
References
- Axmacher N, Henseler MM, Jensen O, Weinreich I, Elger CE, Fell J. Cross-frequency coupling supports multi-item working memory in the human hippocampus. Proc Natl Acad Sci U S A. 2010;107:3228–3233. doi: 10.1073/pnas.0911531107. [DOI] [PMC free article] [PubMed] [Google Scholar]
- Bengio Y, Grandvalet Y. No unbiased estimator of the variance of k-fold cross-validation. J Mach Learn Res. 2004;5:1089–1105. [Google Scholar]
- Breiman L. Heuristics of instability and stabilization in model selection. Ann Stat. 1996;24:2350–2383. [Google Scholar]
- Bruns A, Eckhorn R. Task-related coupling from high- to low-frequency signals among visual cortical areas in human subdural recordings. Int J Psychophysiol. 2004;51:97–116. doi: 10.1016/j.ijpsycho.2003.07.001. [DOI] [PubMed] [Google Scholar]
- Canolty RT, Knight RT. The functional role of cross-frequency coupling. Trends Cogn Sci. 2010;14:506–515. doi: 10.1016/j.tics.2010.09.001. [DOI] [PMC free article] [PubMed] [Google Scholar]
- Canolty RT, Edwards E, Dalal SS, Soltani M, Nagarajan SS, Kirsch HE, Berger MS, Barbaro NM, Knight RT. High gamma power is phase-locked to theta oscillations in human neocortex. Science. 2006;313:1626–1628. doi: 10.1126/science.1128115. [DOI] [PMC free article] [PubMed] [Google Scholar]
- Cheyne D, Bells S, Ferrari P, Gaetz W, Bostan AC. Self-paced movements induce high-frequency gamma oscillations in primary motor cortex. Neuroimage. 2008;42:332–342. doi: 10.1016/j.neuroimage.2008.04.178. [DOI] [PubMed] [Google Scholar]
- Churchland MM, Cunningham JP, Kaufman MT, Ryu SI, Shenoy KV. Cortical preparatory activity: representation of movement or first cog in a dynamical machine? Neuron. 2010;68:387–400. doi: 10.1016/j.neuron.2010.09.015. [DOI] [PMC free article] [PubMed] [Google Scholar]
- Cohen MX. Assessing transient cross-frequency coupling in EEG data. J Neurosci Methods. 2008;168:494–499. doi: 10.1016/j.jneumeth.2007.10.012. [DOI] [PubMed] [Google Scholar]
- Cohen MX, Axmacher N, Lenartz D, Elger CE, Sturm V, Schlaepfer TE. Nuclei accumbens phase synchrony predicts decision-making reversals following negative feedback. J Neurosci. 2009;29:7591–7598. doi: 10.1523/JNEUROSCI.5335-08.2009. [DOI] [PMC free article] [PubMed] [Google Scholar]
- Crone NE, Miglioretti DL, Gordon B, Sieracki JM, Wilson MT, Uematsu S, Lesser RP. Functional mapping of human sensorimotor cortex with electrocorticographic spectral analysis. I. Alpha and beta event-related desynchronization. Brain. 1998a;121:2271–2299. doi: 10.1093/brain/121.12.2271. [DOI] [PubMed] [Google Scholar]
- Crone NE, Miglioretti DL, Gordon B, Lesser RP. Functional mapping of human sensorimotor cortex with electrocorticographic spectral analysis. II. Event-related synchronization in the gamma band. Brain. 1998b;121:2301–2315. doi: 10.1093/brain/121.12.2301. [DOI] [PubMed] [Google Scholar]
- Engel AK, Fries P. Beta-band oscillations—signalling the status quo? Curr Opin Neurobiol. 2010;20:156–165. doi: 10.1016/j.conb.2010.02.015. [DOI] [PubMed] [Google Scholar]
- Gilbertson T, Lalo E, Doyle L, Di Lazzaro V, Cioni B, Brown P. Existing motor state is favored at the expense of new movement during 13–35 Hz oscillatory synchrony in the human corticospinal system. J Neurosci. 2005;25:7771–7779. doi: 10.1523/JNEUROSCI.1762-05.2005. [DOI] [PMC free article] [PubMed] [Google Scholar]
- Gould IC, Rushworth MF, Nobre AC. Indexing the graded allocation of visuospatial attention using anticipatory alpha oscillations. J Neurophysiol. 2011;105:1318–1326. doi: 10.1152/jn.00653.2010. [DOI] [PMC free article] [PubMed] [Google Scholar]
- Haegens S, Händel BF, Jensen O. Top-down controlled alpha band activity in somatosensory areas determines behavioral performance in a discrimination task. J Neurosci. 2011a;31:5197–5204. doi: 10.1523/JNEUROSCI.5199-10.2011. [DOI] [PMC free article] [PubMed] [Google Scholar]
- Haegens S, Nácher V, Luna R, Romo R, Jensen O. α-Oscillations in the monkey sensorimotor network influence discrimination performance by rhythmical inhibition of neuronal spiking. Proc Natl Acad Sci U S A. 2011b;108:19377–19382. doi: 10.1073/pnas.1117190108. [DOI] [PMC free article] [PubMed] [Google Scholar]
- Händel B, Haarmeier T. Cross-frequency coupling of brain oscillations indicates the success in visual motion discrimination. Neuroimage. 2009;45:1040–1046. doi: 10.1016/j.neuroimage.2008.12.013. [DOI] [PubMed] [Google Scholar]
- He BJ, Zempel JM, Snyder AZ, Raichle ME. The temporal structures and functional significance of scale-free brain activity. Neuron. 2010;66:353–369. doi: 10.1016/j.neuron.2010.04.020. [DOI] [PMC free article] [PubMed] [Google Scholar]
- Jensen O, Bonnefond M, VanRullen R. An oscillatory mechanism for prioritizing salient unattended stimuli. Trends Cogn Sci. 2012;16:200–206. doi: 10.1016/j.tics.2012.03.002. [DOI] [PubMed] [Google Scholar]
- Kamitani Y, Tong F. Decoding the visual and subjective contents of the human brain. Nat Neurosci. 2005;8:679–685. doi: 10.1038/nn1444. [DOI] [PMC free article] [PubMed] [Google Scholar]
- Klimesch W, Sauseng P, Hanslmayr S. EEG alpha oscillations: the inhibition-timing hypothesis. Brain Res Rev. 2007;53:63–88. doi: 10.1016/j.brainresrev.2006.06.003. [DOI] [PubMed] [Google Scholar]
- Lakatos P, Karmos G, Mehta AD, Ulbert I, Schroeder CE. Entrainment of neuronal oscillations as a mechanism of attentional selection. Science. 2008;320:110–113. doi: 10.1126/science.1154735. [DOI] [PubMed] [Google Scholar]
- Luo H, Poeppel D. Phase patterns of neuronal responses reliably discriminate speech in human auditory cortex. Neuron. 2007;54:1001–1010. doi: 10.1016/j.neuron.2007.06.004. [DOI] [PMC free article] [PubMed] [Google Scholar]
- Mathewson KE, Lleras A, Beck DM, Fabiani M, Ro T, Gratton G. Pulsed out of awareness: EEG alpha oscillations represent a pulsed-inhibition of ongoing cortical processing. Front Psychol. 2011;2:99. doi: 10.3389/fpsyg.2011.00099. [DOI] [PMC free article] [PubMed] [Google Scholar]
- Mazaheri A, Jensen O. Rhythmic pulsing: linking ongoing brain activity with evoked responses. Front Hum Neurosci. 2010;4:177. doi: 10.3389/fnhum.2010.00177. [DOI] [PMC free article] [PubMed] [Google Scholar]
- Miller KJ, Schalk G, Fetz EE, den Nijs M, Ojemann JG, Rao RP. Cortical activity during motor execution, motor imagery, and imagery-based online feedback. Proc Natl Acad Sci U S A. 2010;107:4430–4435. doi: 10.1073/pnas.0913697107. [DOI] [PMC free article] [PubMed] [Google Scholar]
- Mormann F, Fell J, Axmacher N, Weber B, Lehnertz K, Elger CE, Fernández G. Phase/amplitude reset and theta-gamma interaction in the human medial temporal lobe during a continuous word recognition memory task. Hippocampus. 2005;15:890–900. doi: 10.1002/hipo.20117. [DOI] [PubMed] [Google Scholar]
- Muthukumaraswamy SD. Functional properties of human primary motor cortex gamma oscillations. J Neurophysiol. 2010;104:2873–2885. doi: 10.1152/jn.00607.2010. [DOI] [PubMed] [Google Scholar]
- Neuper C, Pfurtscheller G. Event-related dynamics of cortical rhythms: frequency-specific features and functional correlates. Int J Psychophysiol. 2001;43:41–58. doi: 10.1016/s0167-8760(01)00178-7. [DOI] [PubMed] [Google Scholar]
- Osipova D, Hermes D, Jensen O. Gamma power is phase-locked to posterior alpha activity. PLoS One. 2008;3:e3990. doi: 10.1371/journal.pone.0003990. [DOI] [PMC free article] [PubMed] [Google Scholar]
- Palva S, Palva JM. New vistas for alpha-frequency band oscillations. Trends Neurosci. 2007;30:150–158. doi: 10.1016/j.tins.2007.02.001. [DOI] [PubMed] [Google Scholar]
- Pineda JA. The functional significance of mu rhythms: translating “seeing” and “hearing” into “doing.”. Brain Res Brain Res Rev. 2005;50:57–68. doi: 10.1016/j.brainresrev.2005.04.005. [DOI] [PubMed] [Google Scholar]
- Quian Quiroga R, Panzeri S. Extracting information from neuronal populations: information theory and decoding approaches. Nat Rev Neurosci. 2009;10:173–185. doi: 10.1038/nrn2578. [DOI] [PubMed] [Google Scholar]
- Ray S, Crone NE, Niebur E, Franaszczuk PJ, Hsiao SS. Neural correlates of high-gamma oscillations (60–200 Hz) in macaque local field potentials and their potential implications in electrocorticography. J Neurosci. 2008;28:11526–11536. doi: 10.1523/JNEUROSCI.2848-08.2008. [DOI] [PMC free article] [PubMed] [Google Scholar]
- Sabate M, Llanos C, Enriquez E, Rodriguez M. Mu rhythm, visual processing and motor control. Clin Neurophysiol. 2012;123:550–557. doi: 10.1016/j.clinph.2011.07.034. [DOI] [PubMed] [Google Scholar]
- Sadaghiani S, Scheeringa R, Lehongre K, Morillon B, Giraud AL, Kleinschmidt A. Intrinsic connectivity networks, alpha oscillations, and tonic alertness: a simultaneous electroencephalography/functional magnetic resonance imaging study. J Neurosci. 2010;30:10243–10250. doi: 10.1523/JNEUROSCI.1004-10.2010. [DOI] [PMC free article] [PubMed] [Google Scholar]
- Saleh M, Reimer J, Penn R, Ojakangas CL, Hatsopoulos NG. Fast and slow oscillations in human primary motor cortex predict oncoming behaviorally relevant cues. Neuron. 2010;65:461–471. doi: 10.1016/j.neuron.2010.02.001. [DOI] [PMC free article] [PubMed] [Google Scholar]
- Sirota A, Montgomery S, Fujisawa S, Isomura Y, Zugaro M, Buzsáki G. Entrainment of neocortical neurons and gamma oscillations by the hippocampal theta rhythm. Neuron. 2008;60:683–697. doi: 10.1016/j.neuron.2008.09.014. [DOI] [PMC free article] [PubMed] [Google Scholar]
- Tamura Y, Hoshiyama M, Nakata H, Hiroe N, Inui K, Kaneoke Y, Inoue K, Kakigi R. Functional relationship between human rolandic oscillations and motor cortical excitability: an MEG study. Eur J Neurosci. 2005;21:2555–2562. doi: 10.1111/j.1460-9568.2005.04096.x. [DOI] [PubMed] [Google Scholar]
- Vanhatalo S, Palva JM, Holmes MD, Miller JW, Voipio J, Kaila K. Infraslow oscillations modulate excitability and interictal epileptic activity in the human cortex during sleep. Proc Natl Acad Sci U S A. 2004;101:5053–5057. doi: 10.1073/pnas.0305375101. [DOI] [PMC free article] [PubMed] [Google Scholar]
- Voytek B, Canolty RT, Shestyuk A, Crone NE, Parvizi J, Knight RT. Shifts in gamma phase-amplitude coupling frequency from theta to alpha over posterior cortex during visual tasks. Front Hum Neurosci. 2010;4:191. doi: 10.3389/fnhum.2010.00191. [DOI] [PMC free article] [PubMed] [Google Scholar]
- Yanagisawa T, Hirata M, Saitoh Y, Kato A, Shibuya D, Kamitani Y, Yoshimine T. Neural decoding using gyral and intrasulcal electrocorticograms. Neuroimage. 2009;45:1099–1106. doi: 10.1016/j.neuroimage.2008.12.069. [DOI] [PubMed] [Google Scholar]
- Yanagisawa T, Hirata M, Saitoh Y, Goto T, Kishima H, Fukuma R, Yokoi H, Kamitani Y, Yoshimine T. Real-time control of a prosthetic hand using human electrocorticography signals. J Neurosurg. 2011;114:1715–1722. doi: 10.3171/2011.1.JNS101421. [DOI] [PubMed] [Google Scholar]
- Yanagisawa T, Hirata M, Saitoh Y, Kishima H, Matsushita K, Goto T, Fukuma R, Yokoi H, Kamitani Y, Yoshimine T. Electrocorticographic control of a prosthetic arm in paralyzed patients. Ann Neurol. 2012;71:353–361. doi: 10.1002/ana.22613. [DOI] [PubMed] [Google Scholar]