

Abstract
The basal ganglia play a pivotal role in reward-oriented behavior. The striatum, an input channel of the basal ganglia, is composed of subdivisions that are topographically connected with different cortical and subcortical areas. To test whether reward information is differentially processed in the different parts of the striatum, we compared reward-related neuronal activity along the dorsolateral–ventromedial axis in the caudate nucleus of monkeys performing an asymmetrically rewarded oculomotor task. In a given block, a target in one position was associated with a large reward, whereas the other target was associated with a small reward. The target position–reward value contingency was switched between blocks. We found the following: (1) activity that reflected the block-wise reward contingency emerged before the appearance of a visual target, and it was more prevalent in the dorsal, rather than central and ventral, caudate; (2) activity that was positively related to the reward size of the current trial was evident, especially after reward delivery, and it was more prevalent in the ventral and central, rather than dorsal, caudate; and (3) activity that was modulated by the memory of the outcomes of the previous trials was evident in the dorsal and central caudate. This multiple reward information, together with the target-direction information, was represented primarily by individual caudate neurons, and the different reward information was represented in caudate subpopulations with distinct electrophysiological properties, e.g., baseline firing and spike width. These results suggest parallel processing of different reward information by the basal ganglia subdivisions defined by extrinsic connections and intrinsic properties.
Introduction
The present model for basal ganglia function hypothesizes that parallel corticobasal ganglia loops of limbic, associative, and motor domains contribute to their diverse functions. The striatum, an input station of the basal ganglia, consists of subdivisions that belong to these loops. Studies using a hand-reaching task in primates demonstrate that the dorsal and ventral striatum carry skeletal movement and expectation of reward information, respectively (Apicella et al., 1991; Schultz et al., 1992; Bowman et al., 1996; Tremblay et al., 1998; Hassani et al., 2001; Cromwell and Schultz, 2003). However, evidence also suggests equally important contributions of the dorsal and ventral striatum to motivational behavior. Electrical stimulation was equally rewarding in the ventral and dorsal striatum (Prado-Alcala and Wise, 1984; Wise, 2009). In humans, both the dorsal and ventral striatum are activated by primary or secondary rewards (Koepp et al., 1998; Knutson et al., 2001b; Zald et al., 2002; O'Doherty et al., 2004). Reward information is processed widely in the striatum, but information of a different nature is represented in the segregated parts of the striatum; however, anatomical comparisons between different species must be made carefully (Schultz, 2000; Atallah et al., 2007; Balleine et al., 2007; Haber and Knutson, 2010). In rodents, the dorsolateral striatum is implicated in the acquisition and performance of stimulus–response tasks and habitual responses (Yin et al., 2004; Graybiel, 2008; White, 2009; Balleine and O'Doherty, 2010), whereas the dorsomedial striatum has roles in action–outcome association and flexible, goal-directed behavioral control (Balleine and Killcross, 1994; Yin and Knowlton, 2006; Ragozzino, 2007; Kimchi and Laubach, 2009b). The more ventral part, including the nucleus accumbens, is implicated not only in value coding and pavlovian responses (Balleine and Killcross, 1994) but also in instrumental responses in which cues indicating future rewards guide behavioral responses (Everitt et al., 1999; Cardinal et al., 2002; Setlow et al., 2003; Kelley, 2004; Nicola et al., 2004) and the integration of value and chosen action (Ito and Doya, 2009; Roesch et al., 2009). Human imaging studies suggest that the dorsal and ventral striatum correspond to an “actor,” which maintains information about the reward outcomes of actions, and to a “critic,” which learns to predict future rewards, respectively (O'Doherty et al., 2004). A recent primate study showed that the dorsal and ventral caudate, a rostral part of the striatum, encode the difference and the sum of the temporally discounted values, respectively (Cai et al., 2011).
However, it remains to be clarified whether and how different striatum subdivisions encode different kinds of reward signal, as well as motor and cognitive signals at the single-unit level in the same animal. Such a study would contribute to a better understanding of information processing in the striatum for reward-dependent learning and action control (Daw and Doya, 2006), as well as elaborating potential therapeutic targets. The caudate nucleus is an ideal region to investigate this issue because it has been studied extensively for the regulation of saccadic eye movements (Hikosaka et al., 2000). The purposeful generation of saccade can be achieved by transient removal of the inhibition from the substantia nigra pars reticulata, which is caused by disinhibition from the caudate nucleus. The activity of caudate neurons is modulated by reward information (Kawagoe et al., 1998; Lauwereyns et al., 2002; Takikawa et al., 2002a; Hikosaka et al., 2006; Lau and Glimcher, 2007). Thus, the caudate conveys reward information by which saccadic eye movements are modulated.
In this study, we directly compared reward-related activity in single neurons at different locations within the caudate nucleus in monkeys performing an asymmetric reward saccade task. We found that reward information of a different nature and timescale was represented during the distinct trial epochs by distinct groups of neurons.
Materials and Methods
General.
We used two hemispheres of two male rhesus monkeys (Macaca fascicularis; laboratory designations S, 7.0 kg, and F, 5.4 kg). Each animal had been implanted with a post to allow for the maintenance of a stable head position. A circular CILUX recording chamber (Crist Instruments) was placed and tilted laterally by 30° for monkey S and 20° for monkey F. All aspects of the behavioral experiment, including stimuli presentation, monitoring of eye movements and neuronal activity, and delivery of reward, were under the control of a real-time experimentation data acquisition system (Tempo; Reflective Computing). Eye position was monitored using an infrared video tracking system at a time resolution of 240 Hz and spatial resolution of 0.1° (EYE-TRAC6; ASL). Stimuli generated by an active matrix liquid crystal display projector (EPSON ELP-505) were rear projected on a frontoparallel screen located at 25 cm from the monkey's eyes. The water reward was delivered through a spigot under the control of a solenoid valve. All experimental procedures were performed in accordance with the National Institutes of Health Guidelines for the Care and Use of Laboratory Animals and approved by the Committee for Animal Experiment at Kansai Medical University.
Behavioral task.
The monkeys performed a visually guided saccade task in which the expected reward size was different depending on the target position. The essential procedure of the task is summarized in Figure 1A. Each trial began with the presentation of a central fixation point (FP; diameter, 0.6°). After the animal maintained fixation on the spot for 1200 ms within a 5° window, the FP was turned off, and a target, a small white dot (0.6°), appeared at 15° (monkey S) or 10° (monkey F) either right or left from the FP to which the animal was required to make a saccade. The monkey maintained fixation on the target for 1600 ms until the target went off, followed by the delivery of the liquid reward (Fig. 1, top). The intertrial interval, which started at the time of reward offset and lasted until FP onset in the next trial, was 3 s. The sequence for the target position was pseudorandom, subject to the constraint that, within every four trials (two trials for each of the two positions), the order was determined randomly (Fig. 1, bottom). In one experimental block consisting of 16–24 trials (8–12 trials for each direction), the reward was always larger (0.4 ml) for one target location (e.g., left) and smaller (0.05 or 0 ml) for the other location (e.g., right). Even for the small-reward trials, the animal had to make a correct saccade; if the animal aborted the trial by breaking fixation or the saccade was incorrect, the same trial was repeated until the saccade was performed correctly. In the second block, the direction of the reward bias was reversed (e.g., right-large and left-small). For the completion of one “session,” these two kinds of blocks with opposite reward schedules were alternated two or three times so that a total of four to six blocks were performed. No explicit cue, other than the reward received, was given to signal block changes.
Figure 1.

Experimental procedure. A, Top, Visually guided saccade task with an asymmetric reward schedule (1DR-VGS). After the monkey fixated on the FP for 1200 ms, the FP disappeared and a target cue appeared immediately on either the left or right, to which the monkey made a saccade to receive a liquid reward. The dotted circles indicate the direction of gaze. In a block of 20–28 trials (e.g., left-large block), one target position (e.g., left) was associated with a large reward, and the other position (e.g., right) was associated with a small reward. The position-reward contingency was then reversed (e.g., right-large block). Bottom, The trial sequence. Left- and right-large conditions were alternated between blocks. The sequence for the target position was pseudorandom, subject to the constraint that, within every four trials (2 trials for each of the 2 positions), the order was determined randomly. B, Changes in the mean normalized saccadic reaction times of all analyzed data before and after target-reward contingency reversal. Error bars indicate 1 SE. *p < 0.01 indicates that the reaction times of the particular trial were significantly different from those during the last five trials of the block (Mann–Whitney U test).
Mapping and recording of the caudate.
The location of neurons in the caudate was verified by overlaying penetration record maps on magnetic resonance (MR) images (0.3T, AIRIS; Hitachi). As shown in Figure 2, A and B (top), MR images were obtained with the recording chamber filled with Betadine ointment, which clarified the relative location of the recording chamber and underlying brain structure. The anteroposterior extent of the recording sites was from 7 to 0 mm anterior to the anterior commissure for monkey S and 6 mm anterior to 4 mm posterior to the anterior commissure for monkey F, which corresponded to anterior 24–31 mm (monkey S) and 19.5–29.5 mm (monkey F) in the Horsley–Clarke coordinates.
Figure 2.
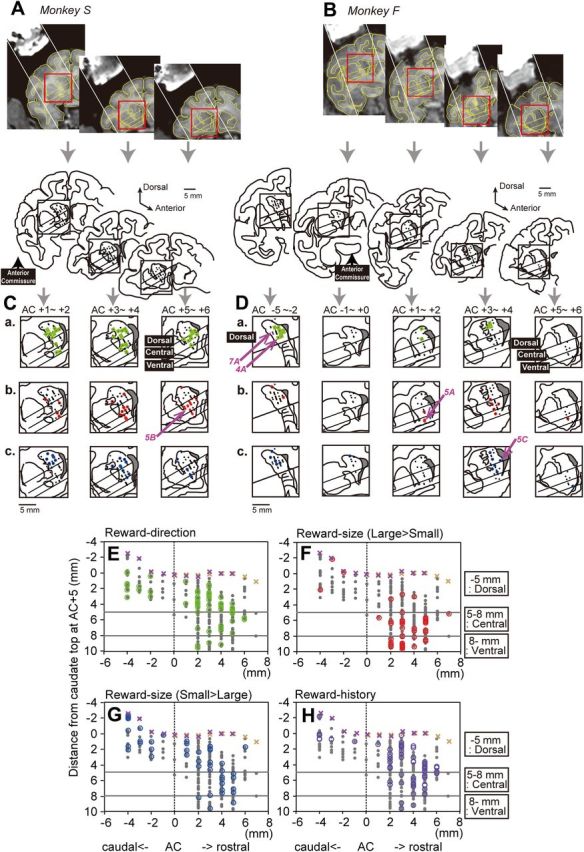
The recording sites in monkeys S and F. The location of each neuron is estimated from the depth of the electrode at the time of recording and the depth of the caudate boundary, which was judged by changes in the background activity, both of which are overlaid on MR images of coronal sections. A, B, Representative full coronal section views of the recording sites at different rostrocaudal levels with the rectangles outlining the regions magnified in the bottom rows. Note that, in the MR images, the recording chamber filled with Betadine ointment is visible. The diagonal lines in the rectangles are the borders between the dorsal, central, and ventral caudate. C, D, Distribution of neurons that showed different task modulation. At the top of the panels, AC indicates the level of the anterior commissure, and the positive and negative numbers indicate the distance in millimeters anterior and posterior to the AC, respectively. a, The green dots indicate the neurons that showed significant reward direction-selective modulation in their pre-target activity (800 ms before target onset, p < 0.01). b, The red dots indicate the neurons that showed a significantly stronger response after large- than small-reward delivery (400–800 ms after reward onset, p < 0.01). c, The blue dots indicate the neurons that showed a significantly stronger response after small- than large-reward delivery (400–800 ms after reward onset, p < 0.01). The locations of the example neurons in Figures 4, 5, and 7 are indicated by the pink arrows. E–H, The rostral–caudal distribution of neurons with different signals. The data from both monkeys are included. The x-axis indicates the distance from the anterior commissure. The y-axis indicates the depth from the dura, which is normalized so that the depth of the top edge of the caudate at AC+5 is zero. The × symbols (orange, monkey S; purple, monkey F) indicate the top edge of the caudate estimated by changes in background activity. The gray dots indicate the location of the task-related neurons.
We used a grid system for the electrophysiological recordings. Throughout all experiments, the grid was positioned at a fixed depth relative to the recording chamber so that the flat bottom of the grid was always attached to the surface of the dura. The depth of the neurons was consistently measured from the bottom of the grid, i.e., from the surface of the dura. The depth was then normalized as the depth relative to the top edge of the caudate at the AC+5 level (see Fig. 2E–H). For neuronal recording, a sharpened stainless-steel guide tube (outer diameter, 0.6 mm; inner diameter, 0.35 mm) was inserted through a grid hole, and, after penetrating the dura, it was lowered until its tip reached ∼5 mm above the upper edge of the caudate. We advanced an electrode through this guide tube to reach the caudate nucleus using a hydraulic microdrive (MO-97A; Narishige).
The depth of the dorsal border of the caudate was easily identified from changes in the background firing rate as the electrode traveled through the cortex, white matter, and caudate (see Fig. 2E–H, × symbols). The ventromedial border of the caudate was identified by the lack of activity for more anterior tracks and the detection of tonic firing with high frequency in the bed nucleus of the stria terminalis for tracks slightly posterior to the anterior commissure. Quieter background activity in the anterior commissure and the lateral ventricle was also useful information to confirm the location of the recording sites.
The activity of single neurons was recorded using tungsten electrodes (0.25 mm diameter, 1–3 MΩ; Frederick Haer Company). The signal was amplified with a bandpass filter (150 Hz to 3 kHz; MEG-5100; Nihon Kohden) and collected at 1 kHz, and single-neuron activity was isolated using a template-matching spike discriminator (time resolution, 50 kHz for waveform matching and spike sampling; Alpha Omega). To avoid the potential confounder of training-related changes in the monkeys' performance, recordings were made from the ventral and dorsal parts of the caudate on alternate days.
In the caudate, we searched for task-related neurons by visual inspection while the animals performed the saccade tasks. Among them, typical putative interneurons (tonically active neurons) with irregular-tonic firing patterns or with typical suppression of activity in response to target onset or saccade onset (Shimo and Hikosaka, 2001) were not included for additional analyses. For the rest, many of them were characterized as putative projection neurons by their low spontaneous activity in the absence of a task (<6 Hz) and characteristic activation in bursts of spikes in relation to the task events, e.g., target onset and saccades. Some other neurons, however, showed clear task-related modulation in activity similar to those of typical projection neurons, but their baseline activity was higher (>5 Hz); we included these neurons for additional analyses.
Data analyses.
Our aim was to examine whether different task-related information was represented in different parts of the caudate. Thus, we analyzed the distribution of neurons with different functional characteristics along with their depth from the top edge of the caudate (see Fig. 3). There are no anatomically or physiologically detectable landmarks to delineate the different parts of the striatum (Haber and McFarland, 1999; Prensa et al., 2003); nevertheless, to characterize the subdivisions of the caudate, we divided the caudate according to two previous reports. Cai et al. (2011) divided the caudate into “dorsal” and “ventral” at the lower edge of the lateral ventricle. This division is roughly consistent with the border between the “dorsal” and “central” caudate reported by Haber and Knutson (2010). Furthermore, Haber and Knutson referred to the “ventral” caudate located at the farthest ventromedial location. Therefore, we divided the caudate into dorsal, central, and ventral by applying the ratio of the physical dorsolateral–ventromedial size of each subdivision onto our recording axis. Specifically, the caudate was divided depending on the distance from the surface of the dura along the recording direction (see Fig. 2E–H; see above, Mapping and recording of the caudate). Note that, because the top edge of the caudate posterior to the anterior commissure was closer to the surface of the brain than that at AC+5, the normalized depth of the neurons located posterior to the anterior commissure can be less than zero.
Figure 3.

Proportion of neurons that showed different reward effects depending on the task epoch and recording depth. Gray, Task related; green, reward-direction signal; red, large-reward signal; blue, small-reward signal; purple, reward-history signal; dotted black, target-direction signal with either contralateral or ipsilateral preference.
Saccade onset latency, i.e., the time from target onset to saccade onset, was determined using standard velocity and acceleration threshold-crossing algorithms. For the analyses of activity, only correct trials were included. For each neuron, the activity for the following task periods was computed: baseline activity (400 ms before FP onset), 1200–800 and 800–0 ms before target onset, early and late reward-delay periods (0–800 and 800–1600 ms after target onset), and post-reward periods (400–800, 800–1200, and 1200–1600 ms after reward delivery). Each neuron was judged to be “task-related” if its activity during at least one of the task periods, for at least one of the four task conditions (two targets, two reward sizes), was significantly modulated (Kruskal–Wallis test, p < 0.01). We defined activity during the particular task epoch as significantly modulated if it was significantly different from the baseline period (Mann–Whitney U test, p < 0.01) or if a significant reward-size, target-direction, or interaction effect was observed (see below).
We first focused on three types of activity modulation: (1) reward size-selective signal, which indicated a significant difference in activity between the large- and small-reward trials; (2) target direction-selective signal, which indicated a significant difference in activity between the right- and left-target trials; and (3) reward direction-selective signal, which indicated a significant difference in activity between the right- and left-large reward blocks. To analyze the effect of reward size (1) and target direction (2), we used two-way ANOVA (p < 0.01) on the activity during each task period. For the effect of reward direction (3), firing rates during an 800 ms window before target onset (the pre-target epoch) were compared between the right- and left-large blocks (Mann–Whitney U test, p < 0.01). The χ2 or Fisher's exact test was used to analyze whether the proportion of neurons that showed these effects was different between the subdivisions of the caudate.
To examine the time course of changes for the reward-direction, reward-size, and target-direction effects, we computed a receiver operating characteristic (ROC) value by comparing the firing rates in the same 100 ms test window between the left- and right-large reward trials (see Fig. 4), the large- and small-reward trials (see Fig. 5), and the left- and right-target trials (see Fig. 7). We then computed the percentage of neurons within each caudate subregion that showed significant modulation during each time bin (see Figs. 4F–H, 5H–J, 7F–H).
Figure 4.

Reward-direction effect. A, An example of dorsal caudate neuronal activity showing a reward-direction effect. Spike shape is shown on the left (scale bar, 1 ms), and the location of the neuron is indicated in Figure 2Da. Action potentials are shown by raster plots in the chronological order of the trials, separately for leftward and rightward saccades. The changes in firing rate are shown by the perievent histograms at the top (smoothed with a Gaussian kernel; δ = 5 ms; width = 5 δ). The activity in the large- and small-reward trials is shown in red and blue, respectively. The histograms and raster plots are shown in two sections: the left section is aligned to the time of target cue onset (TG on), and the right is aligned to reward onset (RW on). The green dots indicate the appearance of an FP, the black dots indicate saccade onset (Sac on), and the light blue dots indicate reward onset and offset. The reward offset (RW off) applies only to the large-reward trials. Note that this neuron showed stronger pre-target activity for the right-large block. B, Percentage of neurons that showed a reward-direction effect. C–E, Temporal course of the reward-direction effect of each neuron presented as a row of pixels. The ROC value of each pixel is based on the comparison of the firing rate in the same test window centered on the pixel between the contralateral- and ipsilateral-large blocks. Warm colors (ROC > 0.5) indicate higher firing rates on the contralateral- than ipsilateral-large block, whereas cool colors (ROC < 0.5) indicate higher firing rates on the ipsilateral- than contralateral-large block. In all panels, the order of the neurons from the top to the bottom is identical to that in Figure 5E–G, where the neurons were ordered based on the strength of their reward-size effect for post-reward activity. F–H, Temporal course of the fraction of neurons that showed a significant reward-direction effect for each time bin (100 ms duration, Mann–Whitney U test, p < 0.01).
Figure 5.
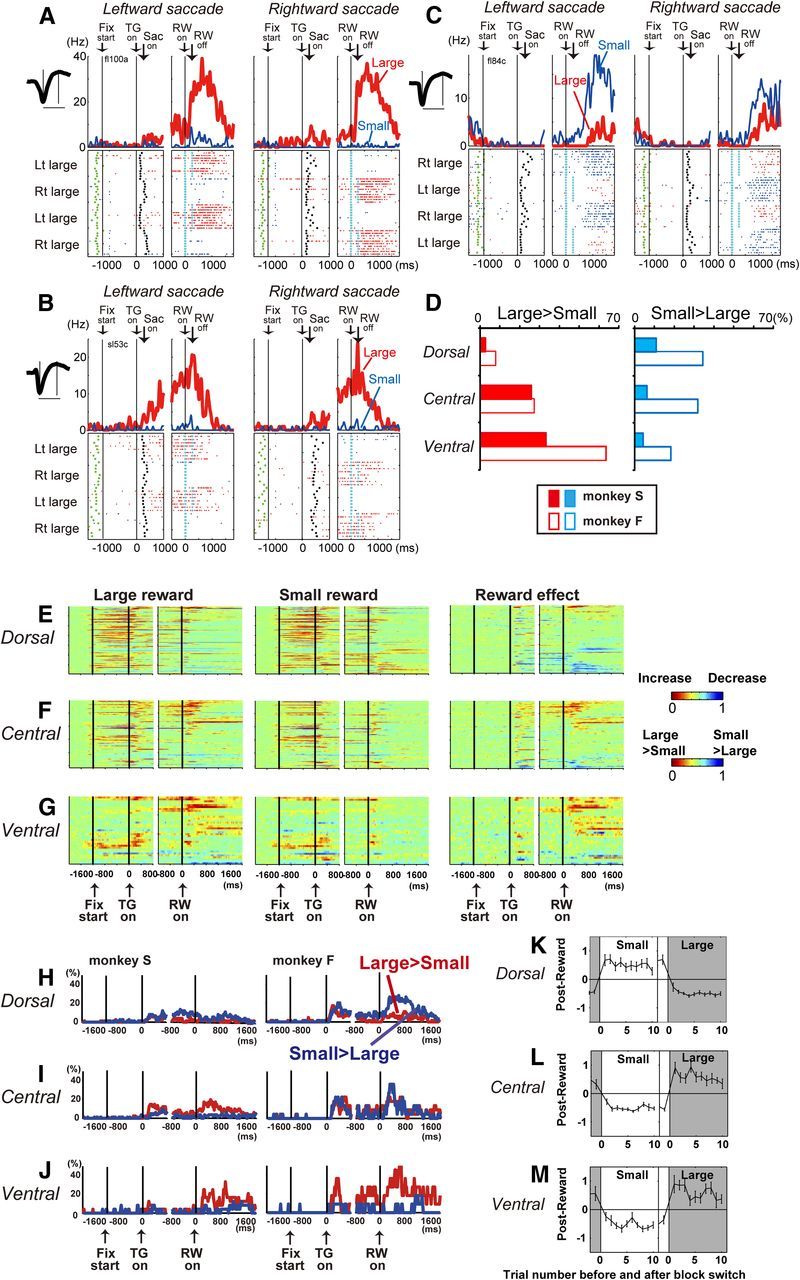
Reward size effect. A–C, Examples of ventral (A), central (B), and dorsal (C) caudate neuronal activity showing a reward-size effect. The layout is the same as in Figure 4A. D, Percentage of neurons that showed a significant reward-size effect. E–G, Temporal course of the reward-size effect of each neuron. Left and middle columns, Changes in neuronal firing rate from baseline are compared for large- and small-reward trials, separately. The color of each pixel indicates the ROC value based on the comparison of the firing rate between a control period just before fixation onset (400 ms duration) and a test window centered on the pixel (100 ms duration). This analysis was repeated by moving the test window in 20 ms steps. Warm colors (ROC > 0.5) indicate an increase in the firing rate relative to the control period, whereas cool colors (ROC < 0.5) indicate a decrease in the firing rate. Right column, Changes in reward-size-dependent modulation. The ROC value of each pixel was based on the comparison of the firing rate in the same test window centered on the pixel between the large- and small-reward trials. Warm colors (ROC > 0.5) indicate higher firing rates for large- than for small-reward trials, whereas cool colors (ROC < 0.5) indicate higher firing rates for small- than for large-reward trials. In all panels, the neurons have been sorted in order of their ROC values and the length of time with significant reward modulation during the post-reward (0–1600 ms) period. H–J, Temporal course of the fraction of neurons that showed a significant reward-size effect for each time bin (100 ms duration, two-way ANOVA, p < 0.01). K–M, Trial-by-trial changes in post-reward activity. Large-reward trials are indicated by the dark gray areas; small-reward trials are indicated by the white areas. Shown are the mean and SE of the normalized post-reward activity of the nth trial before and after contingency reversal: K, dorsal caudate neurons with small-reward preference (n = 26); L, central caudate neurons with large-reward preference (n = 24); M, ventral caudate neurons with large-reward preference (n = 16).
Figure 7.
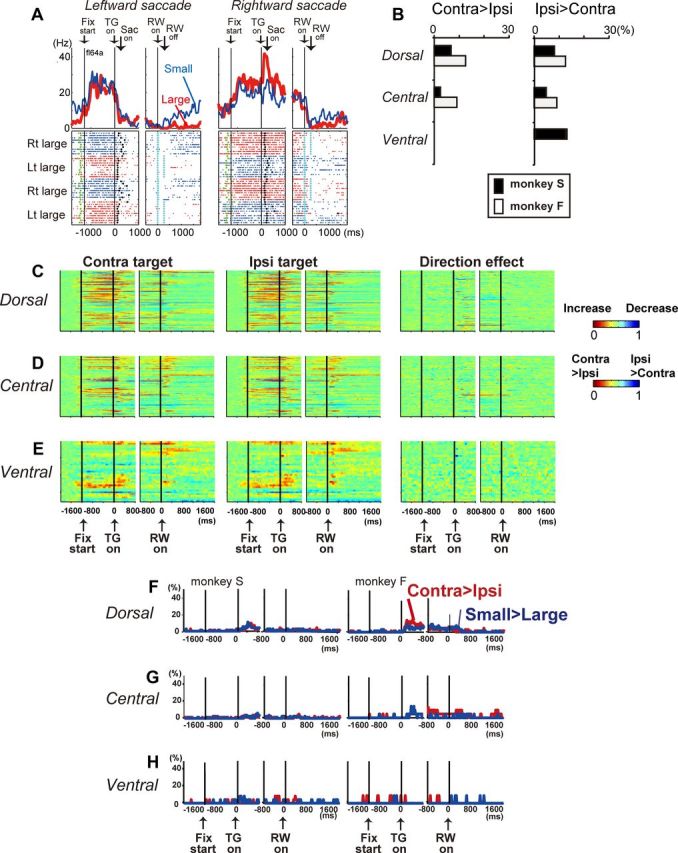
Target-direction effect. A, Examples of dorsal caudate neuronal activity showing a target-direction effect during the early reward-delay period. This neuron also showed a reward-size effect (large-reward dominant) after target onset. The layout is the same as in Figure 4A. B, Percentage of neurons that showed a significant target-direction effect during the early reward-delay period. C–E, Temporal course of the target-direction effect of each neuron. Left and middle columns, Changes in neuronal firing rate from baseline are compared for contralateral and ipsilateral target trials, separately. Right column, Changes in target-direction-dependent modulation comparing the firing rate between the contralateral and ipsilateral target trials. Warm colors (ROC > 0.5) indicate higher firing rates for contralateral than for ipsilateral trials, whereas cool colors (ROC < 0.5) indicate higher firing rates for ipsilateral- than for contralateral-reward trials. In all panels, the order of the neurons from the top to the bottom is identical to that in Figure 5E–G, where the neurons were ordered based on the strength of their reward-size effect for post-reward activity. F–H, Temporal course of the fraction of neurons that showed a significant target-direction effect for each time bin (100 ms duration, two-way ANOVA, p < 0.01). TG on, Target cue onset; RW on, reward onset; RW off, reward offset; Fix start, fixation start; Sac on, saccade onset.
We also examined the time course of the trial-by-trial changes in normalized reaction times after the reversal of the position–reward contingency, computed as (reaction time of the trial − average reaction time over all trials for the same saccade direction)/(SD of the reaction times over all trials for the same saccade direction) (Fig. 1B). We then compared the z-scores of all data between the ith trial after a block switch and the last five trials of the same block (Mann–Whitney U test, p < 0.01; Fig. 1B). Similarly, for a population-level examination of the trial-by-trial changes in post-reward activity after a block switch, we normalized the firing rate during each task period of a given trial by computing its z-score, i.e., (mean firing rate of the trial − average mean firing rate over all trials)/(SD of the mean firing rate over all trials) (see Fig. 5K–M).
To quantify the strength of the reward-size signal, the reward-size index was computed as activity for (large-reward trials − small-reward trials)/(large-reward trials + small-reward trials). The strength of the reward-direction signal of the pre-target activity was computed as (contralateral large trials − ipsilateral large trials)/(contralateral large trials + ipsilateral large trials) (see Fig. 8).
Figure 8.
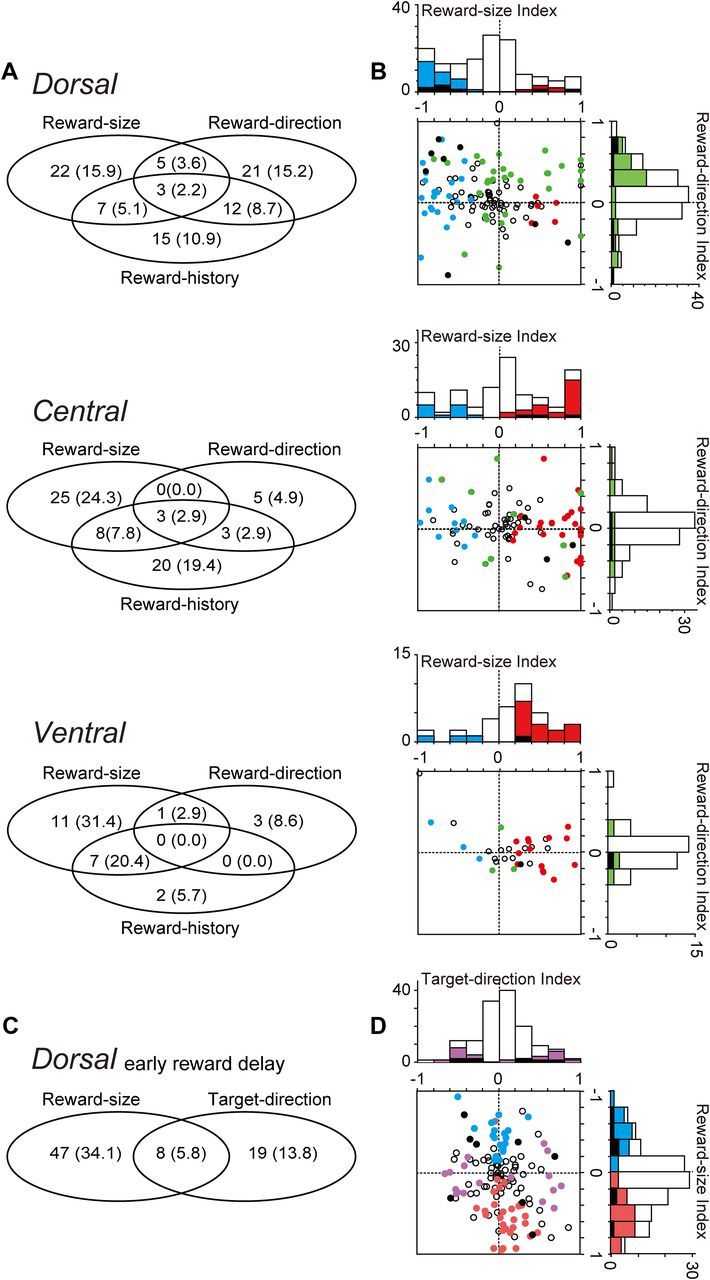
Different reward-related signals are represented primarily by separate groups of neurons. A, The Venn diagrams show the number and percentage of neurons that showed significant reward-size, reward-direction, and reward-history effects. Note that the reward-history effect was judged to be present if the activity of at least one of the pre-target, early reward delay, and post-reward periods was affected by the size of the previously given reward. B, Reward-size signal and reward-direction signal were encoded primarily by separate groups of neurons. In the panels, the x-axis indicates the strength of the reward-size effect, computed for the activity measured from 4 to 800 ms after reward onset, as follows: (large reward trials − small reward trials)/(large reward trials + small reward trials). The y-axis indicates the strength of the reward-direction effect, computed for the activity measured at 800 ms before target onset, as follows: (contralateral-large block − ipsilateral-large block)/(contralateral-large block + ipsilateral-large block). The red-, blue-, and green-filled dots and bars indicate neurons with a significant large-reward preference, small-reward preference (two-way ANOVA, p < 0.01), and reward-direction signal, respectively (Mann–Whitney U test, p < 0.01). The black-filled dots and bars indicate neurons with a significant effect of both reward size and reward direction. C, D, Same as A and B, except that they show reward-size and target-direction effects during the early reward-delay period in the dorsal caudate.
Results
Two monkeys, S and F, were trained to perform a visually guided saccade task with an asymmetric reward schedule (1DR-VGS; Fig. 1A). After the presentation of a target cue, with the information of the spatial bias of the reward size (i.e., left-large or right-large) or “reward direction,” the expected “reward size” (i.e., large or small) for that particular trial was fully predicted, except in the very first trials after a block switch (reversal of the position–reward contingency). The monkeys indeed capitalized on this information, as evidenced by their saccade reaction times (Fig. 1B). Consistent with previous reports (Kawagoe et al., 1998; Takikawa et al., 2002b), both monkeys showed significantly longer saccadic reaction times when a small reward was expected than when a large reward was expected (p < 0.0001, Mann–Whitney U test), and the reaction times changed quickly after a block switch (Lauwereyns et al., 2002; Watanabe and Hikosaka, 2005).
For the survey of neurons, the electrode was directed almost parallel to the internal capsule, which enabled us to search from the dorsolateral-to-ventromedial caudate (Fig. 2A,B). The depth of each neuron was measured from the dura and was normalized such that the top edge of the caudate at the AC+5 level was zero (Fig. 2E–H). Then, as in Figure 2E–H, the caudate was divided into the three subdivisions by the normalized depth of the recording sites: (1) the dorsal caudate, which extends up to 5 mm; in monkey F, this region was studied posteriorly and anteriorly to the anterior commissure, whereas in monkey S, only the anterior part was studied; (2) the central caudate, which extends 5–8 mm; and (3) the ventral caudate, which extends 8 mm or deeper from the top edge of the caudate. The central and ventral caudate regions were thus located anterior to the anterior commissure.
Neurons with task-related activity were widely distributed within the caudate, as observed in the coronal views (Fig. 2A–D) and the planes parallel to the recording paths (Fig. 2E–H). On the basis of these caudate subdivisions, we analyzed the activity of 138 dorsal (74 from monkey S and 64 from monkey F), 103 central (81 and 22), and 35 ventral (24 and 11) caudate neurons. The number and percentage of neurons showing significant modulation of activity for each task epoch (for the definition of “modulated activity,” see Materials and Methods) is shown in Table 1 and by the gray lines in Figure 3. The following analyses revealed that different reward signals were represented in distinct regions within the caudate.
Table 1.
The number and percentage (in parentheses) of neurons whose activity was significantly modulated (see Materials and Methods) for each task epoch
| Area | Modulated neurons |
||||||
|---|---|---|---|---|---|---|---|
| Number of neurons | Pre-target | Early reward-delay | Late reward-delay | Post-reward 4–800 ms | Post-reward 8–1200 ms | Post-reward 12–1600 ms | |
| Monkey S | |||||||
| Dorsal | 74 | 58 (78.4) | 53 (71.6) | 47 (63.5) | 26 (35.1) | 21 (28.4) | 19 (25.7) |
| Central | 81 | 49 (60.5) | 56 (69.1) | 48 (59.3) | 43 (53.1) | 34 (42.0) | 28 (34.6) |
| Ventral | 24 | 13 (54.2) | 13 (54.2) | 11 (45.8) | 10 (41.7) | 17 (70.8) | 11 (45.8) |
| Monkey F | |||||||
| Dorsal | 64 | 45 (70.3) | 53 (82.8) | 47 (73.4) | 46 (71.9) | 42 (65.6) | 38 (59.4) |
| Central | 22 | 11 (50.0) | 16 (72.7) | 16 (72.7) | 16 (72.7) | 10 (45.5) | 9 (40.9) |
| Ventral | 11 | 3 (27.3) | 10 (90.9) | 6 (54.5) | 9 (81.8) | 6 (54.5) | 5 (45.5) |
Reward-direction-dependent pre-target activity was prevalent in the dorsal caudate
Many caudate neurons showed significant modulation in activity during the pre-target epoch (800 ms window before target onset). However, these neurons were unevenly distributed, with a significantly larger proportion of neurons in the dorsal than the central and ventral caudate [p = 0.021, χ2 = 7.68, degrees of freedom (df) = 2 for monkey S; p = 0.013, χ2 = 8.70, df = 2 for monkey F; Fig. 3, gray line, “pre-target”; Table 1]. We further confirmed that some of this pre-target activity was modulated by reward direction as reported previously (Lauwereyns et al., 2002; Takikawa et al., 2002a; Ding and Hikosaka, 2006). For example, the neuron shown in Figure 4A (for its location, see Fig. 2D) exhibited a gradual increase in activity starting around the middle of the fixation period until saccade onset. This pre-target activity was significantly stronger for the contralateral (right)-large block than for the ipsilateral (left)-large block (p = 4.4 × 10⁻⁶, Mann–Whitney U test). We also found that such reward direction-selective pre-target activity was prevalent in the dorsal, rather than the central and ventral, caudate. In both monkeys, approximately one-third (33% for monkey S, 30% for monkey F) of neurons in the dorsal caudate showed significant reward-direction-dependent modulation of their pre-target activity, whereas a smaller proportion of central (15% for monkey S, 0% for monkey F) and ventral (17% for monkey S, 0% for monkey F) caudate neurons showed an effect (p = 0.02, χ2 = 7.43, df = 2 for monkey S; p = 0.002, χ2 = 12.2, df = 2 for monkey F; Fig. 4B). The detailed distribution of neurons with a reward direction-selective signal is shown in Figures 2, C, Da, and E, and 3. If the analysis was restricted to the neurons that showed modulated activity before target onset, the proportion of reward-direction-selective neurons was still highest in the dorsal (41% for monkey S, 42% for monkey F) than the central (25% for monkey S, 0% for monkey F) and ventral (31% for monkey S, 0% for monkey F) caudate, although the difference did not reach significance for monkey S (p = 0.2, χ2 = 3.2, df = 2 for monkey S; p = 0.008, χ2 = 9.6, df = 2 for monkey F). Among the neurons that showed reward-direction selectivity, 23 of 43 dorsal (53%) and 8 of 12 central (67%) caudate neurons showed stronger pre-target activity when the contralateral side was more rewarded than when the ipsilateral side was more rewarded.
In Figure 4C–E (a comparison of the firing rate of each neuron between the block types) and in Figure 4F–H (the proportion of neurons with reward-direction selectivity), the time course of the reward-direction signal was analyzed. As a population, the reward-direction signal became evident after fixation onset and lasted until ∼400 ms after target onset.
In summary, the reward-direction signal was evident during the pre-target period, and it was more common in the dorsal than in the central or ventral caudate.
Reward-size-dependent modulation after target cue presentation and after reward delivery
Many caudate neurons also showed reward-size-dependent modulation of activity. For example, the neurons shown in Figure 5, A and B, which were in the ventral and central caudate, respectively, exhibited an increase in activity starting after saccade and continuing after reward delivery. This activity was significantly stronger for the large- than small-reward trials.
We found a significant difference in the distribution of neurons with stronger post-reward activity for large- than small-reward trials (measured from 400 to 800 ms after reward onset; Table 2, p = 2.8 × 10⁻⁵, χ2 = 20.9, df = 2 for monkey S; p = 3.1 × 10⁻⁵, χ2 = 20.8, df = 2 for monkey F). Neurons with a large-reward preference during the post-reward period were most common in the ventral, rather than the central or dorsal, caudate in both monkeys (Fig. 5D). The detailed distribution of neurons with a large-reward preference is shown in Figures 2, C, Db, and F, and 3. Neurons with a large-reward preference were sparse in the dorsal caudate, gradually increased in the central caudate, and were most prominent in the ventral caudate.
Table 2.
The number and percentage of neurons that showed a significant difference in activity depending on the reward size (two-way ANOVA, p < 0.01)
| Area | Early reward-delay | Late reward-delay | Post-reward 4–800 ms | Post-reward 8–1200 ms | Post-reward 12–1600 ms |
|---|---|---|---|---|---|
| Reward-value effect (large > small) | |||||
| Monkey S | |||||
| Dorsal | 9 (12.2) | 6 (8.1) | 2 (2.7) | 3 (4.1) | 3 (4.1) |
| Central | 24 (29.6) | 14 (17.3) | 21 (25.9) | 14 (17.3) | 14 (17.3) |
| Ventral | 1 (4.2) | 1 (4.2) | 8 (33.3) | 8 (33.3) | 5 (20.8) |
| Monkey F | |||||
| Dorsal | 15 (23.4) | 9 (14.1) | 5 (7.8) | 6 (9.4) | 7 (10.9) |
| Central | 7 (31.8) | 4 (18.2) | 6 (27.3) | 3 (13.6) | 2 (9.1) |
| Ventral | 6 (54.5) | 3 (27.3) | 7 (63.6) | 3 (27.3) | 3 (27.3) |
| Reward-value effect (small > large) | |||||
| Monkey S | |||||
| Dorsal | 18 (24.3) | 18 (24.3) | 8 (10.8) | 8 (10.8) | 7 (9.5) |
| Central | 10 (12.3) | 8 (9.9) | 5 (6.2) | 6 (7.4) | 5 (6.2) |
| Ventral | 0 (0.0) | 1 (4.2) | 1 (4.2) | 3 (12.5) | 3 (12.5) |
| Monkey F | |||||
| Dorsal | 13 (20.3) | 12 (18.8) | 22 (34.4) | 19 (29.7) | 15 (23.4) |
| Central | 4 (18.2) | 6 (27.3) | 7 (31.8) | 3 (13.6) | 2 (9.1) |
| Ventral | 2 (18.2) | 2 (18.2) | 2 (18.2) | 1 (9.1) | 1 (9.1) |
We also observed neurons that exhibited an opposite reward-size preference. For example, the dorsal caudate neuron shown in Figure 5C showed stronger activity after small- than large-reward delivery. As shown in Figure 5D, right (for their detailed distribution, see Figs. 2C,Dc,G, 3), neurons that showed a small-reward preference tended to be found more often in the dorsal than the central or ventral caudate, although their regional distribution was not significantly different (Table 2, p = 0.29, χ2 = 2.45, df = 2 for monkey S; p = 0.62, χ2 = 0.95, df = 2 for monkey F).
In Figure 5E–J, the time course of the reward-size signal was analyzed for all neurons. Overall activity modulation from the baseline (400 ms before fixation onset) for the large- and small-reward trials (Fig. 5E–G, left and middle columns) was evident in the earlier task periods (e.g., pre-target period) in the dorsal caudate. The overall activation peak shifted toward the later task periods (i.e., post-reward periods) as the recording sites became deeper. The comparison of activity between the large- and small-reward trials (Fig. 5E–G, right column) and the percentage of neurons with a significant reward-size effect (Fig. 5H–J) show that a large-reward preference was manifest in the ventral caudate after target onset and most notably after reward onset (Table 2). Conversely, there was a tendency that a small-reward preference was manifest in the dorsal caudate. In the central caudate, neurons with a large-reward preference were dominant in monkey S, whereas a nearly equal number of neurons with large- and small-reward preference were found in monkey F.
The large-reward preferring activity in the ventral caudate primarily reflected the size of the received rewards. In the current task, a reward was given at 1600 ms after the completion of saccades, which enabled us to dissociate between the signal associated with the expected reward size caused by an action (Knutson et al., 2001a; Haruno et al., 2004; O'Doherty et al., 2004; Samejima et al., 2005; Kim et al., 2009) and the size of the received reward. If the activity reflected the expected reward size, the activity in the previous block should be carried over to the first trial in the next block. Figure 5K–M shows the time course of the changes in the post-reward activity (z-score) of the dorsal caudate neurons with a significant small-reward preference, the central caudate neurons with a significant large-reward preference, and the ventral caudate neurons with a significant large-reward preference. On the very first trial of the large- and small-reward blocks, the post-reward activity reflected the value of the received reward, not of the expected reward for all parts of the caudate. Thus, the value of the received reward, rather than the value of the expected reward, was the main determinant of post-reward activity. Note that, however, the post-reward activity did not simply encode the received reward size per se, regardless of action because neurons with large-reward preferring post-reward activity rarely responded to a liquid reward given outside of the task (data not shown) (Rolls et al., 1983; Apicella et al., 1991; Hikosaka et al., 2000). Thus, the post-reward activity encoded the size of the received reward rather than the size of the expected reward in the context of this instrumental task (Tricomi et al., 2004).
We also analyzed whether post-reward activity was used to modulate neuronal activity and behavior in the following trial. A small number of caudate neurons showed a significant correlation between their post-reward activity and the baseline activity in the following trial (400 ms before FP onset) for seven (5.1%) dorsal, three (2.9%) central, and one (2.9%) ventral caudate neurons and between their post-reward activity and pre-target activity in the following trial for two (1.5%) dorsal, five (4.9%) central, and two (5.7%) ventral caudate neurons (Spearman's rank correlation, p < 0.01). Correlations between post-reward activity and the latency to fixate on the FP and the saccade latency to the target in the following trial were also observed for only a small number of neurons (fixation: two dorsal, five central, and zero ventral; target: one dorsal, four central, and zero ventral caudate neurons). Altogether, the correlations between post-reward activity and activity and behavior in the next trial were weak for all subdivisions.
In summary, a trial-based reward-size signal was prevalent during the post-reward period, and neurons with a large-reward preference were more common in the central and ventral caudate. Conversely, neurons with a small-reward preference tended to be common in the dorsal caudate, although the difference was not significant.
Effect of reward history on behavior and caudate activity
We next analyzed whether the monkeys' behavior and caudate activity were also modulated by the memory of past trials or “reward history,” using a particular feature of the current task. In the task, the large- and small-reward trials occurred equally often within a block on average; however, because the number of trials within a block was fixed, the probability of particular reward trials was not fixed at 50% from trial to trial. If the previous trial was a small-reward trial, the probability that the next trial was a large-reward trial was higher; if the previous trial was a large-reward trial, the probability that the next trial was also a large-reward trial was lower (Nakahara et al., 2004; Bromberg-Martin et al., 2010).
We analyzed the effect of reward history on a behavioral measure and neuronal activity in two ways. First, we examined the effect of the immediate reward history by comparing between trials that were preceded by a large or small-reward trial. We also examined the influence of the longer-term reward history by comparing between trials that were preceded by a different number of consecutive small- or large-reward trials (Fig. 6B, inset). The monkeys' behavior and neural activity were compared between trials that were preceded by a long sequence (i.e., three or four trials) or a short sequence (only one trial) of large-/small-reward trials.
Figure 6.
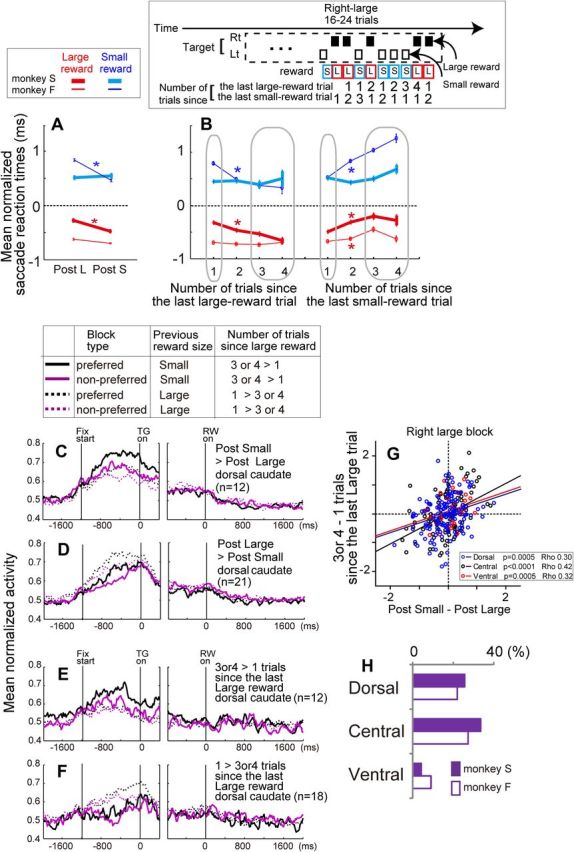
Reward history effect. A, Effect of previous reward size on the saccadic reaction times. Reaction times are normalized by the z-score, and a comparison was performed between the reaction times for current large-reward trials (red lines) preceded by large rewards (“Post L”) and small rewards (“Post S”) or reaction times for current small-reward trials (blue lines) preceded by large and small rewards. Error bars indicate SEM. *p < 0.01. B, Effect of the number of trials since the last large-reward trial (left) and the number of trials since the last small-reward trial (right) on the saccadic reaction times. An example of the measure is shown above the panel. Note that the probability that the next trial would be a large (small) reward was higher if the number of trials since the last large (small)-reward trial was larger. Statistical comparison was performed between one versus three or four trials. *p < 0.01. C, Population activity for two different reward-direction conditions with higher (preferred, black) or lower (nonpreferred, purple) block-dependent pre-target activity and with a different reward history: previous large (dashed lines) and small (solid lines). The data are from dorsal caudate neurons that showed significantly stronger pre-target activity for trials preceded by small-reward trials (p < 0.05/2, Bonferroni's correction for two reward-direction conditions). D, Same as C, except that the data are from dorsal caudate neurons with significantly stronger pre-target activity for trials preceded by large-reward trials. E, F, Same as C and D, except that the data are from dorsal caudate neurons with significantly stronger pre-target activity if the number of trials since the last large reward was large (3 or 4) or small (1), respectively. G, The difference in normalized pre-target activity between three or four versus one trial since the last large-reward trial (y-axis) was positively correlated with the difference in normalized pre-target activity between trials preceded by small versus large reward trials (x-axis). H, Percentage of neurons that showed a significant difference in pre-target activity depending on the reward size of the previous trial. Neurons that showed stronger activity when preceded by both small- and large-reward trials (for at least 1 of the 2 reward blocks) are included. Lt, Left; Rt, right; L, large; S, small.
We first analyzed the effect of a single previous reward outcome on the saccade onset latency, i.e., the time from target onset to saccade onset. Consistent with previous studies (Takikawa et al., 2002b; Nakahara et al., 2004; Bromberg-Martin et al., 2010), the immediate reward history significantly modulated the monkeys' behavior, although differently depending on which monkey was tested. If preceded by a small-reward trial, monkey S showed significantly shorter reaction times for large-reward trials, whereas monkey F showed significantly shorter reaction times for small-reward trials (Mann–Whitney U test, p < 0.01; Fig. 6A). The measure of long-term reward history (i.e., the number of trials since the last large- or small-reward trial) produced similar results. As shown in Figure 6B (left), if the number of trials since the last large-reward trial was large, the saccadic reaction times in large-reward trials for monkey S and small-reward trials for monkey F became shorter (Mann–Whitney U test, p < 0.01, comparison between “one” vs three or four” trials since the last large reward). Likewise, as shown in Figure 6B (right), if the number of trials since the last small-reward trial was large, the saccadic reaction times in large-reward trials for both monkeys and small-reward trials for monkey F became longer. Altogether, the saccadic reaction times were modulated by the immediate and long-term reward history in both monkeys.
Our analyses further revealed that the activity of some caudate neurons was modulated by the immediate (post small vs large) and long-term (number of trials since the last large reward, three or four vs one) reward history. The population histograms in Figure 6, C and D, illustrate the pre-target activity of dorsal caudate neurons, which was significantly stronger if the previous reward was small or large, respectively. Caudate activity can be influenced by outcomes located farther back in the past. The population histograms in Figure 6, E and F, illustrate the pre-target activity of dorsal caudate neurons, which was significantly stronger if the number of trials since the last large reward was large or small, respectively. Note that the effect of the immediate reward history (previous small vs large) and long-term reward history (number of trials since the last large reward, three or four vs one) was positively correlated (Spearman's rank correlation, p < 0.001 for all subdivisions; Fig. 6G), indicating that both immediate and long-term history-dependent modulation of caudate activity was based on a common history-dependent reward expectation. Additional analyses revealed that the changes in pre-target activity depending on both immediate and long-term reward history were in the same direction across different reward blocks. For example, if the activity was stronger after small rewards than after large rewards for the right-large block, it was also true for the left-large block. There was a significant positive correlation between the strength of reward history effects for the right- and left-large blocks of both immediate (activity for post small − post large) and long-term (activity for three or four − one trials since the last large reward) for the dorsal and central, but not for the ventral, caudate (Spearman's rank correlation, p < 0.05).
Figure 6H shows the percentage of neurons that had significantly different pre-target activity depending on the previous reward size (Mann–Whitney U test, p < 0.05/2, Bonferroni's correction for two reward-direction conditions); some showed stronger activity if the previous reward was small, and others showed stronger activity if the previous reward was large (Table 3). The detailed distribution of neurons with reward-history modulation depending on the previous reward size is shown in Figures 2H and 3. Across the caudate nucleus, regional distribution of neurons whose activity was modulated depending on the previous reward size was significantly different in monkey S (p = 0.02, χ2 = 8.2, df = 2) but not in monkey F (p = 0.5, χ2 = 1.4, df = 2); however, in both monkeys, there was a tendency that more neurons in the dorsal and central, rather than the ventral, caudate showed the effect. In a small number of neurons (Table 3), activity during the early-reward delay and post-reward periods was modulated by reward history, although the prevalence of such activity was too low for the identification of any distribution patterns.
Table 3.
The number and percentage of neurons that showed a significant difference in activity depending on the reward size of the previous trial (Mann–Whitney U test, for pre-target period, p < 0.05/2, Bonferroni's correction for two reward-direction conditions; for early-reward delay or post-reward periods, p < 0.05/4, Bonferroni's correction for the four trial types)
| Area | Reward-history effect |
|||||
|---|---|---|---|---|---|---|
| Previous large > previous small |
Previous small > previous large |
|||||
| Pre-target | Early reward-delay | Post-reward 4–800 ms | Pre-target | Early reward-delay | Post-reward 4–800 ms | |
| Monkey S | ||||||
| Dorsal | 4 (5.4) | 6 (8.1) | 1 (1.4) | 15 (20.3) | 5 (6.8) | 0 (0.0) |
| Central | 11 (13.6) | 0 (0.0) | 0 (0.0) | 16 (19.8) | 3 (3.7) | 1 (1.2) |
| Ventral | 0 (0.0) | 0 (0.0) | 0 (0.0) | 1 (4.2) | 0 (0.0) | 0 (0.0) |
| Monkey F | ||||||
| Dorsal | 8 (12.5) | 1 (1.6) | 1 (1.6) | 6 (9.4) | 2 (3.1) | 2 (3.1) |
| Central | 4 (18.2) | 2 (9.1) | 1 (4.5) | 2(9.1) | 1 (4.5) | 0 (0.0) |
| Ventral | 1 (9.1) | 0 (0.0) | 1 (9.1) | 0 (0.0) | 0 (0.0) | 1 (9.1) |
Target-direction-dependent modulation
Some caudate neurons also showed target-direction-selective modulation. For example, the left dorsal caudate neuron shown in Figure 7A exhibited significantly stronger activity after the onset of the target contralateral (right) to the recording site and during the reward-delay period. In both monkeys, the target-direction signal was found most often during the early reward delay period (800 ms after target onset), which included the post-target and saccade-related periods (Table 4). This was confirmed by analyses of the time course of the target-direction signal (Fig. 7C–E, a comparison of the firing rate of each neuron between the target directions) and the proportion of neurons with target-direction selectivity (Fig. 7F–H).
Table 4.
The number and percentage of neurons that showed a significant difference in activity depending on the target direction (two-way ANOVA, p < 0.01)
| Area | Early reward-delay | Late reward-delay | Post-reward 4–800 ms | Post-reward 8–1200 ms | Post-reward 12–1600 ms |
|---|---|---|---|---|---|
| Target direction effect for contralateral > ipsilateral | |||||
| Monkey S | |||||
| Dorsal | 5 (6.8) | 1 (1.4) | 0 (0.0) | 1 (1.4) | 1 (1.4) |
| Central | 2 (2.5) | 3 (3.7) | 2 (2.5) | 1 (1.2) | 1 (1.2) |
| Ventral | 0 (0.0) | 2 (8.3) | 0 (0.0) | 0 (0.0) | 0 (0.0) |
| Monkey F | |||||
| Dorsal | 8 (12.5) | 4 (6.3) | 1 (1.6) | 1 (1.6) | 0 (0.0) |
| Central | 2 (9.1) | 1 (4.5) | 1 (4.5) | 0 (0.0) | 0 (0.0) |
| Ventral | 0 (0.0) | 0 (0.0) | 0 (0.0) | 0 (0.0) | 0 (0.0) |
| Target direction effect for ipsilateral > contralateral | |||||
| Monkey S | |||||
| Dorsal | 6 (8.1) | 4 (6.3) | 5 (6.8) | 0 (0.0) | 0 (0.0) |
| Central | 4 (4.9) | 4 (4.9) | 4 (4.9) | 0 (0.0) | 1 (1.2) |
| Ventral | 3 (12.5) | 0 (0.0) | 0 (0.0) | 1 (4.2) | 0 (0.0) |
| Monkey F | |||||
| Dorsal | 8 (12.5) | 8 (12.5) | 1 (1.6) | 0 (0.0) | 1 (1.6) |
| Central | 2 (9.1) | 1 (4.5) | 3 (13.6) | 0 (0.0) | 0 (0.0) |
| Ventral | 0 (0.0) | 0 (0.0) | 0 (0.0) | 0 (0.0) | 0 (0.0) |
The percentage of dorsal caudate neurons that showed target-direction selectivity, including both contralateral and ipsilateral preference during the early reward delay period, was 15% (monkey S) and 25% (monkey F), which is consistent with previous reports (Ding and Hikosaka, 2006; Lau and Glimcher, 2007). There was also a tendency that more dorsal and central caudate neurons showed target-direction selectivity, which was especially true for neurons with contralateral preference, although the difference was not significant (p = 0.2, df = 2, χ2 = 3.0 for monkey S; p = 0.4, df = 2, χ2 = 1.6 for monkey F, for contralateral-preferring neurons; Figs. 3, 7B; Table 4). Some neurons also showed an interaction effect between target direction and expected reward size (Table 5); however, the regional difference in the distribution of neurons with a significant interaction effect was not significant.
Table 5.
The number and percentage of neurons that showed a significant interaction effect (reward-size and target direction, two-way ANOVA, p < 0.01)
| Interaction effect (reward-size and target-direction) | |||||
|---|---|---|---|---|---|
| Area | Early reward-delay | Late reward-delay | Post-reward 4–800 ms | Post-reward 8–1200 ms | Post-reward 12–1600 ms |
| Monkey S | |||||
| Dorsal | 5 (6.8) | 6 (8.1) | 1 (1.4) | 1 (1.4) | 2 (2.7) |
| Central | 7 (8.6) | 5 (6.2) | 3 (3.7) | 1 (1.2) | 0 (0.0) |
| Ventral | 3 (12.5) | 0 (0.0) | 0 (0.0) | 3 (12.5) | 1 (4.2) |
| Monkey F | |||||
| Dorsal | 7 (10.9) | 5 (7.8) | 3 (4.7) | 3 (4.7) | 4 (6.3) |
| Central | 1 (4.5) | 0 (0.0) | 2 (9.1) | 0 (0.0) | 1 (4.5) |
| Ventral | 1 (9.1) | 0 (0.0) | 1 (9.1) | 0 (0.0) | 0 (0.0) |
Degree of convergence of the different task signals
As presented in the previous sections, caudate neurons carried a variety of reward-related information, i.e., reward direction, reward size, reward history, and target direction. We further analyzed whether single neurons carried multiple signals. The Venn diagrams of Figure 8A show the number and proportion of neurons that showed reward-size (including both large- and small-reward preference), reward-direction, or reward-history (during the pre-target, early reward delay, or post-reward periods) effects. In all caudate areas, these three reward signals were significantly exclusive (Fisher's exact test, p < 0.05), except for the relationship between the reward-direction and reward-history (all caudate areas) or reward-size and reward-history (ventral caudate) effects. We further examined whether the strength of the reward-direction and reward-size effects were correlated (Fig. 8B). In the dorsal caudate, some neurons were distributed in the top left quadrant of the graph, indicating that these neurons showed small-reward preferring post-reward activity as well as contralateral-preferring reward direction-selective pre-target activity. However, in the central and ventral caudate, there was no systematic correlation between the two different reward signals.
In the dorsal caudate, some neurons showed either target-direction and/or reward-size effects in their early reward-delay activity. These effects were not correlated (Fig. 8D), although they were not significantly exclusive (Fig. 8C, Fisher's exact test, p = 0.28).
In summary, different reward signals were primarily encoded by separate populations of neurons, except for some neurons that showed reward-history and reward-direction effects.
Electrophysiological characteristics of the neurons and reward coding
Previously, electrophysiological properties, e.g., spike width and baseline firing rate, have been associated with different cell types in the striatum (Berke et al., 2004; Gage et al., 2010); however, their distribution did not show clear borders within the striatum. We now tested whether the different kinds of reward signals were encoded by specific groups of neurons with particular electrophysiological characteristics. Spike waveforms were recorded for most of the analyzed neurons (130 of 138 dorsal, 94 of 103 central, and 32 of 35 ventral caudate neurons). Spike width was measured as the duration between the initial trough and the following peak of the wave. The baseline firing rate was computed as the mean firing rate during the baseline period (400 ms before fixation onset) of the very first trial of the recording session because, as soon as the task session starts, the activity during the intertrial interval, including the baseline period, may be modulated by any kind of task context.
Figure 9A shows the distribution of the spike width and baseline firing rate, depending on the recording depth. We found that the spike width was significantly different (Kruskal–Wallis test, p = 0.025) depending on the recording site; the spike width of neurons in the ventral caudate (median, 0.55; mean, 0.57 ± 0.13 ms) was significantly shorter than in the central (median, 0.67; mean, 0.64 ± 0.13 ms) and dorsal caudate (median, 0.68; mean, 0.63 ± 0.14 ms) (p < 0.01). This appeared to contradict the findings of Cai et al. (2011) that indicated a longer spike width in the ventral striatum. However, neurons with a very short spike width (<0.3 ms; dots in the left top quadrant of the figure) were distributed more often in the dorsal striatum, which was consistent with the same report.
Figure 9.
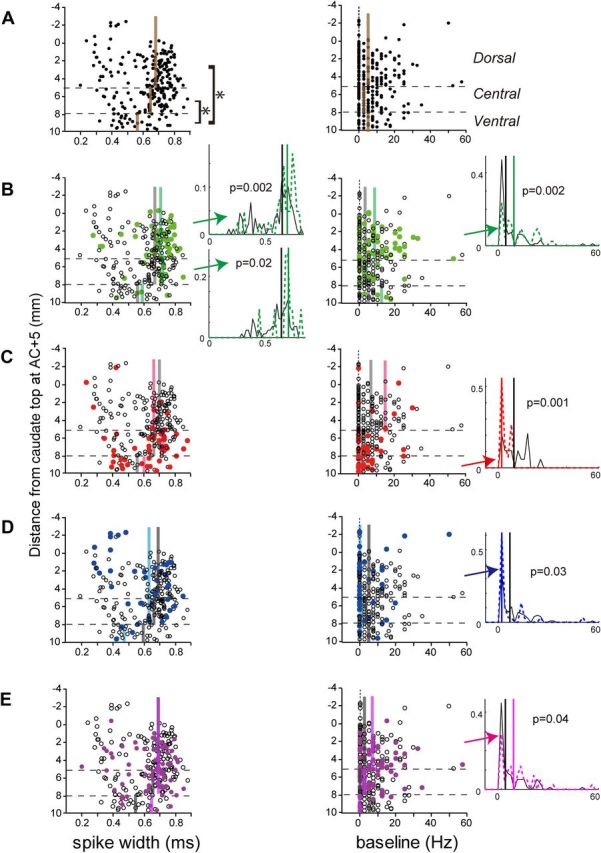
Effects of spike width and baseline firing rate on reward signals. In each panel, each dot corresponds to one neuron; the x-axis indicates spike width (left) and baseline firing rate (right), and the y-axis indicates the depth of the recording sites. The horizontal broken lines indicate the border between the subdivisions of the caudate. The vertical colored lines indicate the median of the spike width or baseline firing rate, with or without the effect. Histograms are shown for the subdivisions with significant differences (Mann–Whitney U test, p < 0.05). The vertical lines indicate the median value for neurons with and without the effect. A, Spike width and baseline firing rate of each neuron at different depths. The brown lines indicate the median value for each subdivision of the caudate. B, Reward-direction effect. The green dots and black open circles indicate neurons with and without a reward-direction effect, respectively. The green and black lines indicate the median value for each subdivision. C, Reward-size effect with large-reward preference. D, Reward-size effect with small-reward preference. E, Reward-history effect during either the pre-target, early reward-delay, or post-reward periods.
The baseline firing rate was higher than that previously reported for putative projection neurons (Schultz et al., 1992; Hassani et al., 2001; Cromwell and Schultz, 2003) but consistent with the report of Cai et al. (2011). The higher vigilance of the monkeys during the experimental sessions may be one of the possible causes of their higher baseline activity. There was no significant difference in the baseline firing rate between the caudate subdivisions (Kruskal–Wallis test, p = 0.21; dorsal caudate: median, 5.0 and mean, 7.5 ± 9.8 Hz; central caudate: median, 2.5 and mean, 5.3 ± 8.5 ms; ventral caudate: median, 5.0 and mean, 6.2 ± 6.7 ms).
We further observed that neurons carrying different reward signals had specific electrophysiological properties. First, neurons with a significant reward-direction effect showed a longer spike width and higher baseline firing rate than neurons without this effect (Fig. 9B). This difference was significant for the dorsal (spike width, p = 0.002 and baseline, p = 0.002) and central caudate (spike width, p = 0.02), but the trend held for all caudate regions. Neurons with a reward-history effect also showed significantly higher baseline activity in the dorsal caudate (Fig. 9E, p = 0.04).
Neurons with a significant reward-size effect showed different trends (Fig. 9C,D). Spike width did not show significant changes depending on the reward-size effect. Regarding the baseline firing rate, however, in the ventral caudate, it was significantly lower for neurons with a large-reward preference than those without this preference (p = 0.001); in the dorsal caudate, it was also significantly lower for neurons with a small-reward preference than those without this preference (p = 0.03).
Thus, neurons with a longer spike width and higher baseline firing rates tended to be sensitive to reward direction, particularly in the dorsal caudate. Conversely, neurons with lower baseline firing rates were sensitive to reward size in the dorsal (small-reward preference) and ventral (large-reward preference) caudate.
Discussion
By recording neuronal activity throughout the caudate, we found a clear functional gradient of reward signals with a different nature and timescale, and during different task epochs in the dorsolateral-ventromedial axis (Voorn et al., 2004). Specifically, a block-wise reward-direction signal was encoded before target onset that was most prevalent in the dorsal, rather than the central and ventral, caudate. Conversely, a trial-based positive reward-size signal was predominantly encoded after reward delivery. The signal was prevalent in the central and, most profoundly, ventral caudate. There were also neurons that carried a negative reward-size signal, neurons whose activity was modulated by reward history (Yamada et al., 2007; Goldstein et al., 2012) or target direction; all of them tended to be distributed in the dorsal and central caudate, rather than in the ventral caudate. Finally, such multiple reward information was represented largely by independent population of neurons, indicating functional segregation at the single neuron level (Schmitzer-Torbert and Redish, 2004; Lau and Glimcher, 2007).
Cytoarchitectonic and histochemical markers do not indicate an obvious boundary between the striatal subdivisions; however, mapping of different reward signals (Fig. 3) suggests functional segregation within the caudate. Notably, our data showed that the distribution of different reward signals accorded well with the subdivisions defined by cortical inputs in monkeys (Kelley et al., 1982; Selemon and Goldman-Rakic, 1985; Groenewegen et al., 1987; Heimer et al., 1987; Alexander and Crutcher, 1990; Saint-Cyr et al., 1990; Yeterian and Pandya, 1991; Parent and Hazrati, 1994; Eblen and Graybiel, 1995; Haber, 2003). The dorsolateral caudate receives input from sensory motor areas, the central caudate receives input from the anterior cingulate and dorsolateral prefrontal cortex, and the ventral caudate receives input from medial and orbital frontal cortical areas.
In addition to these anatomical connections, the intrinsic characteristics of the different parts of the caudate may underlie the functional regional differences. The observed functional segregation in the caudate accorded well with the tripartite subdivision defined by calbindin immunoreactivity in humans (Karachi et al., 2002). The time course of changes in dopamine concentration in the ventral striatum is slower than that in the dorsal striatum (Wickens et al., 2007); acetylcholine modulation of dopamine transmission occurs via different nicotinic and muscarinic receptors between the dorsal and ventral striatum (Threlfell and Cragg, 2011). The present data showed that the electrophysiological properties were also different depending on the caudate subdivisions and different aspects of reward information. Further studies, such as pharmacological manipulation combined with electrophysiological recordings, for the different tasks, are required to elucidate the relationship between the electrophysiological characteristics and the intrinsic properties of neurons to support specific function of each caudate subdivision.
Dorsal caudate is involved in creating block-wise spatial bias related to action
Activity before cue presentation was reportedly abundant in the dorsal, rather than the ventral striatum (Apicella et al., 1992; Schultz et al., 1992). Using the saccade task, Hikosaka et al. reported reward direction-selective pre-target activity in the caudate (Lauwereyns et al., 2002; Takikawa et al., 2002a; Ding and Hikosaka, 2006). However, the distribution of these neurons within the caudate has never been thoroughly examined. Here, we observed this reward direction-selective pre-target activity in the dorsolateral, but not the central or ventral, caudate.
The pre-target caudate activity could make the superior colliculus, located downstream of the cortico-basal ganglia eye movement system, more excitable (Sato and Hikosaka, 2002; Ikeda and Hikosaka, 2003). Then, the action process will be closer to the “threshold,” leading to the quicker generation of saccades (Hikosaka et al., 2006) (Fig. 1B). The pre-target activity may be derived from the prefrontal cortical areas, including the frontal eye field, which also showed similar reward direction-selective pre-target activity (Ding and Hikosaka, 2006). The dorsal caudate also receives dopaminergic projections from the ventral tier of the substantia nigra pars compacta (SNc) (Hedreen and DeLong, 1991; Lynd-Balta and Haber, 1994; Haber et al., 2000), which tend to respond to both appetitive and aversive stimuli, or “salient stimuli” (Ikemoto and Panksepp, 1999; Horvitz, 2000; White and Salinas, 2003; Ungless, 2004; Matsumoto and Hikosaka, 2009). Thus, the dorsal caudate is involved in creating reward position-selective activity, receiving and integrating similar activity from the prefrontal cortex and the saliency signal from the dopaminergic system.
Reward information with a block-wise, longer timescale should arise as a result of learning. Studies in rodents showed that lesions of the dorsolateral striatum impair the acquisition and execution of motor sequences and habitual responses in instrumental tasks (Kimchi et al., 2009a; White, 2009; Yin et al., 2009). Such relatively automatic and often contextually bound (Balleine and O'Doherty, 2010) behavioral control may be a characteristic of information processing in the dorsolateral striatum, which is expressed as the reward term in the current task. Note, however, that the current data do not reject the possibility that the dorsolateral caudate is involved in flexible goal-directed behavioral control, such as stimulus–action–reward association or explicit planning as suggested in other studies (Wunderlich et al., 2012). The degree of involvement in habitual or goal-directed behavioral control by the dorsal caudate may vary depending on the task context and difficulty.
Ventral and central caudate are involved in trial-based reward size coding
Many ventral and some central, but not dorsal, caudate neurons are involved in encoding trial-based positive reward-size information around the receipt of the reward. Previous studies also stressed the importance of the ventral striatum, including the ventral caudate, for the expectation or receipt of primary and secondary rewards (e.g., liquid rewards and money) (Schultz et al., 1992; Delgado et al., 2000; Hassani et al., 2001; Knutson et al., 2001a; Cromwell and Schultz, 2003; O'Doherty et al., 2004; Yacubian et al., 2006; Delgado et al., 2008a; Tremblay et al., 2009) and the consumption of addictive drugs in humans (Boileau et al., 2003; Cox et al., 2009). In rodents, pharmacological manipulation of the ventral striatum, especially the nucleus accumbens, disrupted changes in response speed depending on the upcoming reward magnitude (Everitt et al., 1991; Parkinson et al., 1999; Cardinal et al., 2002; Nicola, 2007), indicating that the ventral stratum is important for reward evaluation, which is used to control actions.
The positive reward-size signal observed in the ventral and central caudate may be derived from the medial and orbital frontal cortical areas (Ferry et al., 2000; Haber et al., 2006) or subcortical areas, including the amygdala (Russchen et al., 1985; Friedman et al., 2002; Fudge et al., 2002), which also encodes reward value (Belova et al., 2007). The ventral caudate also receives dopaminergic projections that encode the positive and negative values of conditioned and unconditioned stimuli (Matsumoto and Hikosaka, 2009). However, it is unlikely that post-reward responses are derived directly from the dopamine signal because the dopaminergic neurons in the current task typically respond to target onset, not to reward delivery (Kawagoe et al., 2004).
Additional anatomical and physiological studies are required to delineate the exact border between the central and ventral caudate to relate the current study to previous studies in rodents. The ventral caudate in the present study may be related to the nucleus accumbens and surrounding areas studied in rodents. Conversely, the central caudate in the present study may be related, at least in part, to the dorsomedial striatum in rodents, which has been implicated in flexible goal-directed behavioral control. The current study did not address whether the central caudate was related to such a behavioral control, because the task used did not require trial-and-error decision making.
We also observed that some caudate neurons responded more strongly after small rewards than large rewards. The role of the striatum in aversive information processing has been documented in the ventral and dorsal striatum of rodents (Abercrombie et al., 1989; Horvitz, 2000; White and Salinas, 2003; Salamone, 2007). Additional studies in rodents indicate a rostrocaudal segregation of appetitive versus aversive information within the ventral striatum (Reynolds and Berridge, 2001). Human fMRI studies also identified aversive information-related activation but mainly in the ventral striatum (Ploghaus et al., 2000; Jensen et al., 2003; Seymour et al., 2005; Balleine et al., 2007; Tom et al., 2007; Delgado et al., 2008b) or dorsal putamen (Seymour et al., 2007). Unlike these human studies, we showed that neurons with a small-reward preference were rather abundant, although not significantly so, in the dorsal caudate. Such a discrepancy could be attributable to differences in the types of negative rewards examined in the current study; a negative reward means a small or no reward, whereas many studies used aversive outcomes, e.g., electric shock or monetary loss.
Dorsal and central caudate carry history-dependent reward information
We found that caudate neurons carried reward history signals, which were useful for improving the reward expectation in the upcoming trials. Note that this reward history effect was contrary to what would have been expected under conventional reinforcement learning in which the reward expectation signals evoked by a cue would increase (or decrease) in the next trial by the presence (or absence) of a reward in the previous trial. In this case, the reinforcement effect is history dependent, being a linear weighted average of the past outcomes (Bayer and Glimcher, 2005; Samejima et al., 2005; Kim et al., 2009). In our study, in contrast, the reward expectation should decrease or increase with the presence or absence of a reward in the previous trial, respectively, if the reward history is additionally taken into account for the expectation at the time of the target cue (Nakahara et al., 2004; Bromberg-Martin et al., 2010). Indeed, we found such history-dependent modulation in the activity of the caudate, in the immediate and long term, together with modulation of the saccade reaction times. Thus, caudate activity may signal the reward expectation, using higher-level information, such as task structure, in addition to reinforcement based on the reward history, as found in earlier studies. This suggestion may also extend to the basal ganglia circuit, given the previous findings of similar modulation of dopamine and lateral habenula neural activity (Nakahara et al., 2004; Bromberg-Martin et al., 2010).
In this study, the reward history effect was observed most often during the pre-target period. This may be attributable to the fact that the effect is critical for generating saccadic eye movements based on the reward direction, which was known during the pre-target period, rather than the trial-by-trial reward information, which was known after target onset. Neurons with the effect were found more often in the dorsal and central, rather than the ventral, caudate, indicating a possible source in the sensory motor, dorsolateral, and anterior cingulate cortical areas. Additional studies should reveal where and how the variety of reward history information is generated and used in the basal ganglia circuit for learning and decision making (Yamada et al., 2007; Histed et al., 2009; Noonan et al., 2010; Walton et al., 2010; Bernacchia et al., 2011; Enomoto et al., 2011; Hayden et al., 2011; Kolling et al., 2012).
Functional segregation and integration of the different reward signals in the caudate
One possible mechanism by which these segregated functional loops involving different parts of the caudate operate in a coordinated manner is that the ventral caudate influences the dorsal caudate through a loose topographic “spiral loop” (Haber and Knutson, 2010) in which partly overlapping circuits constitute convergent and divergent connections between the striatum and midbrain dopaminergic system. The reward-size information from the just-performed trial may be one of the factors used to compute the reward prediction error signal in dopaminergic neurons, which in turn will be transmitted widely in the striatum or frontal cortical areas. Another possible interaction from the ventral to dorsal caudate is via the striosome (or patch), which receives inputs from the limbic areas, e.g., amygdala and parahippocampal formation, and projects heavily to the SNc (Russchen et al., 1985; Gerfen et al., 1987; Ragsdale and Graybiel, 1988). The SNc would, in turn, send reward prediction error signals to the striatum (McClure et al., 2003). In addition to information transfer between the striatal subdivisions, coordination between different functional reward loops may also be achieved by their mutual competition at the cortical level (Thorn et al., 2010) or downstream targets (Hikida et al., 2010).
Footnotes
K.N. was supported by Precursory Research for Embryonic Science and Technology, the Takeda Foundation, the Nakayama Foundation, a Grant-in-Aid for Scientific Research B, and a Grant-in-Aid for Scientific Research on Priority Areas. H.N. was supported by a Grant-in-Aid for Scientific Research B. G.S.S. was supported by a RIKEN special postdoctoral fellowship. We thank Drs. Ben Seymour, Long Ding, Yasushi Kobayashi, and Masaki Isoda for helpful comments, Yasuhiro Tokimoto for obtaining magnetic resonance images, Kazuko Nakao for training the animals, Atsushi Noritake for helping with data analysis, Mayu Habiro and Kiyomi Shiomi for technical assistance, and Yasushi Kobayashi for his help with the experimental setup.
The authors declare no competing financial interests.
References
- Abercrombie ED, Keefe KA, DiFrischia DS, Zigmond MJ. Differential effect of stress on in vivo dopamine release in striatum, nucleus accumbens, and medial frontal cortex. J Neurochem. 1989;52:1655–1658. doi: 10.1111/j.1471-4159.1989.tb09224.x. [DOI] [PubMed] [Google Scholar]
- Alexander GE, Crutcher MD. Neural representations of the target (goal) of visually guided arm movements in three motor areas of the monkey. J Neurophysiol. 1990;64:164–178. doi: 10.1152/jn.1990.64.1.164. [DOI] [PubMed] [Google Scholar]
- Apicella P, Ljungberg T, Scarnati E, Schultz W. Responses to reward in monkey dorsal and ventral striatum. Exp Brain Res. 1991;85:491–500. doi: 10.1007/BF00231732. [DOI] [PubMed] [Google Scholar]
- Apicella P, Scarnati E, Ljungberg T, Schultz W. Neuronal activity in monkey striatum related to the expectation of predictable environmental events. J Neurophysiol. 1992;68:945–960. doi: 10.1152/jn.1992.68.3.945. [DOI] [PubMed] [Google Scholar]
- Atallah HE, Lopez-Paniagua D, Rudy JW, O'Reilly RC. Separate neural substrates for skill learning and performance in the ventral and dorsal striatum. Nat Neurosci. 2007;10:126–131. doi: 10.1038/nn1817. [DOI] [PubMed] [Google Scholar]
- Balleine B, Killcross S. Effects of ibotenic acid lesions of the nucleus accumbens on instrumental action. Behav Brain Res. 1994;65:181–193. doi: 10.1016/0166-4328(94)90104-x. [DOI] [PubMed] [Google Scholar]
- Balleine BW, O'Doherty JP. Human and rodent homologies in action control: corticostriatal determinants of goal-directed and habitual action. Neuropsychopharmacology. 2010;35:48–69. doi: 10.1038/npp.2009.131. [DOI] [PMC free article] [PubMed] [Google Scholar]
- Balleine BW, Delgado MR, Hikosaka O. The role of the dorsal striatum in reward and decision-making. J Neurosci. 2007;27:8161–8165. doi: 10.1523/JNEUROSCI.1554-07.2007. [DOI] [PMC free article] [PubMed] [Google Scholar]
- Bayer HM, Glimcher PW. Midbrain dopamine neurons encode a quantitative reward prediction error signal. Neuron. 2005;47:129–141. doi: 10.1016/j.neuron.2005.05.020. [DOI] [PMC free article] [PubMed] [Google Scholar]
- Belova MA, Paton JJ, Morrison SE, Salzman CD. Expectation modulates neural responses to pleasant and aversive stimuli in primate amygdala. Neuron. 2007;55:970–984. doi: 10.1016/j.neuron.2007.08.004. [DOI] [PMC free article] [PubMed] [Google Scholar]
- Berke JD, Okatan M, Skurski J, Eichenbaum HB. Oscillatory entrainment of striatal neurons in freely moving rats. Neuron. 2004;43:883–896. doi: 10.1016/j.neuron.2004.08.035. [DOI] [PubMed] [Google Scholar]
- Bernacchia A, Seo H, Lee D, Wang XJ. A reservoir of time constants for memory traces in cortical neurons. Nat Neurosci. 2011;14:366–372. doi: 10.1038/nn.2752. [DOI] [PMC free article] [PubMed] [Google Scholar]
- Boileau I, Assaad JM, Pihl RO, Benkelfat C, Leyton M, Diksic M, Tremblay RE, Dagher A. Alcohol promotes dopamine release in the human nucleus accumbens. Synapse. 2003;49:226–231. doi: 10.1002/syn.10226. [DOI] [PubMed] [Google Scholar]
- Bowman EM, Aigner TG, Richmond BJ. Neural signals in the monkey ventral striatum related to motivation for juice and cocaine rewards. J Neurophysiol. 1996;75:1061–1073. doi: 10.1152/jn.1996.75.3.1061. [DOI] [PubMed] [Google Scholar]
- Bromberg-Martin ES, Matsumoto M, Nakahara H, Hikosaka O. Multiple timescales of memory in lateral habenula and dopamine neurons. Neuron. 2010;67:499–510. doi: 10.1016/j.neuron.2010.06.031. [DOI] [PMC free article] [PubMed] [Google Scholar]
- Cai X, Kim S, Lee D. Heterogeneous coding of temporally discounted values in the dorsal and ventral striatum during intertemporal choice. Neuron. 2011;69:170–182. doi: 10.1016/j.neuron.2010.11.041. [DOI] [PMC free article] [PubMed] [Google Scholar]
- Cardinal RN, Parkinson JA, Hall J, Everitt BJ. Emotion and motivation: the role of the amygdala, ventral striatum, and prefrontal cortex. Neurosci Biobehav Rev. 2002;26:321–352. doi: 10.1016/s0149-7634(02)00007-6. [DOI] [PubMed] [Google Scholar]
- Cox SM, Benkelfat C, Dagher A, Delaney JS, Durand F, McKenzie SA, Kolivakis T, Casey KF, Leyton M. Striatal dopamine responses to intranasal cocaine self-administration in humans. Biol Psychiatry. 2009;65:846–850. doi: 10.1016/j.biopsych.2009.01.021. [DOI] [PubMed] [Google Scholar]
- Cromwell HC, Schultz W. Effects of expectations for different reward magnitudes on neuronal activity in primate striatum. J Neurophysiol. 2003;89:2823–2838. doi: 10.1152/jn.01014.2002. [DOI] [PubMed] [Google Scholar]
- Daw ND, Doya K. The computational neurobiology of learning and reward. Curr Opin Neurobiol. 2006;16:199–204. doi: 10.1016/j.conb.2006.03.006. [DOI] [PubMed] [Google Scholar]
- Delgado MR, Nystrom LE, Fissell C, Noll DC, Fiez JA. Tracking the hemodynamic responses to reward and punishment in the striatum. J Neurophysiol. 2000;84:3072–3077. doi: 10.1152/jn.2000.84.6.3072. [DOI] [PubMed] [Google Scholar]
- Delgado MR, Gillis MM, Phelps EA. Regulating the expectation of reward via cognitive strategies. Nat Neurosci. 2008a;11:880–881. doi: 10.1038/nn.2141. [DOI] [PMC free article] [PubMed] [Google Scholar]
- Delgado MR, Li J, Schiller D, Phelps EA. The role of the striatum in aversive learning and aversive prediction errors. Philos Trans R Soc Lond B Biol Sci. 2008b;363:3787–3800. doi: 10.1098/rstb.2008.0161. [DOI] [PMC free article] [PubMed] [Google Scholar]
- Ding L, Hikosaka O. Comparison of reward modulation in the frontal eye field and caudate of the macaque. J Neurosci. 2006;26:6695–6703. doi: 10.1523/JNEUROSCI.0836-06.2006. [DOI] [PMC free article] [PubMed] [Google Scholar]
- Eblen F, Graybiel AM. Highly restricted origin of prefrontal cortical inputs to striosomes in the macaque monkey. J Neurosci. 1995;15:5999–6013. doi: 10.1523/JNEUROSCI.15-09-05999.1995. [DOI] [PMC free article] [PubMed] [Google Scholar]
- Enomoto K, Matsumoto N, Nakai S, Satoh T, Sato TK, Ueda Y, Inokawa H, Haruno M, Kimura M. Dopamine neurons learn to encode the long-term value of multiple future rewards. Proc Natl Acad Sci U S A. 2011;108:15462–15467. doi: 10.1073/pnas.1014457108. [DOI] [PMC free article] [PubMed] [Google Scholar]
- Everitt BJ, Morris KA, O'Brien A, Robbins TW. The basolateral amygdala-ventral striatal system and conditioned place preference: further evidence of limbic-striatal interactions underlying reward-related processes. Neuroscience. 1991;42:1–18. doi: 10.1016/0306-4522(91)90145-e. [DOI] [PubMed] [Google Scholar]
- Everitt BJ, Parkinson JA, Olmstead MC, Arroyo M, Robledo P, Robbins TW. Associative processes in addiction and reward. The role of amygdala-ventral striatal subsystems. Ann N Y Acad Sci. 1999;877:412–438. doi: 10.1111/j.1749-6632.1999.tb09280.x. [DOI] [PubMed] [Google Scholar]
- Ferry AT, Ongür D, An X, Price JL. Prefrontal cortical projections to the striatum in macaque monkeys: evidence for an organization related to prefrontal networks. J Comp Neurol. 2000;425:447–470. doi: 10.1002/1096-9861(20000925)425:3<447::aid-cne9>3.0.co;2-v. [DOI] [PubMed] [Google Scholar]
- Friedman DP, Aggleton JP, Saunders RC. Comparison of hippocampal, amygdala, and perirhinal projections to the nucleus accumbens: combined anterograde and retrograde tracing study in the macaque brain. J Comp Neurol. 2002;450:345–365. doi: 10.1002/cne.10336. [DOI] [PubMed] [Google Scholar]
- Fudge JL, Kunishio K, Walsh P, Richard C, Haber SN. Amygdaloid projections to ventromedial striatal subterritories in the primate. Neuroscience. 2002;110:257–275. doi: 10.1016/s0306-4522(01)00546-2. [DOI] [PubMed] [Google Scholar]
- Gage GJ, Stoetzner CR, Wiltschko AB, Berke JD. Selective activation of striatal fast-spiking interneurons during choice execution. Neuron. 2010;67:466–479. doi: 10.1016/j.neuron.2010.06.034. [DOI] [PMC free article] [PubMed] [Google Scholar]
- Gerfen CR, Herkenham M, Thibault J. The neostriatal mosaic. II. Patch-and matrix-directed mesostriatal dopaminergic and non-dopaminergic systems. J Neurosci. 1987;7:3915–3934. doi: 10.1523/JNEUROSCI.07-12-03915.1987. [DOI] [PMC free article] [PubMed] [Google Scholar]
- Goldstein BL, Barnett BR, Vasquez G, Tobia SC, Kashtelyan V, Burton AC, Bryden DW, Roesch MR. Ventral striatum encodes past and predicted value independent of motor contingencies. J Neurosci. 2012;32:2027–2036. doi: 10.1523/JNEUROSCI.5349-11.2012. [DOI] [PMC free article] [PubMed] [Google Scholar]
- Graybiel AM. Habits, rituals, and the evaluative brain. Annu Rev Neurosci. 2008;31:359–387. doi: 10.1146/annurev.neuro.29.051605.112851. [DOI] [PubMed] [Google Scholar]
- Groenewegen HJ, Vermeulen-Van der Zee E, te Kortschot A, Witter MP. Organization of the projections from the subiculum to the ventral striatum in the rat. A study using anterograde transport of Phaseolus vulgaris leucoagglutinin. Neuroscience. 1987;23:103–120. doi: 10.1016/0306-4522(87)90275-2. [DOI] [PubMed] [Google Scholar]
- Haber SN. The primate basal ganglia: parallel and integrative networks. J Chem Neuroanat. 2003;26:317–330. doi: 10.1016/j.jchemneu.2003.10.003. [DOI] [PubMed] [Google Scholar]
- Haber SN, Knutson B. The reward circuit: linking primate anatomy and human imaging. Neuropsychopharmacology. 2010;35:4–26. doi: 10.1038/npp.2009.129. [DOI] [PMC free article] [PubMed] [Google Scholar]
- Haber SN, McFarland NR. The concept of the ventral striatum in nonhuman primates. Ann N Y Acad Sci. 1999;877:33–48. doi: 10.1111/j.1749-6632.1999.tb09259.x. [DOI] [PubMed] [Google Scholar]
- Haber SN, Fudge JL, McFarland NR. Striatonigrostriatal pathways in primates form an ascending spiral from the shell to the dorsolateral striatum. J Neurosci. 2000;20:2369–2382. doi: 10.1523/JNEUROSCI.20-06-02369.2000. [DOI] [PMC free article] [PubMed] [Google Scholar]
- Haber SN, Kim KS, Mailly P, Calzavara R. Reward-related cortical inputs define a large striatal region in primates that interface with associative cortical connections, providing a substrate for incentive-based learning. J Neurosci. 2006;26:8368–8376. doi: 10.1523/JNEUROSCI.0271-06.2006. [DOI] [PMC free article] [PubMed] [Google Scholar]
- Haruno M, Kuroda T, Doya K, Toyama K, Kimura M, Samejima K, Imamizu H, Kawato M. A neural correlate of reward-based behavioral learning in caudate nucleus: a functional magnetic resonance imaging study of a stochastic decision task. J Neurosci. 2004;24:1660–1665. doi: 10.1523/JNEUROSCI.3417-03.2004. [DOI] [PMC free article] [PubMed] [Google Scholar]
- Hassani OK, Cromwell HC, Schultz W. Influence of expectation of different rewards on behavior-related neuronal activity in the striatum. J Neurophysiol. 2001;85:2477–2489. doi: 10.1152/jn.2001.85.6.2477. [DOI] [PubMed] [Google Scholar]
- Hayden BY, Pearson JM, Platt ML. Neuronal basis of sequential foraging decisions in a patchy environment. Nat Neurosci. 2011;14:933–939. doi: 10.1038/nn.2856. [DOI] [PMC free article] [PubMed] [Google Scholar]
- Hedreen JC, DeLong MR. Organization of striatopallidal, striatonigral, and nigrostriatal projections in the macaque. J Comp Neurol. 1991;304:569–595. doi: 10.1002/cne.903040406. [DOI] [PubMed] [Google Scholar]
- Heimer L, Zaborszky L, Zahm DS, Alheid GF. The ventral striatopallidothalamic projection. I. The striatopallidal link originating in the striatal parts of the olfactory tubercle. J Comp Neurol. 1987;255:571–591. doi: 10.1002/cne.902550409. [DOI] [PubMed] [Google Scholar]
- Hikida T, Kimura K, Wada N, Funabiki K, Nakanishi S. Distinct roles of synaptic transmission in direct and indirect striatal pathways to reward and aversive behavior. Neuron. 2010;66:896–907. doi: 10.1016/j.neuron.2010.05.011. [DOI] [PubMed] [Google Scholar]
- Hikosaka O, Takikawa Y, Kawagoe R. Role of the basal ganglia in the control of purposive saccadic eye movements. Physiol Rev. 2000;80:953–978. doi: 10.1152/physrev.2000.80.3.953. [DOI] [PubMed] [Google Scholar]
- Hikosaka O, Nakamura K, Nakahara H. Basal ganglia orient eyes to reward. J Neurophysiol. 2006;95:567–584. doi: 10.1152/jn.00458.2005. [DOI] [PubMed] [Google Scholar]
- Histed MH, Pasupathy A, Miller EK. Learning substrates in the primate prefrontal cortex and striatum: sustained activity related to successful actions. Neuron. 2009;63:244–253. doi: 10.1016/j.neuron.2009.06.019. [DOI] [PMC free article] [PubMed] [Google Scholar]
- Horvitz JC. Mesolimbocortical and nigrostriatal dopamine responses to salient non-reward events. Neuroscience. 2000;96:651–656. doi: 10.1016/s0306-4522(00)00019-1. [DOI] [PubMed] [Google Scholar]
- Ikeda T, Hikosaka O. Reward-dependent gain and bias of visual responses in primate superior colliculus. Neuron. 2003;39:693–700. doi: 10.1016/s0896-6273(03)00464-1. [DOI] [PubMed] [Google Scholar]
- Ikemoto S, Panksepp J. The role of nucleus accumbens dopamine in motivated behavior: a unifying interpretation with special reference to reward-seeking. Brain Res Brain Res Rev. 1999;31:6–41. doi: 10.1016/s0165-0173(99)00023-5. [DOI] [PubMed] [Google Scholar]
- Ito M, Doya K. Validation of decision-making models and analysis of decision variables in the rat basal ganglia. J Neurosci. 2009;29:9861–9874. doi: 10.1523/JNEUROSCI.6157-08.2009. [DOI] [PMC free article] [PubMed] [Google Scholar]
- Jensen J, McIntosh AR, Crawley AP, Mikulis DJ, Remington G, Kapur S. Direct activation of the ventral striatum in anticipation of aversive stimuli. Neuron. 2003;40:1251–1257. doi: 10.1016/s0896-6273(03)00724-4. [DOI] [PubMed] [Google Scholar]
- Karachi C, François C, Parain K, Bardinet E, Tand é D, Hirsch E, Yelnik J. Three-dimensional cartography of functional territories in the human striatopallidal complex by using calbindin immunoreactivity. J Comp Neurol. 2002;450:122–134. doi: 10.1002/cne.10312. [DOI] [PubMed] [Google Scholar]
- Kawagoe R, Takikawa Y, Hikosaka O. Expectation of reward modulates cognitive signals in the basal ganglia. Nat Neurosci. 1998;1:411–416. doi: 10.1038/1625. [DOI] [PubMed] [Google Scholar]
- Kawagoe R, Takikawa Y, Hikosaka O. Reward-predicting activity of dopamine and caudate neurons—a possible mechanism of motivational control of saccadic eye movement. J Neurophysiol. 2004;91:1013–1024. doi: 10.1152/jn.00721.2003. [DOI] [PubMed] [Google Scholar]
- Kelley AE. Ventral striatal control of appetitive motivation: role in ingestive behavior and reward-related learning. Neurosci Biobehav Rev. 2004;27:765–776. doi: 10.1016/j.neubiorev.2003.11.015. [DOI] [PubMed] [Google Scholar]
- Kelley AE, Domesick VB, Nauta WJ. The amygdalostriatal projection in the rat—an anatomical study by anterograde and retrograde tracing methods. Neuroscience. 1982;7:615–630. doi: 10.1016/0306-4522(82)90067-7. [DOI] [PubMed] [Google Scholar]
- Kim H, Sul JH, Huh N, Lee D, Jung MW. Role of striatum in updating values of chosen actions. J Neurosci. 2009;29:14701–14712. doi: 10.1523/JNEUROSCI.2728-09.2009. [DOI] [PMC free article] [PubMed] [Google Scholar]
- Kimchi EY, Laubach M. Dynamic encoding of action selection by the medial striatum. J Neurosci. 2009a;29:3148–3159. doi: 10.1523/JNEUROSCI.5206-08.2009. [DOI] [PMC free article] [PubMed] [Google Scholar]
- Kimchi EY, Laubach M. The dorsomedial striatum reflects response bias during learning. J Neurosci. 2009b;29:14891–14902. doi: 10.1523/JNEUROSCI.4060-09.2009. [DOI] [PMC free article] [PubMed] [Google Scholar]
- Kimchi EY, Torregrossa MM, Taylor JR, Laubach M. Neuronal correlates of instrumental learning in the dorsal striatum. J Neurophysiol. 2009;102:475–489. doi: 10.1152/jn.00262.2009. [DOI] [PMC free article] [PubMed] [Google Scholar]
- Knutson B, Adams CM, Fong GW, Hommer D. Anticipation of increasing monetary reward selectively recruits nucleus accumbens. J Neurosci. 2001a;21 doi: 10.1523/JNEUROSCI.21-16-j0002.2001. (1⌓5) [DOI] [PMC free article] [PubMed] [Google Scholar]
- Knutson B, Fong GW, Adams CM, Varner JL, Hommer D. Dissociation of reward anticipation and outcome with event-related fMRI. Neuroreport. 2001b;12:3683–3687. doi: 10.1097/00001756-200112040-00016. [DOI] [PubMed] [Google Scholar]
- Koepp MJ, Gunn RN, Lawrence AD, Cunningham VJ, Dagher A, Jones T, Brooks DJ, Bench CJ, Grasby PM. Evidence for striatal dopamine release during a video game. Nature. 1998;393:266–268. doi: 10.1038/30498. [DOI] [PubMed] [Google Scholar]
- Kolling N, Behrens TE, Mars RB, Rushworth MF. Neural mechanisms of foraging. Science. 2012;336:95–98. doi: 10.1126/science.1216930. [DOI] [PMC free article] [PubMed] [Google Scholar]
- Lau B, Glimcher PW. Action and outcome encoding in the primate caudate nucleus. J Neurosci. 2007;27:14502–14514. doi: 10.1523/JNEUROSCI.3060-07.2007. [DOI] [PMC free article] [PubMed] [Google Scholar]
- Lauwereyns J, Watanabe K, Coe B, Hikosaka O. A neural correlate of response bias in monkey caudate nucleus. Nature. 2002;418:413–417. doi: 10.1038/nature00892. [DOI] [PubMed] [Google Scholar]
- Lynd-Balta E, Haber SN. The organization of midbrain projections to the striatum in the primate: sensorimotor-related striatum versus ventral striatum. Neuroscience. 1994;59:625–640. doi: 10.1016/0306-4522(94)90182-1. [DOI] [PubMed] [Google Scholar]
- Matsumoto M, Hikosaka O. Two types of dopamine neuron distinctly convey positive and negative motivational signals. Nature. 2009;459:837–841. doi: 10.1038/nature08028. [DOI] [PMC free article] [PubMed] [Google Scholar]
- McClure SM, Berns GS, Montague PR. Temporal prediction errors in a passive learning task activate human striatum. Neuron. 2003;38:339–346. doi: 10.1016/s0896-6273(03)00154-5. [DOI] [PubMed] [Google Scholar]
- Nakahara H, Itoh H, Kawagoe R, Takikawa Y, Hikosaka O. Dopamine neurons can represent context-dependent prediction error. Neuron. 2004;41:269–280. doi: 10.1016/s0896-6273(03)00869-9. [DOI] [PubMed] [Google Scholar]
- Nicola SM. The nucleus accumbens as part of a basal ganglia action selection circuit. Psychopharmacology (Berl) 2007;191:521–550. doi: 10.1007/s00213-006-0510-4. [DOI] [PubMed] [Google Scholar]
- Nicola SM, Yun IA, Wakabayashi KT, Fields HL. Cue-evoked firing of nucleus accumbens neurons encodes motivational significance during a discriminative stimulus task. J Neurophysiol. 2004;91:1840–1865. doi: 10.1152/jn.00657.2003. [DOI] [PubMed] [Google Scholar]
- Noonan MP, Walton ME, Behrens TE, Sallet J, Buckley MJ, Rushworth MF. Separate value comparison and learning mechanisms in macaque medial and lateral orbitofrontal cortex. Proc Natl Acad Sci U S A. 2010;107:20547–20552. doi: 10.1073/pnas.1012246107. [DOI] [PMC free article] [PubMed] [Google Scholar]
- O'Doherty J, Dayan P, Schultz J, Deichmann R, Friston K, Dolan RJ. Dissociable roles of ventral and dorsal striatum in instrumental conditioning. Science. 2004;304:452–454. doi: 10.1126/science.1094285. [DOI] [PubMed] [Google Scholar]
- Parent A, Hazrati LN. Multiple striatal representation in primate substantia nigra. J Comp Neurol. 1994;344:305–320. doi: 10.1002/cne.903440211. [DOI] [PubMed] [Google Scholar]
- Parkinson JA, Olmstead MC, Burns LH, Robbins TW, Everitt BJ. Dissociation in effects of lesions of the nucleus accumbens core and shell on appetitive pavlovian approach behavior and the potentiation of conditioned reinforcement and locomotor activity by d-amphetamine. J Neurosci. 1999;19:2401–2411. doi: 10.1523/JNEUROSCI.19-06-02401.1999. [DOI] [PMC free article] [PubMed] [Google Scholar]
- Ploghaus A, Tracey I, Clare S, Gati JS, Rawlins JN, Matthews PM. Learning about pain: the neural substrate of the prediction error for aversive events. Proc Natl Acad Sci U S A. 2000;97:9281–9286. doi: 10.1073/pnas.160266497. [DOI] [PMC free article] [PubMed] [Google Scholar]
- Prado-Alcala R, Wise RA. Brain stimulation reward and dopamine terminal fields. I. Caudate-putamen, nucleus accumbens and amygdala. Brain Res. 1984;297:265–273. doi: 10.1016/0006-8993(84)90567-5. [DOI] [PubMed] [Google Scholar]
- Prensa L, Richard S, Parent A. Chemical anatomy of the human ventral striatum and adjacent basal forebrain structures. J Comp Neurol. 2003;460:345–367. doi: 10.1002/cne.10627. [DOI] [PubMed] [Google Scholar]
- Ragozzino ME. The contribution of the medial prefrontal cortex, orbitofrontal cortex, and dorsomedial striatum to behavioral flexibility. Ann N Y Acad Sci. 2007;1121:355–375. doi: 10.1196/annals.1401.013. [DOI] [PubMed] [Google Scholar]
- Ragsdale CW, Jr, Graybiel AM. Fibers from the basolateral nucleus of the amygdala selectively innervate striosomes in the caudate nucleus of the cat. J Comp Neurol. 1988;269:506–522. doi: 10.1002/cne.902690404. [DOI] [PubMed] [Google Scholar]
- Reynolds SM, Berridge KC. Fear and feeding in the nucleus accumbens shell: rostrocaudal segregation of GABA-elicited defensive behavior versus eating behavior. J Neurosci. 2001;21:3261–3270. doi: 10.1523/JNEUROSCI.21-09-03261.2001. [DOI] [PMC free article] [PubMed] [Google Scholar]
- Roesch MR, Singh T, Brown PL, Mullins SE, Schoenbaum G. Ventral striatal neurons encode the value of the chosen action in rats deciding between differently delayed or sized rewards. J Neurosci. 2009;29:13365–13376. doi: 10.1523/JNEUROSCI.2572-09.2009. [DOI] [PMC free article] [PubMed] [Google Scholar]
- Rolls ET, Thorpe SJ, Maddison SP. Responses of striatal neurons in the behaving monkey. I. Head of the caudate nucleus. Behav Brain Res. 1983;7:179–210. doi: 10.1016/0166-4328(83)90191-2. [DOI] [PubMed] [Google Scholar]
- Russchen FT, Bakst I, Amaral DG, Price JL. The amygdalostriatal projections in the monkey. An anterograde tracing study. Brain Res. 1985;329:241–257. doi: 10.1016/0006-8993(85)90530-x. [DOI] [PubMed] [Google Scholar]
- Saint-Cyr JA, Ungerleider LG, Desimone R. Organization of visual cortical inputs to the striatum and subsequent outputs to the pallido-nigral complex in the monkey. J Comp Neurol. 1990;298:129–156. doi: 10.1002/cne.902980202. [DOI] [PubMed] [Google Scholar]
- Salamone JD. Functions of mesolimbic dopamine: changing concepts and shifting paradigms. Psychopharmacology (Berl) 2007;191:389. doi: 10.1007/s00213-006-0623-9. [DOI] [PubMed] [Google Scholar]
- Samejima K, Ueda Y, Doya K, Kimura M. Representation of action-specific reward values in the striatum. Science. 2005;310:1337–1340. doi: 10.1126/science.1115270. [DOI] [PubMed] [Google Scholar]
- Sato M, Hikosaka O. Role of primate substantia nigra pars reticulata in reward-oriented saccadic eye movement. J Neurosci. 2002;22:2363–2373. doi: 10.1523/JNEUROSCI.22-06-02363.2002. [DOI] [PMC free article] [PubMed] [Google Scholar]
- Schmitzer-Torbert N, Redish AD. Neuronal activity in the rodent dorsal striatum in sequential navigation: separation of spatial and reward responses on the multiple T task. J Neurophysiol. 2004;91:2259–2272. doi: 10.1152/jn.00687.2003. [DOI] [PubMed] [Google Scholar]
- Schultz W. Multiple reward signals in the brain. Nat Rev Neurosci. 2000;1:199–207. doi: 10.1038/35044563. [DOI] [PubMed] [Google Scholar]
- Schultz W, Apicella P, Scarnati E, Ljungberg T. Neuronal activity in monkey ventral striatum related to the expectation of reward. J Neurosci. 1992;12:4595–4610. doi: 10.1523/JNEUROSCI.12-12-04595.1992. [DOI] [PMC free article] [PubMed] [Google Scholar]
- Selemon LD, Goldman-Rakic PS. Longitudinal topography and interdigitation of corticostriatal projections in the rhesus monkey. J Neurosci. 1985;5:776–794. doi: 10.1523/JNEUROSCI.05-03-00776.1985. [DOI] [PMC free article] [PubMed] [Google Scholar]
- Setlow B, Schoenbaum G, Gallagher M. Neural encoding in ventral striatum during olfactory discrimination learning. Neuron. 2003;38:625–636. doi: 10.1016/s0896-6273(03)00264-2. [DOI] [PubMed] [Google Scholar]
- Seymour B, O'Doherty JP, Koltzenburg M, Wiech K, Frackowiak R, Friston K, Dolan R. Opponent appetitive-aversive neural processes underlie predictive learning of pain relief. Nat Neurosci. 2005;8:1234–1240. doi: 10.1038/nn1527. [DOI] [PubMed] [Google Scholar]
- Seymour B, Singer T, Dolan R. The neurobiology of punishment. Nat Rev Neurosci. 2007;8:300–311. doi: 10.1038/nrn2119. [DOI] [PubMed] [Google Scholar]
- Shimo Y, Hikosaka O. Role of tonically active neurons in primate caudate in reward-oriented saccadic eye movement. J Neurosci. 2001;21:7804–7814. doi: 10.1523/JNEUROSCI.21-19-07804.2001. [DOI] [PMC free article] [PubMed] [Google Scholar]
- Takikawa Y, Kawagoe R, Hikosaka O. Reward-dependent spatial selectivity of anticipatory activity in monkey caudate neurons. J Neurophysiol. 2002a;87:508–515. doi: 10.1152/jn.00288.2001. [DOI] [PubMed] [Google Scholar]
- Takikawa Y, Kawagoe R, Itoh H, Nakahara H, Hikosaka O. Modulation of saccadic eye movements by predicted reward outcome. Exp Brain Res. 2002b;142:284–291. doi: 10.1007/s00221-001-0928-1. [DOI] [PubMed] [Google Scholar]
- Thorn CA, Atallah H, Howe M, Graybiel AM. Differential dynamics of activity changes in dorsolateral and dorsomedial striatal loops during learning. Neuron. 2010;66:781–795. doi: 10.1016/j.neuron.2010.04.036. [DOI] [PMC free article] [PubMed] [Google Scholar]
- Threlfell S, Cragg SJ. Dopamine signaling in dorsal versus ventral striatum: the dynamic role of cholinergic interneurons. Front Syst Neurosci. 2011;5:11. doi: 10.3389/fnsys.2011.00011. [DOI] [PMC free article] [PubMed] [Google Scholar]
- Tom SM, Fox CR, Trepel C, Poldrack RA. The neural basis of loss aversion in decision-making under risk. Science. 2007;315:515–518. doi: 10.1126/science.1134239. [DOI] [PubMed] [Google Scholar]
- Tremblay L, Hollerman JR, Schultz W. Modifications of reward expectation-related neuronal activity during learning in primate striatum. J Neurophysiol. 1998;80:964–977. doi: 10.1152/jn.1998.80.2.964. [DOI] [PubMed] [Google Scholar]
- Tremblay L, Worbe Y, Hollerman J. Dreher JC, Tremblay L, editors. The ventral striatum: a heterogeneous stricture involved in reward processing, motivation, and decision making. Handbook of reward and decision making. 2009:51–77. [Google Scholar]
- Tricomi EM, Delgado MR, Fiez JA. Modulation of caudate activity by action contingency. Neuron. 2004;41:281–292. doi: 10.1016/s0896-6273(03)00848-1. [DOI] [PubMed] [Google Scholar]
- Ungless MA. Dopamine: the salient issue. Trends Neurosci. 2004;27:702–706. doi: 10.1016/j.tins.2004.10.001. [DOI] [PubMed] [Google Scholar]
- Voorn P, Vanderschuren LJ, Groenewegen HJ, Robbins TW, Pennartz CM. Putting a spin on the dorsal-ventral divide of the striatum. Trends Neurosci. 2004;27:468–474. doi: 10.1016/j.tins.2004.06.006. [DOI] [PubMed] [Google Scholar]
- Walton ME, Behrens TE, Buckley MJ, Rudebeck PH, Rushworth MF. Separable learning systems in the macaque brain and the role of orbitofrontal cortex in contingent learning. Neuron. 2010;65:927–939. doi: 10.1016/j.neuron.2010.02.027. [DOI] [PMC free article] [PubMed] [Google Scholar]
- Watanabe K, Hikosaka O. Immediate changes in anticipatory activity of caudate neurons associated with reversal of position-reward contingency. J Neurophysiol. 2005;94:1879–1887. doi: 10.1152/jn.00012.2005. [DOI] [PubMed] [Google Scholar]
- White NM. Some highlights of research on the effects of caudate nucleus lesions over the past 200 years. Behav Brain Res. 2009;199:3–23. doi: 10.1016/j.bbr.2008.12.003. [DOI] [PubMed] [Google Scholar]
- White NM, Salinas JA. Mnemonic functions of dorsal striatum and hippocampus in aversive conditioning. Behav Brain Res. 2003;142:99–107. doi: 10.1016/s0166-4328(02)00402-3. [DOI] [PubMed] [Google Scholar]
- Wickens JR, Budd CS, Hyland BI, Arbuthnott GW. Striatal contributions to reward and decision making: making sense of regional variations in a reiterated processing matrix. Ann N Y Acad Sci. 2007;1104:192–212. doi: 10.1196/annals.1390.016. [DOI] [PubMed] [Google Scholar]
- Wise RA. Roles for nigrostriatal—not just mesocorticolimbic—dopamine in reward and addiction. Trends Neurosci. 2009;32:517–524. doi: 10.1016/j.tins.2009.06.004. [DOI] [PMC free article] [PubMed] [Google Scholar]
- Wunderlich K, Dayan P, Dolan RJ. Mapping value based planning and extensively trained choice in the human brain. Nat Neurosci. 2012;15:786–791. doi: 10.1038/nn.3068. [DOI] [PMC free article] [PubMed] [Google Scholar]
- Yacubian J, Gläscher J, Schroeder K, Sommer T, Braus DF, Büchel C. Dissociable systems for gain- and loss-related value predictions and errors of prediction in the human brain. J Neurosci. 2006;26:9530–9537. doi: 10.1523/JNEUROSCI.2915-06.2006. [DOI] [PMC free article] [PubMed] [Google Scholar]
- Yamada H, Matsumoto N, Kimura M. History- and current instruction-based coding of forthcoming behavioral outcomes in the striatum. J Neurophysiol. 2007;98:3557–3567. doi: 10.1152/jn.00779.2007. [DOI] [PubMed] [Google Scholar]
- Yeterian EH, Pandya DN. Prefrontostriatal connections in relation to cortical architectonic organization in rhesus monkeys. J Comp Neurol. 1991;312:43–67. doi: 10.1002/cne.903120105. [DOI] [PubMed] [Google Scholar]
- Yin HH, Knowlton BJ. The role of the basal ganglia in habit formation. Nat Rev Neurosci. 2006;7:464–476. doi: 10.1038/nrn1919. [DOI] [PubMed] [Google Scholar]
- Yin HH, Knowlton BJ, Balleine BW. Lesions of dorsolateral striatum preserve outcome expectancy but disrupt habit formation in instrumental learning. Eur J Neurosci. 2004;19:181–189. doi: 10.1111/j.1460-9568.2004.03095.x. [DOI] [PubMed] [Google Scholar]
- Yin HH, Mulcare SP, Hilário MR, Clouse E, Holloway T, Davis MI, Hansson AC, Lovinger DM, Costa RM. Dynamic reorganization of striatal circuits during the acquisition and consolidation of a skill. Nat Neurosci. 2009;12:333–341. doi: 10.1038/nn.2261. [DOI] [PMC free article] [PubMed] [Google Scholar]
- Zald DH, Hagen MC, Pardo JV. Neural correlates of tasting concentrated quinine and sugar solutions. J Neurophysiol. 2002;87:1068–1075. doi: 10.1152/jn.00358.2001. [DOI] [PubMed] [Google Scholar]