

Abstract
Practice-induced improvements in skilled performance reflect “offline ” consolidation processes extending beyond daily training sessions. According to visual learning theories, an early, fast learning phase driven by high-level areas is followed by a late, asymptotic learning phase driven by low-level, retinotopic areas when higher resolution is required. Thus, low-level areas would not contribute to learning and offline consolidation until late learning. Recent studies have challenged this notion, demonstrating modified responses to trained stimuli in primary visual cortex (V1) and offline activity after very limited training. However, the behavioral relevance of modified V1 activity for offline consolidation of visual skill memory in V1 after early training sessions remains unclear. Here, we used neuronavigated transcranial magnetic stimulation (TMS) directed to a trained retinotopic V1 location to test for behaviorally relevant consolidation in human low-level visual cortex. Applying TMS to the trained V1 location within 45 min of the first or second training session strongly interfered with learning, as measured by impaired performance the next day. The interference was conditional on task context and occurred only when training in the location targeted by TMS was followed by training in a second location before TMS. In this condition, high-level areas may become coupled to the second location and uncoupled from the previously trained low-level representation, thereby rendering consolidation vulnerable to interference. Our data show that, during the earliest phases of skill learning in the lowest-level visual areas, a behaviorally relevant form of consolidation exists of which the robustness is controlled by high-level, contextual factors.
Introduction
The neural mechanisms driving the remarkable improvements in performance after prolonged skill training (Karni and Sagi, 1991; Karni et al., 1995; Schoups et al., 1995; Gilbert et al., 2001; Doyon and Benali, 2005; Roelfsema et al., 2010; Sasaki et al., 2010) remain poorly understood. Interestingly, performance increments during skill learning appear larger between consecutive daily training sessions than within sessions (Karni and Sagi, 1993; Schoups et al., 1995; Gervan and Kovacs, 2010), which indicates an offline consolidation process between training sessions. Many studies of the cellular processes contributing to plasticity emphasize the importance of the first few hours after an experience for offline consolidation (Abel and Lattal, 2001; Dudai, 2004), although memory traces likely are subject to consolidation processes over much longer time windows (Lewis, 1979; Nader et al., 2000; Caithness et al., 2004).
In the visual system, areas as low in the anatomical hierarchy as primary visual cortex (V1) can be involved in training-induced neural plasticity and consolidation. Training-induced response changes have been shown after prolonged training (Schoups et al., 2001) but also after a single training session (Schwartz et al., 2002; Yotsumoto et al., 2008). Moreover, human neuroimaging (Yotsumoto et al., 2009) has revealed offline V1 activity during sleep 6 h after a single session of visual skill learning, implicating V1 in offline consolidation after a small amount of training. In contrast, influential theories of visual skill learning (Karni and Bertini, 1997; Ahissar and Hochstein, 2004) predict that the contribution of low-level visual areas to offline consolidation is maximized toward the end of learning (late, asymptotic phase) rather than at the beginning (early phase). The stimulus specificity of perceptual learning during asymptotic but not early learning has been considered a strong argument for the contribution of early visual areas to memory formation in the asymptotic learning phase (Karni and Sagi, 1991; Karni et al., 1995; Schoups et al., 1995; Ahissar and Hochstein, 1997; Gilbert et al., 2001). Here, we investigated, to our knowledge for the first time, whether early indications of plasticity and offline activity in human V1 are functionally relevant for early visual skill learning. We had human participants train on a visual orientation discrimination task and applied repetitive transcranial magnetic stimulation (rTMS) to the trained retinotopic location in V1 ∼45 min after the end of the first or second training session. Impaired performance on the day after rTMS would indicate a causally relevant contribution of low-level visual cortex to offline visual skill consolidation during early learning.
Materials and Methods
Experimental design.
Participants were trained in a visual orientation discrimination task, in which just noticeable differences (JNDs) in orientation were measured for Gabor stimuli presented in the lower-left and upper-right visual quadrant at a fixed peripheral location (Fig. 1A). Training included daily training sessions on 3 consecutive days for both quadrants, presented in blocks and in a counterbalanced order. In one subgroup of participants, training in the lower-left quadrant was followed by training in the upper-right quadrant on the first day (L–R), and visual quadrant order was alternated on consecutive days (L–R, R–L, L–R: Fig. 1B, Order 1). For the other participants, the learning order was reversed (Fig. 1B, Order 2). rTMS was administered ∼45 min after the end of the first and second daily training session in approximately half of the participants (the other participants served as non-TMS controls). The TMS coil was positioned over right occipital cortex to interfere with processing at the stimulus location in the lower-left visual quadrant (LT quadrant) using fMRI-based neuronavigation (Sack et al., 2009). The upper-right visual quadrant was not targeted by TMS (RnT quadrant) and served as a within-subject control quadrant.
Figure 1.

Experimental design. Participants performed an orientation discrimination task on Gabor patches presented either in the lower-left or upper-right visual quadrant (A). Training sessions took place on 3 consecutive days, of which the first two sessions were followed by rTMS in the TMS group (A, B). Training regimens followed one of two possible orders (Order 1: day 1 L–R, day 2 R–L, day 3 L–R; Order 2: R–L, L–R, R–L), related to the quadrant that was trained first on a particular day. After the training session, neuronavigated rTMS was applied to the cortical representation in V1 of the L stimulus (TMS group only) (C). The cortical reconstruction of the right hemisphere of one participant is shown with the superimposed functional results of the eccentricity mapping (left), stimulus localizer (middle), and selected TMS target site (right). In the right image, the approximate localization of 6° eccentricity (yellow color) according to eccentricity mapping verifies the eccentricity of the target site. The selected TMS target site was constrained to lie within striate cortex (upper bank of the calcarine fissure).
Participants.
We recruited seven participants for the TMS experiment (three females; mean ± SD age, 27.4 ± 2.8 years) and six participants for the control experiment (two females; mean ± SD age, 28.6 ± 4.6 years). All participants had (corrected to) normal visual acuity, gave written informed consent, and were medically screened for inclusion by an independent physician following published safety guidelines (Rossi et al., 2009). All procedures were approved by the local medical ethics committee of the Maastricht University Medical Centre.
Functional and structural MRI.
TMS target sites on the cortical surface of the right hemisphere were individually determined in each participant of the TMS group using functional MRI localizers. We acquired functional and anatomical images on a 3 tesla Siemens Allegra MR scanner at the Maastricht Brain Imaging Centre at Maastricht University, The Netherlands. Three-dimensional (3D) anatomical T1-weighted images were acquired at an isotropic voxel resolution of 1 × 1 × 1 mm3 (192 slices). For functional measurements, we acquired retinotopic maps using polar angle and eccentricity localizers (Sereno et al., 1995; Engel et al., 1997; Linden et al., 1999) (TR/TE, 2000/30 ms; 268 volumes of 28 slices; 128 × 128 measurement matrix; 2 × 2 mm2 in-plane pixel resolution; 2 mm slice thickness, no gap between slices). We also presented a localizer for the stimulus locations in two separate functional runs, which used the same sequence parameters with the exception of the number of volumes (184 per run).
For the retinotopic localizer runs, we presented a counterclockwise rotating checkerboard wedge (polar mapping) and an expanding checkerboard ring (eccentricity mapping). The luminance of the checkerboard of the stimuli changed every 125 ms (8 Hz), and each cycle of rotation or expansion lasted 64 s (Sereno et al., 1995; Engel et al., 1997; Linden et al., 1999). Each participant saw eight cycle repetitions.
The localizer for perceptual learning location on the visual cortex comprised a checkerboard circle and ring that were presented at the same visual field position as the Gabor patches in the perceptual learning task. The width of the inner dimension of the ring was 3° (matching the diameter of the circle), and the width of the ring was 1°. The checkerboards of the circle and ring changed color (red–green, green–red, yellow–blue, and blue–yellow) every 125 ms (8 Hz) to minimize the occurrence of after-images. The circle and ring were presented in separate blocks in either the lower-left or the upper-right visual field in random order. Brain activity associated with the circle and ring that were presented at the same visual field position was contrasted to optimize the statistical localization of the intended visual field representation in visual cortex (see below).
Preprocessing and analysis of fMRI data.
Preprocessing and analysis of the functional and anatomical data were performed using the BrainVoyager QX software version 2.0 (Goebel et al., 2006) (Brain Innovation). The anatomical images were rotated to the anterior–posterior commissure plane (AC–PC plane). Next, the cortical surface of the right hemisphere was segmented and tessellated into a 3D surface representation (Kriegeskorte and Goebel, 2001; Goebel et al., 2006). Also, the outer surface of the head was tessellated into a 3D representation. The 3D representations were used for navigation of the TMS coil over the scalp and cortical surface of each individual participant.
The first two volumes of the functional data were discarded, and the remaining time series were preprocessed using slice scan time correction, head-movement correction, and linear trend removal of the time series and were then rotated to the AC–PC plane and resampled to an isotropic voxel resolution of 3 × 3 × 3 mm3. The retinotopy runs (polar and eccentricity mapping) were analyzed using lagged correlation analysis (Linden et al., 1999), with a model of the hemodynamic response to the starting wedge or ring position shifted across 32 lags. Each voxel was color coded according to the model lag of the wedge or ring with the highest correlation.
The localizer for the stimulus position was analyzed using a general linear model (Friston et al., 1995) with four predictors (circle and ring presented in left-lower or right-upper visual field). We defined the functional target location on the upper bank of the calcarine fissure of the right hemisphere by the overlap (logical conjunction) of the statistical contrast between the activity elicited by the right versus left visual field stimulus and the contrast between circle and ring in the left-lower visual field quadrant. We compared the selected target location to the eccentricity mapping results to verify that the target location referred to the presented stimuli at 6° eccentricity (Fig. 1C). The target location was then marked by a marker on the cortical surface to guide the neuronavigation (see below).
TMS neuronavigation.
For positioning of the TMS coil over the head, we used the BrainVoyager TMS Neuronavigation System (Brain Innovation) (Sack et al., 2009). This system uses ultrasound markers in 3D space to monitor the position of the coil relative to the participant's head. Ultrasound transmitters that continuously transmit pulses to a receiving sensor device are attached to the participant's head and to the TMS coil. Local spatial coordinate systems are created by linking the relative raw spatial position of the ultrasound senders to a set of fixed additional landmarks on the participant's head: the nasion and the two incisurae intertragicae. The specification of these fixed landmarks is achieved via a digitizing pen that also hosts two transmitting ultrasound markers to measure its relative position in 3D space. The neuronavigation system thus provides topographic information of the head-based transmitters relative to a participant-based coordinate frame. The same landmarks digitized on the participant's head are specified on the head reconstruction of the anatomical MR data to achieve TMS–MRI coregistration. After coregistration, events occurring around the head of the participant in real space are registered online and are visualized in real time at correct positions relative to the anatomical reconstruction of the participant's brain. The same system also permits the estimation of the distance between the center of the surface of the coil and the reconstruction of the cortical surface (coil-target distance) and the offset between the target location and the point of entry of the putative magnetic pulse “beam” on the cortical surface (beam-target distance). Through manual adjustment, we aimed to minimize these values during coil positioning and monitored these values for variations during the TMS pulse delivery. Thus, the use of fMRI-localizer-guided neuronavigation maximized the probability that the primary effect of the TMS pulses was in the target location in V1.
TMS.
Primed 1 Hz rTMS [known to suppress cortical excitability for at least 1 h (Iyer et al., 2003)] was applied to the right visual cortex ∼45 min after cessation of training on the first and second day, based on the individual fMRI localizer results using neuronavigation techniques (Sack et al., 2009). The biphasic TMS pulses were delivered using a figure-of-eight coil (MCB70) and a MagPro X100 stimulator (Medtronic Functional Diagnostics; maximum stimulator output, 1.9 T). The TMS protocol consisted of a priming phase and a low-frequency rTMS phase. In the priming phase, 20 trains of 30 pulses were presented at a frequency of 6 Hz (i.e., each pulse train lasted 5 s). Consecutive trains were separated by 25 s. In total, 600 pulses were delivered at an intensity of 45% maximum stimulator output. The following rTMS phase comprised 400 pulses presented at a frequency of 1 Hz, delivered at 50% maximum stimulator output.
Perceptual learning task.
Participants performed a visual orientation discrimination task in which they indicated whether a shown stimulus was tilted clockwise or counterclockwise with respect to a (never-shown) reference orientation of 135° (Orban et al., 1984). Stimuli consisted of Gabor patches (0.75 cycles/ ° spatial frequency, 50% Michelson contrast) that were presented in either the lower-left or upper-right visual field (3° diameter at 6° eccentricity) on a personal computer monitor (19 inch screen size, 60 Hz refresh rate, 1280 × 1024 pixel resolution) while participants were seated in a dimly lit room. Participants rested their head in a chinrest to stabilize head position relative to the stimulus monitor. A trial started with a blank screen, followed by presentation of a fixation dot at the middle of the screen. In the first 500 ms of presentation of the fixation dot, participants were expected to orient their eyes toward the fixation dot. This was followed by a 750 ms period in which accurate fixation would initiate another 250 ms period in which fixation was to be maintained, followed by a 500 ms presentation of the Gabor stimulus. Participants responded with their right index or middle finger, respectively, representing a counterclockwise or clockwise deviation from the reference orientation. The response window was 1000 ms. Participants received feedback on their response by brief coloring of the fixation dot (green for correct, red for incorrect). JNDs were determined using a Wetherill and Levitt staircase procedure (Wetherill and Levitt, 1965) tracking 84% correct, and JNDs were computed as the geometric average of the last 10 reversal points. Stimulus presentation and response recording were performed using Cortex (version 5.9.6; Cortex Software, National Institutes of Health freeware). Furthermore, we used eye-tracking software (Viewpoint EyeTracker version 2.8.3; Arrington Research) with an infrared eye camera (60 Hz sampling rate) to track fixation behavior of the participants. Trials with eye position deviations beyond 1.5° relative to the fixation dot were aborted and replaced by a new randomly generated trial. Trials in which no response was given were randomly replaced as well.
The protocol consisted of three training sessions scheduled on consecutive days. During each session, five staircases of the orientation discrimination task were performed for each of the two quadrants, tracking 84% correct performance. The quadrant order was counterbalanced across days/participants, that is, on the first day of learning, half of the participants started with the left-lower quadrant (i.e., completing the order LR–RL–LR across the 3 d) and the other half with the right-upper quadrant (completing the order RL–LR–RL across the 3 d). Staircases were terminated after 14 reversal points or when a total of 120 trials was reached (on average, ∼100 trials were performed per staircase). During the initial session, starting levels were fixed to ±15° deviations. On days 2 and 3, the starting levels were separately determined for both quadrants based on the average performance achieved on the previous day. In total, ∼30 min of training were spent on each quadrant per day.
Results
Effect of offline rTMS on learning indices
Figure 2 shows learning curves and learning indices of representative participants for the two testing orders in both the TMS (A, B) and control (C, D) groups. In each figure panel, testing day and quadrant testing order are shown on top. Line graphs show learning as a function of session for the two quadrants used (LT quadrant, solid line; RnT quadrant, dashed line), with JNDs normalized within quadrants to the average performance in the first session. In the bar graphs, gray bars (RnT quadrant) and black bars (LT quadrant) show learning indices quantifying relative improvement between consecutive sessions i − 1 and i by computing the following:
 |
A positive index thus indicates learning compared with the preceding session. The indices were computed to quantify learning from the first to second session (left of vertical stippled line) and learning from the second to third session (right from vertical stippled line). All five JNDs contributing to data points per session were used to compute the index, because there was no within-session learning. The absence of within-session learning was confirmed by testing whether, across participants (n = 13), the regression coefficients of the lines fitted to the five JNDs in each session were significantly negative (indicating a reduction of threshold size), which was not the case (t(38) = −1.7, p = 0.094). Positive colored bars (learning index RnT − learning index LT) show impairment of between-session learning in the LT quadrant.
Figure 2.
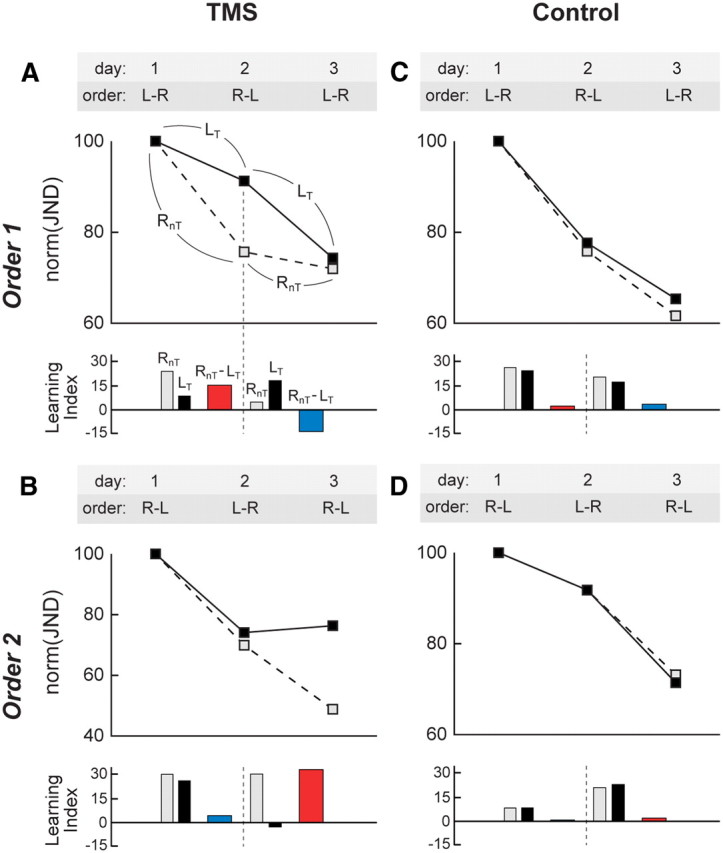
Interaction between TMS interference and learning order. Learning curves for representative TMS (A, B) and control (C, D) participants. Offline TMS hampers learning in the TMS quadrant (LT, solid lines) but not in the control quadrant (RnT, dashed lines) (A, B). Moreover, the time point of interference depends on the learning order: for the order 1 training scheme (L–R, R–L, L–R), the TMS-induced interference is clearly visible in session 2 (A); for the order 2 training scheme (R–L, L–R, R–L), interference only occurs in session 3 (B). The bar graphs in each of the panels show learning indices that quantify the relative improvement between consecutive sessions separately for both quadrants (RnT, gray bars; LT, black bars). Colored bars represent the differences in learning between the RnT and LT quadrant (after L–R training, red bars; after R–L training, blue bars). Conjointly, these findings indicate that the TMS intervention leads to spatially specific learning impairments that exclusively emerge when the targeted quadrant is trained first (i.e., after L–R sessions). Conversely, no differences were found between the left and right quadrant in either training order in the control participants (C, D). We propose that ending a training session with the RnT quadrant leads to an uncoupling of retinotopic regions representing the trained LT quadrant from high-level areas that help guide the plastic changes in these retinotopic regions leading to memory formation. This uncoupling may leave low-level areas representing the LT quadrant vulnerable to offline TMS interference (see Fig. 4). Average SEMs of normalized JNDs were 4.27, 6.26, 3.25, and 4.20, respectively, for plots A–D (not shown for clarity).
In Figure 2A, between-session learning after the first session was less strong in the LT quadrant (receiving TMS) compared with the RnT control quadrant, as witnessed by the higher JNDs in LT (filled symbol) compared with the RnT control quadrant (open symbol) in the second session. As a result, learning indices from session 1 to session 2 were higher in the RnT (gray bar) than in the LT (black bar) quadrant. However, after the second session, there was strong between-session learning in the LT quadrant because, during the third session, JNDs in the LT quadrant caught up with the level of JNDs in the RnT quadrant (despite the LT quadrant receiving TMS). Consequently, the learning index from session 2 to session 3 was lower in the RnT (gray bar) than in the LT (black bar) quadrant. In Figure 2B, between-session learning after the first session was approximately equally strong in the LT and RnT quadrants, as witnessed by the similar JNDs in the two quadrants during the second session. This resulted in very similar learning indices from session 1 to session 2 in the RnT (gray bar) and LT (black bar) quadrant. However, after the second session, there was no between-session learning in the LT quadrant, as revealed by stagnating JNDs in the LT quadrant during the third session (filled symbol), which were strongly elevated compared with JNDs of the third session in the RnT quadrant (open symbol). As a result, the learning index from session 2 to session 3 was lower in the LT quadrant (black bar) than in the RnT quadrant (gray bar). Hence, the TMS-induced slowing of acquisition in the LT quadrant was present only when TMS was administered after a session with an L–R training order (red bars). When TMS was applied after a session with an R–L training order (blue bars), there was no evidence of slowed acquisition.
Control experiments without TMS in different participants who performed the same training as participants subjected to TMS showed equal acquisition in the two quadrants, regardless of the training order. Figure 2, C and D, shows that JNDs decreased at a comparable rate as a function of session in both quadrants tested, resulting in similar learning indices in each quadrant (gray and black bars). The order of training did not appear to influence the learning rate in the two quadrants.
To test the effect of training order in the two groups statistically, the RnT − LT difference scores between learning indices were pooled over all participants in the TMS group (n = 7) within L–R order (Fig. 2, red bars) and within R–L order (Fig. 2, blue bars), and the same was done within the control group (n = 6) (Fig. 3). The difference scores quantify the learning impairment induced by TMS, with positive values indicating impairment. We then applied a mixed-effects repeated-measures ANOVA to the learning impairment indices (Fig. 3). As a between-subject factor, we used group (TMS, control), and as a within-subject factor, we used order (order 1, order 2). The analysis yielded a significant interaction effect of group × order (F(1,11) = 27.7, p < 0.001). This interaction was attributable to a significant reduction of learning in the LT quadrant for rTMS after L–R sessions (red bar; t(6) = 5.0, p = 0.002, one-sample t test), which was absent in the LT quadrant after R–L sessions (blue bar; t(6) = −1.0, p = 0.35) and also absent in the LnT quadrant of the control group for both training orders (after L–R, t(5) = −1.9, p = 0.11; after R–L, t(5) = 0.8, p = 0.49).
Figure 3.

Group-level TMS-induced learning impairment specific for L–R learning order. The bar graph shows a quantification of the TMS-induced learning impairment (defined as the difference between learning indices for the LT and RnT quadrant) when pooling the data across participants (TMS, n = 7; control, n = 6) according to the followed learning order (i.e., corresponding to a pooling of the red vs blue color-coded bars in Fig. 2). In the TMS group, learning is clearly impaired after L–R training (red bar), whereas TMS has no effect after R–L training (blue bar). In the control group, learning is very similar in both quadrants regardless of the followed training order. For interpretation, see Figure 4 and Discussion.
The differential effect of rTMS after R–L and L–R training orders in the TMS group was not attributable to a difference between training orders in the time elapsed from end of training to onset of rTMS in the LT quadrant. The presence of some variation in the precise timing of TMS among sessions and subjects allowed us to compute a correlation between these time intervals and the difference in learning impairments between training orders. This correlation was not significant (r = −0.04, p > 0.93), indicating that the different findings for the two training orders truly represent an order effect.
Verification of results using JNDs and learning indices
In the following two analyses, we verified that the previous findings were not an artifact of the compression of the data into the learning impairment index used in Figure 3. Therefore, in one analysis, we entered the log-transformed JNDs of each session of the TMS and control participants into a mixed-model repeated-measures ANOVA with group (TMS, control) and order (order 1, order 2) as between-subject factors and session (1, 2, or 3) and quadrant (LT, RnT) as within-subject factors. Results showed a significant main effect of session (F(2,18) = 237.0, p < 0.001) and significant interaction effects of session × order (F(2,18) = 4.4, p = 0.029), session × Group (F(2,18) = 6.7, p = 0.007), session × group × order (F(2,18) = 5.5, p = 0.014) and session × group × order × quadrant (F(2,18) = 4.4, p = 0.028). The main effect of session indicated that participants improved on their performance across the three sessions. The interaction effects indicated that participants of the TMS group, but not the control group, showed differential improvements between the two quadrants, which occurred at different moments in the learning curve depending on training order.
In another analysis, we performed a repeated-measures ANOVA of the learning indices, using as between-subject factors group and order and as within-subject factors learning period (after session 1, after session 2) and quadrant. The data that were entered in this analysis correspond to the gray and black bars in the bar graphs in Figure 2, i.e., before computing the learning impairment index RnT − LT. Results revealed significant interaction effects of learning period × group (F(1,9) = 21.0, p = 0.001), learning period × group × order (F(1,9) = 31.8, p < 0.001) and learning period × group × order × quadrant (F(1,9) = 24.9, p = 0.001). Thus, these interaction effects corroborate the repeated-measures ANOVA of the JNDs and thereby the effects reported in Figure 3.
Verification of between-session consolidation (offline learning)
In our main analyses, we quantified offline learning indices as the normalized difference between the average JNDs of consecutive learning sessions, thereby assuming that there was no improvement during training. This assumption is defensible because statistical analysis showed that the trend for within-session improvement was not significant. Conversely, a small trend seemed present, and therefore we reanalyzed the data estimating between-session improvement as the difference between the average of the last two JNDs of training session i − 1 and the average of the first two JNDs of session i:
 |
Here, higher positive values indicated more between-session improvement. We arranged these values according to training order and entered them into a repeated-measures ANOVA with factors quadrant (left, right), learning period (after session 1, after session 2), and group (TMS, control). Only the interaction term quadrant × learning period × group was significant (F(1,11) = 10.1, p = 0.009), which replicates the core finding shown in Figure 3.
Discussion
Our study presents three new findings. First, we present the first causal evidence for a behaviorally relevant contribution of low-level visual areas to offline consolidation in a visual skill learning task. Second, this contribution occurred surprisingly early in the time course of learning. Third, the contribution of early visual cortex depended on modulations in the offline brain state induced by the different training orders.
In light of two influential theories of perceptual learning, the early contribution of low-level sensory areas in skill consolidation may be qualified as unexpected. According to the “lowest-level ” theory (Karni and Bertini, 1997), consolidation processes induced by training on a specific stimulus parameter take place in the most low-level cortical areas that most efficiently encode that parameter. Here, we used an orientation discrimination task, and therefore consolidation is expected in low-level visual areas in which neurons show strong orientation tuning. Furthermore, lowest-level theory postulates that the greatest changes will occur late in learning when task demands exceed sensory limits. In a previous neurophysiological study in monkeys (Schoups et al., 2001), changes in orientation tuning were recorded in V1 neurons stimulated passively (stimuli ignored by the monkeys). These tuning changes were observed after lengthy orientation discrimination training and likely represent a memory trace that resulted from offline consolidation after training sessions in the asymptotic learning phase. We suggest that the finding of interference caused by rTMS during the offline period after training sessions early in learning is unlikely to reflect interference with the plastic processes that lead to modification of neuronal tuning properties in V1 or other low-level visual areas. This is because, in our experiment, no lengthy training has taken place that would have tested the limits of sensory encoding at the lowest levels in the visual system. Moreover, even if there had been a change in the automatic filtering properties of V1 neurons (as measured with ignored stimuli), this would not explain the conditional nature of the rTMS-induced interference.
According to reverse hierarchy theory (Ahissar and Hochstein, 2004), performance enhancements depend on higher-level areas establishing better access to increasingly more specific information at progressively lower levels in the visual system. Hence, the plasticity required to embed readout routines at increasingly lower levels in the visual system (consolidation) would occur toward the end of learning rather than at the beginning. Our data, in contrast, indicate that low-level visual areas are already accessed at the very beginning of learning. Therefore, there may not only be a late recruitment of low-level visual areas reflecting a specificity-driven process designed to gain access to detailed sensory information but also an early recruitment reflecting the setting up of synaptic connectivity in low-level areas for readout routines with the purpose of later fine-tuning (Li et al., 2004). We suggest that, because of this, large neural networks that include low- to high-level areas may play a role in offline consolidation from the beginning of learning (Lewis et al., 2009). Reports of changes in stimulus-driven activation observed with fMRI early in visual skill learning (Schwartz et al., 2002; Mukai et al., 2007; Yotsumoto et al., 2008), of reverberating activity in large functional networks after a learning experience (Hoffman and McNaughton, 2002; Ji and Wilson, 2007; Tambini et al., 2010), and of behavioral interference early in visual learning (Seitz et al., 2005) all support this possibility. Interfering input, such as delivered by TMS, may reset the synaptic weights of readout routines more easily when the network that maintains them is smaller (Buonomano and Maass, 2009) and does not include high-level areas that during offline consolidation may help strengthening the synaptic weights appropriate for the task (Fig. 4). In this view, training in the LT quadrant followed by RnT training before TMS leads to a brain state in which low-level areas representing the lower-left quadrant are uncoupled from high-level areas, thereby increasing the vulnerability of plastic processes in the low-level areas to TMS interference (Fig. 4, top row). Conversely, training in the LT quadrant after RnT training leads to a brain state in which low-level networks representing the lower-left quadrant remain coupled with high-level networks while TMS is delivered, thereby decreasing the vulnerability of processes in the low-level areas to TMS interference (Fig. 4, bottom row). We suggest this is why TMS directed to the lower-left quadrant interfered with consolidation and learning after an L–R, but not after an R–L, training order. Remarkably, the contribution of low-level visual areas to offline consolidation depended on contextual aspects in a manner unexpected for areas low in the visual hierarchy but in agreement with characteristics of early skill learning (Karni and Bertini, 1997; Ahissar and Hochstein, 2004).
Figure 4.

Graphical depiction of the proposed mechanism underlying the interaction between TMS and learning order. A, L–R learning order. In the first block (left), coupling between higher-order areas and early visual cortex (EVC) is stronger (represented by dark shading and arrow) in the right hemisphere (as a result of active processing of visual stimuli presented in the left hemifield). This more intense coupling then switches to the left hemisphere during the second block (right visual field stimulation; middle). Finally, the induced interareal coupling persists during the offline consolidation phase and is stronger in the hemisphere that was most recently involved in active task performance (right). Consequently, TMS to the (now uncoupled) right hemisphere is effective in disrupting ongoing consolidation processes. B, The same chain of events but now for the R–L training order. Here, TMS is not effective as the targeted visual cortex is still coupled to the higher-order areas in the functional network.
We have interpreted our data in light of a coupling between high- and low-level networks that protects a memory trace in low-level areas from TMS interference, and it is likely that attention is a factor that contributes to the instatement of this coupling. Several studies indicate that repeated exposure to stimuli that are not used in a task, or even presented outside visual awareness, can also produce memory traces (Watanabe et al., 2001, 2002; Gutnisky et al., 2009; for review, see Seitz and Watanabe, 2009). Mere exposure to stimuli produces bottom-up activity leading to memory traces that are likely limited to low-level sensory areas (Watanabe et al., 2002). Thus, if coupling between high- and low-level areas is the crucial factor protecting memory traces in low-level areas from TMS interference, then a large contribution of mere stimulus exposure to the consolidation process studied here is unlikely.
Recently, Cohen and Robertson (2011) reported that offline rTMS after a pair of tasks prevented retroactive interference by the second task on the first task. Specifically, when word list learning was followed by a motor task, subsequent offline TMS over dorsolateral prefrontal cortex decreased interference of the motor task onto the word task. Conversely, when motor learning was followed by word list learning, subsequent offline TMS over motor cortex decreased interference of the word list task onto the motor task. The reduced interference after TMS appears to contradict the increased interference after TMS reported in our study. However, in a control condition, Cohen and Robertson (2011) did report interference when TMS followed performance in a single task, in line with our own study. In our study, performance in a single type of task executed at one location did not interfere with performance when the same task was executed in another location (Fig. 2C,D), but under specific conditions TMS could interfere with consolidation of the task performed in one of the locations. Therefore, any TMS effect we reported after a single task cannot be related easily to the retroactive interference between different tasks and its reduction by TMS, as reported by Cohen and Robertson (2011). Nevertheless, both our own study and that of Cohen and Robertson (2011) show a state-dependent effect of TMS, which may differ between studies because of the nature of the network interactions that contribute to consolidation. Cohen and Robertson's (2011) data suggest an antagonistic form of interactions between two networks contributing to two tasks, which when abolished by TMS, restores consolidation and subsequent performance. In our study, we postulated a cooperative interaction between higher and lower levels of the sensory system, which when abolished or weakened by task conditions makes consolidation processes at lower levels more vulnerable to TMS interference.
Although TMS was directed to V1, the induced change in activity may have extended to other areas. Therefore, it could be argued that our results were attributable to remote TMS effects in distant network nodes that in turn would have secondarily affected early visual areas. If true, this would invalidate the interpretation of our data as revealing a behaviorally relevant contribution of low-level visual areas to skill consolidation in the earliest phases of learning. Remote activation changes via TMS have been described in several domains (Bestmann et al., 2004; Ruff et al., 2006; Sack et al., 2007; for review, see Reithler et al., 2011) and could have extended from V1 into V2 or V3. Nevertheless, significant behaviorally relevant remote effects of TMS to date have only been described in the top-down direction by direct stimulation of higher-order areas (Ruff et al., 2006). So far, there is no evidence that significant and behaviorally relevant top-down effects in higher-order areas can be induced indirectly by bottom-up effects caused by TMS stimulation of V1. More importantly, remote TMS-induced effects are state dependent in the sense that local increases in activation and interareal functional coupling induced by TMS are stronger when the targeted site belongs to an active network (Morishima et al., 2009; Blankenburg et al., 2010). Consequently, in our study, indirect remote effects in high-level areas induced by TMS to V1 should be strongest when low- and high-level areas are coupled. This was likely the case when the most recently trained retinotopic locus was targeted by TMS. Therefore, a learning impairment ascribed to remote TMS effects should be highest when the session ended with training in LT compared with when the session ended with training in RnT, yet we found the opposite.
In summary, our findings indicate that training-induced plasticity during early learning of visual discriminations can take place simultaneously in a large network incorporating the lowest levels of the visual hierarchy, including V1. Offline consolidation in early visual areas occurs early in the time course of learning and is behaviorally relevant, and its robustness is modulated by task context. These findings reveal a new and unexpected role of early visual cortex in visual skill learning.
Footnotes
P.D.W., V.v.d.V., and A.T.S. were financially supported by grants from the Netherlands Organization of Scientific Research (VENI to V.v.d.V., VIDI to A.T.S., and VICI to P.D.W.). We thank Diana Mussgens for help with data acquisition, Judith Peters for comments on this manuscript, and Dr. Cees van Leeuwen for assistance in medical screening of the TMS participants.
The authors declare no competing financial interests.
References
- Abel T, Lattal KM. Molecular mechanisms of memory acquisition, consolidation and retrieval. Curr Opin Neurobiol. 2001;11:180–187. doi: 10.1016/s0959-4388(00)00194-x. [DOI] [PubMed] [Google Scholar]
- Ahissar M, Hochstein S. Task difficulty and the specificity of perceptual learning. Nature. 1997;387:401–406. doi: 10.1038/387401a0. [DOI] [PubMed] [Google Scholar]
- Ahissar M, Hochstein S. The reverse hierarchy theory of visual perceptual learning. Trends Cogn Sci. 2004;8:457–464. doi: 10.1016/j.tics.2004.08.011. [DOI] [PubMed] [Google Scholar]
- Bestmann S, Baudewig J, Siebner HR, Rothwell JC, Frahm J. Functional MRI of the immediate impact of transcranial magnetic stimulation on cortical and subcortical motor circuits. Eur J Neurosci. 2004;19:1950–1962. doi: 10.1111/j.1460-9568.2004.03277.x. [DOI] [PubMed] [Google Scholar]
- Blankenburg F, Ruff CC, Bestmann S, Bjoertomt O, Josephs O, Deichmann R, Driver J. Studying the role of human parietal cortex in visuospatial attention with concurrent TMS-fMRI. Cereb Cortex. 2010;20:2702–2711. doi: 10.1093/cercor/bhq015. [DOI] [PMC free article] [PubMed] [Google Scholar]
- Buonomano DV, Maass W. State-dependent computations: spatiotemporal processing in cortical networks. Nat Rev Neurosci. 2009;10:113–125. doi: 10.1038/nrn2558. [DOI] [PubMed] [Google Scholar]
- Caithness G, Osu R, Bays P, Chase H, Klassen J, Kawato M, Wolpert DM, Flanagan JR. Failure to consolidate the consolidation theory of learning for sensorimotor adaptation tasks. J Neurosci. 2004;24:8662–8671. doi: 10.1523/JNEUROSCI.2214-04.2004. [DOI] [PMC free article] [PubMed] [Google Scholar]
- Cohen DA, Robertson EM. Preventing interference between different memory tasks. Nat Neurosci. 2011;14:953–955. doi: 10.1038/nn.2840. [DOI] [PMC free article] [PubMed] [Google Scholar]
- Doyon J, Benali H. Reorganization and plasticity in the adult brain during learning of motor skills. Curr Opin Neurobiol. 2005;15:161–167. doi: 10.1016/j.conb.2005.03.004. [DOI] [PubMed] [Google Scholar]
- Dudai Y. The neurobiology of consolidations, or, how stable is the engram? Annu Rev Psychol. 2004;55:51–86. doi: 10.1146/annurev.psych.55.090902.142050. [DOI] [PubMed] [Google Scholar]
- Engel SA, Glover GH, Wandell BA. Retinotopic organization in human visual cortex and the spatial precision of functional MRI. Cereb Cortex. 1997;7:181–192. doi: 10.1093/cercor/7.2.181. [DOI] [PubMed] [Google Scholar]
- Friston KJ, Holmes AP, Poline JB, Grasby PJ, Williams SC, Frackowiak RS, Turner R. Analysis of fMRI time-series revisited. Neuroimage. 1995;2:45–53. doi: 10.1006/nimg.1995.1007. [DOI] [PubMed] [Google Scholar]
- Gervan P, Kovacs I. Two phases of offline learning in contour integration. J Vis. 2010;10:24. doi: 10.1167/10.6.24. [DOI] [PubMed] [Google Scholar]
- Gilbert CD, Sigman M, Crist RE. The neural basis of perceptual learning. Neuron. 2001;31:681–697. doi: 10.1016/s0896-6273(01)00424-x. [DOI] [PubMed] [Google Scholar]
- Goebel R, Esposito F, Formisano E. Analysis of functional image analysis contest (FIAC) data with Brainvoyager QX: from single-subject to cortically aligned group general linear model analysis and self-organizing group independent component analysis. Hum Brain Mapp. 2006;27:392–401. doi: 10.1002/hbm.20249. [DOI] [PMC free article] [PubMed] [Google Scholar]
- Gutnisky DA, Hansen BJ, Iliescu BF, Dragoi V. Attention alters visual plasticity during exposure-based learning. Curr Biol. 2009;19:555–560. doi: 10.1016/j.cub.2009.01.063. [DOI] [PubMed] [Google Scholar]
- Hoffman KL, McNaughton BL. Sleep on it: cortical reorganization after-the-fact. Trends Neurosci. 2002;25:1–2. doi: 10.1016/s0166-2236(00)02005-1. [DOI] [PubMed] [Google Scholar]
- Iyer MB, Schleper N, Wassermann EM. Priming stimulation enhances the depressant effect of low-frequency repetitive transcranial magnetic stimulation. J Neurosci. 2003;23:10867–10872. doi: 10.1523/JNEUROSCI.23-34-10867.2003. [DOI] [PMC free article] [PubMed] [Google Scholar]
- Ji D, Wilson MA. Coordinated memory replay in the visual cortex and hippocampus during sleep. Nat Neurosci. 2007;10:100–107. doi: 10.1038/nn1825. [DOI] [PubMed] [Google Scholar]
- Karni A, Bertini G. Learning perceptual skills: behavioral probes into adult cortical plasticity. Curr Opin Neurobiol. 1997;7:530–535. doi: 10.1016/s0959-4388(97)80033-5. [DOI] [PubMed] [Google Scholar]
- Karni A, Sagi D. Where practice makes perfect in texture discrimination: evidence for primary visual cortex plasticity. Proc Natl Acad Sci USA. 1991;88:4966–4970. doi: 10.1073/pnas.88.11.4966. [DOI] [PMC free article] [PubMed] [Google Scholar]
- Karni A, Sagi D. The time course of learning a visual skill. Nature. 1993;365:250–252. doi: 10.1038/365250a0. [DOI] [PubMed] [Google Scholar]
- Karni A, Meyer G, Jezzard P, Adams MM, Turner R, Ungerleider LG. Functional MRI evidence for adult motor cortex plasticity during motor skill learning. Nature. 1995;377:155–158. doi: 10.1038/377155a0. [DOI] [PubMed] [Google Scholar]
- Kriegeskorte N, Goebel R. An efficient algorithm for topologically correct segmentation of the cortical sheet in anatomical mr volumes. Neuroimage. 2001;14:329–346. doi: 10.1006/nimg.2001.0831. [DOI] [PubMed] [Google Scholar]
- Lewis CM, Baldassarre A, Committeri G, Romani GL, Corbetta M. Learning sculpts the spontaneous activity of the resting human brain. Proc Natl Acad Sci USA. 2009;106:17558–17563. doi: 10.1073/pnas.0902455106. [DOI] [PMC free article] [PubMed] [Google Scholar]
- Lewis DJ. Psychobiology of active and inactive memory. Psychol Bull. 1979;86:1054–1083. [PubMed] [Google Scholar]
- Li W, Piëch V, Gilbert CD. Perceptual learning and top-down influences in primary visual cortex. Nat Neurosci. 2004;7:651–657. doi: 10.1038/nn1255. [DOI] [PMC free article] [PubMed] [Google Scholar]
- Linden DE, Kallenbach U, Heinecke A, Singer W, Goebel R. The myth of upright vision. A psychophysical and functional imaging study of adaptation to inverting spectacles. Perception. 1999;28:469–481. doi: 10.1068/p2820. [DOI] [PubMed] [Google Scholar]
- Morishima Y, Akaishi R, Yamada Y, Okuda J, Toma K, Sakai K. Task-specific signal transmission from prefrontal cortex in visual selective attention. Nat Neurosci. 2009;12:85–91. doi: 10.1038/nn.2237. [DOI] [PubMed] [Google Scholar]
- Mukai I, Kim D, Fukunaga M, Japee S, Marrett S, Ungerleider LG. Activations in visual and attention-related areas predict and correlate with the degree of perceptual learning. J Neurosci. 2007;27:11401–11411. doi: 10.1523/JNEUROSCI.3002-07.2007. [DOI] [PMC free article] [PubMed] [Google Scholar]
- Nader K, Schafe GE, LeDoux JE. The labile nature of consolidation theory. Nat Rev Neurosci. 2000;1:216–219. doi: 10.1038/35044580. [DOI] [PubMed] [Google Scholar]
- Orban GA, Vandenbussche E, Vogels R. Human orientation discrimination tested with long stimuli. Vision Res. 1984;24:121–128. doi: 10.1016/0042-6989(84)90097-x. [DOI] [PubMed] [Google Scholar]
- Reithler J, Peters JC, Sack AT. Multimodal transcranial magnetic stimulation: using concurrent neuroimaging to reveal the neural network dynamics of noninvasive brain stimulation. Prog Neurobiol. 2011;94:149–165. doi: 10.1016/j.pneurobio.2011.04.004. [DOI] [PubMed] [Google Scholar]
- Roelfsema PR, van Ooyen A, Watanabe T. Perceptual learning rules based on reinforcers and attention. Trends Cogn Sci. 2010;14:64–71. doi: 10.1016/j.tics.2009.11.005. [DOI] [PMC free article] [PubMed] [Google Scholar]
- Safety of TMS Consensus Group. Rossi S, Hallett M, Rossini PM, Pascual-Leone A. Safety, ethical considerations, and application guidelines for the use of transcranial magnetic stimulation in clinical practice and research. Clin Neurophysiol. 2009;120:2008–2039. doi: 10.1016/j.clinph.2009.08.016. [DOI] [PMC free article] [PubMed] [Google Scholar]
- Ruff CC, Blankenburg F, Bjoertomt O, Bestmann S, Freeman E, Haynes JD, Rees G, Josephs O, Deichmann R, Driver J. Concurrent TMS-fMRI and psychophysics reveal frontal influences on human retinotopic visual cortex. Curr Biol. 2006;16:1479–1488. doi: 10.1016/j.cub.2006.06.057. [DOI] [PubMed] [Google Scholar]
- Sack AT, Kohler A, Bestmann S, Linden DE, Dechent P, Goebel R, Baudewig J. Imaging the brain activity changes underlying impaired visuospatial judgments: simultaneous FMRI, TMS, and behavioral studies. Cereb Cortex. 2007;17:2841–2852. doi: 10.1093/cercor/bhm013. [DOI] [PubMed] [Google Scholar]
- Sack AT, Cohen Kadosh R, Schuhmann T, Moerel M, Walsh V, Goebel R. Optimizing functional accuracy of TMS in cognitive studies: a comparison of methods. J Cogn Neurosci. 2009;21:207–221. doi: 10.1162/jocn.2009.21126. [DOI] [PubMed] [Google Scholar]
- Sasaki Y, Nanez JE, Watanabe T. Advances in visual perceptual learning and plasticity. Nat Rev Neurosci. 2010;11:53–60. doi: 10.1038/nrn2737. [DOI] [PMC free article] [PubMed] [Google Scholar]
- Schoups AA, Vogels R, Orban GA. Human perceptual learning in identifying the oblique orientation: retinotopy, orientation specificity and monocularity. J Physiol. 1995;483:797–810. doi: 10.1113/jphysiol.1995.sp020623. [DOI] [PMC free article] [PubMed] [Google Scholar]
- Schoups A, Vogels R, Qian N, Orban G. Practising orientation identification improves orientation coding in V1 neurons. Nature. 2001;412:549–553. doi: 10.1038/35087601. [DOI] [PubMed] [Google Scholar]
- Schwartz S, Maquet P, Frith C. Neural correlates of perceptual learning: a functional MRI study of visual texture discrimination. Proc Natl Acad Sci USA. 2002;99:17137–17142. doi: 10.1073/pnas.242414599. [DOI] [PMC free article] [PubMed] [Google Scholar]
- Seitz AR, Watanabe T. The phenomenon of task-irrelevant perceptual learning. Vision Res. 2009;49:2604–2610. doi: 10.1016/j.visres.2009.08.003. [DOI] [PMC free article] [PubMed] [Google Scholar]
- Seitz AR, Yamagishi N, Werner B, Goda N, Kawato M, Watanabe T. Task-specific disruption of perceptual learning. Proc Natl Acad Sci USA. 2005;102:14895–14900. doi: 10.1073/pnas.0505765102. [DOI] [PMC free article] [PubMed] [Google Scholar]
- Sereno MI, Dale AM, Reppas JB, Kwong KK, Belliveau JW, Brady TJ, Rosen BR, Tootell RB. Borders of multiple visual areas in humans revealed by functional magnetic resonance imaging. Science. 1995;268:889–893. doi: 10.1126/science.7754376. [DOI] [PubMed] [Google Scholar]
- Tambini A, Ketz N, Davachi L. Enhanced brain correlations during rest are related to memory for recent experiences. Neuron. 2010;65:280–290. doi: 10.1016/j.neuron.2010.01.001. [DOI] [PMC free article] [PubMed] [Google Scholar]
- Watanabe T, Náñez JE, Sasaki Y. Perceptual learning without perception. Nature. 2001;413:844–848. doi: 10.1038/35101601. [DOI] [PubMed] [Google Scholar]
- Watanabe T, Náñez JE, Sr, Koyama S, Mukai I, Liederman J, Sasaki Y. Greater plasticity in lower-level than higher-level visual motion processing in a passive perceptual learning task. Nat Neurosci. 2002;5:1003–1009. doi: 10.1038/nn915. [DOI] [PubMed] [Google Scholar]
- Wetherill GB, Levitt H. Sequential estimation of points on a psychometric function. Br J Math Stat Psychol. 1965;18:1–10. doi: 10.1111/j.2044-8317.1965.tb00689.x. [DOI] [PubMed] [Google Scholar]
- Yotsumoto Y, Watanabe T, Sasaki Y. Different dynamics of performance and brain activation in the time course of perceptual learning. Neuron. 2008;57:827–833. doi: 10.1016/j.neuron.2008.02.034. [DOI] [PMC free article] [PubMed] [Google Scholar]
- Yotsumoto Y, Sasaki Y, Chan P, Vasios CE, Bonmassar G, Ito N, Náñez JE, Sr, Shimojo S, Watanabe T. Location-specific cortical activation changes during sleep after training for perceptual learning. Curr Biol. 2009;19:1278–1282. doi: 10.1016/j.cub.2009.06.011. [DOI] [PMC free article] [PubMed] [Google Scholar]