

Abstract
Pediatric mild traumatic brain injury (pmTBI) is the most prevalent neurological insult in children and is associated with both acute and chronic neurobehavioral sequelae. However, little is known about underlying pathophysiology and how injuries change as a function of recovery. Fractional anisotropy, axial diffusivity, and radial diffusivity were examined in 15 semi-acute pmTBI patients and 15 well-matched controls, with a subset of participants returning for a second visit. A novel analytic strategy was applied to capture spatially heterogeneous white matter injuries (lesions) in addition to standard analyses. Evidence of cognitive dysfunction after pmTBI was observed in the domains of attention (p = 0.02, d = −0.92) and processing speed (p = 0.05, d = −0.73) semi-acutely. Region of interest (ROI) and voxelwise analyses indicated increased anisotropic diffusion for pmTBI patients, with an elevated number of clusters with high anisotropy. Metrics of increased anisotropy were able to objectively classify pmTBI from healthy controls at 90% accuracy but were not associated with neuropsychological deficits. Little evidence of recovery in white matter abnormalities was observed over a 4-month interval in returning patients, indicating that physiological recovery may lag behind subjective reports of normality. Increased anisotropic diffusion has been previously linked with cytotoxic edema after TBI, and the magnitude and duration of these abnormalities appear to be greater in pediatric patients. Current findings suggest that developing white matter may be more susceptible to initial mechanical injury forces and that anisotropic diffusion provides an objective biomarker of pmTBI.
Introduction
In the United States alone, the rate of traumatic brain injury (TBI)-related emergency department visits was >600 per 100,000 for children <17 years of age (Faul et al., 2010), with ∼75% of these TBIs classified as mild in nature [pediatric mild TBI (pmTBI)]. A recent large prospective study (186 pmTBI patients) suggested that pmTBI patients were more likely to exhibit both somatic and cognitive symptoms relative to an orthopedic injury group, with cognitive symptoms persisting up to 12 months after injury (Yeates et al., 2012), with others suggesting more long-term deficits in academic achievements and interpersonal relationships (Keenan and Bratton, 2006). The vulnerabilities of the developing brain as well as the potential for recovery are unique (Giedd et al., 1999; Sowell et al., 2002; Giza et al., 2007) such that findings from adult TBI studies are not always applicable to children (Giza, 2006). Key distinctions including differential injury biomechanics (fall vs motor vehicle accident), different tissue mechanics (skull thickness, water content, and ongoing myelination), increased incidences of cerebral edema, increased susceptibility to diffuse white matter injuries, autodysregulation and the lack of maturity in excitatory neurotransmitter systems (Kochanek, 2006; Giza et al., 2007).
Accumulating evidence from both animal (Spain et al., 2010; Browne et al., 2011; Greer et al., 2011) and human autopsy (Blumbergs et al., 1994; Bigler and Maxwell, 2012) studies indicates axonal pathology after adult mTBI, which is better detected with diffusion tensor imaging (DTI) than by conventional imaging (Shenton et al., 2012). However, most pediatric DTI studies have examined moderate-to-severe (Hanten et al., 2008; Babikian et al., 2010; Oni et al., 2010; McCauley et al., 2011) or mixed (Akpinar et al., 2007; Wozniak et al., 2007; Galloway et al., 2008; Babikian et al., 2009) injury populations at more chronic injury times, reporting decreased fractional anisotropy (FA). Few studies have examined pmTBI during the semi-acute injury phase or prospectively. Wilde et al. (2008) reported increased FA and reduced radial diffusivity (RD) in the corpus callosum (CC) of semi-acute pmTBI relative to healthy controls (HC), with DTI scalars being associated with severity of postconcussive symptoms. Using a similar cohort, the same group reported marginal increases in FA in mTBI compared with HC and noted that FA of the left cingulum bundle correlated with delayed recall in the pmTBI group (Wu et al., 2010). In contrast, Maugans et al. (2012) reported no group differences for several DTI scalars measured in the CC and internal capsule (IC) during the acute to semi-acute in a sample of concussed pmTBI patients.
Based on past studies, we predicted there would be increased anisotropic diffusion (FA) during the semi-acute phase of injury and that these injuries would resolve during the normal course of recovery (3–5 months after injury). In addition, previous pediatric and adult DTI studies have made the implicit assumption that heterogeneous biomechanical forces produce homogeneous patterns of white matter abnormalities (i.e., there is a high degree of spatial overlap in injuries across patients). The validity of this assumption is questionable, motivating our recent adoption of a metric similar to lesion load (Ling et al., 2012b).
Materials and Methods
Participants.
Sixteen patients with pmTBI (14 males; 13.50 ± 2.13 years old; range, 10–17 years old; 6.94 ± 2.18 years of education), between the ages of 10 and 17, and 16 age- and education-matched HC (12 males; 13.19 ± 1.97 years old; range, 11–17 years old; 7.06 ± 1.98 years of education), were recruited for the current study. Data from one patient and one control was eliminated secondary to excessive motion. All pmTBI experienced a closed head injury with Glasgow Coma Score of 13–15, an alteration in mental status at the time of injury, a loss of consciousness <30 min, and posttraumatic amnesia limited to 24 h (for details on individual injury profiles, see Table 1). Ten patients had a negative computed tomography scan at initial hospital evaluation. Pediatric mTBI patients were evaluated with neuropsychological testing (mean days after injury, 15.33 ± 4.58) and brain imaging (mean days after injury, 15.87 ± 4.93) within 21 days of injury, with both sessions occurring in close temporal proximity (mean day difference, 0.33 ± 1.09). Exclusion criteria included a positive history of neurological disease, psychiatric disturbance, previous closed head injuries with >5 min of loss of consciousness, learning disorder, attention deficit hyperactivity disorder, substance abuse, or alcohol abuse. Informed consent was obtained from participants according to institutional guidelines at the University of New Mexico.
Table 1.
Patient injury information for final pmTBI sample
| Age (years) | Gender | Mechanism of injury | AAN Rating | Days after injury MRI | Days after injury NP |
|---|---|---|---|---|---|
| 12 | Male | SR | IIIb | 20 | 20 |
| 14 | Male | Fall | III | 20 | 19 |
| 12 | Male | Fall | IIIa | 8 | 8 |
| 15 | Male | SR | IIIa | 14 | 14 |
| 14 | Male | MVA | IIIa | 11 | 12 |
| 16 | Male | MVA | IIIb | 19 | 20 |
| 17 | Male | SR | II | 15 | 15 |
| 12 | Male | Fall | IIIa | 17 | 17 |
| 12 | Male | Fall | IIIb | 21 | 21 |
| 10 | Male | SR | IIIa | 18 | 18 |
| 10 | Female | SR | II | 7 | 7 |
| 14 | Male | SR | II | 18 | 14 |
| 14 | Male | SR | IIIa | 9 | 9 |
| 17 | Female | SR | II | 20 | 17 |
| 13 | Male | SR | II | 21 | 19 |
MVA, Motor vehicle accident; SR, sports/activity related; AAN, American Academy of Neurology; NP, neuropsychological testing; II, no loss of consciousness and symptoms of confusion last longer than 15 min; IIIa, brief loss of consciousness (measured in seconds); IIIb, prolonged loss of consciousness (measured in minutes).
Clinical assessment.
Raw test scores were converted to T scores (mean ± SD, 50 ± 10) using published age-specific norms. Composite indices were calculated for the domains of attention, memory, processing speed, working memory, and executive function (Yang et al., 2012). The Wide Range Achievement Test, Fourth Edition (WRAT-IV) Word Reading Test provided an estimate of premorbid intellectual functioning. Behavioral and emotional issues were measured by Self-Report of Personality (SRP) and Parent-Rating Scales (PRS) of the Behavior Assessment System for Children, Second Edition (Reynolds and Kamphaus, 2004). A modified version of the Rivermead Post-Concussion Scale was administered to capture previous history of head injuries.
Image acquisition and statistical analyses.
High-resolution T1-weighted anatomic images were acquired with a five-echo multi-echo MPRAGE sequence (voxel size, 1.00 × 1.00 × 1.00 mm) on a 3 tesla Siemens scanner. T2-weighted images were collected with a fast spin echo sequence (voxel size, 1.15 × 1.15 × 1.5 mm). Susceptibility weighted images (SWIs) were also collected using a gradient echo sequence (TR, 28 ms; TE, 20 ms; flip angle, 15°; bandwidth, 120 Hz/pixel; FOV, 180 × 240 mm; matrix, 177 × 256; slice thickness, 1.5 mm; number of slices per slab, 88) to better characterize petechial hemorrhages. A single run of diffusion weighted images (b = 800 s/mm2; voxel size, 2 × 2 × 2 mm) were acquired using a twice-refocused spin echo sequence with 30 diffusion gradients, and the b = 0 experiment was repeated five times.
DTI analyses were performed using a mixture of AFNI (Automated Functional Neuro-Imaging) and FSL (FMRIB Software Library) software, and analyses were identical to our most recent publication (Ling et al., 2012b). A priori ROIs were selected based on previous publications in semi-acute pmTBI (Wilde et al., 2008; Chu et al., 2010; Maugans et al., 2012) and our adult samples (Ling et al., 2012b). ROIs included the genu, splenium and body of the CC, the corona radiata [anterior (ACR) and superior (SCR)], cingulum, combined anterior and posterior limbs of the IC, and the cerebral peduncles (CP) for both the right and left hemispheres. ROIs were obtained based on the intersection of the Johns Hopkins University (JHU) white matter labels atlas from FSL (Mori and van Zijl, 2007) and each participant's white matter tracts (i.e., a T1 image-segmented white matter mask). Multivariate tests were selected for ROI analyses as a result of known correlations both within and across hemispheric white matter tracts.
Two different voxelwise analyses were also performed to test our prediction of a null finding. In the first analysis, each subject's FA data were nonlinearly aligned [using FNIRT (FMRIB Linear Image Registration Tool) from the FSL package] to a whole-brain FA template (FMRIB58_FA) and then blurred with a 6 mm FWHM kernel before group analyses. To reduce the number of comparisons and restrict the analysis to white matter, all data were masked by the group FA mask (values ≥0.25). For the second voxelwise analyses [tract-based spatial statistics (TBSS)], each subject's FA data were aligned to a skeleton, and all groupwise comparisons were also restricted to the skeleton (Smith et al., 2006). For both voxelwise analyses, a permutation-based method (FSL Randomize) was used for group comparisons in conjunction with threshold-free cluster enhancement to correct for familywise error (p < 0.05).
As noted previously, the initial mechanical forces causing injury vary across patients, likely leading to regional variation in white matter microstructural damage and subsequent “anatomical disconnection.” Therefore, to better classify the spatially heterogeneous nature of diffuse white matter injury, the mean and SD of FA was first calculated for each voxel from the spatially normalized (whole-brain FA template) pooled sample of matched HC (n = 15). Next, individual subject data (both pmTBI and matched HC) were transformed to signed z scores on a voxelwise basis using the calculated means and SDs from the overall HC sample. Individual subject z-score maps were then thresholded based on 2 SDs above (z ≥ 2) or below (z ≤ −2) the HC mean and masked by both the JHU atlas and the subject's FA (FA ≥ 0.25). To reduce the likelihood of false positives, contiguous voxels were required to form a cluster with a minimum of 16 native voxels (128 μl), which is similar in volume to a magnetic resonance visible lesion. The total number of abnormal clusters and the associated total voxel count (total volume across all clusters) were then calculated by summing across all white matter tracts separately for abnormally high or low diffusion criteria to derive a metric of diffusion abnormalities similar to lesion load. A constant (0.50) was then added to all data (count and volume), followed by a square root transformation to more closely approximate a normal distribution.
Results
Visit 1 clinical data
There were no differences between groups on major demographic variables (all p values >0.10) except for parent education (t(25) = −1.99, p = 0.06), with the parents of HC having a higher education than the pmTBI group (Table 2). There were also no significant group differences (p > 0.10) in reading abilities (WRAT-IV) or history of previous head injuries between pmTBI (2 of 15) and HC (4 of 15).
Table 2.
Demographic and clinical data for pmTBI and HC participants
| pmTBI |
HC |
p value | Effect size | |||
|---|---|---|---|---|---|---|
| Mean | SD (±) | Mean | SD (±) | |||
| Demographic | ||||||
| Age | 13.47 | 2.20 | 13.40 | 1.84 | p > 0.10 | 0.03 |
| Education (self) | 6.87 | 2.23 | 7.27 | 1.87 | p > 0.10 | −0.19 |
| Education (parent)* | 13.18 | 2.59 | 15.62 | 3.71 | p = 0.06 | −0.76 |
| Siblings | 2.43 | 1.91 | 2.73 | 1.98 | p > 0.10 | −0.15 |
| Gender | Male | Female | Male | Female | p value | Phi |
| 13 | 2 | 12 | 3 | p > 0.10 | −0.09 | |
| Handedness | Right | Left | Right | Left | p value | Phi |
| 13 | 2 | 15 | 0 | p > 0.10 | 0.27 | |
| Neuropsych | ||||||
| Attention* | 52.31 | 5.40 | 56.54 | 3.65 | p = 0.02 | −0.92 |
| Memory | 52.82 | 9.94 | 58.11 | 7.61 | p > 0.10 | −0.59 |
| Working memory | 48.77 | 7.34 | 51.50 | 7.36 | p > 0.10 | −0.37 |
| Processing speed* | 49.07 | 7.93 | 54.17 | 5.81 | p = 0.05 | −0.73 |
| Executive function | 53.37 | 7.54 | 52.78 | 5.04 | p > 0.10 | 0.09 |
| WRAT | 51.87 | 11.69 | 52.84 | 5.82 | p > 0.10 | −0.11 |
| BASC-2 SRP | ||||||
| School | 51.07 | 11.32 | 48.00 | 11.03 | p > 0.10 | 0.27 |
| Internalizing | 46.47 | 9.58 | 43.07 | 8.31 | p > 0.10 | 0.38 |
| Inattention | 53.47 | 14.63 | 47.07 | 11.49 | p > 0.10 | 0.49 |
| Emotional | 45.33 | 9.25 | 43.67 | 9.16 | p > 0.10 | 0.18 |
| Adjustment | 55.40 | 8.40 | 54.73 | 11.17 | p > 0.10 | 0.07 |
| BASC-2 PRS | ||||||
| Externalizing | 51.93 | 11.01 | 52.00 | 8.04 | p > 0.10 | −0.01 |
| Internalizing | 49.36 | 8.68 | 50.79 | 8.60 | p > 0.10 | −0.17 |
| Behavioral | 50.00 | 10.38 | 51.43 | 8.11 | p > 0.10 | −0.15 |
| Adaptive | 53.79 | 10.98 | 50.64 | 6.57 | p > 0.10 | 0.35 |
Effect sizes are Cohen's d unless denoted by Phi. BASC-2, Behavior Assessment System for Children, Second Edition. Demographic data are raw scores, whereas neuropsychological measures and BASC-2 measures are T scores. Asterisks denote significance.
A multivariate ANOVA (MANOVA) was performed to examine differences in cognition to account for correlations between neuropsychological domains (r = −0.22 to 0.41 in current sample). The multivariate effect of group was not significant (p > 0.10). Additional univariate analyses and estimations of effect sizes were performed to address concerns about power. Univariate tests suggested evidence of cognitive dysfunction in the domains of attention (F(1,28) = 6.34, p = 0.02, d = −0.92) and processing speed (F(1,28) = 4.04, p = 0.05, d = −0.73) for pmTBI patients, with moderate effect size also present for memory functioning (d = −0.59).
MANOVAs on SRP and PRS were not significant (all p values >0.10), with univariate tests also not significant (all p values >0.10).
Quality assurance
Two raters (AP and SK) visually inspected each subject's data to identify images that were associated with artifacts through a binary rating system (i.e., 0 = no artifact; 1 = artifact). The number of artifacts identified through manual inspection was not statistically different across the two groups (p > 0.10) using a nonparametric independent samples test. Because head motion also introduces bias among DTI scalar measurements (Storey et al., 2007; Ling et al., 2012a), two MANOVAs were performed to determine whether patients with mTBI exhibited either greater translational or rotational head motion. The multivariate effect of group was not significant for either analyses, with relatively small effect sizes across all six parameters (Cohen's d range = −0.15 to 0.18).
Visit 1 DTI results
All (HC and mTBI) anatomical scans (T1, T2, and SWI) did not contain trauma-related pathology per a board-certified neuroradiologist blinded to diagnostic status.
Three MANOVAs were performed to examine group differences in FA within the CC and selected left and right hemisphere tracts (Fig. 1). Although the multivariate effect of group was not significant for the CC or right hemisphere white matter tracts (p > 0.10), a significant univariate effect was observed in the right ACR (F(1,28) = 5.08, p = 0.03, d = 0.82). The multivariate effect of group was significant for the left hemisphere white matter tracts (F(5,24) = 2.87, p = 0.04). Significant univariate effects of group were observed within the left ACR (F(1,28) = 6.94, p = 0.01, d = 0.96) and left CP (F(1,28) = 5.14, p = 0.03, d = 0.83), with a nonsignificant trend for the left SCR (F(1,28) = 4.12, p = 0.052, d = 0.74). Across all structures, mean FA was elevated for the pmTBI group. Follow-up tests indicated that RD was decreased for pmTBI subjects within the left (F(1,28) = 5.83, p = 0.02, d = −0.88) and right (F(1,28) = 5.16, p = 0.03, d = −0.83) ACR, with nonsignificant trends in the left SCR (F(1,28) = 3.47, p = 0.07, d = −0.68) and left CP (F(1,28) = 4.09, p = 0.053, d = −0.74), with no differences in AD (p > 0.10).
Figure 1.

This figure presents the FA values from all ROIs for the pmTBI patients (red) and HC (blue) for visit 1. ROIs included the genu (GNU), body (BDY), and splenium (SPL) of the CC, SCR, ACR, the cingulum bundle (CG), CP, and IC (A–C). Significant effects are denoted with double asterisks, statistical trends with a single asterisk. D and E present axial diffusivity (AD) and RD values for ROIs that exhibited significant or trend effects, with the y-axis scaled according to millimeters squared per second. Box and whisker plots are used to represent the median and one and a half times the interquartile range.
Voxelwise analyses indicated increased FA for pmTBI within the bilateral CP, SCR, anterior and posterior limbs of the IC, right ACR, and right superior longitudinal fasciculus (Fig. 2). TBSS results indicated increased FA within multiple bilateral white matter structures, including the SCR, anterior and posterior limbs of the IC, CP, ACR, posterior corona radiata, posterior thalamic radiation, anterior thalamic radiation, superior longitudinal fasciculus, external capsule, and sagittal stratum. Increased FA was also observed in the body, genu, and splenium of the CC as well as right cerebral spinal tract, forceps major, fornix, and left medial lemniscus.
Figure 2.
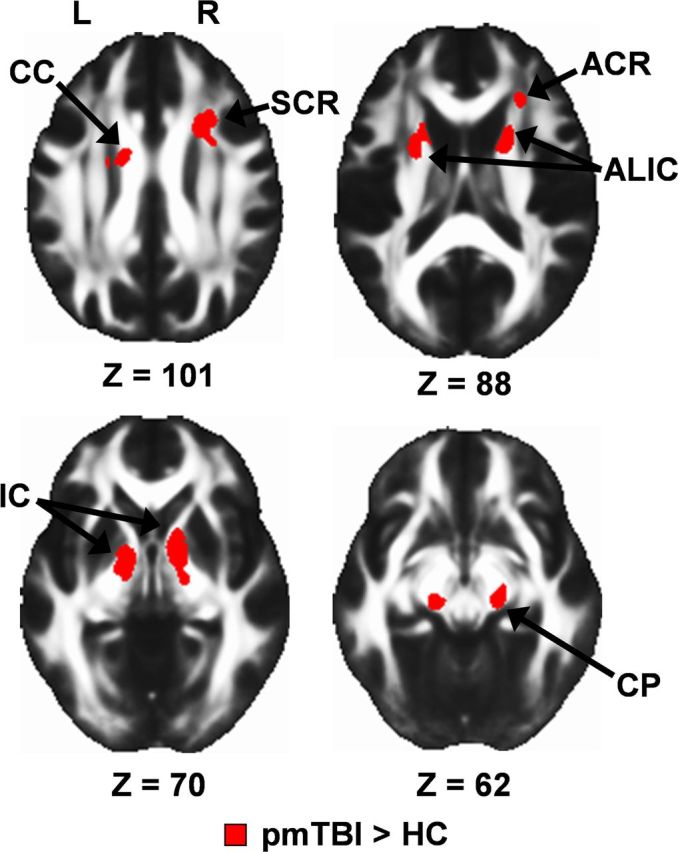
Whole-brain voxelwise results for visit 1 data, presented on an average FA template in Montreal Neurological Institute space (axial slice locations = Z). Selected regions showing increased FA for the pmTBI patients relative to the matched HC included the CC, ACR, SCR, anterior limb of the internal capsule (ALIC), IC, and CP. L, Left; R, right.
Next we directly compared metrics of lesion load for clusters with both high and low anisotropy across pmTBI patients and HC. Although the cluster metrics were based on the first two statistical moments from the HC data, a comparison of deviations from normality (here defined by a z score of 2) is still possible on a groupwise basis. Clusters metrics were significant (mTBI > HC) for both the number of clusters with high anisotropy (t(28) = 7.27, p < 0.00001, d = 2.7) and total cluster volume (t(28) = 6.98, p < 0.00001, d = 2.6; Fig. 3). In contrast, there were no differences between HC and pmTBI patients in terms of clusters exhibiting especially low anisotropy (p > 0.10). Although the correlation between the number of clusters and total volume was significant for HC (ρ = 0.96, p < 0.00001) and pmTBI (ρ = 0.69, p = 0.005), both metrics were used in clinical analyses to evaluate differential sensitivity.
Figure 3.
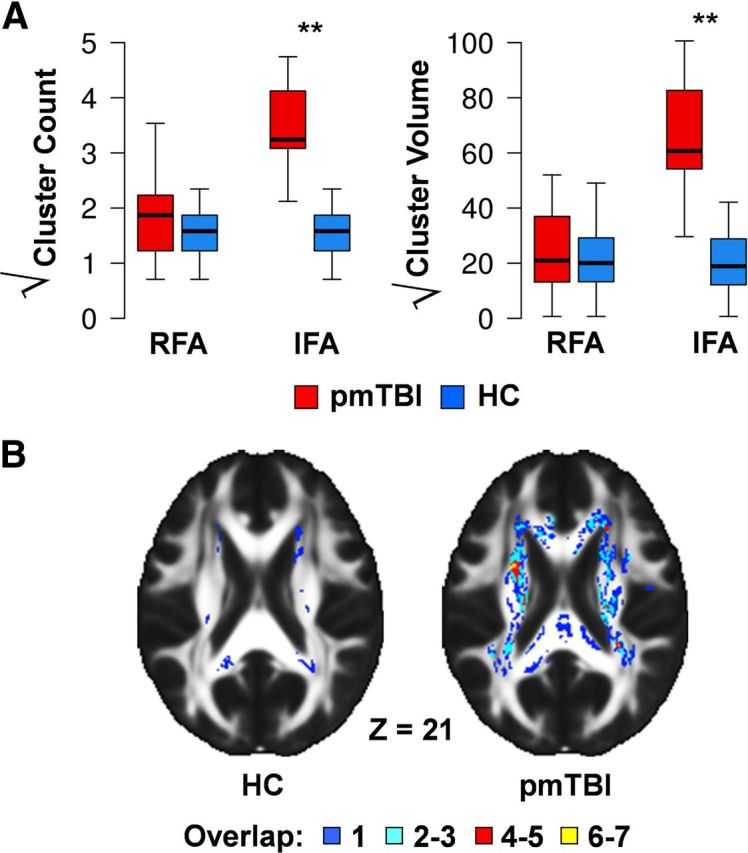
A presents box plots of cluster metrics that exceed 2 SDs from the HC mean. Specifically, both the number and volume of clusters (minimum of 0.128 ml) that were either two z scores below [reduced FA (RFA)] or two z scores above [increased FA (IFA)] the HC mean were calculated on a voxelwise basis. Each measure was square root transformed to improve normality, and data are presented for both pmTBI patients (red) and HC (blue). Significant effects are denoted with double asterisks. Box and whisker plots are used to represent the median and one and a half times the interquartile range. B displays the distribution of lesions with increased FA summed across participants from both the HC and pmTBI samples selected from a representative slice in Talairach space (Z = 21).
Exploratory analyses
The potential relationships between measures of increased FA (ROIs showing significant or trend effects or positive cluster metrics) and decreased cognitive performance in the domains of attention and processing speed were assessed using separate multiple regressions for pmTBI patients only. However, neither regression was significant (p > 0.10). Next, two binary logistic regressions were conducted to assess the ability of these measures of increased FA to objectively classify patients and controls. Results indicated that the cluster metrics of increased FA (cluster number and volume) were able to successfully classify 14 of 15 HC and 13 of 15 pmTBI patients (overall 90% accuracy). The four ROIs showing significant or trend effects of increased FA were able to successfully classify 13 of 15 HC and 14 of 15 pmTBI patients (overall 90% accuracy).
Exploratory analyses were also conducted to compare FA from all 48 ROIs in the JHU atlas (Table 3) given the variable results on FA that have been reported in the pediatric and adult literature (Maugens, Wilde, Shenton et al., 2012). A sign test was first conducted to examine deviation from a binomial distribution, with results indicating that 45 of 48 regions showed some evidence of increased FA (TBI > HC; p < 0.001). Twelve regions exhibited effect sizes >0.60, with five regions showing significant group differences (p < 0.05) and another five associated with nonsignificant trends (p ranged from 0.05 to 0.10).
Table 3.
Summary statistics of FA values for time 1 for all 48 ROIs from the JHU atlas
| pmTBI FA mean (SEM) | HC FA mean (SEM) | Cohen's d | Uncorrected p value | pmTBI clusters* | HC clusters* | |
|---|---|---|---|---|---|---|
| Middle cerebellar peduncle | 0.51 (0.006) | 0.48 (0.007) | 0.92 | 0.018 | 13 | 2 |
| Pontine crossing tract | 0.52 (0.017) | 0.50 (0.015) | 0.36 | 0.332 | 4 | 0 |
| Genu of corpus callosum | 0.62 (0.011) | 0.60 (0.012) | 0.35 | 0.350 | 11 | 5 |
| Body of corpus callosum | 0.67 (0.011) | 0.66 (0.009) | 0.47 | 0.212 | 14 | 5 |
| Splenium of corpus callosum | 0.67 (0.010) | 0.65 (0.015) | 0.47 | 0.208 | 9 | 3 |
| Fornix | 0.37 (0.024) | 0.36 (0.014) | 0.11 | 0.764 | 0 | 0 |
| Corticospinal tract | ||||||
| R | 0.44 (0.011) | 0.42 (0.008) | 0.66 | 0.084 | 3 | 0 |
| L | 0.45 (0.008) | 0.42 (0.019) | 0.58 | 0.122 | 5 | 1 |
| Medial lemniscus | ||||||
| R | 0.41 (0.027) | 0.37 (0.036) | 0.36 | 0.337 | 1 | 0 |
| L | 0.43 (0.030) | 0.40 (0.030) | 0.26 | 0.485 | 1 | 0 |
| Inferior cerebellar peduncle | ||||||
| R | 0.35 (0.015) | 0.35 (0.014) | −0.02 | 0.951 | 3 | 0 |
| L | 0.35 (0.013) | 0.35 (0.013) | 0.15 | 0.691 | 3 | 0 |
| Superior cerebellar peduncle | ||||||
| R | 0.52 (0.018) | 0.49 (0.017) | 0.47 | 0.208 | 1 | 0 |
| L | 0.53 (0.018) | 0.51 (0.017) | 0.30 | 0.418 | 0 | 0 |
| Cerebral peduncle | ||||||
| R | 0.60 (0.013) | 0.59 (0.011) | 0.29 | 0.439 | 7 | 0 |
| L | 0.63 (0.011) | 0.58 (0.020) | 0.83 | 0.031 | 7 | 0 |
| Anterior limb of internal capsule | ||||||
| R | 0.44 (0.017) | 0.41 (0.015) | 0.39 | 0.290 | 12 | 2 |
| L | 0.40 (0.015) | 0.38 (0.013) | 0.29 | 0.440 | 10 | 2 |
| Posterior limb of internal capsule | ||||||
| R | 0.60 (0.013) | 0.58 (0.007) | 0.39 | 0.299 | 10 | 2 |
| L | 0.62 (0.013) | 0.60 (0.010) | 0.57 | 0.128 | 10 | 1 |
| Retrolenticular part of internal capsule | ||||||
| R | 0.56 (0.008) | 0.54 (0.008) | 0.62 | 0.101 | 10 | 1 |
| L | 0.59 (0.006) | 0.58 (0.011) | 0.31 | 0.408 | 8 | 2 |
| Anterior corona radiata | ||||||
| R | 0.46 (0.007) | 0.43 (0.007) | 0.82 | 0.032 | 14 | 5 |
| L | 0.44 (0.005) | 0.41 (0.009) | 0.96 | 0.014 | 9 | 5 |
| Superior corona radiata | ||||||
| R | 0.49 (0.009) | 0.47 (0.006) | 0.52 | 0.163 | 14 | 5 |
| L | 0.52 (0.006) | 0.50 (0.006) | 0.74 | 0.052 | 13 | 7 |
| Posterior corona radiata | ||||||
| R | 0.50 (0.011) | 0.49 (0.010) | 0.36 | 0.338 | 12 | 3 |
| L | 0.52 (0.008) | 0.50 (0.009) | 0.74 | 0.053 | 10 | 2 |
| Posterior thalamic radiation | ||||||
| R | 0.57 (0.011) | 0.56 (0.013) | 0.37 | 0.317 | 9 | 3 |
| L | 0.59 (0.009) | 0.59 (0.011) | −0.01 | 0.975 | 8 | 1 |
| Sagittal stratum | ||||||
| R | 0.50 (0.009) | 0.49 (0.014) | 0.22 | 0.551 | 6 | 1 |
| L | 0.51 (0.010) | 0.49 (0.016) | 0.41 | 0.271 | 8 | 0 |
| External capsule | ||||||
| R | 0.43 (0.008) | 0.42 (0.008) | 0.42 | 0.264 | 11 | 2 |
| L | 0.44 (0.006) | 0.42 (0.008) | 0.59 | 0.119 | 9 | 4 |
| Cingulum (cingulate gyrus) | ||||||
| R | 0.50 (0.015) | 0.49 (0.017) | 0.18 | 0.633 | 2 | 0 |
| L | 0.56 (0.013) | 0.55 (0.020) | 0.10 | 0.788 | 7 | 1 |
| Cingulum (hippocampus) | ||||||
| R | 0.24 (0.012) | 0.28 (0.011) | 0.57 | 0.129 | 0 | 0 |
| L | 0.23 (0.008) | 0.21 (0.009) | 0.46 | 0.215 | 0 | 1 |
| Fornix (cres)/stria terminalis | ||||||
| R | 0.32 (0.014) | 0.30 (0.012) | 0.38 | 0.304 | 2 | 0 |
| L | 0.33 (0.017) | 0.34 (0.013) | −0.13 | 0.736 | 1 | 0 |
| Superior longitudinal fasciculus | ||||||
| R | 0.46 (0.003) | 0.45 (0.007) | 0.59 | 0.117 | 8 | 2 |
| L | 0.49 (0.006) | 0.48 (0.008) | 0.61 | 0.107 | 10 | 2 |
| Superior fronto-occipital fasciculus | ||||||
| R | 0.58 (0.01) | 0.56 (0.008) | 0.55 | 0.141 | 10 | 1 |
| L | 0.60 (0.011) | 0.57 (0.011) | 0.85 | 0.028 | 10 | 2 |
| Uncinate fasciculus | ||||||
| R | 0.45 (0.013) | 0.44 (0.011) | 0.20 | 0.587 | 2 | 0 |
| L | 0.48 (0.01) | 0.45 (0.010) | 0.74 | 0.052 | 3 | 0 |
| Tapetum | ||||||
| R | 0.62 (0.024) | 0.57 (0.029) | 0.45 | 0.224 | 4 | 1 |
| L | 0.56 (0.023) | 0.49 (0.025) | 0.72 | 0.060 | 3 | 0 |
Right (R) and left (L) hemisphere tracts are also denoted.
*Cluster columns indicate number of subjects who had a cluster of z score ≥2.0 within the ROI.
Visit 2 clinical data
Of the 30 participants included in visit 1 analyses, 11 of 15 pmTBI (one female, 10 males; 13.82 ± 2.27 years old; 7.27 ± 2.37 years of education) and 12 of 15 HC (three females, nine males; 13.58 ± 1.93 years old; 7.42 ± 1.98 years of education) returned for visit 2 ∼3–5 months (mean days after, 127.82 ± 14.60 for pmTBI patients) after initial screening. One returning patient and one control were identified as outliers in motion analyses, and one control exhibited artifacts in all gradient weighted images (final sample of 10 pmTBI and 10 HC).
Intraclass correlations were small to moderate for both attention (0.31) and processing speed (0.45) in the 10 matched HC. A 2 × 2 mixed-measures MANOVA was conducted to determine whether clinical measures exhibiting trend group differences at visit 1 (indices of attention and processing speed) showed a significant change at visit 2. However, neither the multivariate effect of group nor the group × time interaction was significant (p > 0.10), with univariate tests also yielding nonsignificant results.
Visit 2 DTI results
Similar to visit 1 data, there were no significant differences between groups in terms of images with artifacts for visit 2 data (p > 0.10). The multivariate effect of group was not significant for translational analysis of motion parameters (p > 0.10), although a trend was noted for rotational analyses (F(3,16) = 2.62, p = 0.09).
Our primary longitudinal analyses focused on ROI and cluster metrics that exhibited groupwise differences during the semi-acute stage of injury. Intraclass correlations were moderate to excellent for ROIs (right ACR, 0.52; left ACR, 0.90; left CP, 0.69; left SCR, 0.83), whereas cluster metrics reliability was smaller (cluster number, 0.38; cluster volume, 0.32) for the 10 matched HC. A 2 × 2 (group × time) mixed-measures MANOVA was performed to assess recovery of function in the pmTBI group within ROIs that exhibited significant or trend differences in FA at visit 1. The multivariate effect of group was a nonsignificant trend (F(4,15) = 2.47, p = 0.09), with univariate analyses indicating significantly increased FA for the mTBI patients for most ROIs (all p values <0.05), with the exception of the left ACR (p = 0.07; Fig. 4). Similarly, the multivariate effect of group was significant (F(2,17) = 15.67, p < 0.0001) for cluster metrics of increased FA, with significant univariate effects for both metrics (p values <0.05). The main effect of time and the group × time interaction were not significant in either analysis.
Figure 4.

A depicts mean FA for returning pmTBI patients (red) and HC (blue) at both visit 1 and visit 2 (pmTBI, yellow; HC, green). Values from ROIs that exhibited either significant or trend differences during visit 1 were examined for longitudinal changes, including the left and right ACR (ACR_L, ACR_R), left CP (CP_L), and left SCR (SCR_L). B displays the longitudinal data for cluster metrics showing increased FA (IFA; for detailed explanation, see Fig. 3) using identical color coding. Box and whisker plots are used to represent the median and one and a half times the interquartile range. For all comparisons, the main effect of group was either significant or at trend levels [pmTBI (red + yellow) > HC (blue + green)] in conjunction with no significant interactions.
An identical 2 × 2 longitudinal voxelwise analysis was also negative for all effects after corrections for familywise error.
Discussion
Late childhood and adolescence constitutes a critical time for brain development (Giedd et al., 1999; Sowell et al., 2002), and the impact of pmTBI on neurophysiological functioning remains actively debated (Anderson et al., 2001). In the current study, subtle cognitive deficits were observed in the domains of attention and processing speed during the semi-acute phase of injury, with no evidence of group differences at follow-up. Although others have reported more striking long-term neurobehavioral sequelae (Yeates et al., 2012), current results are generally consistent with previous longitudinal studies suggesting that pmTBI patients exhibit cognitive impairments [ImPACT testing (Immediate Post-Concussion Assessment and Cognitive Testing)] that typically normalize in the first few weeks of injury (Maugans et al., 2012). Current results also indicate widespread evidence of increased anisotropic diffusion both during the semi-acute and more chronic phases of pmTBI, when neurobehavioral symptoms have typically resolved for the majority of patients. The magnitude of diffusion effects were larger than the magnitude of the cognitive deficits revealed by neuropsychological testing, as evidenced by the ability of diffusion metrics to accurately classify mTBI patients and controls in 90% of the cases. Finally, the relationship between cognitive deficits and diffusion abnormalities was weak, suggesting that the two may be measuring independent processes that have different time courses of recovery.
The direction of anisotropic abnormalities (i.e., reduced or increased FA) during the semi-acute stages is actively debated for both adult and pediatric TBI (Niogi and Mukherjee, 2010; Shenton et al., 2012). Whereas our finding of increased FA during semi-acute pmTBI is consistent with previous reports from independent adult cohorts (Mayer et al., 2010; Ling et al., 2012b; Wilde et al., 2012) and semi-acute pmTBI patients (Wilde et al., 2008; Chu et al., 2010), null findings in semi-acute pmTBI have also been reported previously (Maugans et al., 2012). There is also little agreement across studies about which white matter tracts are most likely to express pathology after mTBI. However, heterogeneous patterns of diffuse axonal injury have been reported in animal models with careful experimental control of initial biomechanical forces, even within fiber bundles exposed to nearly identical deformation forces (Browne et al., 2011; Greer et al., 2011). Therefore, analytic approaches that are capable of quantifying aggregate, distributed white matter injuries are needed to study the vastly different biomechanical forces that characterize human injuries (Ling et al., 2012b).
Specifically, a potential explanation for the heterogeneous nature of findings in both pediatric (Wilde et al., 2008; Chu et al., 2010; Maugans et al., 2012) and adult (Niogi and Mukherjee, 2010; Shenton et al., 2012) mTBI is the likelihood of spatial heterogeneity in lesion location for individual patients. For example, our sample consisted of a mixture of patients with motor vehicle accidents, falls, and sports-related concussions. Thus, although this group accurately captures the diverse population that is seen in the emergency room of most hospitals, larger sample sizes will be required to determine whether type (i.e., rapid acceleration/deceleration vs blunt force injuries) or location (i.e., application of biomechanical forces to the coronal vs sagittal plane) affects the pattern of diffusion abnormalities observed on scans (Rosenbaum and Lipton, 2012).
The interpretation of macroscopic measures of microscopic pathology is complicated by multiple factors (Wheeler-Kingshott and Cercignani, 2009; Ling et al., 2012b). While acknowledging this important caveat, cytotoxic edema provides the most plausible explanation of increased FA/reduced RD observed in current and previous studies (Bazarian et al., 2007; Wilde et al., 2008; Mayer et al., 2010). Within white matter, the mechanical forces of mTBI result in the stretching of axons and related supporting structures, such as oligodendrocytes (Povlishock and Katz, 2005; Browne et al., 2011). This is followed by alterations in the function of gated ion channels, resulting in increased intracellular and decreased extracellular water (Rosenblum, 2007). The decrease in extracellular water may lead to a decrease in diffusivity perpendicular to the axon (RD), secondary to more tightly compacted axons and the resultant changes in tortuosity of water (Sotak, 2002; Rosenblum, 2007). Although changes in the structure of myelin provides an alternative explanation for increased FA, it plays a minor role in anisotropic diffusion relative to axonal membranes (Beaulieu, 2002), and animal models of concussion more consistently indicate disruptions to the axonal membrane rather than myelin changes (Spain et al., 2010; Browne et al., 2011). Importantly, changes in axonal integrity may also affect how functional networks communicate and ultimately influence behavior, as has been suggested recently by functional MRI studies of adult mTBI (Mayer et al., 2010; Johnson et al., 2012; Shumskaya et al., 2012).
Previous clinical data suggest that pediatric TBI results in an increased incidence of diffuse axonal injury, cytotoxic edema, and vasogenic edema relative to adult populations (Adelson and Kochanek, 1998). Whether these effects are secondary to initial biomechanical factors (e.g., weak neck musculature, head-to-body weight ratio), incomplete myelination of white matter tracts, or a result of other physiological factors (e.g., increased risk of excitotoxicity) remains to be further elucidated (Giza et al., 2007). It is interesting to note that the left and right ACR were one of the few structures to display bilateral indications of increased diffusion in the current study. The frontal cortices are the last to fully myelinate (Toga et al., 2006), and unmyelinated axons are more likely to be affected by acceleration/deacceleration injuries (Reeves et al., 2005), suggesting that the structural development trajectories of axons may be important for understanding pathology.
Although previous adult mTBI studies (Arfanakis et al., 2002; Mayer et al., 2010; Ling et al., 2012b) have suggested partial normalization of diffusion indices as a function of normal recovery, current findings provided little evidence of recovery in diffusion metrics ∼4 months after a pmTBI. If replicable, these findings provide a potential physiological basis for worse outcome after a temporally proximal second injury. Specifically, animal models of repeated pmTBI indicate increased memory impairment, astrocytic reactivity, and axonal injury relative to a single injury model (Prins et al., 2010). Preliminary evidence of increased deficits after a quick return to play after pmTBI also exists in human injury models as well (McCrory et al., 2009; Guskiewicz and Valovich McLeod, 2011; Lincoln et al., 2011). The current definition of mTBI is variable (Ruff et al., 2009; Rosenbaum and Lipton, 2012) and primarily determined by clinical observations and self-reported symptomatology rather than objective criteria. Additional prospective studies examining recovery of function/biomarkers in pmTBI are therefore critical for the development of more objective criteria about when it is truly safe for children to return to physical activity.
Limitations to the current study include our relatively small sample size, which compromised power for detecting moderate effects (e.g., neuropsychological testing). Moreover, the relatively small sample size also increases the likelihood of a sample bias in either the pmTBI or HC group. Second, the number of days after injury at which our sample was studied was relatively long into the recovery period, which may have also compromised our ability to detect more rapidly resolving neurobehavioral deficits (McCrea et al., 2003; Barkhoudarian et al., 2011).
In summary, pmTBI is associated with an increased incidence of neuropsychiatric conditions (McKinlay et al., 2009), delays in academic achievement, and decrease in overall quality of health (Yeates et al., 2012). Understanding the neuropathological underpinnings of these deficits is critical for both diagnostic considerations and developing novel treatment strategies. Although preliminary, current data provide evidence that diffusion abnormalities may represent a safe (i.e., non-iodizing radiation) and objective biomarker for classifying pmTBI at high levels of accuracy in the semi-acute injury stage. Because both animal (Bayly et al., 2006; Huh et al., 2008) and human (Hessen et al., 2007) studies have shown that the developing brain is more susceptible than the developed brain to mild diffuse brain injury, this may provide a critical biomarker for the field moving forward.
Footnotes
This research was supported by the Mind Research Network Grant (Department of Energy Grant DE-FG02-99ER62764) (A.R.M.).
The authors declare declare no competing financial interests.
References
- Adelson PD, Kochanek PM. Head injury in children. J Child Neurol. 1998;13:2–15. doi: 10.1177/088307389801300102. [DOI] [PubMed] [Google Scholar]
- Akpinar E, Koroglu M, Ptak T. Diffusion tensor MR imaging in pediatric head trauma. J Comput Assist Tomogr. 2007;31:657–661. doi: 10.1097/RCT.0b013e318033df1a. [DOI] [PubMed] [Google Scholar]
- Anderson V, Catroppa C, Morse S, Haritou F, Rosenfeld J. Outcome from mild head injury in young children: a prospective study. J Clin Exp Neuropsychol. 2001;23:705–717. doi: 10.1076/jcen.23.6.705.1015. [DOI] [PubMed] [Google Scholar]
- Arfanakis K, Haughton VM, Carew JD, Rogers BP, Dempsey RJ, Meyerand ME. Diffusion tensor MR imaging in diffuse axonal injury. Am J Neuroradiol. 2002;23:794–802. [PMC free article] [PubMed] [Google Scholar]
- Babikian T, Tong KA, Galloway NR, Freier-Randall MC, Obenaus A, Ashwal S. Diffusion-weighted imaging predicts cognition in pediatric brain injury. Pediatr Neurol. 2009;41:406–412. doi: 10.1016/j.pediatrneurol.2009.06.002. [DOI] [PubMed] [Google Scholar]
- Babikian T, Marion SD, Copeland S, Alger JR, O'Neill J, Cazalis F, Mink R, Giza CC, Vu JA, Hilleary SM, Kernan CL, Newman N, Asarnow RF. Metabolic levels in the corpus callosum and their structural and behavioral correlates after moderate to severe pediatric TBI. J Neurotrauma. 2010;27:473–481. doi: 10.1089/neu.2009.1058. [DOI] [PMC free article] [PubMed] [Google Scholar]
- Barkhoudarian G, Hovda DA, Giza CC. The molecular pathophysiology of concussive brain injury. Clin Sports Med. 2011;30:33–48. vii–iii. doi: 10.1016/j.csm.2010.09.001. [DOI] [PubMed] [Google Scholar]
- Bayly PV, Dikranian KT, Black EE, Young C, Qin YQ, Labruyere J, Olney JW. Spatiotemporal evolution of apoptotic neurodegeneration following traumatic injury to the developing rat brain. Brain Res. 2006;1107:70–81. doi: 10.1016/j.brainres.2006.05.102. [DOI] [PMC free article] [PubMed] [Google Scholar]
- Bazarian JJ, Zhong J, Blyth B, Zhu T, Kavcic V, Peterson D. Diffusion tensor imaging detects clinically important axonal damage after mild traumatic brain injury: a pilot study. J Neurotrauma. 2007;24:1447–1459. doi: 10.1089/neu.2007.0241. [DOI] [PubMed] [Google Scholar]
- Beaulieu C. The basis of anisotropic water diffusion in the nervous system: a technical review. NMR Biomed. 2002;15:435–455. doi: 10.1002/nbm.782. [DOI] [PubMed] [Google Scholar]
- Bigler ED, Maxwell WL. Neuropathology of mild traumatic brain injury: relationship to neuroimaging findings. Brain Imaging Behav. 2012;6:108–136. doi: 10.1007/s11682-011-9145-0. [DOI] [PubMed] [Google Scholar]
- Blumbergs PC, Scott G, Manavis J, Wainwright H, Simpson DA, McLean AJ. Staining of amyloid precursor protein to study axonal damage in mild head injury. Lancet. 1994;344:1055–1056. doi: 10.1016/s0140-6736(94)91712-4. [DOI] [PubMed] [Google Scholar]
- Browne KD, Chen XH, Meaney DF, Smith DH. Mild traumatic brain injury and diffuse axonal injury in swine. J Neurotrauma. 2011;28:1747–1755. doi: 10.1089/neu.2011.1913. [DOI] [PMC free article] [PubMed] [Google Scholar]
- Chu Z, Wilde EA, Hunter JV, McCauley SR, Bigler ED, Troyanskaya M, Yallampalli R, Chia JM, Levin HS. Voxel-based analysis of diffusion tensor imaging in mild traumatic brain injury in adolescents. AJNR Am J Neuroradiol. 2010;31:340–346. doi: 10.3174/ajnr.A1806. [DOI] [PMC free article] [PubMed] [Google Scholar]
- Faul M, Xu L, Wald MM, Coronado VG. Traumatic brain injury in the United States: emergency department visits, hospitalizations, and deaths. Atlanta: Centers for Disease Control and Prevention; 2010. [Google Scholar]
- Galloway NR, Tong KA, Ashwal S, Oyoyo U, Obenaus A. Diffusion-weighted imaging improves outcome prediction in pediatric traumatic brain injury. J Neurotrauma. 2008;25:1153–1162. doi: 10.1089/neu.2007.0494. [DOI] [PubMed] [Google Scholar]
- Giedd JN, Blumenthal J, Jeffries NO, Castellanos FX, Liu H, Zijdenbos A, Paus T, Evans AC, Rapoport JL. Brain development during childhood and adolescence: a longitudinal MRI study. Nat Neurosci. 1999;2:861–863. doi: 10.1038/13158. [DOI] [PubMed] [Google Scholar]
- Giza CC. Lasting effects of pediatric traumatic brain injury. Indian J Neurotrauma. 2006;3:19–26. [Google Scholar]
- Giza CC, Mink RB, Madikians A. Pediatric traumatic brain injury: not just little adults. Curr Opin Crit Care. 2007;13:143–152. doi: 10.1097/MCC.0b013e32808255dc. [DOI] [PubMed] [Google Scholar]
- Greer JE, McGinn MJ, Povlishock JT. Diffuse traumatic axonal injury in the mouse induces atrophy, c-Jun activation, and axonal outgrowth in the axotomized neuronal population. J Neurosci. 2011;31:5089–5105. doi: 10.1523/JNEUROSCI.5103-10.2011. [DOI] [PMC free article] [PubMed] [Google Scholar]
- Guskiewicz KM, Valovich McLeod TC. Pediatric sports-related concussion. PM R. 2011;3:353–364. doi: 10.1016/j.pmrj.2010.12.006. quiz 364. [DOI] [PubMed] [Google Scholar]
- Hanten G, Wilde EA, Menefee DS, Li X, Lane S, Vasquez C, Chu Z, Ramos MA, Yallampalli R, Swank P, Chapman SB, Gamino J, Hunter JV, Levin HS. Correlates of social problem solving during the first year after traumatic brain injury in children. Neuropsychology. 2008;22:357–370. doi: 10.1037/0894-4105.22.3.357. [DOI] [PubMed] [Google Scholar]
- Hessen E, Nestvold K, Anderson V. Neuropsychological function 23 years after mild traumatic brain injury: a comparison of outcome after paediatric and adult head injuries. Brain Inj. 2007;21:963–979. doi: 10.1080/02699050701528454. [DOI] [PubMed] [Google Scholar]
- Huh JW, Widing AG, Raghupathi R. Midline brain injury in the immature rat induces sustained cognitive deficits, bihemispheric axonal injury and neurodegeneration. Exp Neurol. 2008;213:84–92. doi: 10.1016/j.expneurol.2008.05.009. [DOI] [PMC free article] [PubMed] [Google Scholar]
- Johnson B, Zhang K, Gay M, Horovitz S, Hallett M, Sebastianelli W, Slobounov S. Alteration of brain default network in subacute phase of injury in concussed individuals: resting-state fMRI study. Neuroimage. 2012;59:511–518. doi: 10.1016/j.neuroimage.2011.07.081. [DOI] [PMC free article] [PubMed] [Google Scholar]
- Keenan HT, Bratton SL. Epidemiology and outcomes of pediatric traumatic brain injury. Dev Neurosci. 2006;28:256–263. doi: 10.1159/000094152. [DOI] [PubMed] [Google Scholar]
- Kochanek PM. Pediatric traumatic brain injury: quo vadis? Dev Neurosci. 2006;28:244–255. doi: 10.1159/000094151. [DOI] [PubMed] [Google Scholar]
- Lincoln AE, Caswell SV, Almquist JL, Dunn RE, Norris JB, Hinton RY. Trends in concussion incidence in high school sports: a prospective 11-year study. Am J Sports Med. 2011;39:958–963. doi: 10.1177/0363546510392326. [DOI] [PubMed] [Google Scholar]
- Ling J, Merideth F, Caprihan A, Pena A, Teshiba T, Mayer AR. Head injury or head motion? Assessment and quantification of motion artifacts in diffusion tensor imaging studies. Hum Brain Mapp. 2012a;33:50–62. doi: 10.1002/hbm.21192. [DOI] [PMC free article] [PubMed] [Google Scholar]
- Ling JM, Peña A, Yeo RA, Merideth FL, Klimaj S, Gasparovic C, Mayer AR. Biomarkers of increased diffusion anisotropy in semi-acute mild traumatic brain injury: a longitudinal perspective. Brain. 2012b;135:1281–1292. doi: 10.1093/brain/aws073. [DOI] [PMC free article] [PubMed] [Google Scholar]
- Maugans TA, Farley C, Altaye M, Leach J, Cecil KM. Pediatric sports-related concussion produces cerebral blood flow alterations. Pediatrics. 2012;129:28–37. doi: 10.1542/peds.2011-2083. [DOI] [PMC free article] [PubMed] [Google Scholar]
- Mayer AR, Ling J, Mannell MV, Gasparovic C, Phillips JP, Doezema D, Reichard R, Yeo RA. A prospective diffusion tensor imaging study in mild traumatic brain injury. Neurology. 2010;74:643–650. doi: 10.1212/WNL.0b013e3181d0ccdd. [DOI] [PMC free article] [PubMed] [Google Scholar]
- McCauley SR, Wilde EA, Bigler ED, Chu Z, Yallampalli R, Oni MB, Wu TC, Ramos MA, Pedroza C, Vásquez AC, Hunter JV, Levin HS. Diffusion tensor imaging of incentive effects in prospective memory after pediatric traumatic brain injury. J Neurotrauma. 2011;28:503–516. doi: 10.1089/neu.2010.1555. [DOI] [PMC free article] [PubMed] [Google Scholar]
- McCrea M, Guskiewicz KM, Marshall SW, Barr W, Randolph C, Cantu RC, Onate JA, Yang J, Kelly JP. Acute effects and recovery time following concussion in collegiate football players: the NCAA Concussion Study. JAMA. 2003;290:2556–2563. doi: 10.1001/jama.290.19.2556. [DOI] [PubMed] [Google Scholar]
- McCrory P, Meeuwisse W, Johnston K, Dvorak J, Aubry M, Molloy M, Cantu R. Consensus statement on Concussion in Sport 3rd International Conference on Concussion in Sport held in Zurich, November 2008. Clin J Sport Med. 2009;19:185–200. doi: 10.1097/JSM.0b013e3181a501db. [DOI] [PubMed] [Google Scholar]
- McKinlay A, Grace R, Horwood J, Fergusson D, MacFarlane M. Adolescent psychiatric symptoms following preschool childhood mild traumatic brain injury: evidence from a birth cohort. J Head Trauma Rehabil. 2009;24:221–227. doi: 10.1097/HTR.0b013e3181a40590. [DOI] [PubMed] [Google Scholar]
- Mori S, van Zijl P. Human white matter atlas. Am J Psychiatry. 2007;164:1005. doi: 10.1176/ajp.2007.164.7.1005. [DOI] [PubMed] [Google Scholar]
- Niogi SN, Mukherjee P. Diffusion tensor imaging of mild traumatic brain injury. J Head Trauma Rehabil. 2010;25:241–255. doi: 10.1097/HTR.0b013e3181e52c2a. [DOI] [PubMed] [Google Scholar]
- Oni MB, Wilde EA, Bigler ED, McCauley SR, Wu TC, Yallampalli R, Chu Z, Li X, Hunter JV, Vasquez AC, Levin HS. Diffusion tensor imaging analysis of frontal lobes in pediatric traumatic brain injury. J Child Neurol. 2010;25:976–984. doi: 10.1177/0883073809356034. [DOI] [PMC free article] [PubMed] [Google Scholar]
- Povlishock JT, Katz DI. Update of neuropathology and neurological recovery after traumatic brain injury. J Head Trauma Rehabil. 2005;20:76–94. doi: 10.1097/00001199-200501000-00008. [DOI] [PubMed] [Google Scholar]
- Prins ML, Hales A, Reger M, Giza CC, Hovda DA. Repeat traumatic brain injury in the juvenile rat is associated with increased axonal injury and cognitive impairments. Dev Neurosci. 2010;32:510–518. doi: 10.1159/000316800. [DOI] [PMC free article] [PubMed] [Google Scholar]
- Reeves TM, Phillips LL, Povlishock JT. Myelinated and unmyelinated axons of the corpus callosum differ in vulnerability and functional recovery following traumatic brain injury. Exp Neurol. 2005;196:126–137. doi: 10.1016/j.expneurol.2005.07.014. [DOI] [PubMed] [Google Scholar]
- Reynolds CR, Kamphaus RW. BASC-2: behavior assessment system for children. Ed 2. Circle Pines, MN: American Guidance Service; 2004. [Google Scholar]
- Rosenbaum SB, Lipton ML. Embracing chaos: the scope and importance of clinical and pathological heterogeneity in mTBI. Brain Imaging Behav. 2012;6:255–282. doi: 10.1007/s11682-012-9162-7. [DOI] [PubMed] [Google Scholar]
- Rosenblum WI. Cytotoxic edema: monitoring its magnitude and contribution to brain swelling. J Neuropathol Exp Neurol. 2007;66:771–778. doi: 10.1097/nen.0b013e3181461965. [DOI] [PubMed] [Google Scholar]
- Ruff RM, Iverson GL, Barth JT, Bush SS, Broshek DK. Recommendations for diagnosing a mild traumatic brain injury: a National Academy of Neuropsychology education paper. Arch Clin Neuropsychol. 2009;24:3–10. doi: 10.1093/arclin/acp006. [DOI] [PubMed] [Google Scholar]
- Shenton ME, Hamoda HM, Schneiderman JS, Bouix S, Pasternak O, Rathi Y, Vu MA, Purohit MP, Helmer K, Koerte I, Lin AP, Westin CF, Kikinis R, Kubicki M, Stern RA, Zafonte R. A review of magnetic resonance imaging and diffusion tensor imaging findings in mild traumatic brain injury. Brain Imaging Behav. 2012;6:137–192. doi: 10.1007/s11682-012-9156-5. [DOI] [PMC free article] [PubMed] [Google Scholar]
- Shumskaya E, Andriessen TM, Norris DG, Vos PE. Abnormal whole-brain functional networks in homogeneous acute mild traumatic brain injury. Neurology. 2012;79:175–182. doi: 10.1212/WNL.0b013e31825f04fb. [DOI] [PubMed] [Google Scholar]
- Smith SM, Jenkinson M, Johansen-Berg H, Rueckert D, Nichols TE, Mackay CE, Watkins KE, Ciccarelli O, Cader MZ, Matthews PM, Behrens TE. Tract-based spatial statistics: voxelwise analysis of multi-subject diffusion data. Neuroimage. 2006;31:1487–1505. doi: 10.1016/j.neuroimage.2006.02.024. [DOI] [PubMed] [Google Scholar]
- Sotak CH. The role of diffusion tensor imaging in the evaluation of ischemic brain injury: a review. NMR Biomed. 2002;15:561–569. doi: 10.1002/nbm.786. [DOI] [PubMed] [Google Scholar]
- Sowell ER, Trauner DA, Gamst A, Jernigan TL. Development of cortical and subcortical brain structures in childhood and adolescence: a structural MRI study. Dev Med Child Neurol. 2002;44:4–16. doi: 10.1017/s0012162201001591. [DOI] [PubMed] [Google Scholar]
- Spain A, Daumas S, Lifshitz J, Rhodes J, Andrews PJ, Horsburgh K, Fowler JH. Mild fluid percussion injury in mice produces evolving selective axonal pathology and cognitive deficits relevant to human brain injury. J Neurotrauma. 2010;27:1429–1438. doi: 10.1089/neu.2010.1288. [DOI] [PubMed] [Google Scholar]
- Storey P, Frigo FJ, Hinks RS, Mock BJ, Collick BD, Baker N, Marmurek J, Graham SJ. Partial k-space reconstruction in single-shot diffusion-weighted echo-planar imaging. Magn Reson Med. 2007;57:614–619. doi: 10.1002/mrm.21132. [DOI] [PubMed] [Google Scholar]
- Toga AW, Thompson PM, Sowell ER. Mapping brain maturation. Trends Neurosci. 2006;29:148–159. doi: 10.1016/j.tins.2006.01.007. [DOI] [PMC free article] [PubMed] [Google Scholar]
- Wheeler-Kingshott CA, Cercignani M. About “axial” and “radial” diffusivities. Magn Reson Med. 2009;61:1255–1260. doi: 10.1002/mrm.21965. [DOI] [PubMed] [Google Scholar]
- Wilde EA, McCauley SR, Hunter JV, Bigler ED, Chu Z, Wang ZJ, Hanten GR, Troyanskaya M, Yallampalli R, Li X, Chia J, Levin HS. Diffusion tensor imaging of acute mild traumatic brain injury in adolescents. Neurology. 2008;70:948–955. doi: 10.1212/01.wnl.0000305961.68029.54. [DOI] [PubMed] [Google Scholar]
- Wilde EA, McCauley SR, Barnes A, Wu TC, Chu Z, Hunter JV, Bigler ED. Serial measurement of memory and diffusion tensor imaging changes within the first week following uncomplicated mild traumatic brain injury. Brain Imaging Behav. 2012;6:319–328. doi: 10.1007/s11682-012-9174-3. [DOI] [PubMed] [Google Scholar]
- Wozniak JR, Krach L, Ward E, Mueller BA, Muetzel R, Schnoebelen S, Kiragu A, Lim KO. Neurocognitive and neuroimaging correlates of pediatric traumatic brain injury: a diffusion tensor imaging (DTI) study. Arch Clin Neuropsychol. 2007;22:555–568. doi: 10.1016/j.acn.2007.03.004. [DOI] [PMC free article] [PubMed] [Google Scholar]
- Wu TC, Wilde EA, Bigler ED, Yallampalli R, McCauley SR, Troyanskaya M, Chu Z, Li X, Hanten G, Hunter JV, Levin HS. Evaluating the relationship between memory functioning and cingulum bundles in acute mild traumatic brain injury using diffusion tensor imaging. J Neurotrauma. 2010;27:303–307. doi: 10.1089/neu.2009.1110. [DOI] [PMC free article] [PubMed] [Google Scholar]
- Yang Z, Yeo RA, Pena A, Ling JM, Klimaj S, Campbell R, Doezema D, Mayer AR. A fMRI study of auditory orienting and inhibition of return in pediatric mild traumatic brain injury. J Neurotrauma. 2012;29:2124–2136. doi: 10.1089/neu.2012.2395. [DOI] [PMC free article] [PubMed] [Google Scholar]
- Yeates KO, Kaizar E, Rusin J, Bangert B, Dietrich A, Nuss K, Wright M, Taylor HG. Reliable change in postconcussive symptoms and its functional consequences among children with mild traumatic brain injury. Arch Pediatr Adolesc Med. 2012;166:615–622. doi: 10.1001/archpediatrics.2011.1082. [DOI] [PMC free article] [PubMed] [Google Scholar]