

Abstract
The cued-trials task-switching paradigm is used to investigate the processes involved in preparation to change task. Task switch trials typically show poorer performance than task repeat trials, suggesting that additional or more time-consuming preparation processes are required to switch tasks. However, behavioral and neuroimaging studies have so far been unable to decipher whether preparing for a switch in task involves distinct cognitive processes to those required more generally on both switch and repeat trials. The current study addresses this question using a novel multivariate pattern misclassification analysis of frequency band-specific local topographical patterns in human EEG activity that was elicited by cues varying in information value. Within the alpha frequency band, misclassification analysis produced evidence for an early switch-related preparation process over right frontal cortex, as well as a later task readiness preparation process over right parietal cortex. This represents compelling evidence for dissociable switch-related and task readiness preparation processes that show distinct time course and spatial activation patterns.
Introduction
The ability to deal with constantly changing demands within our environment is aided by external cues that allow preparation in anticipation of change. In cued task-switching paradigms, changing tasks involves a switch cost, i.e., poorer performance on task switch relative to task repeat trials (Meiran, 1996). This switch cost reduces with increased opportunity for preparation, indicating that switch trials require additional or more time-consuming preparation compared with repeat trials. However, it is unclear whether switch preparation involves stronger engagement of the same preparation process needed for task repetition or a distinct process.
Within the cue-to-target interval, event-related potentials (ERPs) show an early centroparietal positivity that is greater for switch than repeat trials (Kieffaber and Hetrick, 2005; Nicholson et al., 2005) and a frontocentral pretarget negativity that is similar for both trial types (Nicholson et al., 2005; Jamadar et al., 2010). Consistent with a switch-related preparation process, the early cue-locked positivity is elicited only by cues that predict a definite change in task, regardless of whether they identify the upcoming task (Karayanidis et al., 2009). Moreover, consistent with a general task readiness preparation process, the pretarget negativity is similar for cues that identify the upcoming task, regardless of whether the task repeats or changes. Similarly, Karayanidis et al. (2011) showed that cue-locked positivity amplitude varies as a function of reaction time (RT) only for switch trials, while pretarget negativity amplitude varies as a function of RT for both switch and repeat trials. However, this evidence for a switch-related preparation process relies on null findings, e.g., the absence of a significant cue-locked positivity for cues that do not predict a definite switch trial (Karayanidis et al., 2009).
We provide new evidence for a switch-related preparation process that is temporally and spatially distinct from a general preparation process. A novel multivariate pattern misclassification approach was developed, to identify core preparation processes based on common frequency band-specific topographical patterns in EEG activity. Four cue types provided varying degrees of specificity about the task relevant to the upcoming target. Repeat cues indicated a definite task repeat. Switch-to cues indicated a definite task switch and identified the relevant task. Switch-away cues also indicated a definite task switch but not task identity. Non-informative cues indicated that a task repeat and task switch were equally likely. Thus, some cues specified an upcoming switch trial with certainty (switch-to, switch-away), whereas other cues specified the upcoming task with certainty (repeat, switch-to). We hypothesized that (1) a switch-related preparation process would be evidenced by switch-away trials being misclassified as switch-to trials in the latency range of the cue-locked positivity and (2) a task readiness process would be evidenced by repeat trials being misclassified as switch-to trials in the latency range of the pretarget negativity. These effects were expected to be represented in the alpha band (Serrien et al., 2004; Sauseng et al., 2006) and at frontal and parietal areas, respectively (Ruge et al., 2011).
Materials and Methods
Participants
Twenty-three participants (18 female, 21.3 ± 3.5 years) were included in this analysis. The study was approved by the University of Newcastle Human Research Ethics Committee.
Stimuli and tasks
Detailed information about stimuli used can be found in the article by Karayanidis et al. (2009). A circle (5° diameter) was divided into six segments, with two adjoining segments corresponding to letter (vowel/consonant), digit (odd/even), and color (hot/cold) classification tasks (Fig. 1A). On each trial, a target was presented in one segment. Targets consisted of a pair of characters (letter, number, non-alphanumeric symbol) presented either in gray or in color. Each target consisted of one dimension that was relevant to the current task (e.g., digit mapped to left hand response), one that was incongruently mapped to the currently relevant task (e.g., letter mapped to right hand response), and one neutral dimension (e.g., target presented in gray). Targets for each task (Fig. 1B) were selected pseudorandomly, so as to avoid immediate repetition. The target remained for 5 s or until a response was emitted (response-cue interval 400 ms). Data were pooled across tasks.
Figure 1.

Paradigm. A, Mapping of the three tasks to each of the main segments of the circle. B, Target sets associated with each task. C, Example cue-target sequence, showing the cue highlighting two adjacent segments, followed by the target appearing within one of the cued segments. Words are shown here to illustrate the task and were not seen by the participant.
Four cue types were defined by the position of a highlight that surrounded two adjoining segments of the circle and preceded target onset by 1000 ms (Fig. 1C). On repeat trials, the cue highlighted segments corresponding to the same task as the preceding trial, predicting a definite task repeat. On switch-to trials, the cue highlighted segments corresponding to one of the other tasks, predicting a definite switch to that task. On switch-away trials, the cue highlighted two adjoining segments corresponding to the two tasks that were not completed on the previous trial, predicting a definite task switch but not the task to be switched to. On non-informative trials, the cue again highlighted two adjoining segments, one corresponding to the task just completed and one to another task, indicating that a repeat of the previous task or a switch to this other task was equally likely. For both switch-away and non-informative cues, the location of the target defined which task would be performed. The same cue could not appear on more than three successive trials.
Procedure and EEG recording
Training included 1400 trials over two sessions on both single-task and mixed-task blocks. The EEG testing session included nine blocks of 96 trials, separated by rest. Immediate auditory error feedback was delivered. Mean RT and error rate were presented after each block. EEG was continuously sampled at 2048 Hz/channel from 64 scalp electrodes, left and right mastoids, nose and left supraorbital and infraorbital ridge and outer canthi of the eyes using a Biosemi ActiveTwo system relative to common mode sense (CMS) and driven right leg (DRL) electrodes.
Data analysis
The first five trials of each block, error trials, and trials following an error were excluded from analysis. Fast (<200 ms) and slow (>3 SD above participant's mean RT) trials were also excluded. Greenhouse-Geisser correction was applied when appropriate (Vasey and Thayer, 1987).
EEG preprocessing.
EEG data were high-pass filtered at 0.5 Hz and epoched from 1.0 s before to 3.5 s after each cue. All trials were visually inspected and those containing facial EMG or other artifacts not related to blinks were manually removed. Independent components analysis was computed using EEGLAB software (Delorme and Makeig, 2004) and components containing blink/oculomotor artifacts or other artifacts that could be clearly distinguished from brain-driven EEG signals were subtracted from the data. All data were current-source-density (CSD) transformed before analyses (Kayser and Tenke, 2006). CSD is a high-pass spatial filter that minimizes volume conduction by removing large spatially broad (and therefore likely volume conducted) activities (Srinivasan et al., 1996, 2007, also called scalp Laplacian). This sharpening filter limits spatial autocorrelation as well as the spread of any residual oculomotor artifacts, making the data more amenable to spatial multivariate pattern analysis based on local topographical features. This approach enhances spatial resolution but does not offer precise anatomical localization.
Power analysis.
Analyses were performed in Matlab. Single-trial data were first decomposed into their time-frequency representation by multiplying the power spectrum of the EEG (obtained from the fast Fourier transform) by the power spectrum of complex Morlet wavelets (ei2πtf e−t2/(2*σ2)), where t is time, f is frequency, which increased from 2 to 50 Hz in 20 logarithmically spaced steps, and σ defines the width of each frequency band, set according to n/(2πf) where n increases logarithmically from 3 to 14 as a function of frequency), and then taking the inverse fast Fourier transform. From the resulting complex signal, an estimate of frequency band-specific power at each time point was defined as the squared magnitude of the result of the convolution Z (real[z(t)]2 + imag[z(t)]2). Power was normalized using a decibel (dB) transform (dB power = 10*log10[power/baseline]), where baseline activity was taken as the average power at each frequency band, averaged across conditions, from −300 to −100 ms pre-cue. Power was calculated for each electrode, separately for repeat, switch-to and switch-away trials, relative to non-informative trials.
Statistics on time-frequency changes in power were performed by map-wise t tests, along with a combination of pixel- and cluster-level thresholding. Individual pixels in time-frequency space were considered significant at p < 0.01. Clusters of pixels were considered significant if there were more pixels per cluster than expected under the null hypothesis at p < 0.05. Cluster size was obtained via permutation testing (Nichols and Holmes, 2002). t-values were computed based on a randomly shuffled subject-condition mapping, and the statistical map was thresholded again. This time, the number of pixels in the largest suprathreshold cluster was stored. This was repeated 500 times, generating a distribution of maximum cluster sizes under the null hypothesis. The cluster threshold was defined as the standardized distance from the mean of the maximum cluster distribution corresponding to p < 0.05.
Multivariate pattern analysis
This analysis entailed constructing a set of local electrode weights based on local topographical differences between activity elicited during switch-to versus non-informative conditions, and then testing whether those weights could be used to distinguish topographical patterns associated with repeat and switch-away conditions. The following procedure was done separately for each subject. The classifier was first trained to distinguish patterns associated with switch-to and non-informative trials. Switch-to cues allow preparation for both a switch in task and the upcoming task itself, whereas non-informative cues do not elicit either of these preparation processes. Thus, these cues demand the greatest and the least amounts of preparation, respectively. The first step created a set of topographical weights based on differences in local spatial patterns between switch-to and non-informative trials. Weights were calculated based on a cluster including the central electrode and the seven immediately surrounding electrodes (fewer electrodes were used near the edges of the EEG cap; no analysis entailed fewer than 4 electrodes). At each eight-electrode cluster, the mean activity across electrodes for each condition was subtracted to ensure that effects could not be attributed to overall amplitude differences between conditions. However, even with such amplitude normalization, topographical patterns may still not be representative of the precise configurations of source location and polarity (Urbach and Kutas, 2002). After the multivariate analysis was applied to this cluster (see below), another electrode was taken as the central electrode, and the process was repeated.
Trials were grouped into 20 bins of randomly selected trials and then averaged within each bin. This binning procedure increased signal-to-noise and ensured an equal number of “trials” for analyses within each subject (this procedure is often used in functional MRI multivariate analyses; Kahnt et al., 2011). Z-normalized data at each time-frequency point were entered into a general linear model (using Matlab's glmfit function with “probit” logistic regression) in which the set of weights was obtained that best distinguished switch-to and non-informative conditions. In other words, we constructed, for each time-frequency-electrode cluster point, a regression model of the form: y = Σwexe, where w is a vector of weights (regression coefficients) for electrodes e, and x is the normalized power estimate at each electrode (the intercept is zero because of normalization). y is a Boolean operator coded as 0 for switch-to trials and 1 for non-informative trials. This is similar to a “searchlight” procedure (Kriegeskorte et al., 2006) except that we searched across space, time, and frequency.
These weights were then taken to the next stage of analysis. Here, the model (via Matlab's glmval function) used these weights to classify repeat and switch-away trials as being more similar to switch-to or non-informative trials. Because the model was never trained on any of the test conditions (repeat and switch-away), its answers were necessarily “wrong.” Thus, if the model labels, for example, a repeat trial as switch-to at a specific time-frequency-electrode cluster point, this indicates that the model considers the local spatial pattern during repeat trials to be similar to that during switch-to trials (and that the pattern for switch-away trials is necessarily more similar to that during non-informative trials). This approach eliminates any potential “double-dipping,” because the model was tested on data it did not have access to during training. The misclassification value hence reflects the bias in misclassifying repeat as switch-to compared with misclassifying switch-away as switch-to at each time/frequency/electrode point. Fifty percent performance indicates that there is no bias in how repeat versus switch away trials were misclassified (i.e., the model misclassifies repeat and switch-away equally likely as switch-to vs non-informative). This is therefore considered chance-level performance, and at the group level, misclassification results across subjects were evaluated against 0.5. Pixel and cluster level thresholding of time-frequency changes in misclassification values was performed according to the procedure described above for time-frequency changes in power. Average misclassification values at each time point within the alpha band (8–12 Hz) were submitted to one-sample t tests at p < 0.05, with a minimum of 100 ms of contiguously significant points (see Fig. 4, bottom row).
Figure 4.

Multivariate pattern analysis. Top row, Topographical plots showing misclassification of repeat and switch-away activity as switch-to activity within the alpha band. Red, Repeat misclassified as switch-to; blue, switch-away misclassified as switch-to. Middle row, Time-frequency plots for right frontal and right parietal clusters, with significant clusters of pixels outlined. Bottom row, Misclassification values within the alpha band at right frontal and right parietal clusters plotted against time. Values > 0.50 show greater misclassification of repeat as switch-to, values < 0.50 show greater misclassification of switch-away as switch-to. Colored bars represent time windows in which misclassification values were significantly different from 0.50.
To ensure that effects were not due to differences between cue types in small horizontal eye movements around the circle, we examined ERPs at the horizontal electro-oculogram channels and found no systematic effects of cue type on eye movements that could have contributed to our results.
Results
Behavioral results
The effect of trial type on mean RT was significant, F(4,88) = 38.62, p < 0.001, ε = 0.320. Responses on repeat trials were faster than on switch-to, F(1,22) = 32.29, p < 0.001, switch-away, F(1,22) = 51.59, p < 0.001, and non-informative repeat trials, F(1,22) = 61.49, p < 0.001, that is trials where a non-informative cue led to a repeat trial (Fig. 2, top). Switch-to trials were significantly faster than switch-away trials, F(1,22) = 37.36, p < 0.001, which, in turn were faster than non-informative switch trials, albeit not significantly so.
Figure 2.
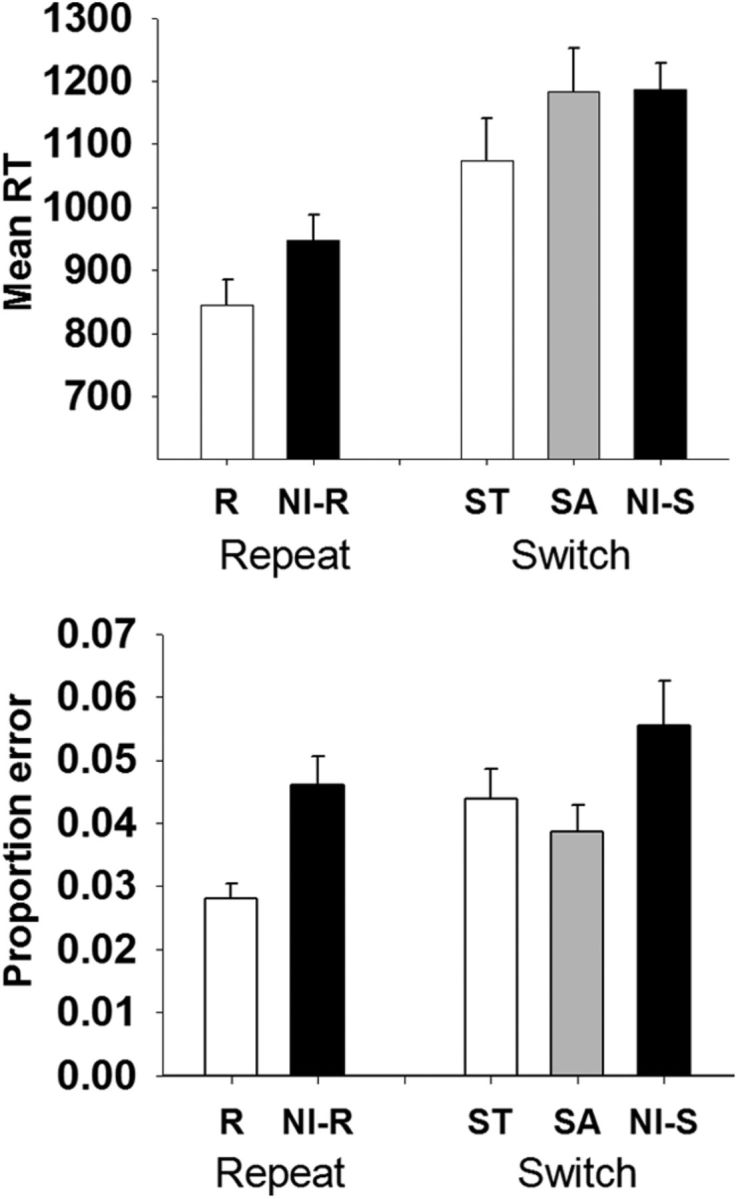
Mean reaction time (top) and error proportion (bottom) for each trial type, with SE bars. R, Repeat; NI-R, non-informative repeat; ST, switch-to; SA, switch-away; NI-S, non-informative switch.
Repeat trials produced fewer errors than non-informative repeat, F(1,22) = 21.27, p < 0.001, switch-to, F(1,22) = 16.87, p < 0.001, and switch-away trials, F(1,22) = 9.45, p = 0.006 (Fig. 2, bottom). Non-informative switch trials produced more errors than switch-away trials, F(1,22) = 9.53, p = 0.005.
Power analyses
Because this rapid task design lacked a pure “baseline” period, we show time-frequency results relative to non-informative trials (Fig. 3A). Figure 3B shows time-frequency plots at FC4, PO7 and PO8, where effects were strongest. At ∼400 ms post-cue, significant alpha/theta suppression was observed for repeat cues, especially over right frontocentral sites (Fig. 3). This effect was not evident for switch-to or switch-away cues. Instead, during this time window, there was greater alpha power over bilateral parieto-occipital electrodes for both switch cues (Fig. 3A), although this effect only reached significance for switch-away cues at left parieto-occipital sites (Fig. 3B). Beginning ∼600 ms for repeat cues and 800 ms for switch-to cues, there was an increase in alpha and beta power over bilateral parieto-occipital sites (Fig. 3A). This effect was only significant for repeat cues (Fig. 3B). There was no power increase over these electrodes for switch-away cues.
Figure 3.
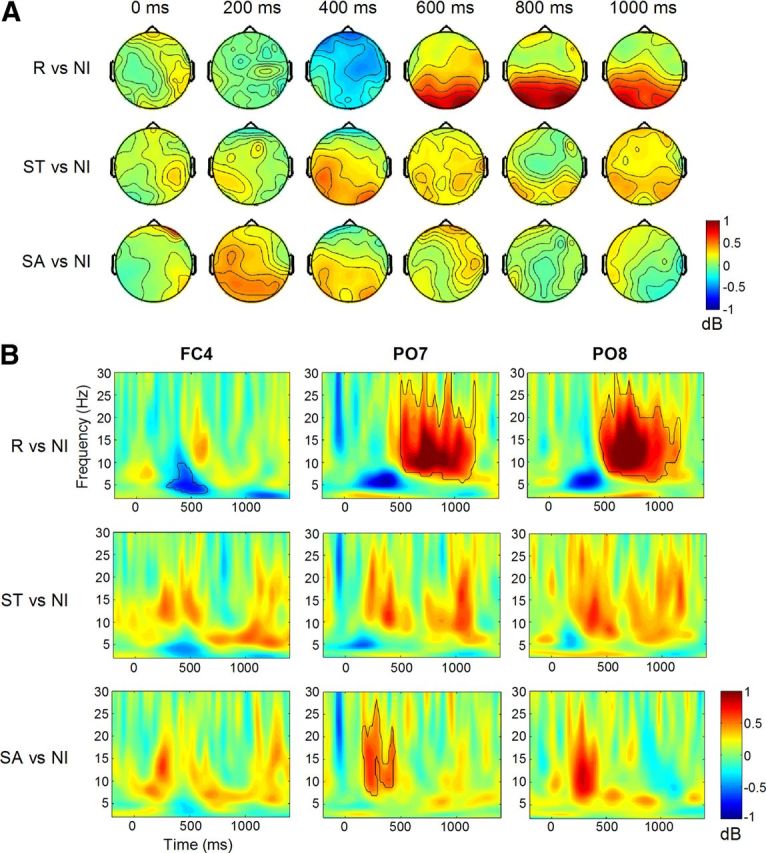
Power analysis. A, Topographical plots showing alpha power (8–12 Hz) for repeat, switch-to and switch-away cues relative to non-informative cues, within the cue to target interval. B, Time-frequency plots for each cue type relative to non-informative cues, at electrodes FC4, PO7, and PO8. Significant clusters of pixels are outlined.
This pattern suggests that an early preparation process common to both switch-to and switch-away cues could be distinguished from a later preparation process common to both repeat and switch-to cues in the alpha band. Both processes were evident parieto-occipitally and were not topographically distinct.
Multivariate pattern analysis
The multivariate pattern classification in the alpha band (8–12 Hz) is presented in Figure 4. The greatest misclassification effects occurred over two electrode clusters (Fig. 4, top): one over right lateral frontal sites (F6, F8, FC6) and another over right parietal sites (CP2, P2, P4). Figure 4 (middle) shows the full time-frequency misclassification plots for each cluster, with significant points outlined. Misclassification effects were largest in the alpha band. Misclassification values within this band at the frontal cluster (Fig. 4, bottom) show that, over 300–500 ms, activity on switch-away trials was classified as switch-to more than activity on repeat trials was classified as switch-to. In contrast, at the parietal cluster, from ∼850 ms until target onset, activity on repeat trials was classified as switch-to more than activity on switch-away trials was classified as switch-to. Thus, switch-away cues were misclassified as switch-to cues most strongly at right lateral frontal sites around the time of the early cue-locked positivity in ERP waveforms, whereas repeat cues were misclassified as switch-to cues at right parietal sites during the ERP pretarget negativity.
Discussion
The decline in behavioral performance when switching tasks compared with repeating the same task has been explained as arising from the need to recruit an additional process to prepare to switch task. However, while ERP studies consistently report differential activation for switch relative to repeat trials (Karayanidis et al., 2010) many fMRI studies do not find any differential switch activation (Ruge et al., 2011), leaving unanswered the question of whether a switch-related preparation process can be dissociated from more general preparation processes. We used a paradigm that differentiated between these processes by including some cues that specified with certainty that the task would change (switch-to, switch-away) and some cues that specified with certainty what the upcoming task would be (repeat, switch-to). Using a novel pattern classification approach, we corroborate previous evidence for temporally distinct switch-related and general task preparation processes (Karayanidis et al., 2009, 2011) and show new evidence that these processes may be linked to distinct neural generators.
An initial time-frequency analysis produced evidence for an early process in response to cues that predicted a definite task switch and a later process to cues that specified the upcoming task. These effects were evident in alpha power changes relative to non-informative cues over bilateral parieto-occipital electrodes and at latencies consistent with the cue-locked positive component for switch-to and switch-away cues and the pretarget negativity for switch-to and repeat cues reported by Karayanidis et al. (2009). However, still, these analyses do not provide evidence that these component processes are associated with different neural generators, as both processes showed increases in power over very similar posterior scalp regions.
Multivariate pattern analysis provided this critical evidence by reliably misclassifying repeat and switch-away trials as switch-to trials at different latencies and locations. Patterns of activation associated with switch-away cues were more strongly misclassified as switch-to patterns over right frontal sites from 300 to 500 ms post-cue. Thus, cues that specified with certainty that the task would change produced common patterns of activation. In contrast, from 850 to 1000 ms, activation patterns for repeat cues were more strongly misclassified as switch-to patterns over right parietal sites. So, fully informative cues (i.e., cues that identified the task to be completed) produced similar activation over this parietal region, compared with cues that did not identify the upcoming task. In summary, distinct patterns of activation were found when the cue predicted a definite change in task, compared with when the cue predicted the upcoming task with certainty.
Switch-related preparation
Consistent with evidence of a cue-locked ERP component that is only elicited in response to switch cues (Karayanidis et al., 2009), the current data support a preparation process that is engaged specifically on switch trials. The fact that this switch-related process is associated with frontal patterns of activation is suggestive of a higher-order process that responds to an increased demand for cognitive control. Karayanidis et al. (2009) argued that the early switch-related process may reflect an inhibitory function, as both switch-to and switch-away cues specify that the previous task set will no longer be required. In fact, for switch-away cues, this is the only information that is conveyed by the cue. For both of these cue types, suppression of the previous task set is a beneficial strategy, potentially reducing interference from the previous task set. Although anatomical localization on the basis of EEG topographical patterns remains speculative, the finding that the location of this common activation corresponded to right inferior frontal cortex, a region strongly linked to inhibitory control (Aron et al., 2004; Jamadar et al., 2010), is consistent with this interpretation.
Alternatively, it could be argued that shifts in spatial attention associated with switch-to and switch-away cues could explain this early effect. This explanation appears unlikely, as we have previously shown that amplitude differences in the early cue-locked ERP component elicited in this paradigm are not consistent with simple spatial reallocation of attention (Karayanidis et al., 2009). While this component was elicited for both switch cues, it was not elicited for non-informative cues, which also require a shift in spatial attention. Thus, the early similarity between switch-to and switch-away activity is more consistent with a strategic, switch-related preparation process.
General task readiness
The later general task preparation process was associated with activation over a right parietal region that approximately corresponded to the superior parietal lobule (SPL). There is evidence that activation in the SPL varies as a function of task certainty. For example, SPL activation was greater when participants had to select between multiple tasks than when the task was fixed (Forstmann et al., 2006) and when a bivalent target was presented before the task cue resulting in activation of more than one task set (Ruge et al., 2009). In the current context, this suggests that the differential activation over the SPL for repeat and switch-to cues relative to switch-away and non-informative cues is consistent with task set activation when the cue defines the upcoming task with certainty. This preparatory component may reflect a response readiness process, conceptualized as either reinforcing (repeat cues) or reloading (switch-to cues) the correct set of stimulus-response mappings before target onset.
Conclusion
Our novel technique has provided additional evidence for multiple transient preparation processes that involve rapidly changing networks in the lead up to target onset. We find evidence for sequential switch-specific and general task preparation processes that are associated with distinct neural generators, in line with models of preparation that include both context-updating and task-specific components (Jennings and van der Molen, 2005). These findings also highlight the value of using pattern classification approaches to identify core components of cognitive flexibility based on similarities in activation patterns across experimental conditions.
Footnotes
This work was supported by an Australian Postgraduate Award and University of Newcastle Vice Chancellor's Award for Outstanding RHD Candidate (E.L.M.) and a University of Newcastle Research Grant (F.K.). M. X C. is funded by a VIDI grant from the Dutch Organization for Scientific Research (NWO).
References
- Aron AR, Robbins TW, Poldrack RA. Inhibition and the right inferior frontal cortex. Trends Cogn Sci. 2004;8:170–177. doi: 10.1016/j.tics.2004.02.010. [DOI] [PubMed] [Google Scholar]
- Delorme A, Makeig S. EEGLAB: an open source toolbox for analysis of single-trial EEG dynamics including independent component analysis. J Neurosci Methods. 2004;134:9–21. doi: 10.1016/j.jneumeth.2003.10.009. [DOI] [PubMed] [Google Scholar]
- Forstmann BU, Brass M, Koch I, von Cramon DY. Voluntary selection of task sets revealed by functional magnetic resonance imaging. J Cogn Neurosci. 2006;18 doi: 10.1162/089892906775990589. 388:398. [DOI] [PubMed] [Google Scholar]
- Jamadar S, Hughes M, Fulham WR, Michie PT, Karayanidis F. The spatial and temporal dynamics of anticipatory preparation and response inhibition. Neuroimage. 2010;51:432–449. doi: 10.1016/j.neuroimage.2010.01.090. [DOI] [PubMed] [Google Scholar]
- Jennings JR, van der Molen MW. Preparation for speeded action as a psychophysiological concept. Psychol Bull. 2005;131:434–459. doi: 10.1037/0033-2909.131.3.434. [DOI] [PubMed] [Google Scholar]
- Kahnt T, Grueschow M, Speck O, Haynes JD. Perceptual learning and decision-making in human medial frontal cortex. Neuron. 2011;70:549–559. doi: 10.1016/j.neuron.2011.02.054. [DOI] [PubMed] [Google Scholar]
- Karayanidis F, Mansfield EL, Galloway KL, Smith JL, Provost A, Heathcote A. Anticipatory reconfiguration elicited by fully and partially informative cues that validly predict a switch in task. Cogn Affect Behav Neurosci. 2009;9:202–215. doi: 10.3758/CABN.9.2.202. [DOI] [PubMed] [Google Scholar]
- Karayanidis F, Jamadar S, Ruge H, Phillips N, Heathcote A, Forstmann BU. Advance preparation in task-switching: converging evidence from behavioral, brain activation, and model-based approaches. Front Psychol. 2010;1:25. doi: 10.3389/fpsyg.2010.00025. [DOI] [PMC free article] [PubMed] [Google Scholar]
- Karayanidis F, Provost A, Brown S, Paton B, Heathcote A. Switch-specific and general preparation map onto different ERP components in a task-switching paradigm. Psychophysiology. 2011;48:559–568. doi: 10.1111/j.1469-8986.2010.01115.x. [DOI] [PubMed] [Google Scholar]
- Kayser J, Tenke CE. Principal components analysis of Laplacian waveforms as a generic method for identifying ERP generator patterns: I. Evaluation with auditory oddball tasks. Clin Neurophysiol. 2006;177:348–368. doi: 10.1016/j.clinph.2005.08.034. [DOI] [PubMed] [Google Scholar]
- Kieffaber PD, Hetrick WP. Event-related potential correlates of task switching and switch costs. Psychophysiology. 2005;42:56–71. doi: 10.1111/j.1469-8986.2005.00262.x. [DOI] [PubMed] [Google Scholar]
- Kriegeskorte N, Goebel R, Bandettini P. Information-based functional brain mapping. Proc Natl Acad Sci U S A. 2006;103:3863–3868. doi: 10.1073/pnas.0600244103. [DOI] [PMC free article] [PubMed] [Google Scholar]
- Meiran N. Reconfiguration of processing mode prior to task performance. J Exp Psychol Learn. 1996;22:1423–1442. [Google Scholar]
- Nichols TE, Holmes AP. Nonparametric permutation tests for functional neuroimaging: a primer with examples. Hum Brain Mapp. 2002;15:1–25. doi: 10.1002/hbm.1058. [DOI] [PMC free article] [PubMed] [Google Scholar]
- Nicholson R, Karayanidis F, Poboka D, Heathcote A, Michie PT. Electrophysiological correlates of anticipatory task-switching processes. Psychophysiology. 2005;42:540–554. doi: 10.1111/j.1469-8986.2005.00350.x. [DOI] [PubMed] [Google Scholar]
- Ruge H, Braver T, Meiran N. Attention, intention and strategy in preparatory control. Neuropsychologia. 2009;47:1670–1685. doi: 10.1016/j.neuropsychologia.2009.02.004. [DOI] [PMC free article] [PubMed] [Google Scholar]
- Ruge H, Jamadar S, Zimmerman L, Karayanidis F. The many faces of preparatory control in task switching: reviewing a decade of fMRI research. Hum Brain Mapp. 2011 doi: 10.1002/hbm.21420. Advance online publication. Retrieved November 4, 2011. [DOI] [PMC free article] [PubMed] [Google Scholar]
- Sauseng P, Klimesch W, Freunberger R, Pecherstorfer T, Hanslmayr S, Doppelmayr M. Relevance of EEG alpha and theta oscillations during task switching. Exp Brain Res. 2006;170:295–301. doi: 10.1007/s00221-005-0211-y. [DOI] [PubMed] [Google Scholar]
- Serrien DJ, Pogosyan AH, Cassidy MJ, Brown P. Anticipatory cortico-cortical interactions: switching the task configuration between effectors. Exp Brain Res. 2004;154:359–367. doi: 10.1007/s00221-003-1667-2. [DOI] [PubMed] [Google Scholar]
- Srinivasan R, Nunez PL, Tucker DM, Silberstein RB, Cadusch PJ. Spatial sampling and filtering of EEG with spline laplacians to estimate cortical potentials. Brain Topogr. 1996;8:355–366. doi: 10.1007/BF01186911. [DOI] [PubMed] [Google Scholar]
- Srinivasan R, Winter WR, Ding J, Nunez PL. EEG and MEG coherence: measures of functional connectivity at distinct spatial scales of neocortical dynamics. J Neurosci Methods. 2007;166:41–52. doi: 10.1016/j.jneumeth.2007.06.026. [DOI] [PMC free article] [PubMed] [Google Scholar]
- Urbach TP, Kutas M. The intractability of scaling scalp distributions to infer neuroelectric sources. Psychophysiology. 2002;39:791–808. doi: 10.1111/1469-8986.3960791. [DOI] [PubMed] [Google Scholar]
- Vasey MW, Thayer JF. The continuing problem of false positives in repeated measures ANOVA in psychophysiology: a multivariate solution. Psychophysiology. 1987;24:479–486. doi: 10.1111/j.1469-8986.1987.tb00324.x. [DOI] [PubMed] [Google Scholar]