

Abstract
Neuropsychological investigations of patients with Parkinson's disease, schizophrenia, or attention deficit disorder converge with psychopharmacological studies in animals and healthy volunteers to implicate dopamine (DA) pathways in timing. In parallel, single-cell recording and functional neuroimaging studies have highlighted the importance of basal ganglia, prefrontal cortex, and supplementary motor area (SMA) for timing. In a placebo-controlled, within-subject design, we combined event-related functional magnetic resonance imaging with a DA manipulation (acute phenylalanine/tyrosine depletion; APTD) in healthy volunteers to pinpoint the neuroanatomical and functional substrates of the DA modulation of timing. Behaviorally, APTD selectively impaired accuracy of perceptual timing, with no effect on performance of a color-control task matched for difficulty, working memory (WM), and attentional demands. Neurally, APTD attenuated timing-specific activity in the putamen and SMA. Notably, APTD-induced decreases in brain activity were directly correlated to APTD-induced impairments in timing performance. Moreover, APTD modulated timing-specific activity selectively during initial storage of the sample duration, but had no effect during its subsequent retrieval or comparison to a probe. Our results do not simply reflect DA modulation of WM since the color task controlled for the WM updating process necessary for timing of durations in the seconds range. Moreover, preliminary evidence indicated APTD effects on putamen and SMA were greater for subsecond (540 ms) than suprasecond (1080 ms) durations, when WM demands would actually be lower. Instead, we show for the first time in healthy humans that DA manipulation perturbs timing by attenuating the activity in putamen and SMA that mediates initial storage of temporal information into WM.
Introduction
Timing the duration of perceptual events and motor acts is a ubiquitous cognitive process. Yet no neurological disorders are characterized by temporal deficits in the way that, for example, hemineglect is characterized by spatial deficits. Nevertheless, timing deficits have been identified (Allman and Meck, 2012) in Parkinson's disease (PD) (Pastor et al., 1992; Harrington et al., 1998), schizophrenia (Tysk, 1983; Elvevåg et al., 2003; Carroll et al., 2008, 2009), and attention deficit disorder (Rubia et al., 2009), all of which share dysfunction of the dopaminergic (DA) system. Moreover, DA antagonists have been shown to induce timing impairments in healthy volunteers (Rammsayer, 1993, 1997, 1999) and experimental animals (Maricq and Church, 1983; Meck, 1986, 1996), while l-Dopa restores timing dysfunction in PD (Artieda et al., 1992; O'Boyle et al., 1996) and animals with substantia nigra lesions (Meck, 2006). Collectively, these data suggest that the DA timing effect may be mediated by basal ganglia function (Buhusi and Meck, 2005; Jones and Jahanshahi, 2011).
Yet other studies, measuring cell firing in rats (Matell et al., 2003) and monkeys (Jin et al., 2009; Mita et al., 2009), demonstrate that time is coded by frontal, as well as striatal, regions of the brain. Indeed, functional magnetic resonance imaging (fMRI) studies have consistently implicated basal ganglia, right prefrontal cortex (PFC), and supplementary motor area (SMA) in timing (Coull et al., 2004, 2008, 2011a; Wiener et al., 2010). Considering the rich DA innervation of these frontostriatal circuits (Joel and Weiner, 2000), DA may affect timing by modulating activity in any, or all, of these regions. Prior fMRI investigations have examined DA modulation of timing in PD patients on versus off DA medication (Elsinger et al., 2003; Jahanshahi et al., 2010; Harrington et al., 2011). However, patients' underlying frontostriatal dysfunction may have contributed to the pattern of effects observed. We therefore combined fMRI with a DA manipulation in healthy volunteers to identify which elements of the core timing network are targeted by DA.
We manipulated DA with acute phenylalanine/tyrosine depletion (APTD) (McTavish et al., 1999; Leyton et al., 2000), which reduces striatal DA release (Montgomery et al., 2003; Leyton et al., 2004) and modulates frontostriatal connectivity (Nagano-Saito et al., 2008). Since basal ganglia are activated by the initial storage of temporal information into working memory (WM), while PFC is activated by its subsequent retrieval and comparison to ongoing stimuli (Coull et al., 2008; Harrington et al., 2010), we predicted differential DA modulation of basal ganglia and PFC during the storage and comparison phases of the task, respectively. However, given that WM is an indispensible component of timing (Lustig et al., 2005) and that DA modulates frontostriatal activity during WM (Mehta et al., 2000; Cools et al., 2008; Landau et al., 2009), we had to disambiguate DA effects on WM from those on timing. We therefore compared effects of APTD on timing and color control tasks that were matched for WM (both maintenance and manipulation) and sustained attention demands (Coull et al., 2004, 2008, 2011b).
Materials and Methods
Participants
Sixteen healthy, right-handed volunteers (one female; mean age = 25.7 years, range = 18–47 years) participated in the study. The local ethics committee approved the experimental protocol, and written informed consent was obtained before the study. All participants had normal or corrected-to-normal vision with no color blindness. They reported no history of clinical drug or alcohol abuse, or of psychiatric illness. Urine samples were used to screen for use of cocaine, amphetamines, barbiturates, benzodiazepines, D9-tetrahydrocanabinol, opiates, or phencyclidine (Triage Panel for Drugs of Abuse; Biosite Diagnostics). Although one participant (S4) showed a faint trace for D9-tetrahydrocanabinol on both testing sessions, we included his data in the group analysis since the trace was equivalent for both sessions. In support of this decision, including his data in the group analysis did not change the overall significance and pattern of either the behavioral or fMRI findings.
Cognitive task: temporal and color discrimination
All participants performed a training session before fMRI scanning. E-Prime 2.0 software (Psychology Software Tools) was used to present visual stimuli in the center of a black background computer screen and to register manual responses from a scanner-compatible button-box. Subjects made choice-responses using the index, middle, or ring fingers of the right hand. The trial structure, visual stimuli, and manual responses were identical in the temporal and color tasks, with the only difference being whether participants were asked to make time or color judgments. Moreover, timing and color tasks were not only matched for sensorimotor requirements but also for demands on sustained attention and WM (maintenance and manipulation). For both tasks, participants had to sustain attention for the entire presentation of the visual stimuli to integrate (in WM) duration or color information; they had to store information in WM for a short delay, and they had to compare (in WM) the relative duration or color of two consecutive stimuli.
Trial structure.
An experimental trial (Fig. 1) began with presentation (850 ms) of an informative cue that instructed participants to compare either the duration (“time” condition) or color (“color” condition) of two upcoming stimuli. After a pseudorandom delay (1–2 s), two colored circles (the “Sample” and the “Probe”) were presented consecutively, separated by a pseudorandom interstimulus interval (ISI) of 2–4 s. The inclusion of this relatively long and variable interval allowed for temporal deconvolution of the two event types. Each circle was presented for one of three durations (540 ms, 1080 ms, or 1620 ms), and had an overall percept of one of three shades of purple (maroon, violet, or indigo) ranging from a reddish to a bluish hue. Stimulus duration and color were counterbalanced such that any of the three durations could be paired with any of the three colors. We deliberately chose this duration range to minimize contributions from subvocal counting (Grondin et al., 2004).
Figure 1.

Temporal and color discrimination task. A cue (“time” or “color”) instructed subjects to estimate either the duration or color of two forthcoming consecutive stimuli that were separated by a variable ISI. The first (sample) and second (probe) stimuli were presented for one of three durations (540, 1080, and 1620 ms) and had an overall percept of one of three shades of purple (maroon, violet, or indigo). Stimuli were not of a uniform color but instead comprised rapidly flickering (90 ms) presentations of three of five different shades of purple (see insets) to give the overall color percept. According to the cue instruction, subjects estimated whether the probe was shorter (S), longer (L), or the same (=) duration as the sample (time condition) or redder (R), bluer (B), or the same (=) shade of purple as the sample (color condition). At the onset of the response signal, subjects indicated their duration or color estimate with a three-choice button press. The spatial location of the three response choices (S, L, or = for the time task; B, R, or = for the color task) varied on the computer screen from one trial to the next to remove motor preparation confounds. For example, if the subject's estimate was “shorter than,” and the response signal displayed the characters “L S =,” the subject should press the middle response button, whereas if the response signal displayed the characters “S = L” they should press the left response button. Gray and white arrows indicate regressors of interest, and no interest, respectively, for the fMRI data analysis.
In the time condition, participants estimated whether the duration of the second (Probe) stimulus was shorter (S), equal to (=), or longer (L) than the first (Sample) stimulus. In the color condition, participants estimated whether the second stimulus was redder (R), equal to (=), or bluer (B) than the first. Following another pseudo-random delay (1–2 s), the response screen was presented for 1500 ms. During this response period participants pressed one of three response buttons, corresponding to their estimate of relative duration or color. To minimize motor preparation confounds as much as possible, stimulus-response mappings varied on a trial-by-trial basis. Specifically, alphanumeric characters indicating each of the three possible responses for the time (S/=/L) or color (R/=/B) condition appeared in three discrete locations on the screen (Fig. 1), with the left/central/right location corresponding to an index/middle/ring finger response, respectively. Crucially, the spatial location of each alphanumeric character (and therefore the manual response associated with each perceptual estimate) was counterbalanced across trials. Intertrial intervals varied pseudorandomly from 1 to 2 s.
Stimuli.
The stimuli to be estimated were not a uniform color for the entire duration of stimulus presentation (Fig. 1, insets). Rather, rapidly alternating presentations (90 ms) of five different shades of purple across the entire stimulus duration gave an overall percept of maroon, violet, or indigo (Coull et al., 2004, 2008, 2011b; Livesey et al., 2007; Morillon et al., 2009). During the color task, the participant estimated the average shade of purple by amalgamating all shades presented during the flickering percept. This rather unusual color task was designed to ensure that participants maintained attention, and continually updated their color estimate, throughout the entire stimulus presentation. This manipulation is crucial for equating sustained attention and WM demands across the time and color tasks since (1) time perception necessitates attention being sustained for the entire duration of the stimulus (∼1 s), whereas perception of a static color would occur within the first ∼100 ms and (2) time perception requires stimulus onset to be held in WM and then continually updated as time elapses, whereas perception of a static color would require no such updating of WM.
Experimental design and APTD manipulation
Each participant was tested on two occasions, with a minimum of 5 d and a maximum of 1 month between sessions (average 13.5 d). The female participant was scanned on the same day of her menstrual cycle in both sessions (day 1 of the follicular phase). A within-subjects, double-blind crossover design was used such that participants received an amino acid drink deficient in phenylalanine and tyrosine (APTD) in one session and a nutritionally balanced control mixture (BAL) in the other. The order of conditions was randomly assigned and counterbalanced, with half of the participants receiving the APTD drink first and the BAL drink second (APTD-BAL) while the remaining participants received the drinks in the reverse order (BAL-APTD). The BAL drink was composed of 5.5 g alanine, 3.2 g glycine, 3.2 g histidine, 8 g isoleucine, 13.5 g leucine, 11 g lysine, 5.7 g phenylalanine, 12.2 g proline, 6.9 g serine, 6.5 g threonine, 2.3 g tryptophan, 6.9 g tyrosine, and 8.9 g valine. The APTD drink contained all of these amino acids except tyrosine and phenylalanine. Given the unpleasant taste and odor of arginine (4.9 g), cysteine (2.7 g), and methionine (3.0 g), these amino acids were given in capsule form and swallowed with water immediately before ingestion of the BAL or APTD drink. The drinks and capsules were adapted for the female participant by reducing the amount of each amino acid by 17% to account for lower body weight.
The day before testing, participants followed a low-protein diet supplied by the investigators, abstained from alcohol consumption, and had a maximum of three caffeinated drinks distributed throughout the day. They fasted (including drinks, except water) from midnight before the testing session (Fig. 2a). On the test day, participants ingested the drink ∼4.5 h before the first fMRI scan. Due to practical constraints, the actual time between the onset of drink ingestion and the onset of fMRI acquisition varied between 4 h 10 min and 4 h 40 min (mean 4 h 24 min). During the period between ingestion of the drink and installation in the MRI scanner they read or worked quietly. All participants were tested at roughly the same time of day (arrival in the lab between 9:15 and 10:15 A.M.) and the two testing sessions for each participant were never separated by >1 month, thereby minimizing potential contributions from circadian factors, such as time of day or day length. Data were acquired steadily over a 6 month period, from December to June, ensuring a wide range of day lengths across participants.
Figure 2.
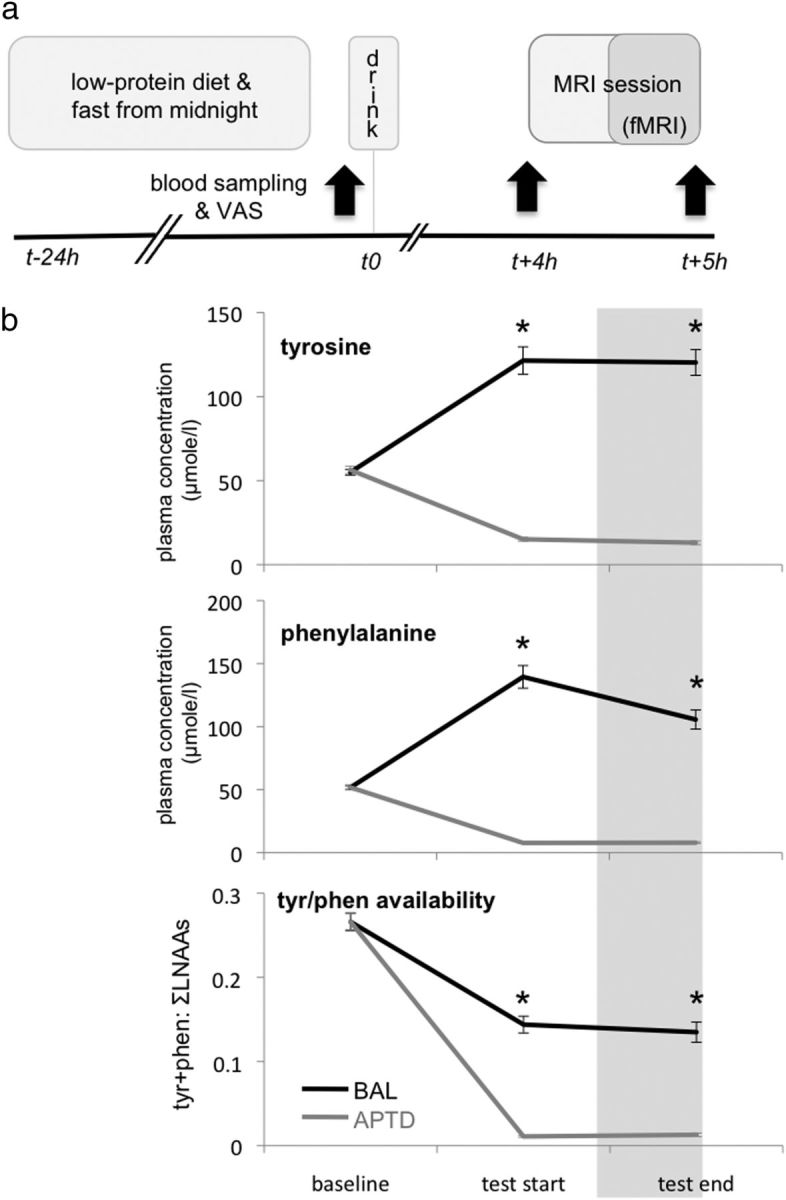
Experimental design and time line. a, The day before testing, participants followed a low-protein diet then fasted from midnight. Upon arrival in the lab, participants completed Visual Analogue Scales (VAS) and a blood sample was drawn. They then consumed an amino acid drink that was either nutritionally balanced (BAL) or deficient in tyrosine and phenylalanine (APTD). VAS and blood samples were repeated (black arrows) 4 h later at “test start” (i.e., just before the MRI session) and again 1 h later at “test end” (i.e., after the MRI session had ended). The first 30 min of the MRI session consisted of installing the participant in the scanner and acquiring anatomical images. The fMRI images were acquired during the last 30 min of the MRI session, ∼4.5 h after initial consumption of the drink. b, Plasma concentrations and availability of tyrosine (tyr) and phenylalanine (phen). At baseline, plasma concentrations of both tyrosine (top) and phenylalanine (middle) were equivalent in the APTD and BAL sessions but then diverged, with significantly (*) lower concentrations at both test start and test end during the APTD session. Brain availability of tyrosine (tyr) and phenylalanine (phen) (bottom), approximated by the ratio of their plasma concentration to that of all other large neutral amino acids (LNAA) (tyr + phen: ∑LNAAs), was also significantly lower at test start and test end during the APTD session. Error bars indicate SEM. Note that error bars for the APTD condition are too small to clearly visualize.
Blood samples were drawn to assess plasma amino acid levels at three times during the testing session (Fig. 2a): before ingestion of the drink (“baseline”); ∼4 h postingestion, just before the MRI session (“test start”); ∼5 h postingestion, just after the MRI session (“test end”). All samples were centrifuged immediately (24°C, 3000 rpm, 10 min) and the plasma stored at −80°C until analysis. Plasma concentrations of phenylalanine, tyrosine, and other large neutral amino acids (LNAAs; leucine, isoleucine, methionine, valine) were measured by HPLC with fluorometric detection on an Ultraspher ODS reverse-phase column (Beckman Coulter) with ophtalaldehyde precolumn derivatization and aminoadipic acid as an internal standard. Plasma concentrations of tryptophan were measured by HPLC-FD on a Bondpak reverse-phase column (Phenomenex).
Just before each blood sample, participants completed Visual Analog Scales (VAS) to indicate their subjective levels of arousal and anxiety. Specifically, participants placed marks on 10 cm lines, bounded by the following pairs of adjectives: “alert-drowsy,” “calm-excited,” “contented-discontented.” We included two additional scales that were intended to measure their subjective perception of both time-in-passing and color. Participants were asked to indicate how quickly time was appearing to pass in general, by placing a mark on a 10 cm line bounded by the adjectives “slowed down-speeded up.” Similarly, they were asked to indicate how bright colors appeared in general, by placing a mark on a 10 cm line bounded by the adjectives “duller–brighter.”
fMRI scanning
Scans were acquired using a SIEMENS MAGNETOM Trio 3 T whole-body MRI system, equipped with a head coil. The MRI session began with a 5 min structural MRI (using a standard T1-weighted scanning sequence, 1mm3 resolution). Then, echo-planar imaging was used to obtain T2*-weighted fMRI images in the axial plane, using an interleaved slice acquisition sequence. Slices were angled at 40° relative to AC–PC plane to minimize signal dropout. The acquired image volume consisted of 38 × 3.5 mm transverse slices (3.5 mm3 resolution), with an interscan interval (TR) of 2 s. The size of this image volume allowed us to scan the entire cerebral cortex and cerebellum. Four scanning runs (225 image volumes, 7.5 min per run) were acquired for each subject. The time and color conditions were presented in permuted order within each run to optimize signal strength (Josephs and Henson, 1999). Each block contained 18 trials each of the time and color conditions, giving a total of 72 trials per condition across the four scanning runs. Pseudorandomization of intertrial and interevent intervals ensured random subsampling of the brain volume relative to each of the event types. A longer random jitter of 2–4 s was introduced between Sample and Probe stimuli to minimize serial correlations and to allow for detection of differential responses.
Data analysis
Amino acids.
Because of the competition for transport across the blood–brain barrier (Oldendorf and Szabo, 1976; Harmer et al., 2001), brain availability of tyrosine and phenylalanine can be approximated by the ratio of their plasma concentration to that of other LNAAs. Therefore, as well as measuring plasma concentrations of tyrosine and phenylalanine, we also calculated an index of their brain availability as the ratio of the sum of their plasma concentrations to the sum of the concentrations of the other LNAAs (leucine, isoleucine, methionine, valine, and tryptophan). Plasma concentrations of tyrosine and phenylalanine, as well as the index of their brain availability, were analyzed at baseline, test start (∼4 h postdrink) and test end (∼5 h postdrink) using 2 × 3 × 2 repeated-measures ANOVAs with treatment (APTD/BAL) and time (baseline/test start/test end) as within-subjects factors and order (APTD-BAL/BAL-APTD) as a between-subjects factor. Spearman's rank order correlations were used to examine the relationship between APTD-induced differences in tyrosine and phenylalanine availability at test start (percentage of baseline availability in the BAL session–percentage of baseline availability in the APTD session) to APTD-induced differences in timing performance (percentage correct in the BAL session–percentage correct in the APTD session).
VAS.
For each of the five VAS, distances from the left-hand side of the 10 cm line were compared using 2 × 3 × 2 repeated-measures ANOVAs, with treatment (APTD/BAL) and time (baseline/test start/test end) as within-subjects factors, and treatment order (APTD-BAL/BAL-APTD) as a between-subjects factor.
Behavioral data.
Accuracy (percentage of trials correct) and reaction times (RTs) for time and color trials were recorded during the fMRI session. Responses for trials with RTs longer than 1500 ms were not recorded. Trials with no response (4% of all trials) were treated as missing values. Mean performance measures were compared across the APTD and BAL sessions using 2 × 2 × 2 repeated-measures ANOVAs, with task (time/color) and treatment (APTD/BAL) as within-subjects factors, and treatment order (APTD-BAL/BAL-APTD) as a between-subjects factor. Correlations between APTD-induced change in performance (percentage correct in the BAL session–percentage correct in the APTD session) and APTD-induced change in regional brain activity (adjusted activity during the BAL session–adjusted activity during the APTD session) were conducted using Spearman's rank order correlations.
fMRI data.
Image processing and analysis of fMRI data were conducted with SPM5 (http://www.fil.ion.ucl.ac.uk/spm/software/spm5; Friston et al., 1995a,b). For each subject, functional images were slice-time corrected to correct for temporal differences between slices acquired early versus late in the image volume. These images were then realigned to correct for head movement between scans. Each structural MRI was coregistered to the corresponding mean realigned functional image to put structural images into the functional brain space. All images were then spatially normalized into a standard spatial reference frame by matching each image to a standardized template from the Montreal Neurological Institute. Functional images were spatially smoothed to accommodate intersubject differences in anatomy, using isotropic Gaussian kernels of 8 mm.
Hemodynamic responses were modeled as delta functions, convolved with a synthetic hemodynamic response function (Friston et al., 1998). Data were analyzed for regionally specific changes in the resulting amplitude of the response. We defined four task-specific regressors of interest that coded the onsets of the Sample or Probe stimuli, separately for the time or color tasks (TimeSample, TimeProbe, ColorSample, and ColorProbe). The delta function coded the moment of stimulus onset and did not vary as a function of stimulus duration. To account for as much variance in the data as possible, we also defined two task-independent regressors of no-interest that coded the onsets of the cue and of the response screen in both conditions and six movement-related regressors of no-interest. Condition effects were estimated according to the general linear model at each voxel in brain space in each of the 16 participants. Images were adjusted for low-frequency physiological drifts, using a highpass filter of 128 s. Data were subject to a two-stage random-effects analysis, which allowed inferences derived from this subject sample to be generalized to the population. At the first stage of analysis, we performed 32 separate single-subject analyses, corresponding to the two experimental sessions (APTD/BAL) for each of the 16 participants. These analyses defined subject-specific statistical parametric maps (SPMs) of the t statistic (transformed into corresponding Z values) that identified differences between timing and color tasks at the Sample [TimeSample − ColorSample] and/or Probe stage of the task [TimeProbe − ColorProbe].
At the second stage of analysis, we performed two distinct sets of group comparisons. First, we entered the 16 subject-specific maps from the BAL session into one-sample t tests. These group-level BAL maps were used to confirm that patterns of regional activity specific to time or color processing (defined by the main effect [TimeSample + TimeProbe] − [ColorSample + ColorProbe] and vice versa) or to storage and comparison stages of the timing task (defined by the simple main effects [TimeSample − ColorSample] and [TimeProbe − ColorProbe]) were similar to that previously observed in nonpsychopharmacological studies using these stimuli (Coull et al., 2008).
Second, for each contrast, we compared the 16 subject-specific maps from the BAL session to the equivalent maps from the APTD session in a paired t test. The resulting group-level maps defined regions of task-specific activity that were modulated by administration of the APTD drink at the Sample or Probe stages. We differentially weighted contrast pairs to search for APTD-induced decreases or increases in timing-specific activity. For example, the contrast [BAL(TimeSample − ColorSample)] − [APTD(TimeSample − ColorSample)] would identify areas in which APTD decreased timing-specific activity at the Sample stage. The direct comparison of timing-related brain activity between APTD and BAL sessions allowed us to determine whether APTD modulated activity in some, or all, components of the BAL-related timing network (Table 3). It is crucial to note that our factorial design (treatment (BAL/APTD) × task (time/color) measured the modulatory effects of APTD on activity of a timing network, rather than its ability to excite or inhibit neural tissue directly. Any noncognitive effects of APTD on, e.g., vasculature would be canceled out since they would be equally present during both the timing and color tasks.
Table 3.
Timing subnetworks in the BAL session
| Anatomical structure | x, y, z coordinates (mm) | Z score |
|---|---|---|
| Sample | ||
| SMA | −9, 9, 42 | 5.36 |
| −3, 3, 69 | 4.48 | |
| Anterior cingulate cortex | 9, 15, 33 | 3.38 |
| Left putamen | −30, 0, 6 | 4.87 |
| Dorsolateral PFC (BA8/9/46) | −24, 27, 30 | 3.82 |
| 30, 45, 42 | 3.25 | |
| Rostral PFC (BA10) | −33, 48, 6 | 3.37 |
| 33, 42, 24 | 3.33 | |
| Inferior frontal gyrus (BA44) | −57, 15, 18 | 4.21 |
| 57, 18, 12 | 4.10 | |
| Inferior parietal cortex (BA40) | 45, −42, 51 | 4.09 |
| −63, −33, 33 | 4.55 | |
| Superior parietal cortex (BA7) | −15, −63, 57 | 4.22 |
| Posterior cingulate cortex | −6, −27, 39 | 4.25 |
| 12, −30, 39 | 3.61 | |
| Inferior temporal gyrus (BA37) | −60, −57, −6 | 4.50 |
| 66, −48, −6 | 4.08 | |
| Middle temporal gyrus (BA39) | 45, −75, 12 | 3.43 |
| Superior temporal gyrus (BA22) | −42, −27, −6 | 3.86 |
| Superior occipital cortex (BA18) | −15, −96, 18 | 4.15 |
| 18, −90, 21 | 3.67 | |
| Ventrolateral occipital cortex (BA19) | 27, −66, −9 | 4.99 |
| −24, −72, −12 | 4.66 | |
| Lateral cerebellum | 39, −42, −39 | 4.52 |
| −42, −51, −39 | 3.92 | |
| Medial cerebellum | −15, −45, −30 | 4.14 |
| 18, −78, −48 | 3.35 | |
| Probe | ||
| SMA | 21, 9, 69 | 4.63 |
| Caudate | 0, 18, 6 | 4.21 |
| Left dorsolateral PFC(BA9) | −39, 45, 30 | 3.87 |
| Inferior frontal gyrus (BA44) | 51, 15, 3 | 5.30 |
| −42, 12, 3 | 3.54 | |
| −27, 36, 0 | 3.97 | |
| Right premotor cortex (BA6) | 39, 3, 60 | 3.71 |
| Inferior parietal cortex (BA40) | 48, −33, 30 | 4.44 |
| −63, −36, 21 | 4.04 | |
| Precuneus | 3, −54, 66 | 3.59 |
| Superior temporal gyrus (BA39/41) | 45, −42, 6 | 4.32 |
| −51, −57, 6 | 4.14 | |
| −15, −42, 9 | 3.97 | |
| Lateral cerebellum | −42, −57, −33 | 3.52 |
| 36, −45, −48 | 3.73 |
Brain regions activated more by the time than color task following the balanced (BAL) control drink, during presentation of either the initial Sample or subsequent Probe stimulus. All activations are significant at a threshold of p < 0.05 (corrected for multiple comparisons at the whole-brain level). BA, Brodmann's area.
The threshold for significance for group-level comparison maps was p < 0.05, corrected (using False Discovery Rate) for multiple comparisons, with a cluster size of >5 voxels. This threshold was used for both whole-brain analyses and region of interest (Small Volume Correction) analyses. In other words, the regions revealed by the group-level comparisons were considered statistically significant if they either reached the p < 0.05 corrected threshold at the whole-brain level or reached the p < 0.05 corrected threshold after Small Volume Correction in predefined regions of interest. Timing-specific regions of interest were anatomically defined (using the Anatomical Automatic Labeling [AAL]) database; Tzourio-Mazoyer et al., 2002) and selected a priori on the basis of two previous fMRI studies of the same paradigm (Coull et al., 2004, 2008) as well as a meta-analysis of 14 fMRI studies of perceptual timing (Wiener et al., 2010). Specifically, we interrogated AAL-defined putamen, SMA (pre-SMA and SMA proper), and dorsolateral PFC bilaterally, as well as right-lateralized inferior frontal cortex and superior temporal cortex, applying small volume corrections to activations in these areas. Color-specific regions of interest were based on a prior fMRI study of this paradigm (Coull et al., 2008) and included area V4 of ventral occipital cortex, as well as bilateral inferior frontal and parietal cortices.
The comparison of timing- to color-related activity across the BAL versus APTD sessions (i.e., the task × treatment interaction) confounds APTD-induced decreases in timing with BAL-induced increases in color perception (and vice versa). Therefore, to pinpoint areas of activation caused by APTD-induced modulation of timing-related activity, rather than BAL-induced modulation of color-related activity, we inclusively masked the difference between BAL and APTD task-induced activity (i.e., the paired t test) with the relevant task-specific activity from the BAL session (i.e., the one sample t test). For example, [BAL(TimeSample − ColorSample)] − [APTD(TimeSample − ColorSample)] was inclusively masked by [BAL(TimeSample − ColorSample)] thresholded at p < 0.001, uncorrected for multiple comparisons). Parameter estimates (β values) in regions of interest were extracted using the MarsBaR region of interest toolbox (Brett et al., 2002). β Values were plotted for each of the experimental conditions to aid data interpretation. Moreover, APTD-induced changes in β values were correlated with APTD-induced changes in performance (percentage correct) to examine the link between APTD effects on brain activity and resulting behavior.
Finally, although our study was not originally designed to address this question, we conducted a more exploratory set of analyses in which we examined the effects of APTD as a function of stimulus duration, given very recent genetic evidence that DA preferentially modulates subsecond, rather than suprasecond, timing (Wiener et al., 2011). Since our discrimination task mixed stimuli of subsecond (540 ms) and suprasecond (1080/1620 ms) durations within the same trial, we could not use behavioral data to determine whether APTD differentially impaired subsecond versus suprasecond timing. However, the temporal resolution of fMRI allowed us to separate activity related to the Sample stimulus from that related to the Probe stimulus, meaning the effects of APTD on subsecond versus suprasecond durations could be examined at the neural level. We focused our analyses on activity at the Sample stage since activity at the Probe stage might differ according to whether the previous Sample was shorter, longer, or of the same duration (thus potentially confounding processes of matching or temporal expectation with straightforward stimulus timing). We sorted both time and color trials according to whether the Sample stimulus had a duration of 540 ms, 1080 ms, or 1620 ms (24 trials per duration per condition). We used paired t tests to compare the [TimeSample − ColorSample] contrast across the BAL and APTD sessions for the 540, 1080, and 1620 ms trials separately. For example, [BAL(TimeSample540 − ColorSample540)] − [APTD(TimeSample540 − ColorSample540)] indexed the between-session comparison of the 540 ms Sample stimuli in the time condition to the 540 ms Sample stimuli in the color condition. As before, each paired t test was inclusively masked by the relevant task-specific activity from the BAL one-sample t test (e.g., [BAL(TimeSample540 − ColorSample540)] − [APTD(TimeSample540 − ColorSample540)] was inclusively masked by [BAL(TimeSample540 − ColorSample540)] thresholded at p < 0.001). Given the post hoc nature of these analyses, we restricted our search volume to the anatomically defined timing-specific regions of interest listed above (putamen, SMA, dorsolateral PFC, right inferior frontal cortex, right superior temporal cortex), using a significance threshold of p < 0.05 (corrected for multiple comparisons within these regions of interest).
Results
Amino acids
Absolute plasma concentrations of tyrosine (F(1,14) = 180.07, p < 0.0001) and phenylalanine (F(1,14) = 211.18, p < 0.0001) were significantly lower in the APTD session than the BAL session. Significant interactions between treatment and time revealed that for both tyrosine (F(2,28) = 177.40, p < 0.0001) and phenylalanine (F(2,28) = 163.67, p < 0.0001) plasma concentrations were initially equivalent in the APTD and BAL sessions at baseline, but then diverged, with significantly lower concentrations at both test start and test end during the APTD session (Fig. 2b). Similarly, the ratio of plasma tyrosine and phenylalanine to other LNAAs, an index of brain availability of tyrosine and phenylalanine, was significantly lower in the APTD versus BAL session (F(1,14) = 157.04, p < 0.0001), with the ratio being equivalent at baseline but then decreasing at both test start and test end during the APTD session (F(2,28) = 60.29, p < 0.0001) (Fig. 2b).
VAS
Neither the main effect of treatment (BAL/APTD), nor the treatment × test-time interaction, was significant for any of the VAS measures (Table 1).
Table 1.
VAS scores
| BAL |
APTD |
|||||
|---|---|---|---|---|---|---|
| Baseline | Test start | Test end | Baseline | Test start | Test end | |
| Alert–drowsy | 44.1 (6.1) | 47.4 (6) | 60.31 (6) | 50.9 (5.7) | 47.6 (6) | 55.1 (5.2) |
| Calm–excited | 26.6 (4.1) | 31.5 (4.9) | 32.87 (5.6) | 38.4 (3.1) | 44.4 (4.1) | 31.6 (3.2) |
| Content–discontent | 31.9 (3.2) | 39.6 (4.5) | 36.5 (4.4) | 39.8 (5.2) | 39.6 (5.3) | 36.9 (4.1) |
| Time: slow–fast | 46.4 (1.6) | 49.8 (2.8) | 44.33 (5) | 49.5 (3.1) | 48.2 (3.3) | 44.1 (5.0) |
| Colors: dull–bright | 53.0 (4.3) | 49.9 (1.2) | 49.27 (4.1) | 49.3 (1.7) | 51.2 (2.4) | 48.6 (3.1) |
Mean (± SE) Visual Analogue Scale (VAS) scores for the subjective perception of alertness, calmness, contentment, speed-of-time-passing, and brightness of colors. Scores range from 1 to 100 with 50 indicating a neutral state. The lower the score, the more the subject identifies with the leftmost adjective of the 100 mm line (i.e. alert, calm, contented, time slowed, colors dull).
Behavioral data
There were no significant main effects of task (F(1,14) = 3.17, n.s.) on accuracy of performance, confirming that the time and color tasks were matched for difficulty. However, a significant interaction between treatment and task [F(1,14) = 5.85, p < 0.05] revealed that compared with BAL, APTD reduced accuracy during the timing task but not during the color task (Fig. 3a). This effect did not interact with treatment order (F(1,14) = 0.001, n.s.), demonstrating that the effect was similar whether participants received APTD in the first or second test session. Although RTs in the timing task (729.2 ± 24.1 ms) were generally faster (F(1,14) = 6.99, p < 0.05) than those in the color task (764.18 ± 25.2 ms), this effect did not interact with treatment (F(1,14) = 0.29, n.s.), confirming the lack of effect of APTD on RTs in general (F(1,14) = 0.36, n.s.). The APTD-induced impairment in timing performance did not significantly correlate with the APTD-induced reduction in the ratio of plasma tyrosine and phenylalanine to other LNAAs (ρ = 0.24, n.s.).
Figure 3.

a, Behavioral performance. APTD selectively impaired accuracy (proportion correct) of temporal discrimination (*), while having no effect on accuracy of color discrimination. Error bars indicate SEM. b, Brain-behavior correlations. The APTD-induced impairment in timing performance correlated significantly with APTD-induced decreases in activity of SMA and putamen. Specifically, differences in accuracy between the BAL and APTD sessions were correlated to differences in neural activity between the two sessions. For each individual subject, neural activity (β values) was extracted from the SMA and putamen clusters identified by the SPM group analysis, illustrated in Figure 4. Plots show data from 15 subjects, after one outlier had been removed (see Results for details).
fMRI data
Task-specific activity (BAL session only)
We first directly compared activity induced by the time task to that induced by the color task using data from the BAL session only. Time-specific activations were observed in a distributed bilateral network of regions including SMA; cerebellum; and prefrontal, parietal, and temporal cortices (Table 2, Time–color). Color-specific activations were observed in ventral extrastriate cortex, as well as left frontal and parietal cortices (Table 2, Color–time). These results confirm prior studies using these stimuli (Coull et al., 2004, 2008) and ensure that participants were performing the tasks as expected.
Table 2.
Task-specific activity in the BAL session
| Anatomical structure | x, y, z coordinates (mm) | Z score |
|---|---|---|
| Time–color | ||
| SMA | −9, −3, 63 | 4.60 |
| 3, 3, 69 | 5.39 | |
| 27, 12, 66 | 5.51 | |
| Anterior cingulate cortex | −9, 12, 39 | 4.78 |
| 9, 18, 36 | 4.37 | |
| Dorsolateral PFC (BA9) | −39, 42, 27 | 4.95 |
| 33, 45, 33 | 4.06 | |
| Rostral PFC (BA10) | −33, 48, 9 | 4.04 |
| 21, 51, 21 | 4.86 | |
| Inferior frontal gyrus (BA44/45/47) | −42, 18, 6 | 3.69 |
| −51, −3, 21 | 5.13 | |
| 48, 15, −6 | 5.38 | |
| Inferior parietal cortex (BA40) | −57, −45, 42 | 5.43 |
| 60, −39, 30 | 5.03 | |
| Posterior cingulate cortex | −12, −63, 57 | 5.14 |
| 15, −30, 36 | 4.41 | |
| Inferior temporal gyrus (BA20/37) | −60, −60, −3 | 4.32 |
| 48, −27, −15 | 5.13 | |
| Middle temporal gyrus (BA21/39) | −51, −57, 9 | 4.88 |
| 57, −48, 6 | 4.70 | |
| Superior temporal gyrus (BA22/42) | −57, −42, 12 | 4.50 |
| 66, −45, 12 | 3.85 | |
| 57, −33, 12 | 4.31 | |
| Lateral cerebellum | −39, −57, −33 | 5.13 |
| 36, −42, −42 | 4.77 | |
| Color–time (*) | ||
| Left inferior frontal cortex (BA44/9) | −39, 9, 27 | 3.49 |
| Left intraparietal sulcus (BA40) | −27, −69, 45 | 3.10 |
| Posterior ventral extrastriate cortex (BA18) | 27, −93, −9 | 3.23 |
| −27, −93, −9 | 2.91 | |
| Left anterior ventral extrastriate cortex (V4) | −45, −54, −15 | 2.89 |
Brain regions differentially activated by the time or color task following the balanced (BAL) drink, averaged across Sample and Probe stimuli. Activations are significant at a threshold of p < 0.05 (corrected for multiple comparisons at the whole-brain, or region of interest (*), level). BA, Brodmann's area.
Timing subnetworks (BAL session only)
We further distinguished time-specific activity during the BAL session at the Sample and Probe stages of the task separately. Time-specific activations at the Sample stage were observed in a distributed network of regions including SMA; left putamen; cerebellum; and prefrontal, parietal, and temporal cortices bilaterally (Table 3, Sample). During the Probe stage, time-specific activity was observed in SMA; caudate; cerebellum; and prefrontal, parietal, and temporal cortices bilaterally (Table 3, Probe). These results confirm prior studies (Rao et al., 2001, Coull et al., 2008), showing selective activation of putamen during the Sample stage of the task, and of SMA during both Sample and Probe stages of the task. Right prefrontal and superior temporal cortices were activated during the Probe stage of the task, again confirming prior results (Rao et al., 2001, Coull et al., 2008; Harrington et al., 2010), although in the current study these regions were also activated during the Sample stage.
APTD modulation of timing networks
The primary objective of this study was to identify which regions of the time-specific network were modulated by APTD. We therefore directly compared time-specific activation maps across the BAL and APTD sessions. Comparisons were conducted separately for the Sample and Probe stages of the task to examine whether APTD modulated timing performance by affecting storage and/or retrieval of temporal information respectively.
During the Sample stage of the task, APTD significantly decreased time-specific activity within left putamen (x,y,z coordinates = −27, −3, 6; Z = 4.35; p < 0.005, small volume corrected) and SMA (x,y,z coordinates = −12, 6, 66; Z = 3.40; p < 0.05, small volume corrected) (Fig. 4). We also noted a trend for APTD to decrease activity in left dorsolateral prefrontal cortex (x,y,z coordinates = −27, 42, 33; Z = 3.78; p = 0.06, small volume corrected). When the threshold was lowered to a significance threshold uncorrected for multiple comparisons (p < 0.001), an additional decrease in activity in the supramodal zone (O'Reilly et al., 2010) of right cerebellum (lobule VIIa crus I; x,y,z coordinates = 39, −45, −42; Z = 4.41; p = 0.16, whole-brain corrected, p < 0.001 uncorrected) was observed, which, although not predicted from prior studies using this task, we nevertheless report given prior evidence of cerebellar involvement in timing (Ivry and Spencer, 2004; O'Reilly et al., 2008). At the Probe stage of the task, APTD had no effect on activity in any time-specific regions, even at a liberal threshold (p < 0.01, uncorrected for multiple comparisons). Finally, APTD did not increase activity in any time-specific regions, at either the Sample or Probe stage of the task.
Figure 4.
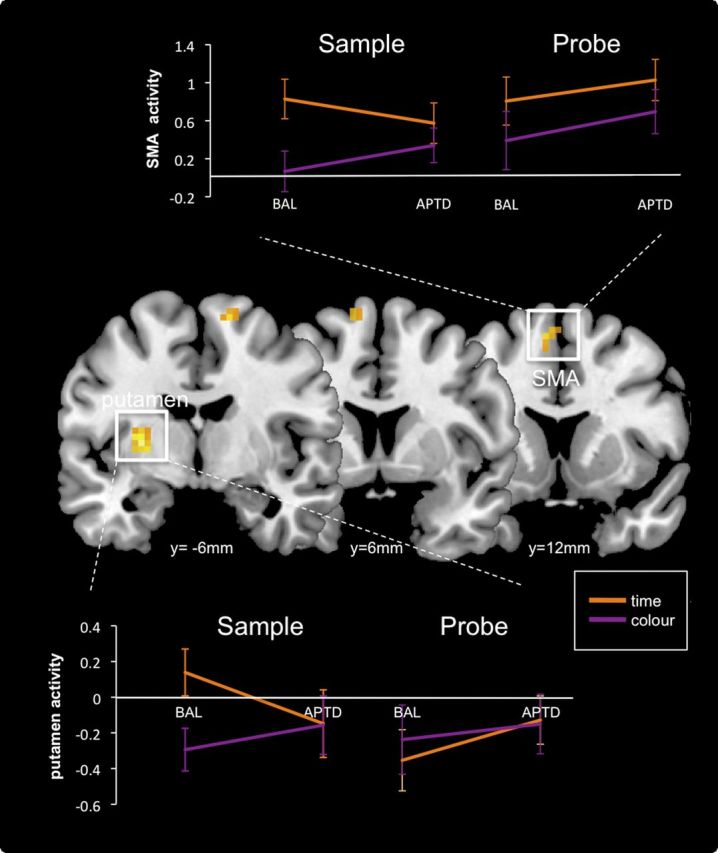
Timing-specific effects of APTD. APTD attenuated timing-induced activity in left putamen and SMA selectively during presentation of the first Sample stimulus. There were no time-specific effects of APTD during presentation of the subsequent Probe. APTD effects were computed by subtracting time-specific activity (regions activated more by the Time than Color task) in the APTD session from that in the BAL session. Regions of attenuated activity are displayed on coronal slices of a standard template brain using MRIcron software (www.mricro.com/mricron). The left hemisphere is on the left side of the figure. Spatial coordinates (millimeters) define the anatomical location of each slice in the rostrocaudal direction. Effects are thresholded at p < 0.05 (small volume corrected) and p < 0.001, uncorrected for multiple comparisons. The accompanying plots illustrate the mean level of activity (β values) in each cluster during the time (orange) or color (purple) condition, at the Sample or Probe stage of the task. Error bars indicate SEM. During the BAL session, SMA (top) was activated more by the timing task than the color task during both the initial Sample stimulus and the subsequent Probe, but left putamen (bottom) was preferentially activated by the timing task during the initial Sample stimulus only, confirming prior results (Rao et al., 2001; Coull et al., 2008). APTD significantly attenuated timing-selective activity in putamen and SMA during the initial Sample stimulus only.
In summary, APTD significantly attenuated activity within left putamen and SMA selectively during timing of an initial Sample duration. The activity plots in Figure 4 illustrate that during the BAL session, putamen was preferentially activated by the timing, versus color, task at the Sample stage of the task only (confirming prior reports) and that ingestion of the APTD drink significantly reduced this timing-induced activity. SMA, on the other hand, was activated more by the time than color task during both Sample and Probe stages of the task during the BAL session, again confirming prior reports, but APTD attenuated SMA activity selectively during the Sample stage only.
Correlations between brain activity and behavior
To examine the impact of APTD's attenuation of brain activity on timing performance, we correlated the APTD-induced decrease in activity of SMA and putamen with the APTD-induced decrease in timing performance. A significant correlation between the effects of APTD on SMA activity and performance (ρ = 0.45, p < 0.05) demonstrated that the more APTD reduced activity in SMA at the Sample stage of the timing task, the more it impaired timing performance (Fig. 3b, top). The equivalent correlation between activity in the putamen and timing performance was nonsignificant when data from all 16 participants were analyzed (ρ = 0.25, n.s.). However, when we removed one outlier (S07) from the analysis, a significant relationship was revealed (ρ = 0.44, p = 0.05), such that the greater the APTD-induced reduction in putamen activity, the greater the impairment in timing performance (Fig. 3b, bottom). Participant S07 was considered an outlier because his timing accuracy in the APTD session was >2.5 SDs below the group mean (although his timing accuracy in the BAL session and his color accuracy in both sessions was equivalent to the group mean). Importantly, the correlation between APTD-induced decreases in SMA activity and timing performance was still significant (ρ = 0.48, p < 0.05) when this participant's data were excluded from the analysis. Moreover, despite the markedly deleterious effect of APTD on timing performance in this participant, the effect of APTD on timing in the group as a whole was still significant when this participant's data were excluded from the treatment × task ANOVA (F(1,13) = 8.80, p < 0.05). The subthreshold modulation of activity in PFC and cerebellum by APTD did not correlate with the APTD-induced impairment in timing performance.
Subsecond versus suprasecond durations and modulation by APTD
First, using data from the BAL session only, we identified time-specific activity separately for each of the three Sample stimulus durations (540 ms, 1080 ms, or 1620 ms). Time-specific activations were observed in SMA for all three durations, though only the 540 ms duration engaged the full corticostriatal timing network (Table 4). Second, to examine the effects of APTD on subsecond versus suprasecond durations, we directly compared Time-specific activations during the BAL versus APTD sessions for each of the three durations independently. For 540 ms stimuli, APTD attenuated time-specific activity within left putamen (x,y,z coordinates = −18, 6, −6; Z = 3.88) (Fig. 5) and both left (−27, 27, 30; Z = 4.59) and right (27, 36, 33; Z = 3.72) dorsolateral prefrontal cortices. There were no significant effects of APTD on any timing-specific regions of interest for either 1080 ms or 1620 ms stimuli.
Table 4.
Duration-specific timing networks in the BAL session
| Anatomical structure | x, y, z coordinates (mm) | Z score |
|---|---|---|
| 540 ms | ||
| SMA | −12, −3, 66 | 4.59 |
| Anterior cingulate | −6, 12, 33 | 3.73 |
| Left putamen | −27, 6, 6 | 5.18 |
| Dorsolateral PFC(BA9) | −27, 39, 33 | 4.85 |
| 33, 42, 36 | 4.40 | |
| Right inferior frontal gyrus (BA44) | 57, 15, 12 | 4.66 |
| Inferior parietal cortex (BA40) | 60, −36, 48 | 4.19 |
| −54, −45, 27 | 4.04 | |
| Posterior cingulate | −6, −27, 33 | 4.05 |
| Precuneus | 6, −42, 45 | 4.50 |
| Middle temporal gyrus (BA19/21) | 42, −75, 21 | 3.85 |
| −63, −51, −6 | 3.56 | |
| Ventrolateral occipital cortex (BA19/37) | 24, −72, −6 | 3.41 |
| 39, −45, −15 | 3.99 | |
| Superior occipital cortex (BA18) | 6, −99, 12 | 4.01 |
| Lateral cerebellum | 42, −51, −36 | 3.89 |
| −36, −60, −33 | 4.05 | |
| Medial cerebellum | 21, −72, −45 | 4.18 |
| −24, −69, −45 | 3.77 | |
| 1080 ms | ||
| SMA | −6, 3, 66 | 3.87 * |
| Left anterior parietal cortex | −54, −24, 36 | 4.76 |
| Left premotor cortex | −45, −6, 39 | 4.19 |
| 1620 ms | ||
| SMA | −9, 0, 66 | 3.55 * |
Brain regions activated more by timing than color discrimination of Sample stimuli following ingestion of the balanced (BAL) control drink, for Sample durations of 540 ms, 1080 ms, or 1620 ms. All activations are significant at a threshold of p < 0.05 (corrected for multiple comparisons at the whole-brain, or regions of interest (*), level). BA, Brodmann's area.
Figure 5.

Duration-specific effects in putamen. During presentation of the Sample stimulus, APTD selectively attenuated timing-induced (*), but not color-induced, activity in left putamen for subsecond (540 ms) but not suprasecond (1080 ms or 1620 ms) stimuli. Measures of regional activity (β values) during the time and color tasks were extracted from the cluster displayed on the accompanying transverse slice of the canonical SPM template brain. The left hemisphere is on the left side of the figure. Effects are thresholded at p < 0.05 (small volume corrected). Error bars indicate SEM.
Discussion
We modified DA functioning in healthy volunteers with an amino acid drink deficient in the DA precursors phenylalanine and tyrosine (APTD), then used fMRI to identify the functional and neuroanatomical substrates of the DA modulation of timing. Although APTD is an indirect modulator of DA function, its effects on availability of DA precursors were comparable to prior studies showing reduced DA release in humans (Montgomery et al., 2003; Leyton et al., 2004). APTD selectively impaired timing performance, reducing accuracy of duration, but not color, discriminations. This APTD-induced impairment in perceptual timing was accompanied by APTD-induced attenuation of brain activity in left putamen of the basal ganglia and SMA. Moreover, behavioral and neural effects were significantly correlated: the more APTD attenuated activity in putamen or SMA, the more it perturbed timing performance.
The APTD-induced timing impairment is consistent with results of prior studies demonstrating DA effects on perceptual timing in PD patients (Artieda et al., 1992) and healthy volunteers (Rammsayer, 1999). The D2 receptor antagonist haloperidol, for example, perturbs timing of both 50 and 1000 ms intervals (Rammsayer, 1999; Rammsayer et al., 2001). However, 1000 ms timing was similarly impaired by noradrenergic and GABAergic drugs. Since timing in the seconds range (∼>500 ms) requires WM (Gibbon et al., 1984; Michon, 1985; Fortin et al., 1993) but timing for tens of milliseconds does not, Rammsayer (1997, 1999) concluded the pharmacological nonspecificity for 1000 ms timing reflected WM, rather than temporal, dysfunction. Yet APTD selectively impaired performance on temporal, not color, discrimination, despite tasks being matched for WM demand. Such task specificity suggests APTD selectively impairs the temporal component of seconds-range timing over and above any collateral effects it may have on WM or, indeed, any other cognitive process matched across tasks (sustained attention, motor preparation).
Based on differential pharmacological properties of distinct DA drugs, Rammsayer (1997) suggested DA modulates timing via the nigrostriatal, rather than mesocortical, pathway. Our neuroimaging approach affords a more direct window onto the neuroanatomical distribution of the DA effect and confirms Rammsayer's speculation: APTD attenuated timing-specific activity in putamen and SMA, which are functionally (Postuma and Dagher, 2006) and anatomically (Lehéricy et al., 2004) connected components of the nigrostriatal “motor” pathway (Alexander et al., 1986). Our data lend further support to the vast body of work in rats demonstrating the importance of striatal DA for timing (Meck, 1986, 1996). The spatial resolution of fMRI localized basal ganglia activation to the putamen, confirming lesion studies in rats (Meck, 2006) while the whole-brain approach revealed additional APTD-induced attenuation of activity in SMA. Prior fMRI studies of timing in PD have shown DA modulation of frontostriatal connectivity and of activity in PFC (Jahanshahi et al., 2010; Harrington et al., 2011). However, the predominantly frontal, rather than striatal, pattern of DA modulation in these patients could be explained by their underlying basal ganglia dysfunction. We provide the first evidence in healthy volunteers of DA modulation of striatal activity and, crucially, show that APTD's reduction in timing-specific brain activity correlated with its deleterious effects on performance, providing compelling evidence that APTD perturbs timing by attenuating activity in putamen and SMA.
Intriguingly, APTD's effects in putamen were greater for subsecond, than suprasecond, durations, supporting recent genetics evidence that striatal DA is particularly crucial for subsecond timing (Wiener et al., 2011). Alternatively, our results may simply reflect the fact that suprasecond durations invoked less timing-specific activity than subsecond ones (Table 4), affording less scope for modulation. Possibly, during suprasecond stimuli, participants stopped timing before stimulus offset, as soon as a temporal decision could be reached (van Rijn et al., 2011), thereby reducing timing-specific activity for these stimuli. Future studies should employ stimuli of different durations on every trial to encourage participants to time parametrically, rather than categorically. Moreover, studies using suprasecond durations only, with appropriate controls for subvocal counting, may yet reveal APTD-induced modulation of suprasecond timing. Nevertheless, these results reinforce our hypothesis that APTD effects reflect impairment of temporal, not mnemonic, processes since subsecond timing relies less on WM than suprasecond timing.
fMRI is more than just a phrenological tool. By measuring brain activity at discrete stages of the timing task fMRI can pinpoint the stage of temporal information processing at which DA exerts its effects. When compared with tasks that controlled not only for sensorimotor processes but also decision-related and attentional demands, whole-brain voxelwise analysis revealed that visual (Coull et al., 2008) or auditory (Rao et al., 2001; Harrington et al., 2010) timing tasks activated putamen during initial encoding and storage of Sample duration only [although Harrington et al. (2010) observed timing-related putamen activation during both storage and comparison stages of their task; this was only when post hoc ANOVAs were conducted on functional regions of interest that had been defined using the voxelwise analysis of the same, i.e., nonindependent, dataset]. In contrast, right PFC and superior temporal cortex were recruited selectively during subsequent retrieval and comparison of the stored duration to an ongoing Probe. SMA, however, was activated during presentation of both Sample and Probe (Coull et al., 2008; Harrington et al., 2010), therefore potentially underpinning timing of stimulus duration per se (Macar et al., 2002; Wencil et al., 2010). We found that APTD attenuated timing-induced activity in left putamen and SMA selectively during presentation of the initial Sample stimulus, suggesting it impairs timing by modulating storage of temporal information into WM. Left putamen has previously been implicated in encoding or storage of stimulus duration, with higher activity predicting better timing performance (Coull et al., 2008), a finding perhaps analogous to the left-lateralization of putamen activity observed during the encoding stage of verbal WM (Rypma and D'Esposito, 2000; Chang et al., 2007).
Notably, APTD-induced changes in neural activity at the Sample stage predicted APTD effects on subsequent timing performance. This is consistent with the role of striatal DA in selecting relevant stimuli in the storage of new memories (Frank et al., 2005). Indeed, during the Wisconsin Card Sort Test, APTD selectively attenuated frontostriatal connectivity when new rules were presented, but had no effect when stimuli were being matched to those rules (Nagano-Saito et al., 2008). In our task, sample stimuli can be considered as new temporal rules against which subsequent probe stimuli are then matched. Since APTD effects were selective to the timing, not color task, we suggest a preferential role for striatal DA in storing temporally, rather than visually, relevant stimulus characteristics. In contrast, APTD did not modulate any timing-induced activity at the Probe, or matching, stage of the task. Matching (or “coincidence detection”) of stimulus duration is also thought to depend upon striatal DA (Matell and Meck, 2000, 2004). Yet although the caudate nucleus was preferentially activated by timing during the Probe, or matching, stage of the task, its activity was not modulated by APTD.
Our findings complement prior reports that l-dopa therapy normalizes temporal memory dysfunction in parkinsonian patients (Malapani et al., 1998, 2002; Koch et al., 2005) by showing that in the healthy brain, DA preferentially modulates initial storage, rather than subsequent retrieval, of stimulus duration. In contrast, our data are at odds with results from animal studies, suggesting temporal memory is mediated by acetylcholine whereas DA mediates the speed of a putative internal clock (Meck, 1996). This discrepancy may be partially explained by cross-species differences in the type of memory into which durations are stored. Our human volunteers stored durations temporarily in WM, a mnemonic system mediated primarily by DA (Goldman-Rakic, 1996; Robbins and Arnsten, 2009). Conversely, rats acquired durations through prolonged training and conditioning, mnemonic processes associated more with cholinergic function (Hasselmo, 2006; Robinson et al., 2011). Moreover, clock speed could not be investigated in our experiment since any DA-induced slowing would have affected Sample and Probe durations equally, effectively canceling out clock-speed effects on performance. Future investigations in which sample durations are trained before versus after APTD ingestion (Malapani et al., 2002) could help disentangle whether timing impairments are due to clock-speed or memory storage effects.
Despite significant timing-induced PFC activation during the BAL session, APTD failed to show the hypothesized modulation of PFC activity during the Probe stage of the task, and only marginally attenuated left PFC activity during the Sample. Given the importance of prefrontal DA for WM, and of WM for timing, this might appear surprising. However, it may be due precisely to the fact that WM demands of the timing and control tasks were matched, effectively factoring WM out of the paradigm. Moreover, this further confirms that APTD impairs timing beyond any parallel effects it may have on PFC-mediated processes, such as WM. Alternatively, given that timing-induced PFC activity can be modulated by other DA agents, such as the DA agonist apomorphine (Jahanshahi et al., 2010), our lack of prefrontal modulation may be because APTD preferentially targets striatal, rather than frontal, activity (Le Masurier et al., 2004). Prior findings that APTD has no effect on WM performance (Ellis et al., 2005; Lythe et al., 2005; Mehta et al., 2005) and associated PFC activity (Ellis et al., 2007) may be because APTD preferentially modulates tasks dependent on nigrostriatal (e.g., timing), rather than mesocortical (e.g., WM), functioning (Vrshek-Shallhorn et al., 2006). Future studies in healthy volunteers using DA agents that preferentially modulate mesocortical pathways may yet reveal modulation of timing-induced PFC activity.
In conclusion, the spatial and temporal resolution of event-related fMRI allowed us to pinpoint both the neuroanatomical and functional substrates of the DA modulation of timing while the matched control task allowed us to exclude the possibility that results merely reflected modulation of confounding cognitive processes, such as WM or attention. Our data show for the first time in healthy humans that DA exerts its effects on timing by modulating activity in putamen and SMA during initial storage of stimulus duration.
Footnotes
This work was jointly funded by an Agence Nationale de la Recherche contract (ANR-07-NEURO-033-01) awarded to J.T.C., and a Quebec BioImaging Network Pilot Project grant awarded to A.D., M.L., and J.T.C. We gratefully thank Maria Zacchia, Sylvia Cox, and Crystal Clark for their help in setting up the experiment; Lesley Fellows for providing testing space; and Franceen Lenoff for analyzing blood samples.
References
- Alexander GE, DeLong MR, Strick PL. Parallel organization of functionally segregated circuits linking basal ganglia and cortex. Annu Rev Neurosci. 1986;9:357–381. doi: 10.1146/annurev.ne.09.030186.002041. [DOI] [PubMed] [Google Scholar]
- Allman MJ, Meck WH. Pathophysiological distortions in time perception and timed performance. Brain. 2012;135:656–677. doi: 10.1093/brain/awr210. [DOI] [PMC free article] [PubMed] [Google Scholar]
- Artieda J, Pastor MA, Lacruz F, Obeso JA. Temporal discrimination is abnormal in Parkinson's disease. Brain. 1992;115:199–210. doi: 10.1093/brain/115.1.199. [DOI] [PubMed] [Google Scholar]
- Brett M, Anton J-L, Valabregue R, Poline J-B. Region of interest analysis using an SPM toolbox. 8th International Conference on Functional Mapping of the Human Brain; Sendai, Japan. 2002. Neuroimage, 16. [Google Scholar]
- Buhusi CV, Meck WH. What makes us tick? Functional and neural mechanisms of interval timing. Nat Rev Neurosci. 2005;6:755–765. doi: 10.1038/nrn1764. [DOI] [PubMed] [Google Scholar]
- Carroll CA, Boggs J, O'Donnell BF, Shekhar A, Hetrick WP. Temporal processing dysfunction in schizophrenia. Brain Cogn. 2008;67:150–161. doi: 10.1016/j.bandc.2007.12.005. [DOI] [PMC free article] [PubMed] [Google Scholar]
- Carroll CA, O'Donnell BF, Shekhar A, Hetrick WP. Timing dysfunctions in schizophrenia span from millisecond to several-second durations. Brain Cogn. 2009;70:181–190. doi: 10.1016/j.bandc.2009.02.001. [DOI] [PubMed] [Google Scholar]
- Chang C, Crottaz-Herbette S, Menon V. Temporal dynamics of basal ganglia response and connectivity during verbal working memory. Neuroimage. 2007;34:1253–1269. doi: 10.1016/j.neuroimage.2006.08.056. [DOI] [PubMed] [Google Scholar]
- Cools R, Gibbs SE, Miyakawa A, Jagust W, D'Esposito M. Working memory capacity predicts dopamine synthesis capacity in the human striatum. J Neurosci. 2008;28:1208–1212. doi: 10.1523/JNEUROSCI.4475-07.2008. [DOI] [PMC free article] [PubMed] [Google Scholar]
- Coull JT, Vidal F, Nazarian B, Macar F. Functional anatomy of the attentional modulation of time estimation. Science. 2004;303:1506–1508. doi: 10.1126/science.1091573. [DOI] [PubMed] [Google Scholar]
- Coull JT, Nazarian B, Vidal F. Timing, storage, and comparison of stimulus duration engage discrete anatomical components of a perceptual timing network. J Cogn Neurosci. 2008;20:2185–2197. doi: 10.1162/jocn.2008.20153. [DOI] [PubMed] [Google Scholar]
- Coull JT, Cheng RK, Meck WH. Neuroanatomical and neurochemical substrates of timing. Neuropsychopharmacology. 2011a;36:3–25. doi: 10.1038/npp.2010.113. [DOI] [PMC free article] [PubMed] [Google Scholar]
- Coull JT, Morgan H, Cambridge VC, Moore JW, Giorlando F, Adapa R, Corlett PR, Fletcher PC. Ketamine perturbs perception of the flow of time in healthy volunteers. Psychopharmacology. 2011b;218:543–556. doi: 10.1007/s00213-011-2346-9. [DOI] [PMC free article] [PubMed] [Google Scholar]
- Ellis KA, Mehta MA, Wesnes KA, Armstrong S, Nathan PJ. Combined D1/D2 receptor stimulation under conditions of dopamine depletion impairs spatial working memory performance in humans. Psychopharmacology. 2005;181:771–780. doi: 10.1007/s00213-005-0019-2. [DOI] [PubMed] [Google Scholar]
- Ellis KA, Mehta MA, Naga Venkatesha Murthy PJ, McTavish SF, Nathan PJ, Grasby PM. Tyrosine depletion alters cortical and limbic blood flow but does not modulate spatial working memory performance or task-related blood flow in humans. Hum Brain Mapp. 2007;28:1136–1149. doi: 10.1002/hbm.20339. [DOI] [PMC free article] [PubMed] [Google Scholar]
- Elsinger CL, Rao SM, Zimbelman JL, Reynolds NC, Blindauer KA, Hoffmann RG. Neural basis for impaired time reproduction in Parkinson's disease: an fMRI study. J Int Neuropsychol Soc. 2003;9:1088–1098. doi: 10.1017/S1355617703970123. [DOI] [PubMed] [Google Scholar]
- Elvevåg B, McCormack T, Gilbert A, Brown GD, Weinberger DR, Goldberg TE. Duration judgements in patients with schizophrenia. Psychol Med. 2003;33:1249–1261. doi: 10.1017/s0033291703008122. [DOI] [PubMed] [Google Scholar]
- Fortin C, Rousseau R, Bourque P, Kirouac E. Time estimation and concurrent nontemporal processing: specific interference from short-term-memory demands. Percept Psychophys. 1993;53:536–548. doi: 10.3758/bf03205202. [DOI] [PubMed] [Google Scholar]
- Frank MJ. Dynamic dopamine modulation in the basal ganglia: a neurocomputational account of cognitive deficits in medicated and nonmedicated Parkinsonism. J Cogn Neurosci. 2005;17:51–72. doi: 10.1162/0898929052880093. [DOI] [PubMed] [Google Scholar]
- Friston KJ, Fletcher P, Josephs O, Holmes A, Rugg MD, Turner R. Event-related fMRI: characterizing differential responses. Neuroimage. 1998;7:30–40. doi: 10.1006/nimg.1997.0306. [DOI] [PubMed] [Google Scholar]
- Friston KJ, Ashburner J, Poline J-B, Frith CD, Heather JD, Frackowiak RSJ. Spatial registration and normalisation of images. Hum Brain Mapp. 1995a;2:165–189. [Google Scholar]
- Friston KJ, Holmes AP, Worsley KJ, Poline J-B, Frith CD, Frackowiak RSJ. Statistical parametric maps in functional imaging: a general linear approach. 1995b;2:189–210. [Google Scholar]
- Gibbon J, Church RM, Meck WH. Scalar timing in memory. Ann N Y Acad Sci. 1984;423:52–77. doi: 10.1111/j.1749-6632.1984.tb23417.x. [DOI] [PubMed] [Google Scholar]
- Goldman-Rakic PS. Regional and cellular fractionation of working memory. Proc Natl Acad Sci U S A. 1996;93:13473–13480. doi: 10.1073/pnas.93.24.13473. [DOI] [PMC free article] [PubMed] [Google Scholar]
- Grondin S, Ouellet B, Roussel ME. Benefits and Limits of Explicit Counting for Discriminating Temporal Intervals. Can J Exp Psychol. 2004;58:1–12. doi: 10.1037/h0087436. [DOI] [PubMed] [Google Scholar]
- Harmer CJ, McTavish SF, Clark L, Goodwin GM, Cowen PJ. Tyrosine depletion attenuates dopamine function in healthy volunteers. Psychopharmacology. 2001;154:105–111. doi: 10.1007/s002130000613. [DOI] [PubMed] [Google Scholar]
- Harrington DL, Haaland KY, Hermanowicz N. Temporal processing in the basal ganglia. Neuropsychology. 1998;12:3–12. doi: 10.1037//0894-4105.12.1.3. [DOI] [PubMed] [Google Scholar]
- Harrington DL, Zimbelman JL, Hinton SC, Rao SM. Neural modulation of temporal encoding, maintenance, and decision processes. Cereb Cortex. 2010;20:1274–1285. doi: 10.1093/cercor/bhp194. [DOI] [PMC free article] [PubMed] [Google Scholar]
- Harrington DL, Castillo GN, Greenberg PA, Song DD, Lessig S, Lee RR, Rao SM. Neurobehavioral mechanisms of temporal processing deficits in Parkinson's disease. PLoS One. 2011;6:e17461. doi: 10.1371/journal.pone.0017461. [DOI] [PMC free article] [PubMed] [Google Scholar]
- Hasselmo ME. The role of acetylcholine in learning and memory. Curr Opin Neurobiol. 2006;16:710–715. doi: 10.1016/j.conb.2006.09.002. [DOI] [PMC free article] [PubMed] [Google Scholar]
- Ivry RB, Spencer RM. The neural representation of time. Curr Opin Neurobiol. 2004;14:225–232. doi: 10.1016/j.conb.2004.03.013. [DOI] [PubMed] [Google Scholar]
- Jahanshahi M, Jones CR, Zijlmans J, Katzenschlager R, Lee L, Quinn N, Frith CD, Lees AJ. Dopaminergic modulation of striato-frontal connectivity during motor timing in Parkinson's disease. Brain. 2010;133:727–745. doi: 10.1093/brain/awq012. [DOI] [PubMed] [Google Scholar]
- Jin DZ, Fujii N, Graybiel AM. Neural representation of time in cortico-basal ganglia circuits. Proc Natl Acad Sci U S A. 2009;106:19156–19161. doi: 10.1073/pnas.0909881106. [DOI] [PMC free article] [PubMed] [Google Scholar]
- Joel D, Weiner I. The connections of the dopaminergic system with the striatum in rats and primates: an analysis with respect to the functional and compartmental organization of the striatum. Neuroscience. 2000;96:451–474. doi: 10.1016/s0306-4522(99)00575-8. [DOI] [PubMed] [Google Scholar]
- Jones CR, Jahanshahi M. Dopamine modulates striato-frontal functioning during temporal processing. Front Integr Neurosci. 2011;5:70. doi: 10.3389/fnint.2011.00070. [DOI] [PMC free article] [PubMed] [Google Scholar]
- Josephs O, Henson RN. Event-related functional magnetic resonance imaging: modelling, inference and optimization. Philos Trans R Soc Lond B Biol Sci. 1999;354:1215–1228. doi: 10.1098/rstb.1999.0475. [DOI] [PMC free article] [PubMed] [Google Scholar]
- Koch G, Brusa L, Oliveri M, Stanzione P, Caltagirone C. Memory for time intervals is impaired in left hemi-Parkinson patients. Neuropsychologia. 2005;43:1163–1167. doi: 10.1016/j.neuropsychologia.2004.11.017. [DOI] [PubMed] [Google Scholar]
- Landau SM, Lal R, O'Neil JP, Baker S, Jagust WJ. Striatal dopamine and working memory. Cereb Cortex. 2009;19:445–454. doi: 10.1093/cercor/bhn095. [DOI] [PMC free article] [PubMed] [Google Scholar]
- Lehéricy S, Ducros M, Krainik A, Francois C, Van de Moortele PF, Ugurbil K, Kim DS. 3-D diffusion tensor axonal tracking shows distinct SMA and pre-SMA projections to the human striatum. Cereb Cortex. 2004;14:1302–1309. doi: 10.1093/cercor/bhh091. [DOI] [PubMed] [Google Scholar]
- Le Masurier M, Cowen PJ, Sharp T. Fos immunocytochemical studies on the neuroanatomical sites of action of acute tyrosine depletion in the rat brain. Psychopharmacology. 2004;171:435–440. doi: 10.1007/s00213-003-1607-7. [DOI] [PubMed] [Google Scholar]
- Leyton M, Young SN, Pihl RO, Etezadi S, Lauze C, Blier P, Baker GB, Benkelfat C. Effects on mood of acute phenylalanine/tyrosine depletion in healthy women. Neuropsychopharmacology. 2000;22:52–63. doi: 10.1016/S0893-133X(99)00086-X. [DOI] [PubMed] [Google Scholar]
- Leyton M, Dagher A, Boileau I, Casey K, Baker GB, Diksic M, Gunn R, Young SN, Benkelfat C. Decreasing amphetamine-induced dopamine release by acute phenylalanine/tyrosine depletion: a PET/[11C]raclopride study in healthy men. Neuropsychopharmacology. 2004;29:427–432. doi: 10.1038/sj.npp.1300328. [DOI] [PubMed] [Google Scholar]
- Livesey AC, Wall MB, Smith AT. Time perception: manipulation of task difficulty dissociates clock functions from other cognitive demands. Neuropsychologia. 2007;45:321–331. doi: 10.1016/j.neuropsychologia.2006.06.033. [DOI] [PubMed] [Google Scholar]
- Lustig C, Matell MS, Meck WH. Not “just” a coincidence: frontal-striatal synchronization in working memory and interval timing. Memory. 2005;13:441–448. doi: 10.1080/09658210344000404. [DOI] [PubMed] [Google Scholar]
- Lythe KE, Anderson IM, Deakin JF, Elliott R, Strickland PL. Lack of behavioural effects after acute tyrosine depletion in healthy volunteers. J Psychopharmacol. 2005;19:5–11. doi: 10.1177/0269881105048886. [DOI] [PubMed] [Google Scholar]
- Macar F, Lejeune H, Bonnet M, Ferrara A, Pouthas V, Vidal F, Maquet P. Activation of the supplementary motor area and of attentional networks during temporal processing. Exp Brain Res. 2002;142:475–485. doi: 10.1007/s00221-001-0953-0. [DOI] [PubMed] [Google Scholar]
- Malapani C, Rakitin B, Levy R, Meck WH, Deweer B, Dubois B, Gibbon J. Coupled temporal memories in Parkinson's disease: a dopamine-related dysfunction. J Cogn Neurosci. 1998;10:316–331. doi: 10.1162/089892998562762. [DOI] [PubMed] [Google Scholar]
- Malapani C, Deweer B, Gibbon J. Separating storage from retrieval dysfunction of temporal memory in Parkinson's disease. J Cogn Neurosci. 2002;14:311–322. doi: 10.1162/089892902317236920. [DOI] [PubMed] [Google Scholar]
- Maricq AV, Church RM. The differential effects of haloperidol and methamphetamine on time estimation in the rat. Psychopharmacology. 1983;79:10–15. doi: 10.1007/BF00433008. [DOI] [PubMed] [Google Scholar]
- Matell MS, Meck WH. Neuropsychological mechanisms of interval timing behavior. Bioessays. 2000;22:94–103. doi: 10.1002/(SICI)1521-1878(200001)22:1<94::AID-BIES14>3.0.CO;2-E. [DOI] [PubMed] [Google Scholar]
- Matell MS, Meck WH. Cortico-striatal circuits and interval timing: coincidence detection of oscillatory processes. Brain Res Cogn Brain Res. 2004;21:139–170. doi: 10.1016/j.cogbrainres.2004.06.012. [DOI] [PubMed] [Google Scholar]
- Matell MS, Meck WH, Nicolelis MA. Interval timing and the encoding of stimulus duration by striatal and cortical neurons. Behav Neurosci. 2003;117:760–773. doi: 10.1037/0735-7044.117.4.760. [DOI] [PubMed] [Google Scholar]
- McTavish SF, McPherson MH, Sharp T, Cowen PJ. Attenuation of some subjective effects of amphetamine following tyrosine depletion. J Psychopharmacol. 1999;13:144–147. doi: 10.1177/026988119901300205. [DOI] [PubMed] [Google Scholar]
- Meck WH. Affinity for the dopamine D2 receptor predicts neuroleptic potency in decreasing the speed of an internal clock. Pharmacol Biochem Behav. 1986;25:1185–1189. doi: 10.1016/0091-3057(86)90109-7. [DOI] [PubMed] [Google Scholar]
- Meck WH. Neuropharmacology of timing and time perception. Brain Res Cogn Brain Res. 1996;3:227–242. doi: 10.1016/0926-6410(96)00009-2. [DOI] [PubMed] [Google Scholar]
- Meck WH. Neuroanatomical localization of an internal clock: a functional link between mesolimbic, nigrostriatal, and mesocortical dopaminergic systems. Brain Res. 2006;1109:93–107. doi: 10.1016/j.brainres.2006.06.031. [DOI] [PubMed] [Google Scholar]
- Mehta MA, Owen AM, Sahakian BJ, Mavaddat N, Pickard JD, Robbins TW. Methylphenidate enhances working memory by modulating discrete frontal and parietal lobe regions in the human brain. J Neurosci. 2000;20:RC65. doi: 10.1523/JNEUROSCI.20-06-j0004.2000. [DOI] [PMC free article] [PubMed] [Google Scholar]
- Mehta MA, Gumaste D, Montgomery AJ, McTavish SF, Grasby PM. The effects of acute tyrosine and phenylalanine depletion on spatial working memory and planning in healthy volunteers are predicted by changes in striatal dopamine levels. Psychopharmacology. 2005;180:654–663. doi: 10.1007/s00213-004-2128-8. [DOI] [PubMed] [Google Scholar]
- Michon JA. The compleat time experiencer. In: Michon JA, Jackson JL, editors. Time, mind, and behavior. Berlin: Springer; 1985. pp. 20–54. [Google Scholar]
- Mita A, Mushiake H, Shima K, Matsuzaka Y, Tanji J. Interval time coding by neurons in the presupplementary and supplementary motor areas. Nat Neurosci. 2009;12:502–507. doi: 10.1038/nn.2272. [DOI] [PubMed] [Google Scholar]
- Montgomery AJ, McTavish SF, Cowen PJ, Grasby PM. Reduction of brain dopamine concentration with dietary tyrosine plus phenylalanine depletion: an [11C] raclopride PET study. Am J Psychiatry. 2003;160:1887–1889. doi: 10.1176/appi.ajp.160.10.1887. [DOI] [PubMed] [Google Scholar]
- Morillon B, Kell CA, Giraud AL. Three stages and four neural systems in time estimation. J Neurosci. 2009;29:14803–14811. doi: 10.1523/JNEUROSCI.3222-09.2009. [DOI] [PMC free article] [PubMed] [Google Scholar]
- Nagano-Saito A, Leyton M, Monchi O, Goldberg YK, He Y, Dagher A. Dopamine depletion impairs frontostriatal functional connectivity during a set-shifting task. J Neurosci. 2008;28:3697–3706. doi: 10.1523/JNEUROSCI.3921-07.2008. [DOI] [PMC free article] [PubMed] [Google Scholar]
- O'Boyle DJ, Freeman JS, Cody FW. The accuracy and precision of timing of self-paced, repetitive movements in subjects with Parkinson's disease. Brain. 1996;119:51–70. doi: 10.1093/brain/119.1.51. [DOI] [PubMed] [Google Scholar]
- Oldendorf WH, Szabo J. Amino acid assignment to one of three blood-brain barrier amino acid carriers. Am J Physiol. 1976;230:94–98. doi: 10.1152/ajplegacy.1976.230.1.94. [DOI] [PubMed] [Google Scholar]
- O'Reilly JX, Mesulam MM, Nobre AC. The cerebellum predicts the timing of perceptual events. J Neurosci. 2008;28:2252–2260. doi: 10.1523/JNEUROSCI.2742-07.2008. [DOI] [PMC free article] [PubMed] [Google Scholar]
- O'Reilly JX, Beckmann CF, Tomassini V, Ramnani N, Johansen-Berg H. Distinct and overlapping functional zones in the cerebellum defined by resting state functional connectivity. Cereb Cortex. 2010;20:953–965. doi: 10.1093/cercor/bhp157. [DOI] [PMC free article] [PubMed] [Google Scholar]
- Pastor MA, Artieda J, Jahanshahi M, Obeso JA. Time estimation and reproduction is abnormal in Parkinson's disease. Brain. 1992;115:211–225. doi: 10.1093/brain/115.1.211. [DOI] [PubMed] [Google Scholar]
- Postuma RB, Dagher A. Basal ganglia functional connectivity based on a meta-analysis of 126 positron emission tomography and functional magnetic resonance imaging publications. Cereb Cortex. 2006;16:1508–1521. doi: 10.1093/cercor/bhj088. [DOI] [PubMed] [Google Scholar]
- Rammsayer TH. On dopaminergic modulation of temporal information processing. Biol Psychol. 1993;36:209–222. doi: 10.1016/0301-0511(93)90018-4. [DOI] [PubMed] [Google Scholar]
- Rammsayer TH. Are there dissociable roles of the mesostriatal and mesolimbocortical dopamine systems on temporal information processing in humans? Neuropsychobiology. 1997;35:36–45. doi: 10.1159/000119328. [DOI] [PubMed] [Google Scholar]
- Rammsayer TH. Neuropharmacological evidence for different timing mechanisms in humans. Q J Exp Psychol B. 1999;52:273–286. doi: 10.1080/713932708. [DOI] [PubMed] [Google Scholar]
- Rammsayer TH, Hennig J, Haag A, Lange N. Effects of noradrenergic activity on temporal information processing in humans. Q J Exp Psychol B. 2001;54:247–258. doi: 10.1080/02724990143000036. [DOI] [PubMed] [Google Scholar]
- Rao SM, Mayer AR, Harrington DL. The evolution of brain activation during temporal processing. Nat Neurosci. 2001;4:317–323. doi: 10.1038/85191. [DOI] [PubMed] [Google Scholar]
- Robbins TW, Arnsten AF. The neuropsychopharmacology of fronto-executive function: monoaminergic modulation. Annu Rev Neurosci. 2009;32:267–287. doi: 10.1146/annurev.neuro.051508.135535. [DOI] [PMC free article] [PubMed] [Google Scholar]
- Robinson L, Platt B, Riedel G. Involvement of the cholinergic system in conditioning and perceptual memory. Behav Brain Res. 2011;221:443–465. doi: 10.1016/j.bbr.2011.01.055. [DOI] [PubMed] [Google Scholar]
- Rubia K, Halari R, Christakou A, Taylor E. Impulsiveness as a timing disturbance: neurocognitive abnormalities in attention-deficit hyperactivity disorder during temporal processes and normalization with methylphenidate. Philos Trans R Soc Lond B Biol Sci. 2009;364:1919–1931. doi: 10.1098/rstb.2009.0014. [DOI] [PMC free article] [PubMed] [Google Scholar]
- Rypma B, D'Esposito M. Isolating the neural mechanisms of age-related changes in human working memory. Nat Neurosci. 2000;3:509–515. doi: 10.1038/74889. [DOI] [PubMed] [Google Scholar]
- Tysk L. Estimation of time and the subclassification of schizophrenic disorders. Percept Mot Skills. 1983;57:911–918. doi: 10.2466/pms.1983.57.3.911. [DOI] [PubMed] [Google Scholar]
- Tzourio-Mazoyer N, Landeau B, Papathanassiou D, Crivello F, Etard O, Delcroix N, Mazoyer B, Joliot M. Automated anatomical labelling of activations in spm using a macroscopic anatomical parcellation of the MNI MRI single subject brain. Neuroimage. 2002;15:273–289. doi: 10.1006/nimg.2001.0978. [DOI] [PubMed] [Google Scholar]
- van Rijn H, Kononowicz TW, Meck WH, Ng KK, Penney TB. Contingent negative variation and its relation to time estimation: a theoretical evaluation. Front Integr Neurosci. 2011;5:91. doi: 10.3389/fnint.2011.00091. [DOI] [PMC free article] [PubMed] [Google Scholar]
- Vrshek-Schallhorn S, Wahlstrom D, Benolkin K, White T, Luciana M. Affective bias and response modulation following tyrosine depletion in healthy adults. Neuropsychopharmacology. 2006;31:2523–2536. doi: 10.1038/sj.npp.1301172. [DOI] [PubMed] [Google Scholar]
- Wencil EB, Coslett HB, Aguirre GK, Chatterjee A. Carving the clock at its component joints: neural bases for interval timing. J Neurophysiol. 2010;104:160–168. doi: 10.1152/jn.00029.2009. [DOI] [PMC free article] [PubMed] [Google Scholar]
- Wiener M, Turkeltaub P, Coslett HB. The image of time: a voxel-wise meta-analysis. Neuroimage. 2010;49:1728–1740. doi: 10.1016/j.neuroimage.2009.09.064. [DOI] [PubMed] [Google Scholar]
- Wiener M, Lohoff FW, Coslett HB. Double dissociation of dopamine genes and timing in humans. J Cogn Neurosci. 2011;23:2811–2821. doi: 10.1162/jocn.2011.21626. [DOI] [PubMed] [Google Scholar]