

Abstract
The basal ganglia (BG) have been hypothesized to implement a reinforcement learning algorithm. However, it is not clear how information is processed along this network, thus enabling it to perform its functional role. Here we present three different encoding schemes of visual cues associated with rewarding, neutral, and aversive outcomes by BG neuronal populations.
We studied the response profile and dynamical behavior of two populations of projection neurons [striatal medium spiny neurons (MSNs), and neurons in the external segment of the globus pallidus (GPe)], and one neuromodulator group [striatal tonically active neurons (TANs)] from behaving monkeys. MSNs and GPe neurons displayed sustained average activity to cue presentation. The population average response of MSNs was composed of three distinct response groups that were temporally differentiated and fired in serial episodes along the trial. In the GPe, the average sustained response was composed of two response groups that were primarily differentiated by their immediate change in firing rate direction. However, unlike MSNs, neurons in both GPe response groups displayed prolonged and temporally overlapping persistent activity. The putamen TANs stereotyped response was characterized by a single transient response group. Finally, the MSN and GPe response groups reorganized at the outcome epoch, as different task events were reflected in different response groups.
Our results strengthen the functional separation between BG neuromodulators and main axis neurons. Furthermore, they reveal dynamically changing cell assemblies in the striatal network of behaving primates. Finally, they support the functional convergence of the MSN response groups onto GPe cells.
Introduction
Most models of the basal ganglia (BG) nuclei suggest they implement a reinforcement learning (RL) algorithm (Houk et al., 1995; Sutton and Barto, 1998). One of the most compelling RL models is the actor-critic architecture because it bears similarities to the structure of the BG network. The actor component stores and updates stimulus–response associations, such that actions associated with greater cumulative reward are more frequently chosen. The critic component generates a temporal difference prediction error signal when there is a discrepancy between predictions and actual reinforcements. This is used as a teaching message by the actor to adjust behavior. Hence, the analogy with the BG, where the neuromodulators correspond to the critic, and the actor corresponds to the BG main axis; i.e., the cortex-striatum-pallidum-frontal cortex axis (Houk et al., 1995; Suri and Schultz, 1998).
It has been demonstrated that the BG neuromodulators and main axis neurons respond diversely to behavioral events in line with their different functional roles. The neuromodulators, specifically midbrain dopaminergic neurons and striatal cholinergic interneurons, display a homogeneous transient response, thus providing the main axis with a single-dimensional teaching message (Schultz, 1998; Bar-Gad et al., 2003; Joshua et al., 2008). Neurons in the main axis, however, specifically in the globus pallidus external segment (GPe) and the BG output structures, exhibit diverse activity with an average sustained response that enables a large information capacity (Mink, 1996; Bar-Gad et al., 2003; Joshua et al., 2009b). Possibly these long duration responses are similar to the set-related activity described in the cortex (Kojima and Goldman Rakic, 1982; Miyashita, 1988; Wise and Kurata, 1989; Funahashi et al., 1993; Fuster, 1999; Romo et al., 1999), which has been attributed to action preparation processes.
The striatum is the primary input stage of the BG main axis and the principal source of innervation to BG downstream structures (Haber et al., 2011). The main projection neurons of the striatum are the medium spiny neurons (MSNs), which make up the vast majority of the striatal cells (Tepper et al., 2007). Studies that examined the role of primate MSNs in both movement initiation and decision making have found mostly sharp transient activations to movement onset (Crutcher and DeLong, 1984a, 1984b; Hikosaka et al., 1989; Watanabe et al., 2003), cue presentation (Kawagoe et al., 1998; Cromwell and Schultz, 2003; Samejima et al., 2005) and reward delivery (Apicella et al., 1991). Nevertheless, striatal MSNs are predicted to display sustained activity. This would correspond to their functional role in the BG network and previous observations of the GPe and BG output nuclei (Arkadir et al., 2004; Wichmann and Kliem, 2004; Joshua et al., 2009b).
To deepen our understanding of information processing along the BG main axis, we need to characterize the response profile and dynamic behavior of the MSNs, and specifically the ways in which MSNs contribute to the sustained activity generated in the pallidum. We thus recorded and compared the activity of several BG neural populations (MSNs, striatal cholinergic interneurons, and GPe neurons) from monkeys while they were engaged in a classical conditioning paradigm with long cues that predicted the trial outcome.
Materials and Methods
Two monkeys (Macaque fascicularis, G, male, 4.5 kg; and L, female, 3 kg) were used in this study. All experimental protocols were conducted in accordance with the National Research Council Guide for the Care and Use of Laboratory Animals and the Hebrew University guidelines for the use and care of laboratory animals in research. The experimental protocols were approved and supervised by the Institutional Animal Care and Use Committee of the Hebrew University and Hadassah Medical Center. The Hebrew University is an accredited institute of the Association for Assessment and Accreditation of Laboratory Animal Care International.
Behavioral task.
The monkeys were trained (G for 4 months; L for 3 months) on a classical conditioning task (Fig. 1a). Each trial began with the presentation of a visual cue (full-screen fractal images generated using Chaos Pro 3.2 program (www.chaospro.de) and displayed on a 17 inch LCD monitor, 50 cm in front of the monkeys' faces) for a period of 2 s. The cues were immediately followed by an outcome which could be one of three categories: liquid food in the reward trials, air puff (directed at both eyes) in the aversive trials, or neither in the neutral trials. The beginning of the outcome state was signaled by one of three sounds (duration, 80 ms) that discriminated the three outcome categories. Trials were followed by a variable intertrial interval (ITI) of 5–6 s. In each category there were three and two (G and L, respectively) different visual cues. In the rewarding and aversive trials, the cues were differentiated by the magnitude or intensity of the liquid food or air puff, respectively. In the neutral trials, the cues were differentiated by a change in the duration of the ITI (−2/0/+2 s to ITI duration). In total there were nine and six (G and L, respectively) different visual cues; three and two (G and L, respectively) for each outcome category. In this study we combined the trials within each outcome category and present the results for the rewarding trials (which include all amounts of liquid food), the aversive trials (which include all air-puff intensities), and the neutral trials. Visual fractal cues and auditory sounds were randomized between monkeys.
Figure 1.
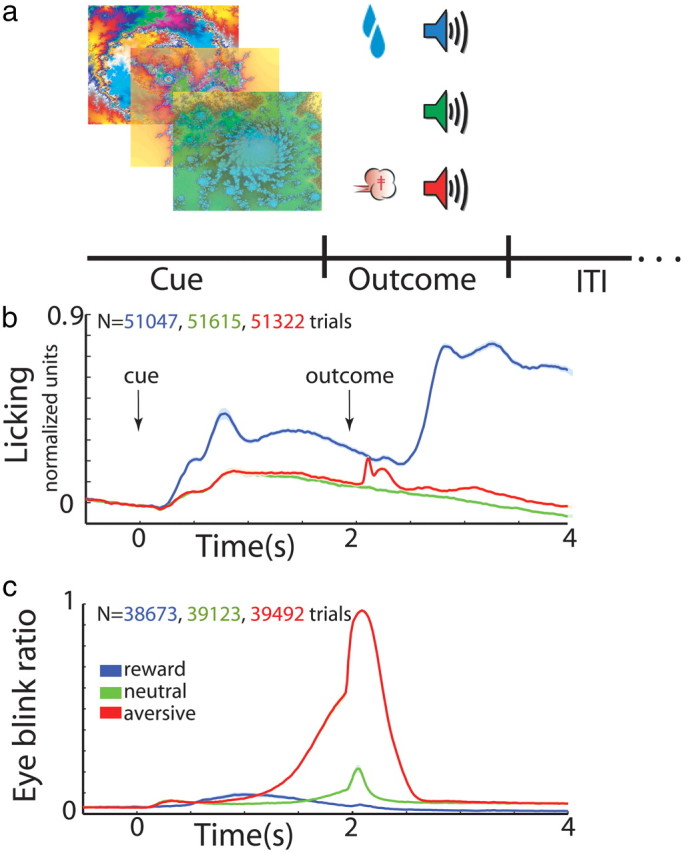
Behavioral task. a, Classical conditioning paradigm. Visual cues were presented for 2 s and predicted the delivery of food (reward trials, upper row), air puff (aversive trials, third row), or only sound (neutral trials, second row). The trial outcome epoch was followed by a variable ITI of 5–6 s. b, Normalized licking behavior (average ± SEM, solid line and shaded envelope, respectively) as recorded by an infrared reflection detector directed at the monkeys' mouths. Time 0, cue presentation followed by outcome delivery at time 2 s; blue, reward trials; green, neutral; red, aversive trials; N, number of trials. c, Blinking behavior (average ± SEM) as processed by the video signal, detecting within each recording frame the state of the monkeys' eyes (open, 0; closed, 1). In each time bin (20 ms) we calculated the fraction of trials with eyes closed. Same conventions as in b.
Surgery and magnetic resonance imaging.
After the training period, the monkeys were operated on under full anesthesia and in sterile conditions. In the surgery, an MRI-compatible Cilux head holder (Crist Instrument) and a square Cilux recording chamber (AlphaOmega) with a 27 mm (inner) side, located above a burr-hole in the skull, were attached to the monkeys' heads. The recording chamber was attached to the skull tilted 45° laterally in the coronal plane with its center targeted at the stereotaxic coordinates of the left anterior putamen (G: A16, L5, H1; L: A17, L6, H1; Martin and Bowden, 2000). Analgesia and antibiotics were administered during surgery and continued for 2 d postoperatively. Recording began after a postoperative recovery period of 5 d. We estimated the stereotaxic coordinates of the physiological recordings using MRI scans. The MRI scan (General Electric 3 tesla system, T2 sequence) was performed with five tungsten electrodes at accurate coordinates of the recording chamber [Y,X = (6,0), (0,−6), (0,0), (0,6), and (−6,0) in mm from the chamber center]. We then aligned the two-dimensional MRI coronal scans with the sections of the atlas of Macaca fascicularis (Martin and Bowden, 2000). We performed an additional MRI scan at the final stage of the recording period to verify our coordinate system. At the end of the experiment, the chamber and head holder of monkey G were removed, the skin was sutured, and after a recovery period the monkey was sent to a primate sanctuary (http://monkeypark.co.il). Experiments on monkey L are still in progress.
All surgical procedures were performed under aseptic conditions and general isoflurane and N2O deep anesthesia. The MRI procedure was performed under Dormitor and Ketamine light anesthesia.
Recording and data acquisition.
During recording sessions, the monkeys' heads were immobilized and eight glass-coated tungsten microelectrodes (0.3–0.7 MΩ impedance at 1000 Hz) were advanced separately (EPS, Alpha Omega Engineering) into the striatum and the GPe. In the striatum we targeted the putamen (AC −1 to AC +4) which has been shown to be involved in active movements or responses to sensory stimulation in the arm, leg, and face areas (Crutcher and DeLong, 1984a; Alexander and DeLong, 1985; Kandel et al., 2000). In the GPe, we recorded from the entire spatial nucleus span. The electrical activity was amplified with a gain of 5 K and bandpass filtered with a 1–6000 Hz four-pole Butterworth filter and continuously sampled at 25 kHz by 12 bits, ±5 V range, analog-to-digital converter (AlphaMap, Alpha Omega Engineering). Spike activity was sorted online using a template matching algorithm (ASD; Alpha Omega Engineering) by two experimentalists. Classification of putamen cells into MSNs, tonically active neurons (TANs, presumably cholinergic interneurons), fast spiking interneurons (FSIs), and other unidentified types of striatal neurons was done online based on the spike waveforms, firing rate, and pattern (Berke et al., 2004; Sharott et al., 2009) and was validated offline. GPe cells can be categorized into two subgroups (DeLong, 1971), one of which has a high-frequency discharge rate (in this study >20 Hz, HFD) typically interrupted by long pauses (Elias et al., 2007). The other is characterized by a low-frequency discharge rate which usually includes short bursts. Here, we targeted the HFD population of GPe cells.
Recorded neurons were subjected to offline quality analysis which included tests for rate stability, refractory period, waveform isolation, and recording time (Hill et al., 2011). First, the firing rate was graphically displayed as a function of time and the largest continuous segment of stable data was selected for further analysis. Second, cells in which >0.02 of the total ISIs were shorter than 2 ms were excluded from the database. Third, only cells with an isolation score (Joshua et al., 2007) >0.7 were included in the database. We ran the analysis on a subset of the cells with an isolation score >0.85 (N = 213 MSNs, average ± SEM of isolation score: 0.92 ± 0.002, N = 162 GPe neurons, isolation score: 0.95 ± 0.002, N = 123 TANs, isolation score: 0.94 ± 0.003) and obtained similar results (data not shown). Finally, only cells that fulfilled the above criteria for >18 min of task performance were included in the database. Inclusion criteria did not include significant responses to task events. Average (±SEM) values of the quality parameters in the final database are given in Table 1.
Table 1.
The neuronal database
| N | Fraction of ISI <2 ms | Isolation score | Stable recording time (min) | |
|---|---|---|---|---|
| Inclusion criterion | <0.02 | >0.7 | >18 min | |
| MSNs | 344 | 0.0006 ± 0.0001 | 0.86 ± 0.004 | 49 ± 1.58 |
| TANs | 145 | 0.0001 ± 0.00002 | 0.92 ± 0.006 | 50 ± 2.36 |
| GPe | 179 | 0.003 ± 0.0003 | 0.94 ± 0.004 | 47 ± 2.33 |
Recording quality parameters (average ± SEM) of putamen and GPe neurons included in the study.
To assess the monkeys' behavior, we monitored their mouth and eye movements, licking and blinking, respectively. Licking movements were monitored using an infrared reflection detector (Dr. Bouis Devices). The infrared signal was filtered between 1 and 100 Hz by a bandpass four-pole Butterworth filter, and sampled at 1.56 kHz. This was then normalized by subtracting the average infrared signal in the last 0.5 s of the ITI and dividing by the maximum value of the infrared signal. Blinking movements were monitored using infrared digital video cameras (AVer-s 2.54, AVer Information) which recorded the monkeys' facial movements at 50 Hz. Video analysis was performed on custom software to identify periods when the monkeys' eyes were closed (Mitelman et al., 2009).
Clustering analysis.
For each cell, activity was calculated for two different epochs of the trial (cue presentation and outcome delivery) and for the three different task categories (reward, neutral, and aversive).
Neural responses to behavioral events were first characterized by their poststimulus time histogram (PSTH). The PSTHs were calculated in 1 ms bins and smoothed with a Gaussian window with a SD of 20 ms (we repeated the analysis by smoothing the PSTHs with a Gaussian window with a SD of 2 ms and received similar results). The baseline firing rate was calculated by averaging the firing rate in the last 0.5 s of the ITI and was subtracted from the smoothed PSTH. Next we Z-score transformed each PSTH (Z-PSTH) by subtracting the mean baseline corrected PSTH and dividing by the SD of the PSTH. Note that since the Z-PSTHs were computed by subtracting the mean discharge rate of the PSTH from the original PSTH and then dividing by the SD of the PSTH, a negative Z score did not necessarily imply that the discharge rate was below the baseline rate.
We performed principal component analysis separately for each task event [six in total: three categories (reward, neutral, and aversive), times two epochs (cue presentation and outcome delivery)]. The principal components (eigenvectors) of the covariance matrix were sorted according to their explained variance (eigenvalues). The first two principal components had the highest explanatory power, whereas the following components did not make a substantial contribution. We therefore used the projection of the data points on the first two principal components (times six task events) to represent each cell.
To cluster the cell responses we applied the K-means algorithm on the cells' principal components representation. The K-means algorithm uses an iterative refinement procedure to minimize the sum, over all clusters, of the within-cluster Euclidean distances from data point to cluster centroid. To determine the most reproducible set of clusters, the algorithm was run 50 times (each with different random initial centroids) and the run that yielded the smallest error was chosen. We tested the K-means++ algorithm on several sets of our data and found no significant differences between the clustering of the two algorithms.
We chose the number of clusters that best fit the data based on the following three parameters. First we looked at the error as function of K (number of clusters, Fig. 2b, we used the MSN population to illustrate the methods). The error was defined as the within-cluster sums of point to centroid distances summed over all Ks. By definition, the error decreases monotonically with K; therefore we searched for the K from which there was no substantial change in the rate of error decrease (slower change in the slope). Second, we performed silhouette analysis which measures the degree of similarity of each point to points in its own cluster compared with points in other clusters and averaged over all points. This measure is not monotonous in K. It ranges from +1 (data points that are appropriately clustered), through 0 (data points that are on the border of two natural clusters), to −1 (data points that would be more appropriately clustered in the neighboring cluster). We aimed for the K that had the highest (or nearest, which depended on our other measures to estimate K) silhouette score (Fig. 2c). Last, we visually inspected the Z-PSTHs grouped into K clusters (Fig. 2a), and confirmed our visual impression with the other two measures (error rate and Silhouette analysis).
Figure 2.
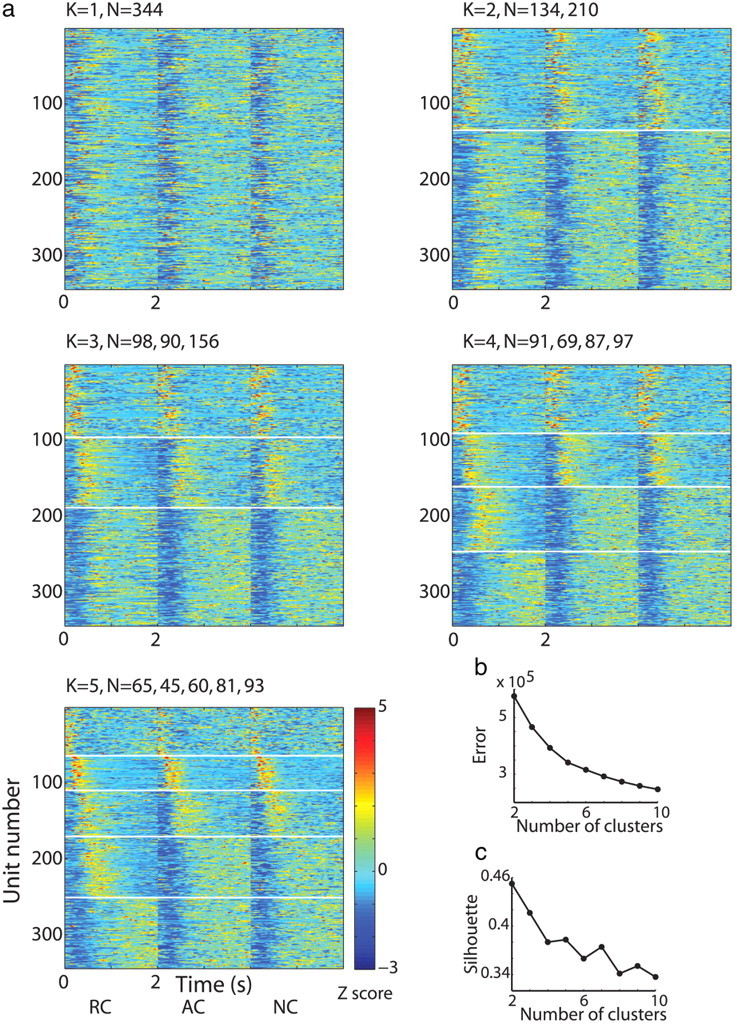
Methodology of clustering analysis: K means. a, MSN responses to task cue events. In each subplot, each row is the color coded Z-PSTH of a single MSN to the presentation of the rewarding cues (first column, time 0–2 s) followed by Z-PSTH to the presentation of the aversive cues (second column) and to the neutral cues (third column). N = 344 neurons. Each subplot presents grouping of the Z-PSTHs into different numbers of clusters (K = 1–5) delineated by a white horizontal line. Visual inspection of the cells' responses falling into different numbers of clusters served as one of our criteria for choosing K. b, Error as a function of K (number of clusters) when clustering was performed based on all cue events. Error was defined as the within-cluster sums of distances of data points to centroid summed over all Ks. c, Silhouette (degree of similarity of each point to points in its own cluster compared with points in other clusters) as a function of K (number of clusters).
We ran the K-means algorithm twice, once representing each cell with the principal components of the cue events and again with those of the outcome events.
For each cluster, we determined the fraction of cells that had a significant response. We calculated the mean (baseline) and SD of the PSTH of the last 3 s of the ITI (ITI-SD) using the same number of trials as in the studied PSTH and identified time segments in which there was a deviation of the PSTH from the baseline firing rate that exceeded three times the ITI-SD. A response was considered significant if the duration of the deviant segment was more than 60 ms (three times the SD of the smoothing filter). Finally, for each cell that had a significant response, we identified the delay in ms from presentation of the cue to the start of a significant increase/decrease in firing rate.
The data from the two monkeys were grouped since no significant difference was detected between the individual monkeys. Data analysis was performed on custom software using MATLAB V7.
Results
Behavioral task and neuronal database
Two monkeys were trained on a classical conditioning task (Fig. 1a) that involved three categories of visual cues predicting different outcomes: rewarding (food), aversive (air puff), and neutral (no outcome). The monkeys were trained on the behavioral task before recording and data acquisition. During recordings the monkeys, which were familiar with the different cues, displayed the appropriate anticipatory behavior (Fig. 1b,c). While the monkeys were engaged in the task we recorded the spiking activity of putamen phasically active neurons (presumably striatal projection neurons or MSNs), putamen TANs (presumably cholinergic interneurons), and GPe high-frequency discharge projection neurons. Recordings were made from up to eight electrodes simultaneously. Only neurons that passed the study inclusion criteria (see Materials and Methods, Recording and data acquisition and Table 1; N = 344 MSNs, 145 TANs, and 179 GPe neurons) were included in the analysis database.
Different populations in the BG display transient versus sustained average responses
We first examined the cells' responses to the cue events at the population level. Figure 3 displays the average response of all three populations to the presentation of the visual cues. GPe high-frequency discharge neurons increased and decreased their firing rates to cue presentation; we therefore averaged over the absolute response (Joshua et al., 2009b) and obtained an average sustained response that lasted throughout the entire 2 s of cue presentation (Fig. 3a). By contrast, TANs displayed a homogeneous bipolar transient response (Fig. 3b). This persistent GPe versus transient TANs response is expected from neurons along the BG main axis compared with neuromodulators and in line with previous observations (Joshua et al., 2008, 2009b). Next, we examined the average response of the low-frequency discharge MSNs and found it was also sustained (Fig. 3c). Thus, BG neural populations display transient (TAN) versus sustained (MSN and GPe) average responses. To understand the functional relationship between MSNs and GPe neuronal activity, we further investigated the response profile and dynamic behavior of the MSNs at the single cell level (see below).
Figure 3.
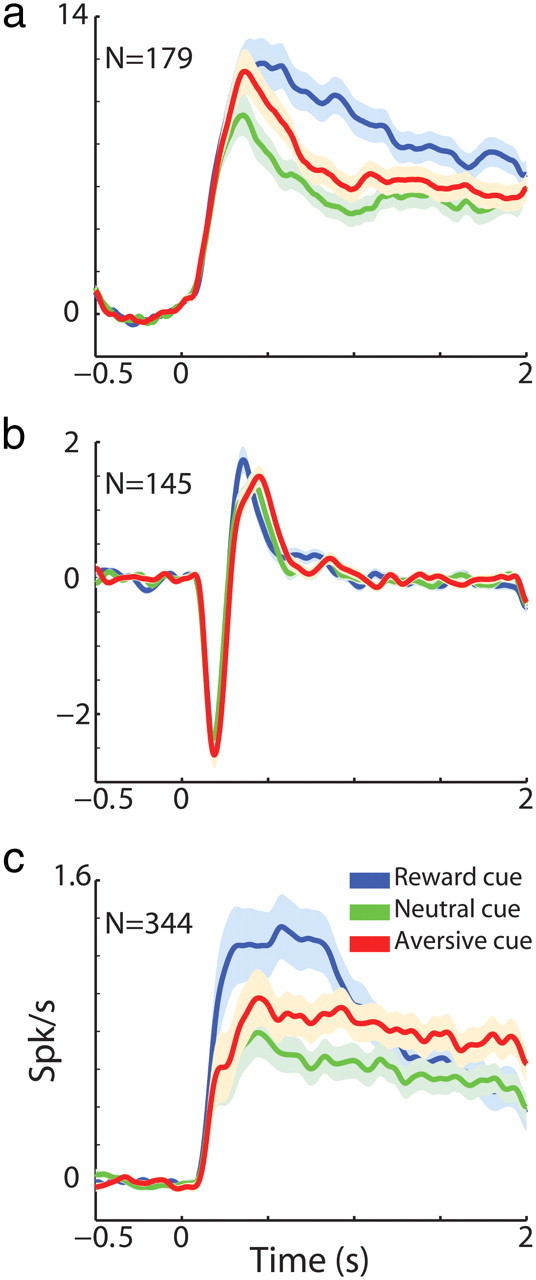
Putamen TANs average transient response versus putamen MSN and GPe average sustained response. a, GPe cell population average response (±SEM) to behavioral cues presented at time 0. The PSTHs were calculated in 1 ms bins and smoothed with a Gaussian window with SD of 20 ms. The baseline firing rate, calculated by averaging the firing rate in the last 0.5 s of the ITI, was subtracted from the smoothed PSTH. For the GPe population, we averaged over the absolute value of the PSTHs. Abscissa, time in seconds; ordinate, firing rate in Hz. Blue, responses to all reward cues; green, responses to all neutral cues; red, responses to all aversive cues. N = 179 neurons. b, TAN population average response (±SEM) to behavioral cues presented at time 0. Same conventions as in a. N = 145 neurons. c, MSN population average response (±SEM) to behavioral cues presented at time 0. Same conventions as in a. N = 344 neurons.
Average persistent response of MSNs consists of cell assemblies firing sequentially along the trial
Examining the responses of all putamen MSNs separately revealed a wide range of modulations in both the direction (increases vs decreases in firing rates) and temporal profile (Fig. 2a, upper left). We therefore used clustering to separate the activity of single MSNs into groups of cells with similar response patterns. We conducted a principal component analysis on the normalized PSTHs (Z-PSTHs) and used the K-means algorithm to classify the cells into different response groups (Fig. 2). The responses of the MSNs best fit three clusters. Figure 4a presents the color-coded Z-PSTHs (one row for each cell) ordered by the clustering analysis. The clusters were differentiated primarily by the neurons' temporal response profile. Neurons belonging to the first cluster displayed a sharp and immediate increase in firing rate in response to cue presentation (average ± SEM delay to significant increase in firing rate, 252.4 ± 34.95 ms). Neurons belonging to the third cluster displayed a more moderate increase in firing rate that was delayed after cue onset (average ± SEM delay to significant increase in firing rate 835.2 ± 25.01 ms) and lasted for the remainder of the cue presentation. For some cells, this elevation in rate was preceded by a decrease in firing rate (average ± SEM delay to significant decrease in firing rate, 223.55 ± 26.74 ms). Neurons belonging to the second cluster displayed an intermediate response to cue presentation both in the magnitude and in the timing of the response (average ± SEM delay to significant increase in firing rate, 403.14 ± 23.85 ms). Figure 4b depicts the average PSTHs separately for each MSN cluster. Finally, Figure 4c displays the fraction of cells which had a significant response (both increases and decreases in firing rate) for each cluster separately. This analysis confirms that MSNs in the different clusters responded at different times during cue presentation. Thus, the average persistent response of the MSNs to cue presentation was composed of three major cell assemblies that fired in sequential episodes along the trial.
Figure 4.
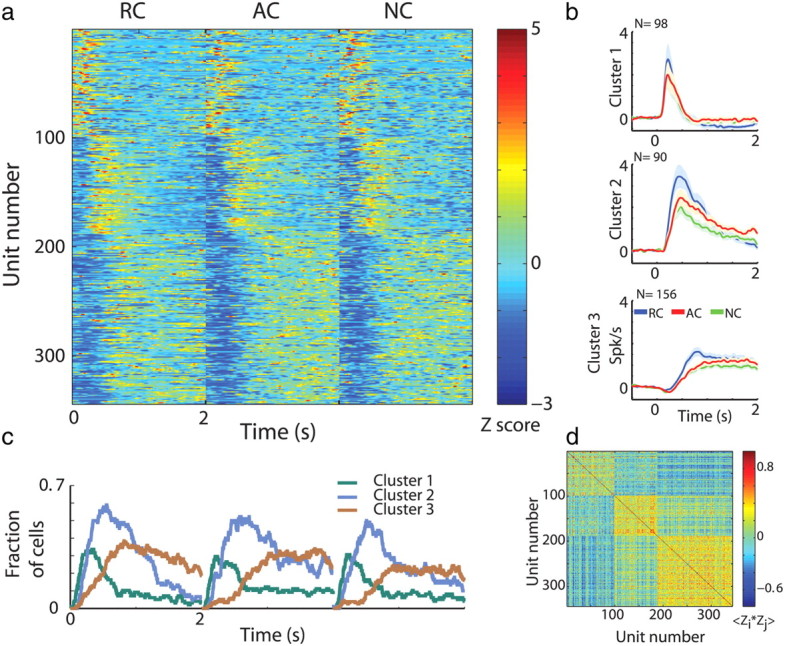
Average persistent response of putamen MSNs consists of three cell assemblies firing sequentially along the trial cue epoch. a, MSN responses to task cue events. Each row is the Z-PSTH of a single cell to the presentation of the rewarding cues (RC, time 0–2 s) followed by Z-PSTH to the presentation of the aversive cues (AC) and to the neutral cues (NC). Cells are ordered according to the clustering analysis. Within each cluster cells are randomly ordered. N = 344 neurons. Blue negative Z-scores do not always imply suppression of discharge rates below the baseline discharge. b, Population average responses (±SEM) to cue presentation (time 0) divided into clusters. Abscissa, time in seconds; ordinate, firing rate in Hz normalized by the ITI discharge rate. Blue RC, reward cues; red AC, aversive cues; green NC, neutral cues. c, Fraction of MSNs with a significant response (both increases and decreases in firing rate) to task cue events. Green, MSNs that were classified in the first cluster; cyan, MSNs that were classified in the second cluster; brown, MSNs that were classified in the third cluster. d, Correlation coefficient of the Z-PSTH matrix in a. Each dot is the correlation coefficient between a pair of cells. Hot colors, positive correlation; cold colors, negative correlation.
The results of the PSTH clustering were supported by a correlation analysis of cue related activity (Fig. 4d). Cells belonging to the same cluster tended to display a high positive correlation, whereas those in different clusters displayed a negative or no correlation.
We also clustered the MSN responses for each cue event (reward, aversive, and neutral) separately and compared the results with the original clustering, which was performed using all cues together (data not shown). Three similar sequentially switching response groups were found. Thus, MSNs displayed a general pattern of response to significant behavioral events (i.e., cluster 1, 2, or 3) regardless of which valence triggered the response. The difference between values was coded by the amplitude of change in firing rate (Figs. 3c, 4b). In this article we address the general result of three temporally distinct response groups and not the coding of valence by the MSNs.
TANs display a single homogeneous response pattern
We performed the same clustering analysis on the responses of the TANs to cue presentation. TANs displayed a homogeneous response, as previously described (Graybiel et al., 1994; Joshua et al., 2008, 2009a) and as expected from their functional role as neuromodulators. The clustering analysis suggests accordingly that their responses conformed to a single response pattern (Fig. 5). Clustering analysis of the baseline activity of the TANs (starting 1 s after cue presentation) also did not reveal robust clustering of the TAN activity (data not shown).
Figure 5.

TANs display homogeneous responses to cue presentation. a, TAN responses to task cue events. Same conventions as in Figure 4a. N = 145 neurons. Cells are randomly ordered. b, Population average responses (±SEM) to cue presentation (time 0). Same conventions as in Figure 4b. c, Fraction of TANs with a significant response (both increases and decreases in firing rate) to task cue events. Same conventions as in Figure 4c. d, Correlation coefficient of the Z-PSTH matrix in a. Same conventions as in Figure 4d.
Average persistent response of GPe cells is composed of persistent response at the single cell level
The responses of GPe cells, on the other hand, best fit two clusters (Fig. 6). The two GPe clusters primarily reflected the neurons' immediate change in firing rate. Neurons belonging to the first cluster displayed a sharp increase in firing rate to cue presentation (average ± SEM delay to significant increase in firing rate, 275.47 ± 21.5 ms). Neurons belonging to the second cluster displayed an immediate decrease (average ± SEM delay to significant decrease in firing rate, 276.82 ± 23.39 ms). However, most neurons, whether they belonged to the first or second cluster, had a prolonged component in their response after the sharp immediate increase/decrease in firing rate that lasted for the remainder of the cue presentation (Fig. 6b,c). This contrasted with the response groups found for putamen MSNs, where each response group dominated a different epoch in cue presentation time in a sequential manner (compare Fig. 4c with 6c). Thus, GPe neuronal activity was divided into two response groups that overlapped in time.
Figure 6.

Average persistent response of GPe cells is composed of persistent response at the single cell level. a, GPe cell responses to task cue events. Cells are ordered according to the clustering analysis. Within each cluster cells are randomly ordered. Same conventions as in Figure 4a. N = 179 neurons. b, Population average responses (±SEM) to cue presentation (time 0) divided into clusters. Same conventions as in Figure 4b. c, Fraction of GPe neurons with a significant response (both increases and decreases in firing rate) to task cue events. Same conventions as in Figure 4c. d, Correlation coefficient of the Z-PSTH matrix in a. Same conventions as in Figure 4d.
MSNs response profile does not reflect the neurons' intrinsic properties or spatial layout
There is heterogeneity in the intrinsic properties of the MSNs, the most prominent probably being D1 versus D2 dopamine receptor expression (Gerfen et al., 1990; Gradinaru et al., 2009; Bateup et al., 2010). The D1/D2 heterogeneity is coupled with the expression of substance P or enkephaline as a cotransmitter, intrinsic excitability and morphological properties (Day et al., 2008; Gertler et al., 2008) and with different targets in the BG network. It could have been that MSNs belonging to different response clusters represent different types of cells. In our study design, which involved extracellular recordings from behaving monkeys, we were not able to tag or characterize single cells (Belujon et al., 2010; Flores-Barrera et al., 2010). However, we could examine the spiking parameters of the cells, which are often used to classify cells recorded in the same location into different types (for example, in our study, MSNs vs TANs). There was no significant difference (one-way ANOVA) in the average firing rates or in the average length of the spikes' waveform between the MSN clusters (Fig. 7a,c). Although there was a difference (one-way ANOVA, p < 0.05) in the coefficient of variation of the interspike interval of cells belonging to the first cluster compared with the second and third cluster, it was very weak (Fig. 7b). As for the MSNs, cells in the two GPe clusters were not differentiated by their spiking parameters (Fig. 7d–f). The TANs unimodal distribution of spiking parameters is shown for comparison in Figure 7g–i.
Figure 7.

Clusters are not differentiated by the spiking parameters of the BG neurons. a, Distribution of MSN firing rates. Abscissa, firing rate in Hz; ordinate: fraction of cells. Green, MSNs classified in the first cluster; cyan, MSNs classified in the second cluster; brown, MSNs classified in the third cluster. b, Distribution of MSNs coefficient of variation of the ISIs. Abscissa, coefficient of variation (CV); ordinate, fraction of cells. Same color code as in a. c, Distribution of MSN waveform length. Abscissa, spike waveform length calculated as the duration from the first negative peak to the next positive peak; ordinate, fraction of cells. Same color code as in a. d–f, Same as a–c for GPe cells. g–i, Same as a–c for TANs.
In addition, we did not observe a spatial layout of the MSNs response clusters; i.e., there was a representation of all three clusters in all recording coordinates (Fig. 8a). We further examined whether the probability that a pair of MSNs will have the same response profile decreases with the spatial distance between the cells. We calculated the fraction of pairs of cells belonging to the same cluster when the cells were recorded simultaneously and from the same electrode, when they were recorded simultaneously but from different electrodes, and when they were recorded in different recording sessions. The estimated distance between the neurons was <100 μm for the pairs recorded from the same electrode, <2 mm for the pairs recorded in the same session, and >2 mm for the pairs recorded in different sessions. There was a small decrease in the fraction of pairs belonging to the same cluster when the estimated distance between neurons increased (Fig. 8b). Nevertheless, the fraction of pairs belonging to the same cluster did not change significantly when cells were recorded in the same or in different recording sessions (χ2 test). As for the MSNs, we did not observe a spatial layout of the GPe response clusters (Fig. 8c). The fraction of GPe neuron pairs belonging to the same cluster was not significantly different when cells were recorded in the same or in different sessions (χ2 test, Fig. 8d).
Figure 8.

Clusters are not differentiated by the spatial layout of MSNs and GPe neurons. a, Spatial layout of MSN clusters. Each point represents a MSN. Abscissa: coordinates in the horizontal plane (in mm); M, medial; L, lateral; zero in the center of the putamen in our recordings. Ordinate: coordinates in perisagital plane (in mm); A, anterior; P, posterior; zero is coronal section AC0 (AC, anterior commissure) according to the fusion of the MRI and the primate stereotaxic atlas. z-axis: depth from entry to the putamen (in mm). Cells are color coded according to their clusters. Green, MSNs classified in the first cluster; cyan, MSNs classified in the second cluster; brown, MSNs classified in the third cluster in the cue presentation epoch. b, Fraction of pairs of MSNs belonging to the same cluster. “Same elec',” cell pairs recorded simultaneously from the same electrode; “same session,” cell pairs recorded simultaneously from different electrodes; “different session,” cell pairs recorded in different sessions. c, Spatial layout of GPe clusters. Same as in a for the GPe neurons. d, Fraction of pairs of GPe cells belonging to the same cluster. Same as in b for the GPe neurons. In the pallidal recordings there were only two pairs recorded on the same electrode (left bar in b for MSN pairs), thus, data not shown.
Thus, the formation of the MSNs and GPe response clusters could not be accounted for by the cells' intrinsic firing properties or spatial layout within the nuclei.
The formation of clusters is dynamic
Up to now we have described modulations of MSN activity following cue presentation. Next, we studied whether the formation of MSNs assemblies remained constant throughout different parts of the trial (i.e., as expected from fixed anatomical clustering). Figure 9a displays the Z-PSTHs of the MSNs ordered by the clustering analysis as in Figure 4a, but this time including the responses at the outcome epoch. There was no apparent clustering in the MSNs' responses to outcome delivery. We therefore performed the same clustering analysis using the outcome events and found that cells were reorganized into different groups of clusters (Fig. 9b). For example, if a cell belonged to the first cluster (transient early response) in the cue epoch, its response to the outcome epoch could be associated with any of the three response groups found in the outcome epoch and vice versa (Fig. 9c,d). Hence, the formation of MSN assemblies in the putamen was dynamic and probably did not reflect the anatomical or the neurochemical properties of the MSNs. The GPe neurons were less responsive in the outcome epoch of the trial; however, similar dynamic clustering was also found (data not shown).
Figure 9.
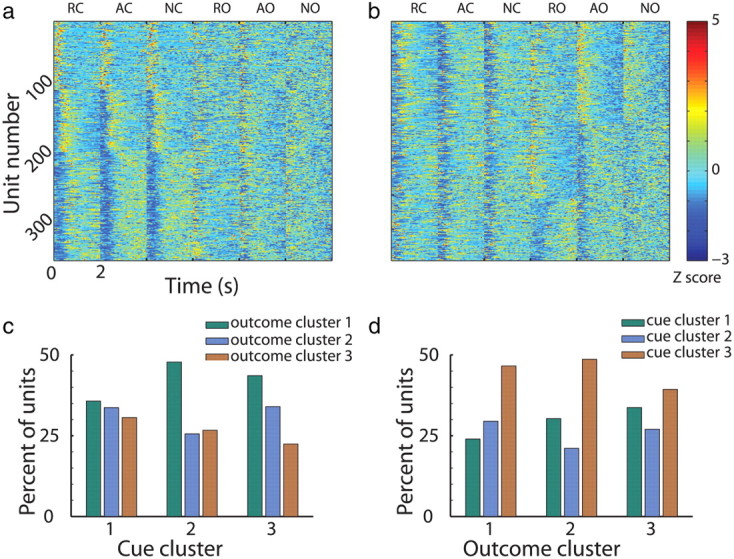
The formation of MSN clusters is dynamic. a, Single MSN responses to task events. Same as Figure 4a, however for each cell (row) all six task events are presented. RC, reward cue; AC, aversive cue; NC, neutral cue; RO, reward outcome; AO, aversive outcome; NO, neutral outcome. b, Same as in a, however clustering analysis was run on the outcome events. c, d, Cells are clustered differently in cue versus outcome events. Each group of three bars (green, cyan, and brown) represents the MSNs in every cluster in the outcome (c) or the cue (d) events. The separate bars represent distribution of the cells among the clusters in the cue (c) or the outcome (d) events. There is no pattern in the distribution within each cue or outcome cluster; i.e., the formation of clusters changes along the trial.
Discussion
In this study we presented three different encoding schemes of visual cues associated with rewarding, neutral, and aversive outcomes by three BG neuronal populations. TANs displayed an average transient sharp response, whereas GPe neuron and MSN responses were sustained. At the single cell level, TAN activity was stereotyped and associated with one cluster of response profiles. GPe neurons and MSNs, on the other hand, were classified into two and three response groups, respectively. The two GPe response groups reflected their bipolar change in firing rate. In both groups, however, there was sustained activity at the single cell level. The average persistent activity observed in the MSNs was composed of three cell assemblies that fired in serial episodes along the trial. Finally, the formation of MSN cell assemblies was dynamic, as the cells were reorganized into different response groups at different trial epochs.
Is the actual number of clusters arbitrary?
Here we used the K-means algorithm to cluster the cell responses. The number of clusters (K) is an input parameter to the algorithm, which thus raises the question: What is the appropriate choice of K? Our aim was to find the smallest number of clusters to represent the cell responses. We ran the analysis several times, each with different assignment for K, and used three parameters as the criteria for choosing the optimal K (for details see Materials and Methods, Clustering analysis). Finally, we chose K = 3 clusters as the best fit for the MSNs data and K = 2 clusters as the best fit for the GPe data. We believe the number of response clusters is not arbitrary but represents separate subpopulations of cells with clear distinctive functions. Nonetheless, the main result of this study—the MSN persistent population activity is composed of dynamically changing cell assemblies whereas the GPe persistent population response is composed of persistent single cell responses—is not affected by the exact number of clusters chosen.
Possible different sources of innervation of different MSN response groups
MSNs throughout the entire putamen are innervated by both the cortex and the CM-Pf complex of the thalamus (Smith et al., 2004; Haber et al., 2011). The thalamostriatal synapses have not been studied as extensively as the corticostriatal synapses although they constitute ∼40–50% of the glutamatergic synapses formed on MSN dendrites (Smith et al., 2004; Doig et al., 2010). Physiologically, these two pathways are presumed to have different functional roles. It is hypothesized that the corticostriatal projections are involved in cognitive and motivational properties of associative learning (Graybiel, 2000), whereas thalamostriatal projections supply information about behaviorally significant sensory events involved in arousal and attention (Matsumoto et al., 2001). Anatomically, these synapses have been shown to share similar morphology and to converge onto single MSNs (Raju et al., 2006). However, recently it was demonstrated that repetitive stimulation of the cortical or the thalamic pathways lead to distinct patterns of spiking activity in the MSNs. Cortical stimulation generated a postsynaptic depolarization that grew and then maintained with little subsequent decline. Thalamic stimulation, on the other hand, generated a postsynaptic depolarization that steadily declined in amplitude (Ding et al., 2008). In this study we showed that MSNs belonging to different response clusters were differentiated primarily by their temporal profile. Neurons belonging to the different response clusters were uniformly distributed within the putamen and were not characterized by different spiking parameters, suggesting they are not separated by their neurochemical properties. This is in line with recent results showing that D1 and D2 receptors expressing MSNs undergo the same form of dopamine-dependent synaptic plasticity (Bagetta et al., 2011) and cholinergic-dependent D2/A2A modulation (Tozzi et al., 2011). Thus, different pathways (cortical vs thalamic) may possibly drive the different MSN response groups and could convey distinct information and lead to different functions. We cannot, however, rule out other factors possibly differentiating the cells; this topic requires further inquiry.
Functional convergence of MSNs onto GPe
It has been suggested that the GPe acts as more than simply a relay nucleus but rather as an integration site for different behaviorally relevant neuronal circuits (Bolam et al., 2000; Kita, 2007). Anatomically, the large pallidal neurons are characterized by long and sparsely branched dendritic arborizations. The arborizations are discoidal in shape and are perpendicular to the main bundle of the afferents of striatal axons (Yelnik et al., 1984; Kita and Kitai, 1994). Thus, GPe cells receive input from wide regions of the striatum (Percheron et al., 1984). Furthermore, the massive reduction in the number of cells from the striatum to the GPe implies convergence of many MSNs onto single GPe neurons (Percheron and Filion, 1991; Oorschot, 1996). Physiological findings support information convergence at the GPe level and have shown coding of both movement direction and reward prediction by single pallidal neurons (Gdowski et al., 2001; Arkadir et al., 2004). At the striatal level, the findings are more contradictory with reports of convergent representation of limbic and motor information on the one hand (Parthasarathy et al., 1992; Levy et al., 1997; Kawagoe et al., 1998) and a lower degree of convergence up to separate representations on the other (Flaherty and Graybiel, 1991; Cromwell and Schultz, 2003; Schmitzer-Torbert and Redish, 2004). Together, these findings could imply a greater degree of convergence at the GPe compared with the striatal level. We found that the average persistent response of the MSNs was composed of three major cell assemblies whose response patterns were temporally differentiated and were sequentially active along the trial. The average persistent response observed in the GPe, however, was composed of sustained activity at the single cell level resulting in an overlap in the time of activation between the two response clusters. Our results thus support the funneling model with anatomical convergence of MSNs onto GPe and point to functional convergence as well. In addition, they are in line with stronger convergence at the GPe compared with the striatal level.
The GPe response clusters were differentiated primarily by the change in the cells' response direction, which exhibited both decreases and increases in firing rates. Firing rate decreases are expected by striatal convergent GABAergic innervations. The source of GPe increases in firing rates could be the excitatory convergent information received from the subthalamic nucleus (Hazrati and Parent, 1992; Shink and Smith, 1995; Hanson et al., 2004). However, other alternatives could explain the GPe response profiles, such as opposing effects of D1 versus D2 receptors expressing MSNs and/or striatal inhibitory connections along with disinhibition by axon collaterals within the GPe (Kita and Kitai, 1994; Parent et al., 2000; Sato et al., 2000).
Formation of dynamically changing functional correlations within the striatal MSNs network
The striatum plays a key role in reinforcement and associative learning; however, how information is processed within the striatal network is still open to debate. The dense local axon collateral system found between spiny cells led early studies to hypothesize a functional competition among the neurons which enabled a winner-take-all dynamics (e.g., one action is selected over all other alternatives; Wickens, 1993; Fukai and Tanaka, 1997). However, physiological studies have found these lateral connections to be sparse, weak, and asymmetrical (Jaeger et al., 1994; Tunstall et al., 2002; Koos et al., 2004; Tepper et al., 2004; Planert et al., 2010) thus casting doubt on competitive inhibition as a key computational process in the information processing of the striatum. Ponzi and Wickens (2010) recently showed that in a model based on a realistic striatal inhibitory network, cells form assemblies that fire in sequential coherent episodes. Cell members of the same assembly showed correlated firing rate fluctuations at behaviorally relevant timescales, whereas cell members in different assemblies were negatively correlated. This simulation was supported by an in vitro experimental study (Carrillo-Reid et al., 2008) showing that a set of neurons in a corticostriatal slice exhibit episodes of recurrent and synchronized bursting. They further demonstrated that blockage of glutamatergic transmission abolished the correlated activity, whereas blockage of GABAergic transmission locked the network into a single dominant state. Our results demonstrate the formation of dynamically changing functional correlations within the striatal MSN network and are thus the first representation of the above dynamics in a behaving primate. Based on previous results and our findings, we hypothesize that the cortical and/or thalamic excitatory input likely generates the coordinated MSN assemblies. Once formed during learning, these assemblies need only a trigger for activation thereafter. However, without lateral inhibitory connections, the network would constantly remain in a certain state. Thus, the response profile and network dynamics of MSNs, as revealed here in behaving primates, reflect the complex interplay between striatal excitatory input and lateral inhibitory connections.
In conclusion, we presented three different encoding schemes by MSNs, GPe neurons, and TANs. Our results strengthen the functional separation between BG neuromodulators and the main axis by showing that MSNs display an average sustained response as expected by their functional role in associative learning. Furthermore, these results point to the strong functional convergence of MSNs onto GPe cells, leading to the average sustained response of single GPe neurons. Finally, the MSNs display a response profile and dynamic behavior that incorporates the elements required for information processing in a dynamic network of cell assemblies.
Footnotes
This study was supported by the Select and Act FP7 grant. Avital Adler is supported by the Adams Fellowship Program of the Israel Academy of Sciences and Humanities. We thank Mati Joshua for critical reading of earlier versions of this manuscript.
References
- Alexander GE, DeLong MR. Microstimulation of the primate neostriatum. I. Physiological properties of striatal microexcitable zones. J Neurophysiol. 1985;53:1401–1416. doi: 10.1152/jn.1985.53.6.1401. [DOI] [PubMed] [Google Scholar]
- Apicella P, Ljungberg T, Scarnati E, Schultz W. Responses to reward in monkey dorsal and ventral striatum. Exp Brain Res. 1991;85:491–500. doi: 10.1007/BF00231732. [DOI] [PubMed] [Google Scholar]
- Arkadir D, Morris G, Vaadia E, Bergman H. Independent coding of movement direction and reward prediction by single pallidal neurons. J Neurosci. 2004;24:10047–10056. doi: 10.1523/JNEUROSCI.2583-04.2004. [DOI] [PMC free article] [PubMed] [Google Scholar]
- Bagetta V, Picconi B, Marinucci S, Sgobio C, Pendolino V, Ghiglieri V, Fusco FR, Giampà C, Calabresi P. Dopamine-dependent long-term depression is expressed in striatal spiny neurons of both direct and indirect pathways: implications for Parkinson's disease. J Neurosci. 2011;31:12513–12522. doi: 10.1523/JNEUROSCI.2236-11.2011. [DOI] [PMC free article] [PubMed] [Google Scholar]
- Bar-Gad I, Morris G, Bergman H. Information processing, dimensionality reduction and reinforcement learning in the basal ganglia. Prog Neurobiol. 2003;71:439–473. doi: 10.1016/j.pneurobio.2003.12.001. [DOI] [PubMed] [Google Scholar]
- Bateup HS, Santini E, Shen W, Birnbaum S, Valjent E, Surmeier DJ, Fisone G, Nestler EJ, Greengard P. Distinct subclasses of medium spiny neurons differentially regulate striatal motor behaviors. Proc Natl Acad Sci U S A. 2010;107:14845–14850. doi: 10.1073/pnas.1009874107. [DOI] [PMC free article] [PubMed] [Google Scholar]
- Belujon P, Lodge DJ, Grace AA. Aberrant striatal plasticity is specifically associated with dyskinesia following levodopa treatment. Mov Disord. 2010;25:1568–1576. doi: 10.1002/mds.23245. [DOI] [PMC free article] [PubMed] [Google Scholar]
- Berke JD, Okatan M, Skurski J, Eichenbaum HB. Oscillatory entrainment of striatal neurons in freely moving rats. Neuron. 2004;43:883–896. doi: 10.1016/j.neuron.2004.08.035. [DOI] [PubMed] [Google Scholar]
- Bolam JP, Hanley JJ, Booth PA, Bevan MD. Synaptic organization of the basal ganglia. J Anat. 2000;196:527–542. doi: 10.1046/j.1469-7580.2000.19640527.x. [DOI] [PMC free article] [PubMed] [Google Scholar]
- Carrillo-Reid L, Tecuapetla F, Tapia D, Hernández-Cruz A, Galarraga E, Drucker-Colin R, Bargas J. Encoding network states by striatal cell assemblies. J Neurophysiol. 2008;99:1435–1450. doi: 10.1152/jn.01131.2007. [DOI] [PubMed] [Google Scholar]
- Cromwell HC, Schultz W. Effects of expectations for different reward magnitudes on neuronal activity in primate striatum. J Neurophysiol. 2003;89:2823–2838. doi: 10.1152/jn.01014.2002. [DOI] [PubMed] [Google Scholar]
- Crutcher MD, DeLong MR. Single cell studies of the primate putamen. I. Functional organization. Exp Brain Res. 1984a;53:233–243. doi: 10.1007/BF00238153. [DOI] [PubMed] [Google Scholar]
- Crutcher MD, DeLong MR. Single cell studies of the primate putamen. II. Relations to direction of movement and pattern of muscular activity. Exp Brain Res. 1984b;53:244–258. doi: 10.1007/BF00238154. [DOI] [PubMed] [Google Scholar]
- Day M, Wokosin D, Plotkin JL, Tian X, Surmeier DJ. Differential excitability and modulation of striatal medium spiny neuron dendrites. J Neurosci. 2008;28:11603–11614. doi: 10.1523/JNEUROSCI.1840-08.2008. [DOI] [PMC free article] [PubMed] [Google Scholar]
- DeLong MR. Activity of pallidal neurons during movement. J Neurophysiol. 1971;34:414–427. doi: 10.1152/jn.1971.34.3.414. [DOI] [PubMed] [Google Scholar]
- Ding J, Peterson JD, Surmeier DJ. Corticostriatal and thalamostriatal synapses have distinctive properties. J Neurosci. 2008;28:6483–6492. doi: 10.1523/JNEUROSCI.0435-08.2008. [DOI] [PMC free article] [PubMed] [Google Scholar]
- Doig NM, Moss J, Bolam JP. Cortical and thalamic innervation of direct and indirect pathway medium-sized spiny neurons in mouse striatum. J Neurosci. 2010;30:14610–14618. doi: 10.1523/JNEUROSCI.1623-10.2010. [DOI] [PMC free article] [PubMed] [Google Scholar]
- Elias S, Joshua M, Goldberg JA, Heimer G, Arkadir D, Morris G, Bergman H. Statistical properties of pauses of the high-frequency discharge neurons in the external segment of the globus pallidus. J Neurosci. 2007;27:2525–2538. doi: 10.1523/JNEUROSCI.4156-06.2007. [DOI] [PMC free article] [PubMed] [Google Scholar]
- Flaherty AW, Graybiel AM. Corticostriatal transformations in the primate somatosensory system. Projections from physiologically mapped body-part representations. J Neurophysiol. 1991;66:1249–1263. doi: 10.1152/jn.1991.66.4.1249. [DOI] [PubMed] [Google Scholar]
- Flores-Barrera E, Vizcarra-Chacón BJ, Tapia D, Bargas J, Galarraga E. Different corticostriatal integration in spiny projection neurons from direct and indirect pathways. Front Syst Neurosci. 2010;4:15. doi: 10.3389/fnsys.2010.00015. [DOI] [PMC free article] [PubMed] [Google Scholar]
- Fukai T, Tanaka S. A simple neural network exhibiting selective activation of neuronal ensembles: from winner-take-all to winners-share-all. Neural Comput. 1997;9:77–97. doi: 10.1162/neco.1997.9.1.77. [DOI] [PubMed] [Google Scholar]
- Funahashi S, Chafee MV, Goldman-Rakic PS. Prefrontal neuronal activity in rhesus monkeys performing a delayed anti-saccade task. Nature. 1993;365:753–756. doi: 10.1038/365753a0. [DOI] [PubMed] [Google Scholar]
- Fuster JM. The prefrontal cortex anatomy, physiology, and neuropsychology of the frontal lobes. Philadelphia: Lippincott-Raven; 1999. [Google Scholar]
- Gdowski MJ, Miller LE, Parrish T, Nenonene EK, Houk JC. Context dependency in the globus pallidus internal segment during targeted arm movements. J Neurophysiol. 2001;85:998–1004. doi: 10.1152/jn.2001.85.2.998. [DOI] [PubMed] [Google Scholar]
- Gerfen CR, Engber TM, Mahan LC, Susel Z, Chase TN, Monsma FJ, Jr, Sibley DR. D1 and D2 dopamine receptor-regulated gene expression of striatonigral and striatopallidal neurons. Science. 1990;250:1429–1432. doi: 10.1126/science.2147780. [DOI] [PubMed] [Google Scholar]
- Gertler TS, Chan CS, Surmeier DJ. Dichotomous anatomical properties of adult striatal medium spiny neurons. J Neurosci. 2008;28:10814–10824. doi: 10.1523/JNEUROSCI.2660-08.2008. [DOI] [PMC free article] [PubMed] [Google Scholar]
- Gradinaru V, Mogri M, Thompson KR, Henderson JM, Deisseroth K. Optical deconstruction of parkinsonian neural circuitry. Science. 2009;324:354–359. doi: 10.1126/science.1167093. [DOI] [PMC free article] [PubMed] [Google Scholar]
- Graybiel AM. The basal ganglia. Curr Biol. 2000;10:R509–R511. doi: 10.1016/s0960-9822(00)00593-5. [DOI] [PubMed] [Google Scholar]
- Graybiel AM, Aosaki T, Flaherty AW, Kimura M. The basal ganglia and adaptive motor control. Science. 1994;265:1826–1831. doi: 10.1126/science.8091209. [DOI] [PubMed] [Google Scholar]
- Haber SN, Adler A, Bergman H. The basal ganglia. In: Paxinos G, Mai JK, editors. The human nervous system. London: Academic; 2011. [Google Scholar]
- Hanson JE, Smith Y, Jaeger D. Sodium channels and dendritic spike initiation at excitatory synapses in globus pallidus neurons. J Neurosci. 2004;24:329–340. doi: 10.1523/JNEUROSCI.3937-03.2004. [DOI] [PMC free article] [PubMed] [Google Scholar]
- Hazrati LN, Parent A. Differential patterns of arborization of striatal and subthalamic fibers in the two pallidal segments in primates. Brain Res. 1992;598:311–315. doi: 10.1016/0006-8993(92)90199-j. [DOI] [PubMed] [Google Scholar]
- Hikosaka O, Sakamoto M, Usui S. Functional properties of monkey caudate neurons. I. Activities related to saccadic eye movements. J Neurophysiol. 1989;61:780–798. doi: 10.1152/jn.1989.61.4.780. [DOI] [PubMed] [Google Scholar]
- Hill DN, Mehta SB, Kleinfeld D. Quality metrics to accompany spike sorting of extracellular signals. J Neurosci. 2011;31:8699–8705. doi: 10.1523/JNEUROSCI.0971-11.2011. [DOI] [PMC free article] [PubMed] [Google Scholar]
- Houk JC, Adams JL, Barto AG. A model of how the basal ganglia generate and use neural signals that predict reinforcement. In: Houk JC, Davis JL, Beiser DG, editors. Models of information processing in the basal ganglia. Cambridge, MA: MIT; 1995. pp. 249–270. [Google Scholar]
- Jaeger D, Kita H, Wilson CJ. Surround inhibition among projection neurons is weak or nonexistent in the rat neostriatum. J Neurophysiol. 1994;72:2555–2558. doi: 10.1152/jn.1994.72.5.2555. [DOI] [PubMed] [Google Scholar]
- Joshua M, Adler A, Mitelman R, Vaadia E, Bergman H. Midbrain dopaminergic neurons and striatal cholinergic interneurons encode the difference between reward and aversive events at different epochs of probabilistic classical conditioning trials. J Neurosci. 2008;28:11673–11684. doi: 10.1523/JNEUROSCI.3839-08.2008. [DOI] [PMC free article] [PubMed] [Google Scholar]
- Joshua M, Adler A, Prut Y, Vaadia E, Wickens JR, Bergman H. Synchronization of midbrain dopaminergic neurons is enhanced by rewarding events. Neuron. 2009a;62:695–704. doi: 10.1016/j.neuron.2009.04.026. [DOI] [PubMed] [Google Scholar]
- Joshua M, Adler A, Rosin B, Vaadia E, Bergman H. Encoding of probabilistic rewarding and aversive events by pallidal and nigral neurons. J Neurophysiol. 2009b;101:758–772. doi: 10.1152/jn.90764.2008. [DOI] [PubMed] [Google Scholar]
- Joshua M, Elias S, Levine O, Bergman H. Quantifying the isolation quality of extracellularly recorded action potentials. J Neurosci Methods. 2007;163:267–282. doi: 10.1016/j.jneumeth.2007.03.012. [DOI] [PubMed] [Google Scholar]
- Kandel ER, Schwartz JH, Jessell TM. Principles of neural science. New York: McGraw-Hill Medical; 2000. The basal ganglia; pp. 853–871. [Google Scholar]
- Kawagoe R, Takikawa Y, Hikosaka O. Expectation of reward modulates cognitive signals in the basal ganglia. Nat Neurosci. 1998;1:411–416. doi: 10.1038/1625. [DOI] [PubMed] [Google Scholar]
- Kita H. Globus pallidus external segment. Prog Brain Res. 2007;160:111–133. doi: 10.1016/S0079-6123(06)60007-1. [DOI] [PubMed] [Google Scholar]
- Kita H, Kitai ST. The morphology of globus pallidus projection neurons in the rat: an intracellular staining study. Brain Res. 1994;636:308–319. doi: 10.1016/0006-8993(94)91030-8. [DOI] [PubMed] [Google Scholar]
- Kojima S, Goldman-Rakic PS. Delay-related activity of prefrontal neurons in rhesus monkeys performing delayed response. Brain Res. 1982;248:43–49. doi: 10.1016/0006-8993(82)91145-3. [DOI] [PubMed] [Google Scholar]
- Koos T, Tepper JM, Wilson CJ. Comparison of IPSCs evoked by spiny and fast-spiking neurons in the neostriatum. J Neurosci. 2004;24:7916–7922. doi: 10.1523/JNEUROSCI.2163-04.2004. [DOI] [PMC free article] [PubMed] [Google Scholar]
- Levy R, Friedman HR, Davachi L, Goldman-Rakic PS. Differential activation of the caudate nucleus in primates performing spatial and nonspatial working memory tasks. J Neurosci. 1997;17:3870–3882. doi: 10.1523/JNEUROSCI.17-10-03870.1997. [DOI] [PMC free article] [PubMed] [Google Scholar]
- Martin RF, Bowden DM. Primate brain maps: structure of the Macaque brain. Amsterdam: Elsevier Science; 2000. pp. 1–160. [Google Scholar]
- Matsumoto N, Minamimoto T, Graybiel AM, Kimura M. Neurons in the thalamic CM-Pf complex supply striatal neurons with information about behaviorally significant sensory events. J Neurophysiol. 2001;85:960–976. doi: 10.1152/jn.2001.85.2.960. [DOI] [PubMed] [Google Scholar]
- Mink JW. The basal ganglia: focused selection and inhibition of competing motor programs. Prog Neurobiol. 1996;50:381–425. doi: 10.1016/s0301-0082(96)00042-1. [DOI] [PubMed] [Google Scholar]
- Mitelman R, Joshua M, Adler A, Bergman H. A noninvasive, fast and inexpensive tool for the detection of eye open/closed state in primates. J Neurosci Methods. 2009;178:350–356. doi: 10.1016/j.jneumeth.2008.12.007. [DOI] [PubMed] [Google Scholar]
- Miyashita Y. Neuronal correlate of visual associative long-term memory in the primate temporal cortex. Nature. 1988;335:817–820. doi: 10.1038/335817a0. [DOI] [PubMed] [Google Scholar]
- Oorschot DE. Total number of neurons in the neostriatal, pallidal, subthalamic, and substantia nigral nuclei of the rat basal ganglia: a stereological study using the cavalieri and optical disector methods. J Comp Neurol. 1996;366:580–599. doi: 10.1002/(SICI)1096-9861(19960318)366:4<580::AID-CNE3>3.0.CO;2-0. [DOI] [PubMed] [Google Scholar]
- Parent A, Sato F, Wu Y, Gauthier J, Lévesque M, Parent M. Organization of the basal ganglia: the importance of axonal collateralization. Trends Neurosci. 2000;23:S20–S27. doi: 10.1016/s1471-1931(00)00022-7. [DOI] [PubMed] [Google Scholar]
- Parthasarathy HB, Schall JD, Graybiel AM. Distributed but convergent ordering of corticostriatal projections: analysis of the frontal eye field and the supplementary eye field in the macaque monkey. J Neurosci. 1992;12:4468–4488. doi: 10.1523/JNEUROSCI.12-11-04468.1992. [DOI] [PMC free article] [PubMed] [Google Scholar]
- Percheron G, Filion M. Parallel processing in the basal ganglia: up to a point. Trends Neurosci. 1991;14:55–59. doi: 10.1016/0166-2236(91)90020-u. [DOI] [PubMed] [Google Scholar]
- Percheron G, Yelnik J, François C. A Golgi analysis of the primate globus pallidus. III. Spatial organization of the striato-pallidal complex. J Comp Neurol. 1984;227:214–227. doi: 10.1002/cne.902270207. [DOI] [PubMed] [Google Scholar]
- Planert H, Szydlowski SN, Hjorth JJ, Grillner S, Silberberg G. Dynamics of synaptic transmission between fast-spiking interneurons and striatal projection neurons of the direct and indirect pathways. J Neurosci. 2010;30:3499–3507. doi: 10.1523/JNEUROSCI.5139-09.2010. [DOI] [PMC free article] [PubMed] [Google Scholar]
- Ponzi A, Wickens J. Sequentially switching cell assemblies in random inhibitory networks of spiking neurons in the striatum. J Neurosci. 2010;30:5894–5911. doi: 10.1523/JNEUROSCI.5540-09.2010. [DOI] [PMC free article] [PubMed] [Google Scholar]
- Raju DV, Shah DJ, Wright TM, Hall RA, Smith Y. Differential synaptology of vGluT2-containing thalamostriatal afferents between the patch and matrix compartments in rats. J Comp Neurol. 2006;499:231–243. doi: 10.1002/cne.21099. [DOI] [PMC free article] [PubMed] [Google Scholar]
- Romo R, Brody CD, Hernández A, Lemus L. Neuronal correlates of parametric working memory in the prefrontal cortex. Nature. 1999;399:470–473. doi: 10.1038/20939. [DOI] [PubMed] [Google Scholar]
- Samejima K, Ueda Y, Doya K, Kimura M. Representation of action-specific reward values in the striatum. Science. 2005;310:1337–1340. doi: 10.1126/science.1115270. [DOI] [PubMed] [Google Scholar]
- Sato F, Lavallée P, Lévesque M, Parent A. Single-axon tracing study of neurons of the external segment of the globus pallidus in primate. J Comp Neurol. 2000;417:17–31. [PubMed] [Google Scholar]
- Schmitzer-Torbert N, Redish AD. Neuronal activity in the rodent dorsal striatum in sequential navigation: separation of spatial and reward responses on the multiple T task. J Neurophysiol. 2004;91:2259–2272. doi: 10.1152/jn.00687.2003. [DOI] [PubMed] [Google Scholar]
- Schultz W. Predictive reward signal of dopamine neurons. J Neurophysiol. 1998;80:1–27. doi: 10.1152/jn.1998.80.1.1. [DOI] [PubMed] [Google Scholar]
- Sharott A, Moll CK, Engler G, Denker M, Grün S, Engel AK. Different subtypes of striatal neurons are selectively modulated by cortical oscillations. J Neurosci. 2009;29:4571–4585. doi: 10.1523/JNEUROSCI.5097-08.2009. [DOI] [PMC free article] [PubMed] [Google Scholar]
- Shink E, Smith Y. Differential synaptic innervation of neurons in the internal and external segments of the globus pallidus by the GABA- and glutamate-containing terminals in the squirrel monkey. J Comp Neurol. 1995;358:119–141. doi: 10.1002/cne.903580108. [DOI] [PubMed] [Google Scholar]
- Smith Y, Raju DV, Pare JF, Sidibe M. The thalamostriatal system: a highly specific network of the basal ganglia circuitry. Trends Neurosci. 2004;27:520–527. doi: 10.1016/j.tins.2004.07.004. [DOI] [PubMed] [Google Scholar]
- Suri RE, Schultz W. Learning of sequential movements by neural network model with dopamine-like reinforcement signal. Exp Brain Res. 1998;121:350–354. doi: 10.1007/s002210050467. [DOI] [PubMed] [Google Scholar]
- Sutton RS, Barto AG. Reinforcement learning—an introduction. Cambridge, MA: MIT; 1998. [Google Scholar]
- Tepper JM, Abercrombie ED, Bolam JP. Basal ganglia macrocircuits. Prog Brain Res. 2007;160:3–7. doi: 10.1016/S0079-6123(06)60001-0. [DOI] [PubMed] [Google Scholar]
- Tepper JM, Koós T, Wilson CJ. GABAergic microcircuits in the neostriatum. Trends Neurosci. 2004;27:662–669. doi: 10.1016/j.tins.2004.08.007. [DOI] [PubMed] [Google Scholar]
- Tozzi A, de Iure A, Di Filippo M, Tantucci M, Costa C, Borsini F, Ghiglieri V, Giampà C, Fusco FR, Picconi B, Calabresi P. The distinct role of medium spiny neurons and cholinergic interneurons in the D/AA receptor interaction in the striatum: implications for Parkinson's disease. J Neurosci. 2011;31:1850–1862. doi: 10.1523/JNEUROSCI.4082-10.2011. [DOI] [PMC free article] [PubMed] [Google Scholar]
- Tunstall MJ, Oorschot DE, Kean A, Wickens JR. Inhibitory interactions between spiny projection neurons in the rat striatum. J Neurophysiol. 2002;88:1263–1269. doi: 10.1152/jn.2002.88.3.1263. [DOI] [PubMed] [Google Scholar]
- Watanabe K, Lauwereyns J, Hikosaka O. Neural correlates of rewarded and unrewarded eye movements in the primate caudate nucleus. J Neurosci. 2003;23:10052–10057. doi: 10.1523/JNEUROSCI.23-31-10052.2003. [DOI] [PMC free article] [PubMed] [Google Scholar]
- Wichmann T, Kliem MA. Neuronal activity in the primate substantia nigra pars reticulata during the performance of simple and memory-guided elbow movements. J Neurophysiol. 2004;91:815–827. doi: 10.1152/jn.01180.2002. [DOI] [PubMed] [Google Scholar]
- Wickens J. A theory of the striatum. Oxford: Pregamon; 1993. [Google Scholar]
- Wise SP, Kurata K. Set-related activity in the premotor cortex of rhesus monkeys: effect of triggering cues and relatively long delay intervals. Somatosens Mot Res. 1989;6:455–476. doi: 10.3109/08990228909144687. [DOI] [PubMed] [Google Scholar]
- Yelnik J, Percheron G, François C. A Golgi analysis of the primate globus pallidus. II. Quantitative morphology and spatial orientation of dendritic arborizations. J Comp Neurol. 1984;227:200–213. doi: 10.1002/cne.902270206. [DOI] [PubMed] [Google Scholar]