

Abstract
The ability to recognize objects across different viewpoints (view invariance) is a remarkable property of the primate visual system. According to a prominent theory, view information is represented by view-selective mechanisms at early stages of visual processing and gradually becomes view invariant in high-level visual areas. Single-cell recording studies have also reported an intermediate step of partial view invariance for mirror-symmetric face views. Nevertheless, similar evidence for this type of hierarchical processing for face view has not been reported yet in the human visual cortex. The present functional magnetic resonance imaging study used state-of-the-art multivariate pattern analysis to explore face-view tuning in the human visual cortex. Our results revealed that consistent with a view-selective representation, face view can be successfully decoded in face and object-selective regions as well as in early visual cortex. Critically, similar neural representations for mirror-symmetric views were found in high-level but not in low-level visual areas. Our results support the notion of gradual emergence of view-invariant representation with invariance for mirror-symmetric images as an intermediate step and propose putative neural correlates of mirror-image confusion in the human brain.
Introduction
View-invariant object recognition is a computationally challenging task (DiCarlo and Cox, 2007). Nevertheless, the speed and performance of humans in recognizing objects across different views is exceptionally good (Biederman et al., 1974; Thorpe et al., 1996). Two alternative concepts were proposed to explain this phenomenon: view-invariant (Marr, 1982; Biederman, 1987) and view-selective representation (Bülthoff and Edelman, 1992; Tarr, 1995). Single-unit recording and optical imaging studies of high-level visual areas [inferior temporal cortex (IT) and superior temporal sulcus (STS)] in macaque monkeys found more view-selective than view-invariant types of cells (Logothetis and Sheinberg, 1996; Wang et al., 1996; Rolls, 2000). Human neuroimaging studies report both view-selective as well as partial view-invariant representation up to 30–60° for different object categories (James et al., 2002; Vuilleumier et al., 2002; Andresen et al., 2009). Most functional magnetic resonance imaging (fMRI) studies with faces report view selectivity for unfamiliar faces (Grill-Spector et al., 1999; Andrews and Ewbank, 2004), with partial view-invariant representation up to 20–30° for familiar faces (Eger et al., 2004; Pourtois et al., 2005; Ewbank and Andrews, 2008). These findings are consistent with behavioral studies showing better recognition of faces that were previously seen in the same or adjacent views (Hill and Bruce, 1996; Fang and He, 2005).
In addition to findings for view-selective representation, empirical evidence also exists for invariant representation for mirror-symmetric head views. Single-unit recording studies report a subset of cells in STS and IT that elicit higher firing rates for mirror head views than all other views (“bimodal tuning”) (Perrett et al., 1985, 1991; Logothetis and Sheinberg, 1996). Interestingly, a recent state-of-the-art, fMRI-guided single-cell recording study in face patches of the macaque showed gradual emergence of view-invariant representation with partial invariance for mirror-symmetric views as an intermediate step (Freiwald and Tsao, 2010). Notably, partial invariance for mirror images is not specific to head views; it has also been reported in single-unit recording studies for simple shapes (Rollenhagen and Olson, 2000; Baylis and Driver, 2001) and objects (Logothetis et al., 1995). Few human fMRI studies report similar representation for mirror-symmetric objects in the fusiform gyrus (Eger et al., 2004) and lateral occipital complex (LOC) (Eger et al., 2004; Kim et al., 2009; Dilks et al., 2011), for scenes in the parahippocampal place area (PPA) (Dilks et al., 2011), and for objects, but not for words, in the visual word form area (VWFA) (Dehaene et al., 2010; Pegado et al., 2011).
The current high-resolution fMRI study employs pattern classification methodology (MVPA) to explore the neural representation of face views in the occipitotemporal cortex (Norman et al., 2006). The use of multiclass classification method permitt to not only establish the level of face-view selectivity in each area of interest, but also to explore tuning for face view, as has been reported in single-cell studies. Accordingly, our study examined three following main questions. First, is it possible to correctly decode face view from neural activity in visual cortex? Second, can we obtain evidence for mirror-symmetric tuning in high-level visual cortex? Third, do different face areas show different tuning of view selectivity and mirror symmetry?
Materials and Methods
Subjects
Eleven healthy volunteers (age: 22–40 years, 6 females, all right-handed) participated in Experiment 1. Ten healthy volunteers (age: 20–36 years, 4 females, all right-handed) participated in Experiment 2. Data of one subject from Experiment 2 was not analyzed due to excessive movements in the scanner (>8 mm). All subjects gave informed consent to participate in the study, which was approved by the ethics committee of the Tel Aviv Sourasky Medical Center.
Apparatus
MRI data were collected using a 3T GE MRI scanner with an eight-channel head coil. The echo planar imaging sequence used to collect the fMRI data had the following parameters: TR = 2 s; TE = 35 ms; flip angle = 90°, 22 slices; slice thickness = 2.4 mm no gap; 2.04 × 2.04 mm in-plane resolution; matrix 128 × 128; and FOV = 200 mm. Slice orientation was parallel to the temporal lobe and covered the occipital and temporal lobes. Anatomical spoiled gradient-recalled acquisition in steady state (SPGR) images were collected with 1 × 1 × 1 mm resolution, TE = 3.52 ms, and TR = 9.104 ms.
Stimuli were presented using MATLAB 7.6 with Psychtoolbox (Brainard, 1997). The stimuli were projected to a screen located at the back of the scanner, and the subjects saw them via a mirror installed above their head. In the scanner, subjects received a response box, which they used according to experiment instructions.
Functional localizer
The functional localizer scans included images of five categories: front-view faces, faces that varied in view, objects, scenes, and scrambled objects. Data from blocks of faces that varied in view and scenes were not analyzed in the current study but were included for the purpose of other studies. In each localizer scan, there were 4 blocks for each category, which presented 20 images for 200 ms each with an interstimulus interval of 600 ms, and 5 blocks of a baseline fixation point for a total of 25 blocks. Each block lasted 16 s. The order of the conditions was counterbalanced both within and across scans. The total duration of the scan session was 6:52 min including 12 s of dummy scans. To ensure attentiveness to the stimuli, subjects were asked to press a response key whenever two identical images appeared consecutively (one-back identity task). Nine subjects completed three localizer scans, and two subjects completed two localizer scans. The functional localizer in Experiment 2 was the same as in Experiment 1, except that instead of the different view-face condition, a headless body condition was presented to define body-selective areas. Data from the headless body condition were not analyzed in the current study and were included for use in another experiment. All 10 subjects completed three localizer scans.
Face-view experiment
Stimuli.
The stimuli were generated using the FaceGen Modeler 3.1 program. The stimuli set consisted of four identities with five head views: two full profiles, two three-quarter profiles (45° rotation), and a front view (Fig. 1A). The vertical size of all stimuli was 8.2°. The horizontal size of the full profile, three-quarter profile, and front view were 6.5°, 5.7°, and 5.2° of visual angle, respectively. For Experiment 2, the size of the image was reduced to 5.2° vertically and 2.5° horizontally to obtain a more foveal presentation. To avoid attention lapses from the fixation dot due to stimulus change, only one face identity was used. In addition, the stimuli were cut in the following ways using Adobe Photoshop CS2: the back side of both profiles and three-quarter profiles were cut just before the ear. To match the width of the face stimulus across all orientations, the ears in the frontal view were also cut.
Figure 1.
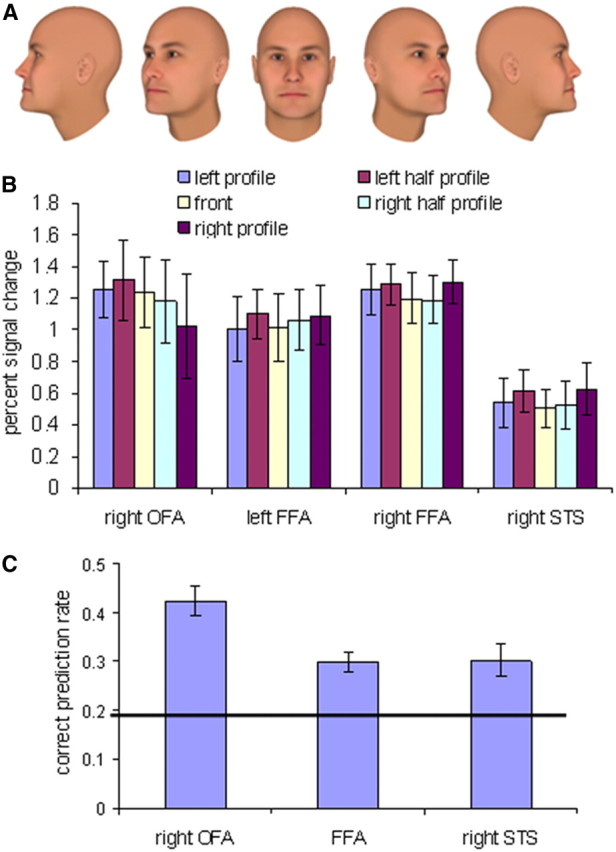
Activations and correct classification for the five face views in face-selective areas (FFA, OFA, and STS) in Experiment 1. A, Images of the five face views used in the experiment. B, Percent signal change for each of the five face views. C, Correct classification rates averaged across the five face views. The black line indicates chance level of 0.2. All error bars indicate the SEM.
Experiment design.
The five head views were presented in different blocks. Each scan included 5 blocks of each view and 5 blocks of a baseline fixation dot for a total of 30 blocks. The order of the blocks was counterbalanced within a scan, and each set of 5 head view blocks was separated by a fixation block. The duration of the stimulus and baseline block was 12 and 10 s, respectively. Each block included 12 faces. The stimulus presentation time was 0.3 s, and the interstimulus interval was 0.7 s. The total scan duration was 6:02 min including 12 s of dummy scans. Within each block, all faces were of the same head view. The four different face identities were presented in a random order within a block. To ensure that subjects paid attention to the faces, they were asked to press a response key whenever the same face identity appeared in two consecutive trials. To prevent discrimination based on apparent motion of facial features, the location of the faces varied across trials with a random jitter of 10 pixels. All subjects completed five scans.
The design of the face-view experiment in Experiment 2 was similar to that of Experiment 1 but used a different task. Subjects were instructed to ignore the face stimuli and fixate on a fixation dot that was presented in a fixed central location. The location of the face image jittered randomly, 15 pixels (0.3°) from the center of the stimulus in one of four directions. To ensure that the subjects were fixating at the center of the screen, the color of the black dot changed to green for 0.3 s at random times during the block, no more than two times per block and with at least 3 s in between. Subjects were asked to press a key when they noticed the color change. All subjects completed five scans.
Preprocessing
SPM5 (Wellcome Department of Imaging Neuroscience, London, UK; www.fil.ion.ucl.ac.uk) software was used for the data analysis. The functional localizer and the experimental head view scans were realigned, motion corrected, normalized to 2 × 2 × 2 voxel resolution, and smoothed with a full-width at half-maximum = 3 × 3 × 3 mm kernel. The normalization was done using output parameters of segmentation procedure.
Functional localizer
Face- and object-selective areas.
A GLM was estimated for each subject (HRF boxcar function for the localizer, five regressors for each scan). Each object and face-selective area (p < 0.0001, uncorrected) was defined as voxels corresponding to the following contrasts: Front Faces > Objects in the LOC, the fusiform gyrus and the STS defined as the occipital face area (OFA), fusiform face area (FFA), and STS, respectively; and Objects > Scrambled Objects, excluding Face > Objects (p = 0.05) in the LOC, which were defined as the LO object area.
Early visual cortex.
The anatomical SPGR image of every subject was expanded using the FreeSurfer package (http://surfer.nmr.mgh.harvard.edu), and then the occipital lobe was flattened. By using Scrambled Objects > Objects contrast (p < 0.0001, uncorrected), for every subject and every hemisphere, contiguous clusters along the calcarine sulcus starting from the most posterior (foveal) part were selected (Mur et al., 2010; Cichy et al., 2011). The clusters encompassed the lower and upper banks of the calcarine sulcus. Then selected ROIs (labels) were exported from FreeSurfer to the Niftii (SPM) format.
View experiment analysis
ROI selection procedure.
The functional and anatomical ROIs, defined in the previous step, had different sizes. Because the level of classification rate might be influenced by the number of voxels (Eger et al., 2008; Walther et al., 2009; Said et al., 2010), it was important to use the same number of voxels for the different ROIs. The 48 contiguous, most active voxels for each ROI were selected (Cichy et al., 2011). For the early visual cortex (EVC), the most activated voxels were selected for the contrast Scrambled Objects > Objects (Grill-Spector and Malach, 2004). ROIs that were smaller than 48 voxels were not included in the analysis. The decision to use a relatively small number of voxels per ROI was guided by two considerations. First, we preferred to use a conservative approach to prevent any potential overfitting (Hastie et al., 2009). Second, for a p < 0.0001 (uncorrected) threshold the mean ROI size of the right FFA and right OFA was 85 voxels (median = 68 voxels) and 53 voxels (median = 50 voxels), respectively. Therefore, by using ROIs larger than 48 voxels we would lose a large number of critical ROIs. Only the ROIs that were localized in at least six subjects were included in the analysis. The number of subjects for each area included in the analysis is presented in Table 1. Because the 48 voxel criterion resulted in a relatively small number of subjects for some of the areas (e.g., OFA), to increase the sample size we performed an additional analysis in which we included all subjects with an ROI of at least 10 voxels (p < 0.0001, uncorrected).
Table 1.
Number of subjects for each of the localized regions of interest
| Area | Number of subjects per area |
|
|---|---|---|
| Experiment 1 (n = 11) | Experiment 2 (n = 9) | |
| Left EVC | 11 | 8 |
| Right EVC | 11 | 8 |
| Left OFA | 3* | 2* |
| Right OFA | 7 | 6 |
| Left LO | 6 | 7 |
| Right LO | 9 | 8 |
| Left FFA | 7 | 4* |
| Right FFA | 9 | 8 |
| Left STS | 2* | 2* |
| Right STS | 6 | 4* |
| Left ATL face area | 0* | 1* |
| Right ATL face area | 2* | 1* |
ROIs that were localized in less than six subjects (marked with*) were not included in the analysis (see Materials and Methods). ATL, Anterior temporal lobe.
Average fMRI signal analysis.
A GLM was estimated for each subject (HRF boxcar function for the view experiment scan, five regressors for each scan). Time courses were extracted for each regressor using the MarsBaR region of interest toolbox for SPM (Brett et al., 2002). The percent signal change peak plateau values (from TR = 4 to TR = 7 from block onset) were averaged and analyzed using SPSS 17.
MVPA.
Pattern classification analysis was executed using raw intensity values. After the general preprocessing stage (including smoothing), the pattern classification data were detrended and normalized (z-score MATLAB function). This procedure was applied for the full-scan voxel time course. In addition, the time courses were shifted two volumes (4 s) to account for hemodynamic lag. For each of the five conditions, the mean intensity for the condition was subtracted from the voxel intensity value (Serences et al., 2009; Misaki et al., 2010; Cichy et al., 2011). This procedure was performed separately for the data from each scan to prevent information leakage in the cross-validation procedure. Each scan consisted of five blocks per class, with six data points in each block (TRs). Across the five scans, the total number of samples per class was 5 × 6 × 5 = 150. The leave-one-scan-out cross-validation procedure was repeated five times, and then the results were averaged.
The primary classification package was the LibSVM MATLAB implementation of the linear support vector machine (http://www.csie.ntu.edu.tw/∼cjlin/libsvm/). For multiclass classification, this implementation uses a one-against-one major voting scheme. To validate the results, we also used another SVM implementation—the OSU SVM MATLAB toolbox implementation (www.sourceforge.net/projects/svm/)—as well as the Linear Discriminant Analysis MATLAB statistics toolbox (http://www.mathworks.com/products/statistics/). All pattern classification analysis was performed using a custom-made MATLAB code. The significance of the classification results was established as a group level t test above the chance of the individual classification rates (Eger et al., 2008; Meyer et al., 2010).
Classification rates were plotted for each view based on the five-class classification confusion matrix (Serences et al., 2009). The profile orientation classification rates were averaged across the left and right profile views. Data were plotted in two classification rate curves: profile and front views.
Eye-tracking recording.
Eye movements of two of the participants in Experiment 2 were tracked in the scanner. We used the iView X MRI-LR system (SMI Sensomotoric Instruments) with a sampling rate of 50 Hz. The system output files were converted into a text format and analyzed using an in-house MATLAB code (see Analysis of dot detection performance and eye movements).
Results
ROI localization
Face- and object-selective areas were localized using an independent functional localizer and were defined individually for each subject. The EVC was defined individually based on anatomical and functional markers (see Functional localization of early visual cortex in Materials and Methods). Only areas that could be localized in at least six subjects were included in the analysis. The number of subjects for each area is shown in Table 1.
Experiment 1
Face-selective areas
Average fMRI signal and view-decoding analysis.
Figure 1B shows the average percent signal change for each of the five face views in the face-selective areas (right OFA, right FFA, left FFA, and right STS). Two-way ANOVA with area and face view as repeated measures revealed no significant main effect of area (F(3,9) = 1.436; p = 0.296), no significant main effect of face view (F(4,12) < 1), and no significant interaction between area and face view (F(12,36) = 1.261; p = 0.283). Thus, it was impossible to decode face view on the basis of the averaged fMRI signal within each area.
Next, we sought to determine whether it is possible to decode head view using MVPA. To ensure that differences in the global level of activation across views did not influence the multivariate results, the global signal level was subtracted before classification analysis for each condition separately (Misaki et al., 2010). The results of the multiclass classification (averaged across views) are shown in Figure 1C. Results in the FFA were collapsed across hemispheres, since two-way ANOVA with hemisphere and face view as repeated measures revealed neither significant main effect of hemisphere (F(1,5) < 1), nor significant interaction between view and hemisphere (F(20,4) < 1). The correct prediction rate averaged across views was above chance level for all face areas (p < 0.0001), indicating that multivoxel patterns contain information that permits face-view decoding even when the average fMRI signal did not differ across face views (correct predictions for each individual view are presented in Table 2). One-way ANOVA with an area (OFA, FFA, and STS) as a repeated measure revealed a significant main effect of area (F(2,8) = 20.776; p = 0.001). Post hoc two-tailed paired t test revealed a significantly higher prediction rate in the OFA than the FFA (t(5) = 6.9; p = 0.001), and in the OFA than the STS (t(4) = 4.3; p = 0.013), but no difference between the FFA and STS (t(5) = 0.738; p = 0.494). This result implicates better view decoding in the more low-level, OFA than in mid-temporal face areas.
Table 2.
Correct classification rates for each head view in Experiment 1
| Region | Left profile | Left half profile | Front | Right half profile | Right profile | Average |
|---|---|---|---|---|---|---|
| Right OFA | 0.52 | 0.32 | 0.39 | 0.35 | 0.53 | 0.42 |
| Left FFA | 0.34 | 0.25 (n.s.) | 0.36 | 0.29 | 0.34 | 0.33 |
| Right FFA | 0.32 | 0.25 | 0.33 | 0.27 | 0.31 | 0.29 |
| Right STS | 0.34 | 0.27 | 0.33 | 0.27 | 0.34 | 0.31 |
| Left LO | 0.47 | 0.32 | 0.35 | 0.36 | 0.42 | 0.38 |
| Right LO | 0.46 | 0.31 | 0.34 | 0.33 | 0.40 | 0.37 |
Classification rates were significantly above chance level (chance level = 0.2).
View similarity analysis.
To recover the similarity among the neural representations of the different views, we examined the five-class classification confusion matrix, which indicates for each view its rate of correct discrimination and its confusion error rates with each of the four other views. The classification rates for the front view (Fig. 2A) showed a clear bell curve with the peak for correct classification of the front view, intermediate confusion rate with the half-profile views, and lowest confusion rate with profile views.
Figure 2.

Correct classification and confusion rates in face-selective areas in Experiment 1. A, Correct classification and confusion rates for frontal view faces. B, Correct classification and confusion rates for profile view faces. C, Pairwise classification of the profile view with each of the other four views in face-selective areas. The black line indicates a chance level of 0.5. All error bars indicate the SEM.
To examine mirror confusion, we plotted classification rates for profile views (Fig. 2B). Profile classification rates were similar across the left and right profiles and therefore were averaged across them. The FFA and right STS showed an inverted bell curve, indicating highest confusion between the mirror-symmetric profiles when compared with all other views. There was no such pattern in the right OFA, which showed the lowest confusion rate between opposite profiles. Due to a limited number of data points (five), we could not conduct curve-fitting analysis (Freiwald et al., 2009) on these data.
To further examine these data statistically, we performed pairwise classification of the profile view with each of the other views (Fig. 2C). The classification results for all pairs in all regions, including discrimination between two profiles, were above chance level (p < 0.013, one-tailed t test against a chance level of 0.5). Notably, whereas the right OFA showed a monotonic increase in classification rate as a function of the angle difference between the views, the FFA and right STS showed a decrease in their prediction rates for a profile with an opposite profile relative to that of the front view. To test this observation statistically, we first executed two-way ANOVA with area (FFA, OFA, and STS) and paired views as the repeated measures. The result revealed significant main effects of area and paired views (F(2,8) = 20.67, p = 0.001; and F(3,12) = 7.363, p = 0.005, respectively) and significant interaction between area and paired views (F(6,24) = 2.888; p = 0.029). To test each region individually, we ran a one-way ANOVA for each area with paired views as the repeated measure. We found a significant quadratic trend for the FFA (F(1,9) = 29.26; p < 0.001). By contrast, the right OFA showed a significant linear trend (F(1,6) = 24.890; p < 0.002). No significant trends were found for the right STS. Thus, pairwise analysis confirmed the previous observation that high-level areas and especially the FFA show partial mirror confusion and a view-selective pattern at the same time, whereas the OFA showed a view-selective representation with no evidence for mirror-symmetric representation.
LO object-selective area
Average fMRI signal and view-decoding analysis.
Figure 3A shows the average percent signal change for each of the five face views in the LO object-selective area. Unlike the face areas that show no difference in response to the different views, both right and left LO showed a higher response to the profiles than the other views. This was supported by a significant main effect of view (F(4,16) = 8.672; p = 0.001), and no significant interaction between hemisphere and face view (F(4,16) = 1.867; p = 0.166). The multivariate view-decoding results averaged across views in the bilateral LO were above chance (prediction rate = 0.37; SEM = 0.019; p < 0.0001). These results and decoding of individual views are listed in Table 2.
Figure 3.

Activations, correct classification, and confusion rates in the LO object area in Experiment 1. A, Average percent signal change for the five face views. B, Correct classification and confusion rates for the profile view. C, Pairwise classification of the profile view with each of the other views. The black line indicates a chance level of 0.5. All error bars indicate the SEM.
View similarity analysis.
The examination of the five-class classification confusion matrix for front orientation revealed a bell-shaped tuning curve similar to the face-selective regions with the peak for the front view correct classification and gradual decrease for more distant views. Classification rates for profile views (averaged across the left and right profiles) showed an inverted bell curve similar to the FFA and STS (Fig. 3B). The pairwise classifications of the profile view with each of the other views are shown in Figure 3C. The classification results for all pairs were above chance level (p < 0.001; one-tailed t test against a chance level of 0.5). One-way ANOVA with paired views as a repeated measure showed marginally significant quadratic trend (F(1,9) = 4.149; p = 0.072). To find out whether this pattern of similarity differs from the mirror symmetry tuning found in mid-temporal face areas, we performed two-way ANOVA with area (LO, FFA, STS) and paired views as repeated measures. No significant interaction was found (F(6,30) < 1), suggesting similar mirror symmetric tuning in object and mid-temporal face-selective areas with greater neural similarity between mirror profile views comparing to front versus profile views. Remarkably, the mirror-symmetric tuning in LO did differ from OFA: two-way ANOVA with area (LO, OFA) and paired views as repeated measures revealed significant interaction between area and paired view (F(3,15) = 7.269; p = 0.003). It is noteworthy that similar to the mid-temporal face-selective areas, the mirror-symmetric tuning in the LO was only partial since two profiles could be still discriminated above chance level.
Classification with smaller ROIs and larger sample size.
The analysis reported above included only subjects that had ROIs of at least 48 voxels. As a result, some inherently small areas (e.g., OFA) had a relatively high subject exclusion rate (Table 1). To be able to include more subjects in the statistical analysis, we conducted an additional classification analysis, which included all subjects with an ROI size of at least 10 voxels (p value <0.0001, uncorrected). The number of subjects included in this analysis was higher (Table 3). Overall, the results of this analysis replicated our main findings. Here we report the key statistics. The average classification rate across views was above chance for all the regions (p < 0.001; one-tailed t test against a chance level of 0.5); decoding of individual views is presented in Table 3. Analysis of confusion rates for front and profile views showed mirror-symmetric representation in FFA and STS but not in OFA, as was the case in our main analysis. In pairwise analysis, the repeated-measures ANOVA for face-selective regions with area (FFA, OFA, and STS) and paired views as the repeated measures revealed significant main effects of area and paired views (F(2,12) = 35.33, p < 0.001; and F(3,18) = 6.9, p = 0.003, respectively) and significant interaction between area and paired views (F(6,36) = 2.426; p = 0.045). One-way ANOVA for each individual region revealed a significant quadratic trend for the FFA (F(1,10) = 21.050; p = 0.001), a significant linear trend for the right OFA (F(1,8) = 7.125; p = 0.028), and no significant trends were found for the STS. The object area LO showed a significant quadratic trend (F(1,9) = 15.961; p = 0.003).
Table 3.
Number of subjects and correct classification rates in Experiment 1 for ROI size equal or larger than 10 voxels
| Region | Number of subjects per area | Left profile | Left half profile | Front | Right half profile | Right profile | Average |
|---|---|---|---|---|---|---|---|
| Right OFA | 9 | 0.49 | 0.32 | 0.38 | 0.35 | 0.49 | 0.41 |
| Left FFA | 10 | 0.34 | 0.25 | 0.35 | 0.29 | 0.33 | 0.31 |
| Right FFA | 11 | 0.29 | 0.28 | 0.32 | 0.26 | 0.29 | 0.29 |
| Right STS | 7 | 0.32 | 0.25 (n.s.) | 0.33 | 0.26 | 0.34 | 0.30 |
| Left LO | 9 | 0.42 | 0.32 | 0.34 | 0.34 | 0.42 | 0.37 |
| Right LO | 10 | 0.45 | 0.30 | 0.34 | 0.32 | 0.38 | 0.36 |
Classification rates are significantly above chance level (chance level = 0.2).
EVC
To complement our findings in high-level visual areas, we were also interested in exploring the decoding of view information in the EVC. If mirror confusion is indeed a feature of high-level visual areas (Perrett et al., 1985, 1991; Logothetis and Sheinberg, 1996; Freiwald and Tsao, 2010), as supported by the hierarchy of mirror-symmetric tuning seen here in the occipital and mid-temporal areas, then, like the OFA, the EVC would not show evidence for mirror-symmetric tuning. However, the one-back identity task that we used, although suitable for studying high-level visual areas, was not suitable for studying the EVC. In particular, to perform the one-back identity task, subjects had to fixate on the facial features. Thus, when subjects performed the task on right profiles, the stimulus was presented mostly in the right visual field, whereas when they focused on left profiles, the stimulus was presented mostly in the left visual field (Fig. 4A). Indeed, activations of the EVC in response to the five views showed clear laterality across hemispheres (Fig. 4B). Two-way ANOVA with hemisphere and face view as repeated measures confirmed this observation by revealing a significant interaction between hemisphere and face view (F(4,40) = 13.303; p < 0.001), but no significant main effect of hemisphere (F(1,10) < 1) or face view (F(4,40) = 1.864; p = 0.136). Notably, no such laterality bias was observed in the high-level visual areas (Figs. 1B, 3A), including the right OFA, where a nonsignificant right skew was in the direction opposite to the one expected by a laterality bias. This confirmed that our results of high-level visual areas are completely unbiased.
Figure 4.

Laterality bias for face views in the one-back identity task in Experiment 1. A, To perform the one-back identity task subjects had to look at the facial features (indicated by the arrow) and therefore right and left profiles (and partly also half profiles) were located in different visual fields. B, Average percent signal change for the five face views in EVC indicates strong laterality bias for the different face views. The error bars indicate the SEM.
Given the strong retinotopic effect that we found in EVC, we ran a second experiment in which we controlled for the location of the stimulus across views. In particular, we asked subjects to fixate on a centrally presented fixation dot and press a key whenever they noticed that the dot's color changed (Yue et al., 2011). The faces were presented behind the dot in slightly different positions that jittered within a block across the face images. As in the first experiment, each view was presented in a different block, and the location jitter of the face images was similar across blocks. In addition, to ensure that facial features were not presented too far from the dot (especially for profile faces), we removed the back part of the heads in the profiles and half profiles (Fig. 5A). Finally, to make the width of the front face equivalent to that of the profile and half profile views, the ears in the frontal view were removed (see Materials and Methods).
Figure 5.
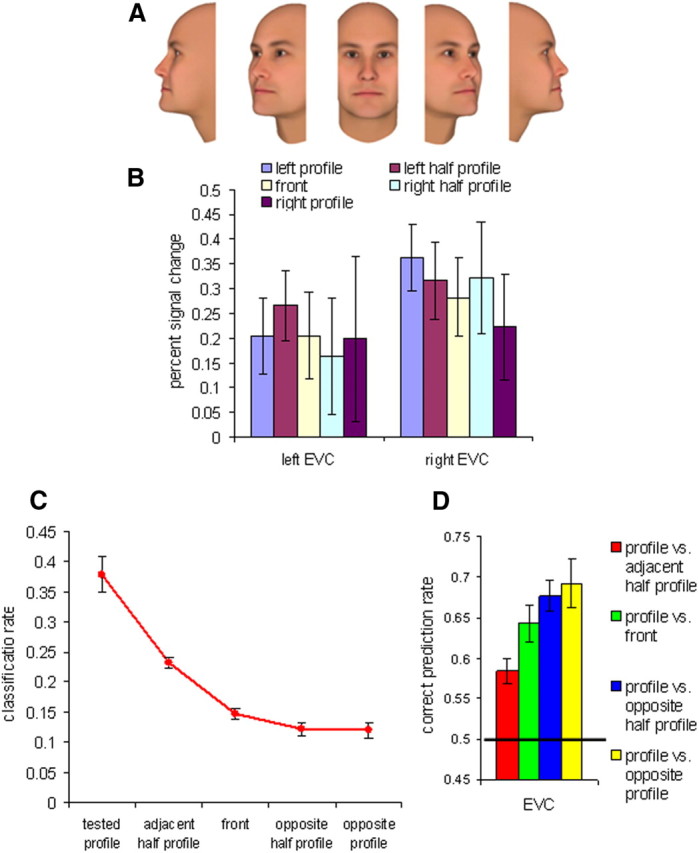
Activations, correct classification, and confusion rates in EVC in Experiment 2. A, The five face views used in Experiment 2. B, Average percent signal change for the five face views. C, Correct classification rates and confusion errors for profile view. D, Pairwise classification of the profile view with each of the other views. The black line indicates a chance level of 0.5. All error bars indicate the SEM.
Experiment 2
EVC
Average fMRI signal and multiclass classification analysis.
The average percent signal change for each face view in the left and right EVC is shown in Figure 5B. Two-way ANOVA with hemisphere and face view as repeated measures revealed neither significant main effects (p > 0.232), nor significant interaction (F(4,28) = 0.437; p = 0.780). Thus, the dot-fixation task eliminated the laterality bias we observed in Experiment 1 (Fig. 4B). The correct prediction rate of multiclass classification in the bilateral EVC was above chance level (prediction rate = 0.31; SEM = 0.026; p < 0.0001; one-tailed t test against a chance level of 0.5). Correct predictions for each individual view were above chance level and are specified in Table 4. Two-way ANOVA with hemisphere and view as repeated measures did not reveal a significant interaction with hemisphere (F(4,28) < 1); therefore, in subsequent analyses results were collapsed across hemispheres.
Table 4.
Correct classification rates for each face view in Experiment 2
| Region | Left profile | Left half profile | Front | Right half profile | Right profile | Average |
|---|---|---|---|---|---|---|
| Left EVC | 0.32 | 0.28 | 0.22 (n.s.) | 0.26 | 0.37 | 0.31 |
| Right EVC | 0.37 | 0.26 | 0.34 | 0.29 | 0.37 | 0.32 |
| Right OFA | 0.31 | 0.25 | 0.38 | 0.28 | 0.35 | 0.32 |
| Right FFA | 0.26 | 0.22 | 0.34 | 0.23 (n.s.) | 0.24 (n.s.) | 0.26 |
| Left LO | 0.31 | 0.28 | 0.30 | 0.30 | 0.26 | 0.29 |
| Right LO | 0.27 | 0.27 | 0.34 | 0.26 | 0.27 | 0.28 |
Classification rates are significantly above chance level (chance level = 0.2).
View similarity analysis.
Similar to the high-level visual areas in Experiment 1, we observed a bell-shaped tuning curve for the front view in the EVC. The main objective was to test whether the EVC shows mirror-symmetric tuning for face views. Not only did the EVC show no evidence for a mirror-symmetric tuning, but the front view was mistakenly classified as the tested profile more frequently than the opposite profile (Fig. 5C). In addition, pairwise view classification analysis (Fig. 5D) showed beyond chance prediction rate for all pairs (p < 0.001) and a monotonic increase in the classification rate as a function of the angle difference between views. One-way ANOVA for paired views revealed a significant linear trend (F(1,7) = 18.359; p = 0.004). Together, these findings demonstrate no evidence for mirror-symmetric tuning in the EVC, similar to results shown in Experiment 1 for the OFA.
To reveal whether findings we revealed in face and object areas in the one-back task are replicated with the dot-fixation task, we next examined response and decoding performances for face view in the face-selective and object-selective areas.
Face-selective areas
Average fMRI signal and multiclass classification analysis.
The OFA and FFA showed higher activations for frontal views than all other views (Fig. 6A). Two-way ANOVA with area and face view as repeated measures confirmed this observation by revealing a significant main effect of face view (F(4,16) = 6.795; p < 0.002) and no significant interaction between area and face view (F(4,16) < 1). These results contrast with the observation in Experiment 1 that the average signal level did not differ across views in the temporal face-selective areas. The main reason for the higher activation of the front view relative to the other views in this experiment is likely to be the location of the fixation dot closer to eyes, nose, and mouth in the frontal than in the profile and half-profile faces. Thus, although the location of the dot at the center of the face perfectly controlled for retinotopic effects that are critical for studying EVC, it might have generated the higher activation to front-view faces relative to the other views in the face areas. This finding supported the choice of the one-back task for studying high-level visual areas as it requires subjects to deploy similar attention to facial features across all views; indeed, this method resulted in similar activity for all views in these areas (Fig. 1B).
Figure 6.

Activations and correct classification to the five face views in face-selective areas in Experiment 2. A, Average percent signal change for the 5 face views. B, Correct classification rates and confusion errors for profile view. C, Pairwise classification of the profile view with each of the other views. The black line indicates a chance level of 0.5. All error bars indicate the SEM.
Similar to Experiment 1, results of multiclass classification (averaged across views) revealed beyond chance classification for all the areas (right OFA: prediction rate = 0.32, SEM = 0.029, p < 0.001; right FFA: prediction rate = 0.26, SEM = 0.021, p = 0.0013). Prediction rates in the OFA were marginally significantly higher than in the FFA: t(4) = 2.181, p = 0.095. The results of correct prediction rate for individual views are presented in Table 4. The right STS was not localized in a sufficient number of subjects (Table 1) and therefore was not analyzed in this experiment.
View similarity analysis.
Similar to Experiment 1, a bell-shaped tuning curve was found in Experiment 2 for the front view in the FFA and OFA. Classification rates of profile views replicated findings of Experiment 1: an inverted bell curve for the right FFA, but no such pattern for right OFA (Fig. 6B). Pairwise classifications (Fig. 6C) showed a gradual increase in the discrimination rate as a function of the view angle difference in the right OFA but a decrease in the prediction rate for profile views in the right FFA. Two-way ANOVA with area (FFA and OFA) and paired views as repeated measures reveal the following: a significant main effect of paired views: F(3,12) = 4, p = 0.035; marginally significant main effect of area: F(3,12) = 4, p = 0.092; and marginally significant interaction between area and paired views: F(9,27) = 2.549, p = 0.1. One-way ANOVA with paired views as a repeated measure showed significant quadratic trend in the right FFA (F(1,7) = 16.778; p = 0.005) and marginally significant linear trend in the right OFA (F(1,5) = 6.273; p < 0.054). Overall results of Experiment 2 replicated results of Experiment 1 showing no evidence for mirror-symmetric tuning in the OFA but mirror confusion in the FFA.
LO object-selective area
Percent signal change in the LO did not differ across face views: two-way ANOVA with hemisphere and face view as a repeated measure revealed a nonsignificant main effect of view (F(4,20) = 1.163; p = 0.357) and nonsignificant interaction between hemisphere and face view (F(4,20) < 1). Thus, in contrast to face-selective areas, in the LO we did not observe higher activation to front face views relative to the other views.
The multivariate view-decoding results averaged across views in the bilateral LO were above chance (p < 0.0001). These results and the decoding of individual views are listed in Table 4. The five-class classification confusion matrix for profile orientation revealed an inverted bell-shaped tuning curve similar to the FFA (Fig. 7A). The pairwise classification analysis yielded above chance classification (Fig. 7B) for all pairs (p < 0.001; one-tailed t test against a chance level of 0.5). One-way ANOVA with paired views as a repeated measure showed marginally significant quadratic trend (F(1,7) = 4.666; p = 0.068). Thus, the LO object-selective area showed similar to the FFA mirror-symmetric tuning.
Figure 7.

Classification rates in the LO object area in Experiment 2. A, Correct classification rates and confusion errors for profile view. B, Pairwise classification of the profile view with each of the other views. The black line indicates a chance level of 0.5. All error bars indicate the SEM.
Analysis of dot detection performance and eye movements
Performance for the dot color change detection was high under all conditions: 95% for the left profile, 97% for the left half profile, 96% for the front, 96% for the right half profile, and 96% for the right profile. To further ensure that the fixation task was effective, we collected eye-tracking data in the scanner for two subjects. The first aim of this analysis was to ensure that the subjects indeed fixated on the dot according to instructions. The mean x and y fixation coordinates in both subjects for all conditions and scans overlapped with the fixation dot. The SDs of the eye position relative to the dot were as follows: x-coordinate = 0.12°, y-coordinate = 0.16° for Subject 1; x-coordinate = 0.11°, y-coordinate = 0.13° for Subject 2. Given that the stimulus size was 5.2×2.5°, the deviation from the fixation point was very minor, suggesting that the subjects strongly fixated on the dot during the entire task.
The second aim was to ensure that there was no difference in the location of fixations across conditions. For each scan and each condition, the x- and y-coordinates were averaged. Then, for each coordinate we ran a one-way repeated measure ANOVA with view as the factor (Schwarzlose et al., 2008). No significant main effect was found in either subject: Subject 1, x-coordinate: F(4,16) = 1.229, p = 0.338; Subject 1, y-coordinate: F(4,16) = 2.208, p = 0.114; Subject 2, x-coordinate: F(4,16) = 1.328, p = 0.302; Subject 2, y-coordinate: F(4,16) = 1.472, p = 0.257.
Discussion
The current fMRI study explored the representation of face view in the human occipitotemporal visual cortex using MVPA. Our findings can be summarized as follows: (1) face viewpoint can be successfully decoded from occipitotemporal face-selective areas (OFA, FFA, and STS), the LO object area, and EVC; (2) analysis of classification errors and pairwise classification of profile views revealed similarity in neural representations for mirror-symmetric profile views in high-level face-selective areas (FFA and STS) and in the LO object area, but no evidence for mirror-symmetric tuning in the low-level OFA and EVC; and (3) the low-level OFA showed higher face-view decoding than the mid-temporal face-selective areas (FFA and STS). Overall, our findings support a gradual emergence from a view-selective representation to partial view invariance across the posterior-anterior axis of the ventral visual system.
Face-view decoding in visual cortex
We used multiclass (five classes) multivariate classification to decode face view from an fMRI signal in visual cortex. Our analysis shows that each view can be decoded beyond chance level in the occipital and temporal face and object-selective areas as well as in EVC. Our findings are in line with previous fMRI studies that used fMR-adaptation to study view selectivity. Most of these studies revealed release from adaptation for different views of faces and objects (Gauthier et al., 2002; Andrews and Ewbank, 2004; Fang et al., 2007; Xu et al., 2009). Other fMR-adaptation studies revealed a moderate invariance for view (view differences of up to 30°) for familiar (celebrity) faces (Eger et al., 2005; Pourtois et al., 2005; Ewbank and Andrews, 2008), objects (James et al., 2002; Vuilleumier et al., 2002; Andresen et al., 2009), and bodies (Taylor et al., 2010). In line with these findings, a recent MVPA study revealed both view-specific and view-invariant representation for objects differing in 60° in the LOC (Eger et al., 2008). Whereas in some previous studies view selectivity was found for different views of the same face identity (Andrews and Ewbank, 2004) or object type (Gauthier et al., 2002), in our study view decoding was independent of identity. Noteworthy, because in our design different identities were intermixed within each view block, it did not allow us to examine neural substrates of identity-invariant representation, which, based on recent findings (Freiwald and Tsao, 2010; Eifuku et al., 2011), is expected to be found in more anterior temporal areas. A recent study, which used multivariate analysis to decode face views (Natu et al., 2010), reported view-selective representation in the ventral temporal cortex. The study by Natu et al. (2010) differed from our study in three significant ways. First, symmetric face views were not used and therefore the mirror confusion phenomenon could not be studied. Furthermore, the authors only used pairwise classification in contrast to the multiclass classification we used, and they did not examine error rates, which are informative for examining the similarity of representations across views. Finally, they examined only one single ROI, comprising the whole ventral temporal cortex; this precluded a systematic comparison across low- and high-level areas.
In summary, the multivariate method achieved successful classification in areas where the average level of activation did not differ across views (all face-selective areas in Experiment 1 and the EVC and the LO in Experiment 2). Successful prediction in all regions was based solely on multivoxel pattern activity rather than the global signal level, which was subtracted for each condition before classification analysis. These results, therefore, demonstrate the advantage of an information-based over an activation-based approach (Kriegeskorte and Bandettini, 2007).
Face-view tuning in visual cortex
A fundamental property of view-selective cells is their tuning for a preferred face view. In other words, whereas a maximal firing rate is recorded for a preferred view, firing rate gradually decreases as the rotation angle from the preferred view becomes larger (Logothetis and Sheinberg, 1996). To examine view tuning in this study, we examined the confusion error rates of a tested view with each of the four other views. A similar approach was recently used to show tuning for gratings' orientation in the striate cortex (Serences et al., 2009) and to investigate the representation of scenes in the PPA (Walther et al., 2009; Park et al., 2011). Using classification error rates, we revealed evidence for partial view invariance for mirror-symmetric views (mirror confusion), which has been reported in behavioral and neurophysiological studies in both humans and animals (Mach, 1914; Sutherland, 1960; Nickerson and Adams, 1979; Logothetis and Sheinberg, 1996; Davidoff and Warrington, 2001). The high-level face-selective areas (FFA and STS) and the LO object area all showed a characteristic inverted bell-shaped tuning curve, indicating that the highest confusion was between mirror-symmetric profiles compared with all other views. Remarkably, no such pattern was found in the OFA or EVC. It is noteworthy that the fact that the ability to discriminate two profiles was beyond chance level in almost all tested regions, except for the FFA in Experiment 2, which suggests that mirror confusion is mostly partial.
The results of our study are also in line with previous fMRI studies that presented mirror-symmetric images. These studies reported fMR-adaptation for mirror-symmetric non-face images in the fusiform gyrus (Eger et al., 2004), LOC (Eger et al., 2004; Kim et al., 2009; Dilks et al., 2011), PPA (Dilks et al., 2011), and in the VWFA (Dehaene et al., 2010; Pegado et al., 2011). Our study extended these previous findings in several ways. First, multivariate analyses enabled the demonstration that high-level areas show mirror similarity and view selectivity at the same time. Second, our study clearly shows mirror confusion in high-level visual areas but not in the EVC or OFA. Third, our study is the first human fMRI study to report similarity in neural representations for mirror-symmetric face views, which has been previously shown only in single-unit recording studies (Perrett et al., 1985, 1991; Logothetis and Sheinberg, 1996; Freiwald and Tsao, 2010). In particular, a recent fMRI-guided single-cell recording study that examined view selectivity in face-selective patches of the macaque found selectivity for one preferred view in the posterior face patches and mirror-symmetric representation in an anterior face patch (Freiwald and Tsao, 2010). Noteworthy is that the results in the STS might seem at odds with an established view that this region represents changeable aspects of faces such as eye gaze and facial expression (Haxby et al., 2000). Although gaze processing is not likely to include a mirror-symmetric property, the processing of facial expression may be mirror symmetric. Moreover, as we elaborate further, we believe that the mirror-symmetric representation is a property of general object processing mechanisms and not a face-specific effect. That is, a basic principle of the cerebral cortex in general and the visual cortex in particular is that the same region may contain multiple representations (e.g., eccentricity, retinotopic, specialization). Thus, the STS may include a number of different representations for different aspects of face/object processing; some are mirror symmetric but others are view selective.
Alternative explanations that may account for the similar multivoxel pattern observed for the two profiles may include the more similar shape and size of the two profiles relative to the half-profile and front view or similar eye-movement patterns to profiles relative to the other views. However, these factors were controlled in Experiment 2, which replicated the mirror-symmetric tuning seen in Experiment 1 and therefore support our conclusion that the mirror-symmetric tuning reflects similar representations for the mirror-symmetric views.
Finally, although our study presented only face stimuli, the mirror-symmetric representation that we found in the LO object area suggests that our findings may be applicable to object view processing in the visual system in general, rather than reflecting a face-selective effect. Indeed, mirror-confusion patterns were previously shown for non-face stimuli in electrophysiological studies with monkeys (Logothetis et al., 1995; Rollenhagen and Olson, 2000; Baylis and Driver, 2001) as well as the human fMRI studies discussed above (Eger et al., 2004; Dehaene et al., 2010; Dilks et al., 2011; Pegado et al., 2011). Future studies using a similar methodology as we used here with non-face stimuli are needed to corroborate and extend our findings to other object categories.
Dissociation between occipital and temporal face-selective areas
The current study showed that the representation of face view in the OFA differs from that of the FFA and STS in two ways. First, the classification rate in the OFA was higher than that in the FFA and STS. Second, the FFA and STS, but not the OFA, showed mirror-symmetric representation. These findings are consistent with those of Freiwald and Tsao (2010), which revealed view selectivity to specific head views in posterior face patches and mirror-symmetric tuning in a more anterior face patch, as well as with the general view that the representation of faces and objects becomes gradually more invariant along the posterior-anterior axis (Rolls, 2000; DiCarlo and Cox, 2007). Despite a considerable number of studies examining the representation of faces in the OFA and FFA, there is only sparse evidence for dissociations between them. In particular, Rotshtein et al. (2005) demonstrated that the FFA was sensitive to identity rather than low-level image properties, whereas the OFA was sensitive to low-level image properties rather than identity. Liu et al. (2010) showed that the OFA is sensitive to facial features (Pitcher et al., 2007), whereas the FFA is sensitive to its first-order configuration. Our findings add to these studies and support the idea that the OFA is engaged in low-level representation of facial information, whereas the mid-temporal face areas generate a more invariant high-level representation (Haxby et al., 2000). Our findings are also in line with predictions postulated by the classical model of Bruce and Young (1986) that early stages of face processing are view selective and add to that a partial invariant mirror-symmetric representation as an intermediate stage.
Conclusions
The current fMRI study demonstrates that, in line with observations from single-unit recording studies in monkeys, the visual system shows both view-selective and view-invariant representations. In particular, we reveal view-selective representation in low-level visual areas as well as evidence for partial invariance for mirror-symmetric face views in the mid-temporal cortex. To obtain the complete hierarchical processing of face view in the visual cortex, future fMRI studies will assess whether the anterior temporal area shows a full invariant representation of face identity, as was recently reported in single-unit recordings in macaque monkeys (Freiwald and Tsao, 2010; Eifuku et al., 2011). Finally, although our study involved only faces, these findings may reflect general principles of object view processing in the visual system, as we report similar mirror confusion patterns in the face-selective and object-selective areas.
Footnotes
V.A. was supported by a fellowship from the Levie-Edersheim-Gitter Institute.
We thank Boaz Sadeh for help with data acquisition. We thank Rafi Malach, Chris Baker, Andrey Zhdanov, Jonathan Rosenblath, and Boaz Sadeh for helpful discussions. We would also like to thank the members of the pyMVPA community (http://www.pymvpa.org/) for helpful advice and fruitful discussions on pattern classification.
References
- Andresen DR, Vinberg J, Grill-Spector K. The representation of object viewpoint in human visual cortex. Neuroimage. 2009;45:522–536. doi: 10.1016/j.neuroimage.2008.11.009. [DOI] [PMC free article] [PubMed] [Google Scholar]
- Andrews TJ, Ewbank MP. Distinct representations for facial identity and changeable aspects of faces in the human temporal lobe. Neuroimage. 2004;23:905–913. doi: 10.1016/j.neuroimage.2004.07.060. [DOI] [PubMed] [Google Scholar]
- Baylis GC, Driver J. Shape-coding in IT cells generalizes over contrast and mirror reversal, but not figure-ground reversal. Nat Neurosci. 2001;4:937–942. doi: 10.1038/nn0901-937. [DOI] [PubMed] [Google Scholar]
- Biederman I. Recognition-by-components: a theory of human image understanding. Psychol Rev. 1987;94:115–147. doi: 10.1037/0033-295X.94.2.115. [DOI] [PubMed] [Google Scholar]
- Biederman I, Rabinowitz JC, Glass AL, Stacy EW., Jr On the information extracted from a glance at a scene. J Exp Psychol. 1974;103:597–600. doi: 10.1037/h0037158. [DOI] [PubMed] [Google Scholar]
- Brainard DH. The psychophysics toolbox. Spat Vis. 1997;10:433–436. [PubMed] [Google Scholar]
- Brett M, Anton J, Valabregue R, Poline J. Region of interest analysis using an SPM toolbox. Neuroimage. 2002;16:1140–1141. [Google Scholar]
- Bruce V, Young A. Understanding face recognition. Br J Psychol. 1986;77:305–327. doi: 10.1111/j.2044-8295.1986.tb02199.x. [DOI] [PubMed] [Google Scholar]
- Bülthoff HH, Edelman S. Psychophysical support for a two-dimensional view interpolation theory of object recognition. Proc Natl Acad Sci U S A. 1992;89:60–64. doi: 10.1073/pnas.89.1.60. [DOI] [PMC free article] [PubMed] [Google Scholar]
- Cichy RM, Chen Y, Haynes JD. Encoding the identity and location of objects in human LOC. Neuroimage. 2011;54:2297–2307. doi: 10.1016/j.neuroimage.2010.09.044. [DOI] [PubMed] [Google Scholar]
- Davidoff J, Warrington EK. A particular difficulty in discriminating between mirror images. Neuropsychologia. 2001;39:1022–1036. doi: 10.1016/s0028-3932(01)00039-2. [DOI] [PubMed] [Google Scholar]
- Dehaene S, Nakamura K, Jobert A, Kuroki C, Ogawa S, Cohen L. Why do children make mirror errors in reading? Neural correlates of mirror invariance in the visual word form area. Neuroimage. 2010;49:1837–1848. doi: 10.1016/j.neuroimage.2009.09.024. [DOI] [PubMed] [Google Scholar]
- DiCarlo JJ, Cox DD. Untangling invariant object recognition. Trends Cogn Sci. 2007;11:333–341. doi: 10.1016/j.tics.2007.06.010. [DOI] [PubMed] [Google Scholar]
- Dilks DD, Julian JB, Kubilius J, Spelke ES, Kanwisher N. Mirror-Image sensitivity and invariance in object and scene processing pathways. J Neurosci. 2011;31:11305–11312. doi: 10.1523/JNEUROSCI.1935-11.2011. [DOI] [PMC free article] [PubMed] [Google Scholar]
- Eger E, Henson RN, Driver J, Dolan RJ. BOLD repetition decreases in object-responsive ventral visual areas depend on spatial attention. J Neurophysiol. 2004;92:1241–1247. doi: 10.1152/jn.00206.2004. [DOI] [PubMed] [Google Scholar]
- Eger E, Schweinberger SR, Dolan RJ, Henson RN. Familiarity enhances invariance of face representations in human ventral visual cortex: fMRI evidence. Neuroimage. 2005;26:1128–1139. doi: 10.1016/j.neuroimage.2005.03.010. [DOI] [PubMed] [Google Scholar]
- Eger E, Ashburner J, Haynes JD, Dolan RJ, Rees G. fMRI activity patterns in human LOC carry information about object exemplars within category. J Cogn Neurosci. 2008;20:356–370. doi: 10.1162/jocn.2008.20019. [DOI] [PMC free article] [PubMed] [Google Scholar]
- Eifuku S, De Souza WC, Nakata R, Ono T, Tamura R. Neural representations of personally familiar and unfamiliar faces in the anterior inferior temporal cortex of monkeys. PLoS One. 2011;6:e18913. doi: 10.1371/journal.pone.0018913. [DOI] [PMC free article] [PubMed] [Google Scholar]
- Ewbank MP, Andrews TJ. Differential sensitivity for viewpoint between familiar and unfamiliar faces in human visual cortex. Neuroimage. 2008;40:1857–1870. doi: 10.1016/j.neuroimage.2008.01.049. [DOI] [PubMed] [Google Scholar]
- Fang F, He S. Viewer-centered object representation in the human visual system revealed by viewpoint aftereffects. Neuron. 2005;45:793–800. doi: 10.1016/j.neuron.2005.01.037. [DOI] [PubMed] [Google Scholar]
- Fang F, Murray SO, He S. Duration-dependent fMRI adaptation and distributed viewer-centered face representation in human visual cortex. Cereb Cortex. 2007;17:1402–1411. doi: 10.1093/cercor/bhl053. [DOI] [PubMed] [Google Scholar]
- Freiwald WA, Tsao DY. Functional compartmentalization and viewpoint generalization within the macaque face-processing system. Science. 2010;330:845–851. doi: 10.1126/science.1194908. [DOI] [PMC free article] [PubMed] [Google Scholar]
- Freiwald WA, Tsao DY, Livingstone MS. A face feature space in the macaque temporal lobe. Nat Neurosci. 2009;12:1187–1196. doi: 10.1038/nn.2363. [DOI] [PMC free article] [PubMed] [Google Scholar]
- Gauthier I, Hayward WG, Tarr MJ, Anderson AW, Skudlarski P, Gore JC. BOLD activity during mental rotation and viewpoint-dependent object recognition. Neuron. 2002;34:161–171. doi: 10.1016/s0896-6273(02)00622-0. [DOI] [PubMed] [Google Scholar]
- Grill-Spector K, Malach R. The human visual cortex. Annu Rev Neurosci. 2004;27:649–677. doi: 10.1146/annurev.neuro.27.070203.144220. [DOI] [PubMed] [Google Scholar]
- Grill-Spector K, Kushnir T, Edelman S, Avidan G, Itzchak Y, Malach R. Differential processing of objects under various viewing conditions in the human lateral occipital complex. Neuron. 1999;24:187–203. doi: 10.1016/s0896-6273(00)80832-6. [DOI] [PubMed] [Google Scholar]
- Hastie T, Tibshirani R, Friedman J. The elements of statistical learning: data mining, inference, and prediction. Ed 2. New York: Springer; 2009. [Google Scholar]
- Haxby JV, Hoffman EA, Gobbini MI. The distributed human neural system for face perception. Trends Cogn Sci. 2000;4:223–233. doi: 10.1016/s1364-6613(00)01482-0. [DOI] [PubMed] [Google Scholar]
- Hill H, Bruce V. Effects of lighting on the perception of facial surfaces. J Exp Psychol Hum Percept Perform. 1996;22:986–1004. doi: 10.1037//0096-1523.22.4.986. [DOI] [PubMed] [Google Scholar]
- James TW, Humphrey GK, Gati JS, Menon RS, Goodale MA. Differential effects of viewpoint on object-driven activation in dorsal and ventral streams. Neuron. 2002;35:793–801. doi: 10.1016/s0896-6273(02)00803-6. [DOI] [PubMed] [Google Scholar]
- Kim JG, Biederman I, Lescroart MD, Hayworth KJ. Adaptation to objects in the lateral occipital complex (LOC): shape or semantics? Vision Res. 2009;49:2297–2305. doi: 10.1016/j.visres.2009.06.020. [DOI] [PubMed] [Google Scholar]
- Kriegeskorte N, Bandettini P. Analyzing for information, not activation, to exploit high-resolution fMRI. Neuroimage. 2007;38:649–662. doi: 10.1016/j.neuroimage.2007.02.022. [DOI] [PMC free article] [PubMed] [Google Scholar]
- Liu J, Harris A, Kanwisher N. Perception of face parts and face configurations: an fMRI study. J Cogn Neurosci. 2010;22:203–211. doi: 10.1162/jocn.2009.21203. [DOI] [PMC free article] [PubMed] [Google Scholar]
- Logothetis NK, Sheinberg DL. Visual object recognition. Annu Rev Neurosci. 1996;19:577–621. doi: 10.1146/annurev.ne.19.030196.003045. [DOI] [PubMed] [Google Scholar]
- Logothetis NK, Pauls J, Poggio T. Shape representation in the inferior temporal cortex of monkeys. Curr Biol. 1995;5:552–563. doi: 10.1016/s0960-9822(95)00108-4. [DOI] [PubMed] [Google Scholar]
- Mach E. The analysis of sensation and the relation of the physical to the psychical. In: Waterlow S, editor. Chicago: Open Court; 1914. [Google Scholar]
- Marr D. Vision. San Francisco: Freeman; 1982. [Google Scholar]
- Meyer K, Kaplan JT, Essex R, Webber C, Damasio H, Damasio A. Predicting visual stimuli on the basis of activity in auditory cortices. Nat Neurosci. 2010;13:667–668. doi: 10.1038/nn.2533. [DOI] [PubMed] [Google Scholar]
- Misaki M, Kim Y, Bandettini PA, Kriegeskorte N. Comparison of multivariate classifiers and response normalizations for pattern-information fMRI. Neuroimage. 2010;53:103–118. doi: 10.1016/j.neuroimage.2010.05.051. [DOI] [PMC free article] [PubMed] [Google Scholar]
- Mur M, Ruff DA, Bodurka J, Bandettini PA, Kriegeskorte N. Face-identity change activation outside the face system: “release from adaptation” may not always indicate neuronal selectivity. Cereb Cortex. 2010;20:2027–2042. doi: 10.1093/cercor/bhp272. [DOI] [PMC free article] [PubMed] [Google Scholar]
- Natu VS, Jiang F, Narvekar A, Keshvari S, Blanz V, O'Toole AJ. Dissociable neural patterns of facial identity across changes in viewpoint. J Cogn Neurosci. 2010;22:1570–1582. doi: 10.1162/jocn.2009.21312. [DOI] [PubMed] [Google Scholar]
- Nickerson RS, Adams MJ. Long-term-memory for a common object. Cogn Psychol. 1979;11:287–307. [Google Scholar]
- Norman KA, Polyn SM, Detre GJ, Haxby JV. Beyond mind-reading: multi-voxel pattern analysis of fMRI data. Trends Cogn Sci. 2006;10:424–430. doi: 10.1016/j.tics.2006.07.005. [DOI] [PubMed] [Google Scholar]
- Park S, Brady TF, Greene MR, Oliva A. Disentangling scene content from spatial boundary: complementary roles for the parahippocampal place area and lateral occipital complex in representing real-world scenes. J Neurosci. 2011;31:1333–1340. doi: 10.1523/JNEUROSCI.3885-10.2011. [DOI] [PMC free article] [PubMed] [Google Scholar]
- Pegado F, Nakamura K, Cohen L, Dehaene S. Breaking the symmetry: mirror discrimination for single letters but not for pictures in the visual word form area. Neuroimage. 2011;55:742–749. doi: 10.1016/j.neuroimage.2010.11.043. [DOI] [PubMed] [Google Scholar]
- Perrett DI, Smith PA, Potter DD, Mistlin AJ, Head AS, Milner AD, Jeeves MA. Visual cells in the temporal cortex sensitive to face view and gaze direction. Proc R Soc Lond B Biol Sci. 1985;223:293–317. doi: 10.1098/rspb.1985.0003. [DOI] [PubMed] [Google Scholar]
- Perrett DI, Oram MW, Harries MH, Bevan R, Hietanen JK, Benson PJ, Thomas S. Viewer-centered and object-centered coding of heads in the macaque temporal cortex. Exp Brain Res. 1991;86:159–173. doi: 10.1007/BF00231050. [DOI] [PubMed] [Google Scholar]
- Pitcher D, Walsh V, Yovel G, Duchaine B. TMS evidence for the involvement of the right occipital face area in early face processing. Curr Biol. 2007;17:1568–1573. doi: 10.1016/j.cub.2007.07.063. [DOI] [PubMed] [Google Scholar]
- Pourtois G, Schwartz S, Seghier ML, Lazeyras F, Vuilleumier P. View-independent coding of face identity in frontal and temporal cortices is modulated by familiarity: an event-related fMI study. Neuroimage. 2005;24:1214–1224. doi: 10.1016/j.neuroimage.2004.10.038. [DOI] [PubMed] [Google Scholar]
- Rollenhagen JE, Olson CR. Mirror-image confusion in single neurons of the macaque inferotemporal cortex. Science. 2000;287:1506–1508. doi: 10.1126/science.287.5457.1506. [DOI] [PubMed] [Google Scholar]
- Rolls ET. Functions of the primate temporal lobe cortical visual areas in invariant visual object and face recognition. Neuron. 2000;27:205–218. doi: 10.1016/s0896-6273(00)00030-1. [DOI] [PubMed] [Google Scholar]
- Rotshtein P, Henson RN, Treves A, Driver J, Dolan RJ. Morphing Marilyn into Maggie dissociates physical and identity face representations in the brain. Nat Neurosci. 2005;8:107–113. doi: 10.1038/nn1370. [DOI] [PubMed] [Google Scholar]
- Said CP, Moore CD, Engell AD, Todorov A, Haxby JV. Distributed representations of dynamic facial expressions in the superior temporal sulcus. J Vis. 2010;10:11. doi: 10.1167/10.5.11. [DOI] [PMC free article] [PubMed] [Google Scholar]
- Schwarzlose RF, Swisher JD, Dang S, Kanwisher N. The distribution of category and location information across object-selective regions in human visual cortex. Proc Natl Acad Sci U S A. 2008;105:4447–4452. doi: 10.1073/pnas.0800431105. [DOI] [PMC free article] [PubMed] [Google Scholar]
- Serences JT, Saproo S, Scolari M, Ho T, Muftuler LT. Estimating the influence of attention on population codes in human visual cortex using voxel-based tuning functions. Neuroimage. 2009;44:223–231. doi: 10.1016/j.neuroimage.2008.07.043. [DOI] [PubMed] [Google Scholar]
- Sutherland NS. Visual discrimination of orientation by octopus: mirror images. Br J Psychol. 1960;51:9–18. doi: 10.1111/j.2044-8295.1960.tb00719.x. [DOI] [PubMed] [Google Scholar]
- Tarr MJ. Rotating objects to recognize them: a case study on the role of viewpoint dependency in the recognition of three-dimensional objects. Psychon Bull Rev. 1995;2:55–82. doi: 10.3758/BF03214412. [DOI] [PubMed] [Google Scholar]
- Taylor JC, Wiggett AJ, Downing PE. fMRI-adaptation studies of viewpoint tuning in the extrastriate and fusiform body areas. J Neurophysiol. 2010;103:1467–1477. doi: 10.1152/jn.00637.2009. [DOI] [PubMed] [Google Scholar]
- Thorpe S, Fize D, Marlot C. Speed of processing in the human visual system. Nature. 1996;381:520–522. doi: 10.1038/381520a0. [DOI] [PubMed] [Google Scholar]
- Vuilleumier P, Henson RN, Driver J, Dolan RJ. Multiple levels of visual object constancy revealed by event-related fMRI of repetition priming. Nat Neurosci. 2002;5:491–499. doi: 10.1038/nn839. [DOI] [PubMed] [Google Scholar]
- Walther DB, Caddigan E, Fei-Fei L, Beck DM. Natural scene categories revealed in distributed patterns of activity in the human brain. J Neurosci. 2009;29:10573–10581. doi: 10.1523/JNEUROSCI.0559-09.2009. [DOI] [PMC free article] [PubMed] [Google Scholar]
- Wang G, Tanaka K, Tanifuji M. Optical imaging of functional organization in the monkey inferotemporal cortex. Science. 1996;272:1665–1668. doi: 10.1126/science.272.5268.1665. [DOI] [PubMed] [Google Scholar]
- Xu X, Yue X, Lescroart MD, Biederman I, Kim JG. Adaptation in the fusiform face area (FFA): image or person? Vision Res. 2009;49:2800–2807. doi: 10.1016/j.visres.2009.08.021. [DOI] [PubMed] [Google Scholar]
- Yue X, Cassidy BS, Devaney KJ, Holt DJ, Tootell RB. Lower-level stimulus features strongly influence responses in the fusiform face area. Cereb Cortex. 2011;21:35–47. doi: 10.1093/cercor/bhq050. [DOI] [PMC free article] [PubMed] [Google Scholar]