Abstract
Spike-timing variability has a large effect on neural information processing. However, for many systems little is known about the noise sources causing the spike-response variability. Here we investigate potential sources of spike-response variability in auditory receptor neurons of locusts, a classic insect model system. At low-spike frequencies, our data show negative interspike-interval (ISI) correlations and ISI distributions that match the inverse Gaussian distribution. These findings can be explained by a white-noise source that interacts with an adaptation current. At higher spike frequencies, more strongly peaked distributions and positive ISI correlations appear, as expected from a canonical model of suprathreshold firing driven by temporally correlated (i.e., colored) noise. Simulations of a minimal conductance-based model of the auditory receptor neuron with stochastic ion channels exclude the delayed rectifier as a possible noise source. Our analysis suggests channel noise from an adaptation current and the receptor or sodium current as main sources for the colored and white noise, respectively. By comparing the ISI statistics with generic models, we find strong evidence for two distinct noise sources. Our approach does not involve any dendritic or somatic recordings that may harm the delicate workings of many sensory systems. It could be applied to various other types of neurons, in which channel noise dominates the fluctuations that shape the neuron's spike statistics.
Introduction
In many sensory systems, neuronal responses vary significantly when the same stimulus is presented repeatedly (de Ruyter van Steveninck et al., 1997; Kreiman et al., 2000; Ronacher et al., 2004). This response variability has a profound impact on sensory signal processing (Kara et al., 2000; Vogel et al., 2005) and limits the reliability of behavioral responses to external stimuli (Tolhurst et al., 1983; Britten et al., 1996). Noise sources at all levels of neuronal pathways cause this variability (Faisal et al., 2008), e.g., external noise that is amplified during the transduction process (Grewe et al., 2003), synaptic noise resulting from the bombardment of myriads of synapses (Calvin and Stevens, 1967), or noise caused by the stochastic gating of ion channels (“channel noise”) (Neher and Stevens, 1977; White et al., 2000).
The statistics of channel noise depends on the gating dynamics of the ion channels. In particular, slow stochastic adaptation currents generate colored noise with a correlation time scale set by the adaptation time constant (Schwalger et al., 2010). In contrast, fast spike-generating currents lead to approximately white noise. These different time scales have distinct effects on the spiking statistics (Lindner, 2004; Schwalger et al., 2010) as quantified by the distribution and serial correlations of interspike intervals (ISI). Conversely, the ISI statistics points to a certain time scale of the noise and may enable one to identify the dominating noise source for a given cell. This is particularly interesting for sensory neurons where action potentials can be recorded far away from the delicate transduction machinery without damaging it.
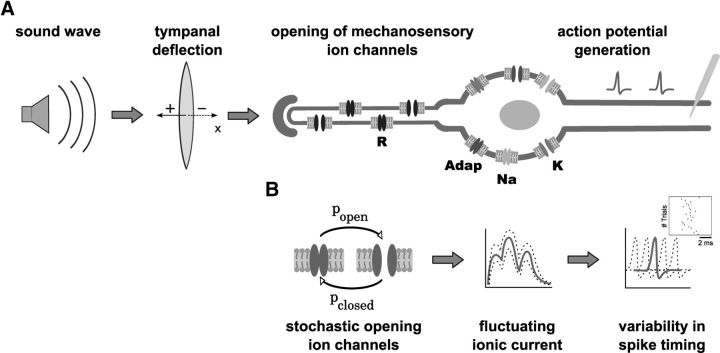
Here we investigate spike-timing variability and potential noise sources in a key insect model system—locust auditory receptor neurons. Although these neurons respond quite variable to pure tones with constant amplitude (Schaette et al., 2005), they transmit dynamical stimuli remarkably well (Machens et al., 2001, 2005) based on precise spike timing (Rokem et al., 2006). Locust auditory receptor cells are bipolar neurons that are directly attached to the tympanal membrane (Gray, 1960) (see Fig. 1). The underlying mechanosensory transduction process is well understood in terms of a cascade of linear filters and static nonlinearities (Gollisch et al., 2002; Gollisch and Herz, 2005). Furthermore, these neurons exhibit spike-frequency adaptation (Römer, 1976; Gollisch and Herz, 2004).
Figure 1.
Auditory signal processing in the tympanal organ of locusts. A, Schematic drawing of the auditory transduction cascade of L. migratoria. Tympanal deflections induced by sound waves cause mechanosensory ion channels in the membrane of auditory receptor neurons to open and close. The resulting ionic current activates voltage-dependent ion channels that trigger action potentials. R, mechanosensory receptor channels; Adap, ion channels mediating spike-frequency adaptation; Na, sodium channels; K, delayed-rectifier potassium channels. B, According to our hypothesis, the ISI variability originates from channel noise. Stochastic opening and closing of ion channels causes ionic current fluctuations that result in spike-timing variability.
To uncover basic properties of the primary noise sources, we first quantify the variability of ISIs by analyzing their statistics during acoustic stimulation with pure tones and compare the results with predictions from canonical models of suprathreshold, i.e., limit-cycle firing. Second, we investigate the distinct effects of channel noise from different ionic currents on the ISI statistics in simulations of conductance-based models of the locust auditory neuron to test the results from the ISI analysis and to study potential biophysical mechanisms. A model variant with both a stochastic adaptation current and a stochastic sodium or receptor current reproduces our experimental findings. Combining experimental data, theory, and simulations enables us to distinguish slow from fast noise solely from the ISI statistics and to put forward strong hypotheses on the noise sources.
Materials and Methods
Electrophysiology
Intracellular recordings were performed from axons of auditory receptor neurons of adult Locusta migratoria (seven males and five females). All experiments were performed at room temperature (22−24°C). After decapitation and removal of legs and wings, the abdomen's tip was cut to extract the gut. The ventral side of the animal was then glued to an animal holder using sticking wax. The upper part of the metathorax was removed and the torso was filled with locust saline (Pearson and Robertson, 1981). After exposing the metathoracic ganglion and the auditory nerve, the nerve was fixed with a custom-made forceps. The recordings were performed from the proximal fibers in the auditory nerve. We used standard glass microelectrodes (borosilicate; 1.5 mm outer diameter; World Precision Instruments and GB150F-8P, Science Products) pulled to a resistance of 30–80 Ω (Model P-97; Sutter Instrument Company) and filled with a 1 m KCL solution. The signals from the auditory receptor cells were amplified (BRAMP-01 or SEC-05LX; npi electronic) and recorded by a data acquisition board (PCI-6229; National Instruments) with a sampling rate of 20 kHz. For on-line spike detection, data analysis, and the generation of acoustic stimuli we used the open-source software RELACS (www.relacs.net) running on a Debian Linux computer. Acoustic stimuli transmitted by the acquisition board (sampling rate: 120 or 240 kHz) were sent to a custom-made attenuator (ATN-01M; npi electronic) based on the Chrystal CS3310 attenuator chip (Cirrus Logic) for adjusting the sound intensity, amplified (RKB-250; Rotel), and then forwarded to two loudspeakers (DSM 25 FFL-8; Visaton). The loudspeakers were positioned orthogonal to the locust body axis at a distance of 25 cm from the animal. For calibrating the sound intensity we used a 1/2 inch microphone (40AC on a 26AM preamplifier; G.R.A.S.) on a constant voltage amplifier (12AK; G.R.A.S.). To reduce echoes, the experimental setup was lined with sound-attenuating foam.
Stimuli
For acoustic stimulation, pure tones of different but constant sound intensities (measured in dB sound pressure level; SPL) were presented ipsilaterally to the recorded auditory neuron. The sound frequency was set to the characteristic frequency of the recorded receptor neuron (2–17 kHz, in most cases 4 kHz). All stimuli started and ended with a 2 ms ramp. Short stimuli of 500 ms duration separated by gaps of 1 s were used for most of the analysis. Long stimulus durations of 1 min were used to measure ISI correlations at spike frequencies <50 Hz.
Data analysis
For the data analysis, we used N = 12 recordings of auditory receptor cells of different animals with stimulus durations of 500 ms (recording duration > 20 min, 30–300 trials per sound intensity) and N = 14 recordings of different animals with stimulus durations of 1 min. Due to the firing rate transients induced by spike-frequency adaptation we disregarded the first 200 ms of each trial of 500 ms duration and the first 10 s of each trial evoked by a 1 min pure tone stimulus. Especially at higher sound intensities the data in the remaining analysis windows were not perfectly stationary. We therefore recomputed the ISI statistics after cutting the analysis time window in three. Except for minor quantitative differences this did not change our results so that we report only values based on the full analysis windows. Data analysis was performed with C++ programs, using the numerics library of RELACS (www.relacs.net).
ISI variability was quantified by both the coefficient of variation and the quantity D = 〈ΔT2〉/(2〈T〉3) where 〈T〉 is the mean and 〈ΔT2〉 = 〈T2〉 − 〈T〉2 the variance of the ISIs. D corresponds to the diffusion coefficient of the spike count of the ISI shuffled spike train and will be referred to as the “diffusion coefficient”. For a perfect integrate-and-fire (PIF) model driven by white noise, D is proportional to the noise intensity of the driving fluctuations, i.e., to the input noise intensity (Vilela and Lindner, 2009).
We also computed ISI histograms and compared them with probability density functions of simple noise-driven neuron models. The ISI density of a PIF model with white noise driving is given by the following:
 |
with a mean ISI 〈T〉 (Gerstein and Mandelbrot, 1964). This probability density also approximates well the ISI density of a PIF neuron with an adaptation current and additive white Gaussian noise of intensity D (Schwalger et al., 2010).
In contrast, an approximation of the ISI density of an adapting PIF neuron with a stochastic adaptation current and no white noise driving is given by a probability density resulting from a PIF neuron driven by long-correlated colored noise (Ornstein–Uhlenbeck noise; Lindner, 2004) as follows:
 |
with γ1(T) = T/τ+e−T/τ − 1, γ2(T) = 1 − e−T/τ and correlation time τ. The parameter ε = σ2/μ2 is the variance of the noise rescaled by the square of the mean current μ of the PIF model. The squared coefficient of variation of the density equation (2) is given by the following:
 |
with δ = 〈T〉/τ. Given the mean and variance of the ISIs, we can eliminate ε via Equation 3 (the quadratic equation has only one positive solution in ε) and then fit pcn(T) to the ISI histograms by a least-square fit of the unknown correlation time constant τ using a simplex algorithm.
To quantify the shape of the ISI densities we used two measures introduced by Schwalger et al. (2010): rescaled versions of the skewness γs = 〈(T − 〈T〉)3〉/〈ΔT2〉3/2 and kurtosis γe = 〈(T − 〈T〉)4〉/〈ΔT2〉2 − 3. The rescaled measures are given by the following:
 |
 |
and are identical to unity for the inverse Gaussian ISI density (Eq. 1). Values considerably larger than one indicate that the density is more skewed and peaked compared with pwn(T), which is the case for the colored noise distribution pcn unless τ ≪ 〈T〉.
We quantified the correlations among succeeding ISIs by the serial correlation coefficient
 |
For the analysis of the spike train responses evoked by short acoustical stimuli of 500 ms, we calculated ρ1 by averaging over all pairs of successive ISIs from all trials, because the number of ISIs within each trial was too small to obtain unbiased estimates for the correlation of each trial separately. For the 1 min stimuli, we divided each trial in sections of 300 ISIs for which we calculated the correlation coefficient according to Equation 6 separately and then averaged over all sections of all trials.
To test the significance of negative serial correlations we determined the distribution of correlations occurring by chance after shuffling the ISIs of each spike train section 2000 times. The measured serial correlation was considered significant if the integral over the shuffled distribution up to this value was smaller than 0.05 (see Fig. 6B).
Figure 6.
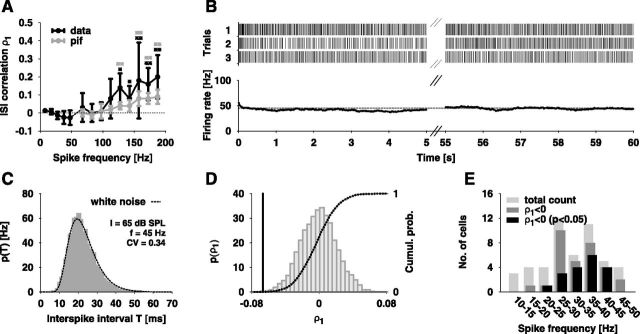
Correlations between successive ISIs. A, Measured serial correlation coefficient ρ1 ± SD (black lines) as a function of spike frequency f. The coefficients for f ≤ 50 Hz are averages from 14 cells (stimulus duration 1 min) while those for f > 50 Hz are averages from 12 cells (stimulus duration 500 ms). The gray line shows the ISI correlations arising solely from the slight decrease of the spike frequency during the stimulus as computed from a PIF model (see text for details). The black asterisks label the data points, which are significantly different from zero (Sign test, **p < 0.01, *p < 0.05). The gray asterisks indicate the data points for which the ISI correlations of the experimental data and of the PIF model are significantly different (Wilcoxon test, **p < 0.01). B, Top, Spike trains recorded intracellularly during stimulation with a 1 min pure tone of 65 dB SPL and 6 kHz. Bottom, The mean firing rate (average number of spikes per 500 ms time window) stays constant over time. C, Comparison of the white noise distribution pwn (dashed line; Eq. 1) with the ISI histogram (gray boxes) obtained from the data shown in B. D, The distribution of ISI correlations after shuffling ISIs (bars), the corresponding cumulative histogram (dashed line) and the measured ρ1 (solid line) for the data shown in B. E, Number of cells with and without significantly negative ρ1 (p < 0.05) as a function of spike frequency.
Model of the auditory receptors
A schematic drawing of a locust auditory receptor neuron is given in Figure 1A. Deflections of the tympanal membrane induced by a sound stimulus cause mechanosensory ion channels to open. The resulting ionic currents activate voltage-dependent ion channels triggering action potentials as well as additional currents mediating spike-frequency adaptation. We separated these processes in two parts: (1) the spike generator with spike-frequency adaptation and (2) the mechanosensory transduction cascade from the sound input to the activation of the mechanosensory currents driving the spike generator.
Spike generator with spike-frequency adaptation.
For the simulation of the membrane potential dynamics and the generation of action potentials, we used the single-compartment conductance-based Traub–Miles model (Traub and Miles, 1991) modified by Ermentrout (1998). This model includes an M-type current, i.e., a slow voltage-dependent potassium channel, mediating spike-frequency adaptation. We have chosen this model of mammalian hippocampal pyramidal cells for its well known type-I dynamics. Details of the ion-channel kinetics that might be different in the grasshopper do not matter for our study, since we use this model only for a qualitative but not quantitative exploration of the effects of ion-channel noise.
The membrane potential V (in millivolts) is described by the following:
 |
where Cm = 1 μF/cm2 and IR is the driving current passing through the mechanosensory channels of an auditory receptor neuron (in μA/cm2). The deterministic ionic currents are given by the following equations (Ermentrout, 1998):
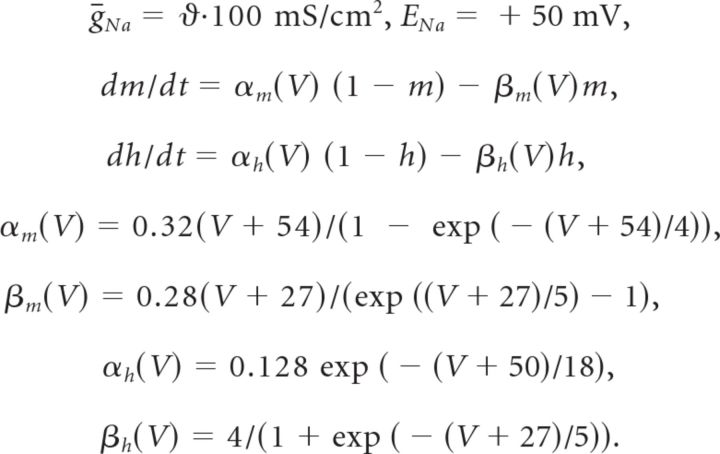 |
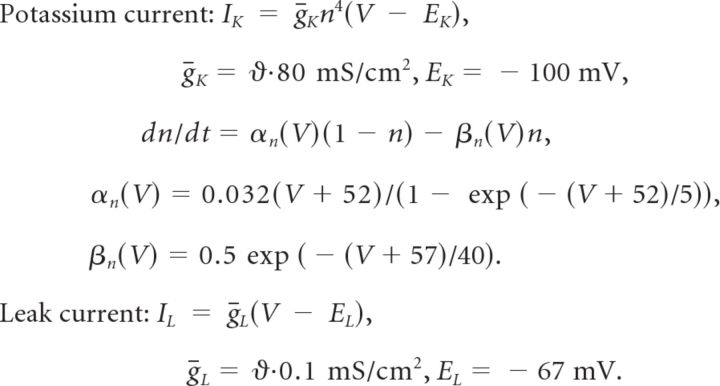 |
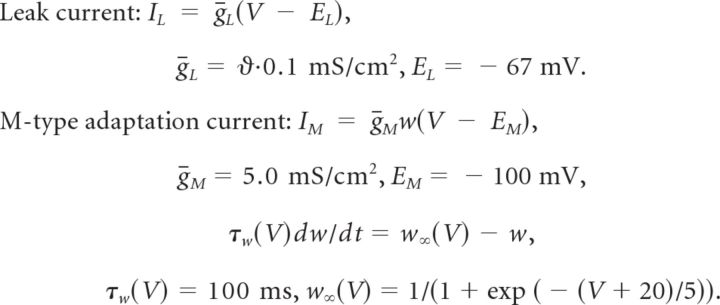 |
In this parametrization the M-type current is mainly activated during action potentials. Subthreshold activated adaptation currents will not change the following results, because we consider exclusively the suprathreshold firing regime far beyond the bifurcation from quiescence to tonic firing (Schwalger et al., 2010).
In the above equations, all numerical values corresponding to voltages and to rate constants are given in millivolts and kilohertz, respectively. To yield a membrane time constant in the submillisecond range (Gollisch and Herz, 2005), the sodium, potassium, and leak conductances were multiplied by ϑ = 20. The membrane time constant for the model using ḡL = 2 mS/cm2 is τm = Cm/ḡL = 0.5 ms. The driving current IR described below was chosen to result in a steady-state firing rate in its saturation level of 180 Hz which is ∼150 Hz smaller than the onset-state firing rate (Benda et al., 2001; Fig. 2B).
Figure 2.
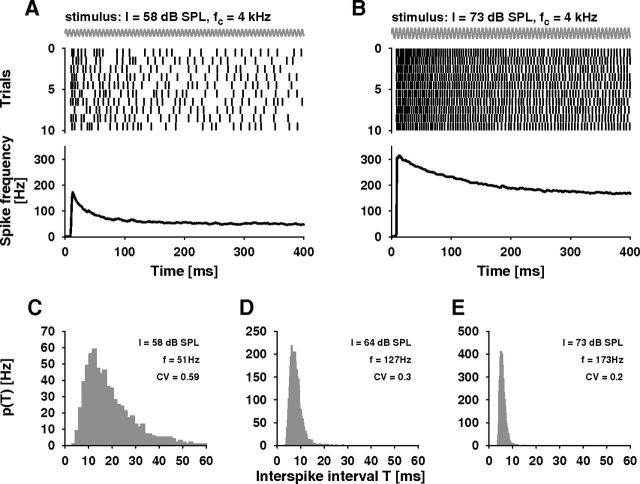
ISI variability in auditory receptor neurons. A, B, Ten spike trains of an auditory receptor neuron evoked by stimulation with a 4 kHz pure tone (the cell's best frequency, schematically drawn as a slow sine wave) of 58 dB SPL (A) and 70 dB SPL (B), respectively (top). The ISIs within and across trials show high variability. The frequency of neural discharges depends on sound intensity and shows spike-frequency adaptation (bottom), data from 131 (A) and 206 (B) trials, respectively. C–E, ISI histograms of the same cell obtained for three different sound intensities I. The histograms in C and E were computed from the spike trains shown in A and B, respectively, discarding the first 200 ms as transients. The ISI variability decreases with increasing spike frequency f.
Model of the mechanosensory transduction process.
The activating input signal for the mechanosensory transduction process was a pure tone sound pressure wave s(t) of amplitude A and frequency fs: s(t) = A sin(2πfst). The sound frequency was set to fs = 4 kHz, a typical characteristic frequency of low-frequency receptors of locusts (Michelsen, 1971). The amplitude A can be calculated from the sound intensity I (in dB SPL) by A = 20 μPa · 10I/20. The amplitude of the tympanal deflection depends linearly on the sound pressure for pure tones (Michelsen and Rohrseitz, 1995). Thus, the tympanal vibration is proportional to the sound pressure wave: x(t) = c̃·s(t).
For simulations and estimations of the magnitude of thermal noise arising from the eardrum we also explicitly modeled the tympanum filter. We approximated the tympanum as a damped harmonic oscillator that is driven by sound pressure stimuli s(t) plus additive thermal noise
 |
where x(t) is the deflection of the tympanum, ω0 = 2πfs the Eigenfrequency, m is the mass, and B is the area of the oscillating element. B scales sound pressure into a force driving the oscillator. Despite the periodic driving we assume that dissipation (friction) and fluctuations (noise) are connected via the Einstein relation
where kBT = 4.1 · 10−21 kg m2/s2 at 20°C is the thermal energy. Dividing Equation 8 by m and re-expressing the damping coefficient γ = 2m/τd in terms of the damping time constant τd (≈100 μs; Schiolten et al., 1981; Gollisch and Herz, 2005) results in the following:
 |
with α = B/m. Stroboscopic measurements estimate the amplitude of the tympanum deflection evoked by a 100 dB SPL tone at 3 kHz to be approximately x̄ = 16 μm (Breckow and Sippel, 1985). This can be used to estimate α to be ∼3000 m2/kg using the gain of the oscillator, , at its resonance frequency. The variance of the tympanum deflections caused by the signal (〈xsignal2〉 = x̄2/2) divided by the variance 〈xnoise2〉 caused by the thermal noise is then
 |
With the smallest sound intensities used in our experiments of I = 30 dB SPL, corresponding to A = 632 μPa, and a variation of the unknown effective area B between the whole tympanum's size (Btym ≈ 1 mm2) and a small fraction of this value (Btym/100), we obtain signal-to-noise ratios between 400 and 4, respectively. Put differently, for plausible values of the effective area, the signal-to-noise ratio is at least half an order of magnitude larger than one. Higher sound intensities add for every 20 dB another factor of 100. For the simulations we varied Dtymp and used for Equation 13 below c = 25 μm−1 and x0 = 0.12 μm.
The cilia of the locust auditory receptor neurons are connected to the tympanum via attachment cells (Gray, 1960). Gollisch and Herz (2005) have shown that the transmitted signal during the transduction process between the mechanical vibration of the eardrum and the accumulation of electrical charge at the receptor cells' membrane undergoes a squaring. Moreover, the spike frequency of spike train responses saturates at stimulus intensities ∼20 dB above threshold intensity (Römer, 1976). This saturation is caused by the saturation of the mechano-electrical transduction process (Wolf and Benda, personal communication).
For a minimal model consistent with this information, we assumed two populations of ion channels in the membrane of the mechanosensory receptor neurons that open either for positive or negative deflections of the eardrum and whose open probabilities follow a Boltzmann distribution. The sum of the two Boltzmann functions of both receptor channel populations comprises, thus, both the quadratic nonlinearity at low and medium sound intensities and saturation of firing rates:
where po+(x) and po−(x) are the open probabilities for positive and negative tympanal displacements, respectively. Assuming the channel gating acting as a spring following Hooke's law, the open probabilities are given by the following:
 |
with the single channel-gating force c indicating the channel's sensitivity to the tympanal deflections and x0 being the displacement for which the channel open probability is 0.5 (Howard and Hudspeth, 1988; Hudspeth et al., 2000). The parameters c̃, c, and x0 influence both the dynamic range of the auditory receptor neuron model and the minimal open probability at the tympanal resting position. We chose c̃c = 0.00025 μPa−1 and x0/c̃ = 12000 μPa so that the resulting f-I curves are comparable to the ones observed for locust auditory receptor cells in particular with a dynamic range that is ∼20 dB wide and with a peak of the diffusion coefficient D in the lower dynamic range (Fig. 3).
Figure 3.
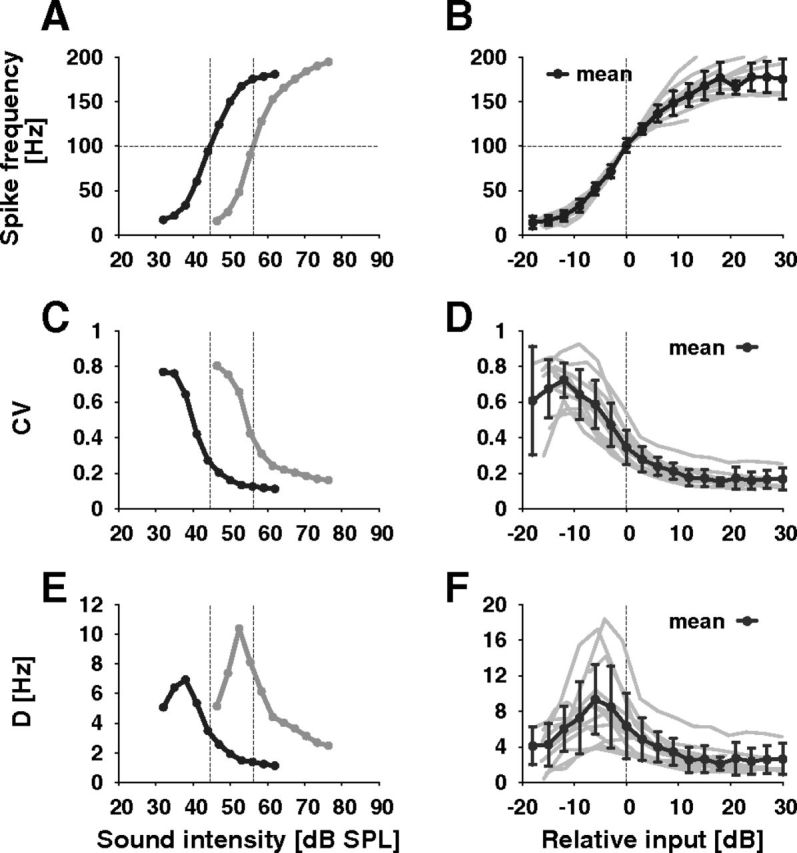
Response characteristics of auditory receptor neurons. A, The rate-level functions (steady-state f-I curve) of two different auditory receptor neurons have a similar sigmoidal shape, but differ in their sensitivity. B, Rate-level functions of 12 different cells (gray lines) including the ones shown in A shifted along the intensity axis such that they align at a spike frequency of 100 Hz. The black line is the average ± SD over all cells, as also in D and F. C, Coefficient of variation (CV) as a function of sound intensity for the two cells shown in A and D, aligned for 12 neurons (as in B). The CVs tend to decrease over the cell's dynamic range. E, The diffusion coefficient D (see Materials and Methods, Data analysis) as a function of sound intensity for the two cells shown in A and F, aligned (as in B). The curves show a pronounced peak in the lower part of the cells' dynamic range.
In the models with deterministic receptor current mediated by an infinite population of receptor channels (NR → ∞), the dynamics of the open probability of the two kinds of channels (+ or −) is given by the following:
 |
with the receptor channel time constant τr = 0.1 ms. For smaller values of τr the generated action potentials lock on the carrier sound wave, a behavior that has not been observed experimentally, and larger values are not supported by the time scale of ∼0.1 ms of the second linear filter of the locust auditory transduction cascade (Gollisch and Herz, 2005). The mean number of open receptor channels corresponds to No = NR p+ + NR p− with NR being the total number of channels of both receptor channel populations. Note that in this study the total number of simulated receptor channels is always given as the sum of channel numbers of both channel populations and both populations have the same number of channels. The receptor current IR passing a fraction of open channels W = No/NR is determined by the following:
where ER = 0 mV is the reversal potential of the receptor current and ḡR = 0.6 mS/cm2 its maximal conductivity. The latter was chosen to ensure an f-I curve sufficiently close to the experimental data.
In the stochastic models, the receptor channel gating was simulated using Gillespie's algorithm (see Simulation of stochastic opening ion channels). The transition rates αr and βr defined in the Markov scheme (17) below are given by the following:
 |
For the deterministic models, the current passing the receptor channels is given by the fraction of open channels W as defined in Equation 15.
Kinetic schemes for the stochastic ion channel models.
To describe spike generation, we used different stochastic models. In the first class of model, one type of ion channel was simulated as a finite population of N independent channels mediating a stochastic current while the other channel types corresponded to infinite channel populations mediating deterministic ionic currents. The second class of stochastic model only differed in that we assumed a mixture of two finite channel populations instead of only one.
Stochastic ion channels can be modeled as Markov processes (Neher and Stevens, 1977). Assuming that the channels carrying the receptor current are ion channels consisting of the two states “closed” and “open”, this elementary kinetic scheme can be written as follows:
 |
where αr and βr define the rates (transition probability per unit time) from r0 to r1 and vice versa, respectively. According to the Markov assumption the steady-state channel open probability depends only on the state in which the system is and can thus be defined by p∞ = αr/(αr + βr). The time required to perform a state transition is τr = 1/(αr + βr).
Assuming a Markov process for the potassium channel composed of four identical gates ni with an opening transition rate αn and a closing transition rate of βn, the potassium channel kinetic scheme is
 |
where n4 corresponds to the open state where all four channel gates are open (Neher and Stevens, 1977).
The Markov kinetic scheme for a sodium channel with three activating gates mi and one inactivating gate h is expressed by the following:
 |
where m3h1 defines the open state where the three activating gates m and the one inactivating gate h are open (Neher and Stevens, 1977).
For the channels carrying the adaptation current we assumed (as for the receptor channels) a simple two state channel model:
 |
where αw(V) = w∞(V)/τw(V) and βw(V) = (1 − w∞(V))/τw(V) are the transition rates between the closed state w0 and the open state w1.
Simulation of stochastic opening ion channels.
The gating of the stochastic opening channels was simulated using Gillespie's stochastic integration algorithm modified for multiple ion channel populations and channels with multiple states (Gillespie, 1976; Gibson and Bruck, 2000). The algorithm calculates the time interval until the next state transition, determines the reaction type, i.e., which one of the possible state transitions occurs, and updates the number of channels in each possible state accordingly. As the maximum time step we used 1 μs and integrated all deterministic differential equations of the model with a forward Euler step.
Results
To study the underlying noise source from the ISI statistics we stimulated locust auditory receptor neurons with many repetitions of 500 ms pure tones of constant intensity. Such stimuli evoked a spike response, which adapted over time (Römer, 1976; Benda et al., 2001; Fig. 2A,B, bottom). The initial high spike frequency directly after the onset of the acoustic stimulus declined over a duration of several tens to hundred milliseconds to its steady-state value. A sufficiently long interval of silence between the successive acoustic stimuli assured that the cell completely recovered from adaptation.
The steady-state spike frequency computed from the final 300 ms of the response increased in a sigmoidal fashion with sound intensity and saturated at frequencies of ∼160–200 Hz (Fig. 3A,B). Although the sensitivity, i.e., the minimum sound intensity required to evoke a response, varied considerably between the receptor neurons, the overall shape of the f-I curves (steady-state spike frequency vs sound intensity) was very similar (Fig. 3B).
Spike trains evoked by the tones with constant sound intensity showed notable spike-time variability (Schaette et al., 2005) (Fig. 2A,B, top) that was most prominent at low spike frequencies (Fig. 2A, top). The corresponding ISI histograms were broad at low sound intensities (i.e., low spike frequencies) and got much narrower at higher spike frequencies (Fig. 2C–E).
To quantify the dependence of the ISI variability on sound intensity we computed both the coefficient of variation, CV, as well as the diffusion coefficient, D. The CVs started out with values up to 0.9 for sound intensities at the lower end of the dynamic range (Fig. 3C,D) where spike frequencies are <50 Hz (compare Fig. 3B). With increasing sound intensity the CVs monotonically decreased and saturated at low values of ∼0.1–0.2. The maximum in the CV-versus-relative sound intensity curves visible in a few cells and in the average of 12 cells is not significant (note the large error bars) because of the low number of available ISIs at these low spike frequencies. The diffusion coefficient, D, in contrast, showed a pronounced peak at the lower end of the receptor cells' dynamic range (Fig. 3E,F). The peak height of D varied from cell to cell (Mean: 9.36 Hz ± 4.87 Hz SD) while the overall shape of D was rather similar (Fig. 3F).
ISI distributions
What is the origin of the spike-time variability? To answer this question we first compared the observed ISI statistics with canonical noise-driven neuron models.
Given the high firing rates and the nonexponential but still unimodal ISI distributions (Fig. 2C–E), the receptor neurons most likely operate in their suprathreshold periodic spiking regime. This regime is characterized by a limit cycle dynamics that is distorted by some noise. The canonical model for this regime is the PIF model. This is the simplest model capturing the essence of limit cycle dynamics to which all neurons and other models of neuronal spiking converge, provided constant input current and sufficiently weak additive noise. This model is thus in no way specific for the grasshopper auditory receptor neurons, but is rather the most generic possible model for suprathreshold periodic firing. With additive white-noise driving (a signal with equal spectral power at all frequencies) the resulting ISI distribution is described by an “inverse Gaussian” density pwn (Eq. 1) (Gerstein and Mandelbrot, 1964), in the following referred to as white-noise density. With additional slow adaptation this still holds true although the parameters of the white-noise density are rescaled (Schwalger et al., 2010). Thus, we expect the ISI density pwn to describe the measured ISI histograms, if the corresponding noise source is close to a white noise and if the noise is sufficiently weak.
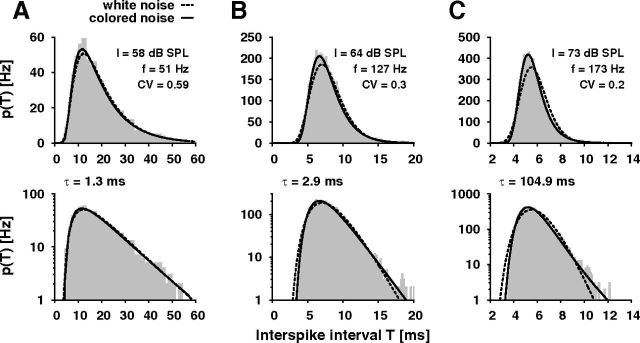
The white-noise ISI density Equation 1 is a function solely of the mean and the SD of the ISIs, which can be determined directly from the experimentally measured spike responses. The resulting white-noise ISI density pwn matches the ISI histograms of spike responses with low spike frequency (Fig. 4A, dashed line). However, for increasing spike frequencies, pwn no longer provides a good description of the data (Fig. 4B,C, dashed line). The ISI histograms of the auditory receptor cells exhibit a more prominent peak and a heavier tail compared with pwn.
Figure 4.
Comparison of ISI histograms with colored- and white-noise ISI distributions. ISI histograms (gray bars) computed from a recording of one auditory receptor neuron during stimulation with three different sound intensities I (A–C) in comparison with the white-noise ISI density pwn (dashed black line; Eq. 1) and the colored-noise ISI distribution pcn (solid black line; Eq. 2). τ is the correlation time of the colored noise resulting from the fit of the colored-noise ISI distribution to the data. f, spike frequency; CV, coefficient of variation. The bottom row shows the same histograms on a logarithmic scale to emphasize the tails of the distributions. Note that the axes have different scales in A, B, and C.
Replacing the additive white noise of the PIF model by a colored noise, in particular an Ornstein–Uhlenbeck noise, results in the colored-noise ISI density pcn (Eq. 2) (Lindner, 2004). In contrast to pwn, the shape of pcn depends on one free parameter, the correlation time constant τ of the colored noise. Fitting pcn to the ISI histograms of the recorded data, the resulting colored-noise ISI distributions describe the data remarkably well at both low and high spike frequencies, although there is only one fit parameter, i.e., τ (Fig. 4, solid line). In the upper range of spike frequencies τ converges to the adaptation time constant, which is in the range of 100 ms in the locust auditory system (Figs. 4C, 5A). For lower spike frequencies τ vanishes (Figs. 4A, 5A), so that the colored-noise ISI density in fact approaches the white-noise ISI density (Lindner, 2004). The D values of the Kolmogorov–Smirnov (K-S) test (Fig. 5B) also show that for spike-frequencies below ∼60 Hz pwn describes the data as well as pcn. At higher spike frequencies, however, the description of the data by pwn becomes worse and pcn is significantly better (Wilcoxon test, p < 0.05).
Figure 5.
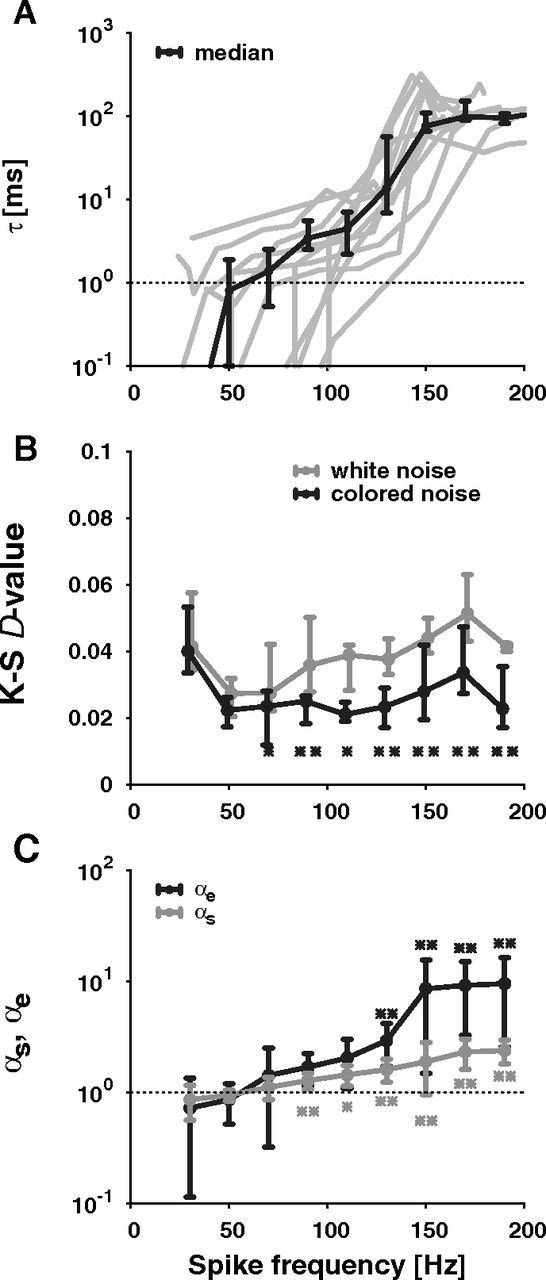
Parameter quantifying the shape of ISI histograms. Shown are data pooled from 12 auditory receptor cells as a function of spike frequency (stimulus duration: 500 ms) A, Correlation time constants τ determined by fitting the colored-noise ISI density equation (2) to the data for each of the 12 recorded receptor neurons (gray lines) and the overall mean ± SE (black line). B, The goodness of the fits quantified by the D values of K-S tests, i.e., the maximum difference between the cumulative distribution of the ISIs and the cumulative distributions of the colored-noise (black line; Eq. 2) or white-noise ISI densities (gray line; Eq. 1), respectively (median quartiles). The asterisks mark spike-frequency bins where the K-S D values of the colored-noise densities are significantly lower than the K-S D values of the white noise densities (Wilcoxon test, **p < 0.01, *p < 0.05). C, The mean ± SD of the rescaled skewness (αs, gray line; Eq. 4) and kurtosis (αe, black line; Eq. 5) of the ISI histograms indicating the heaviness of the tail and the peakedness. The asterisks label the data points (αs, gray stars; αe, black stars), which are significantly different from unity (Sign test, **p < 0.01, *p < 0.05).
Following Schwalger et al. (2010), we further quantified the transition from a white-noise ISI distribution to a colored-noise ISI distribution with non-zero correlation time by computing rescaled variants of the skewness (αs, Eq. 4) and kurtosis (αe, Eq. 5). These quantities equal unity for an inverse Gaussian distribution. Values greater than one indicate a more skewed distribution with a stronger peak and a heavier tail as is the case for the colored-noise ISI distribution. Indeed, at low spike frequencies, both αs and αe are close to one in agreement with a dominating white-noise source (Fig. 5C). With increasing spike frequency both αs and αe monotonically increase to values larger than one further supporting our observation of a transition from an inverse Gaussian to the more peaked colored-noise distribution arising from a dominating colored-noise source.
The shapes of the ISI histograms thus suggest the presence of two different types of noise sources in the auditory receptor neurons of locusts: a white-noise source dominating at low spike frequencies and a colored-noise source, the effect of which is more prominent at higher spike frequencies.
ISI correlations
Since the receptor neurons exhibit spike-frequency adaptation, we further investigated correlations between successive ISIs that may have resulted from the interaction of the noise with the adaptation dynamics. In particular, we expect negative correlations for a deterministic adaptation process interacting with a spike generator driven by a white-noise input (Chacron et al., 2001; Liu and Wang, 2001; Schwalger et al., 2010) and positive correlations for a stochastic adaptation process interacting with a deterministic spike generator (Schwalger et al., 2010).
For spike frequencies above ∼50 Hz we found positive correlations between successive ISIs that tend to increase with increasing spike frequency (Fig. 6A, black line). The serial correlation coefficients at lag 1, ρ1, were obtained from the responses to the 500 ms stimuli as used before for investigating the ISI distributions. Especially at higher spike frequencies the responses are not stationary (Fig. 2B). Over the time of the stimulus the mean spike frequency slowly declines. This nonstationarity introduces positive serial correlations that may obscure correlations arising from a potential colored-noise source. We therefore computed the ISI correlations of a PIF model without spike-frequency adaptation with the time course of the input current adjusted such that the resulting time course of the mean spike frequency matches the experimentally measured one and an additive white-noise that ensured the same CV of the ISIs as observed in the experimental data. The resulting ISI correlations (Fig. 6A, gray line) are significantly lower than those obtained from the data. Thus the observed positive ISI correlations are likely to arise in part from a colored-noise source and not solely from the slow decline of the spike frequency.
For measuring the ISI correlations at lower spike frequencies we used acoustic stimuli of 1 min duration to obtain sufficiently large ISI statistics (≥300 ISIs per trial). At low sound intensities the mean firing rate remained constant for the whole stimulus duration after an initial transient of a few hundred milliseconds (Fig. 6B), which we discarded for the computation of correlations. Thus, the resulting ISI correlations are not obscured by slow changes of the mean spike frequency. Furthermore, the ISI histograms obtained from the spike responses to these long stimuli (Fig. 6C) are also well described by the white noise ISI density pwn (Eq. 1).
Using the long stimuli we indeed found slightly negative ISI correlations (Fig. 6A). We tested the significance of these correlations by first calculating the distribution of serial correlation coefficients occurring by chance after shuffling the ISIs of each spike train of a given sound intensity (Fig. 6D, gray bars). The correlation coefficient of the non-shuffled data (Fig. 6D, solid line) was considered as significantly negative if the integral over the shuffled distribution (cumulative histogram, Fig. 6D, dashed line) up to this value was smaller than 0.05. At spike frequencies in the range of 20–45 Hz most responses indeed showed significant negative ISI correlations (Fig. 6E).
The results on ISI correlations exactly match the expectations based on the ISI distributions we measured. At low spike frequencies a white-noise source shapes the ISI distribution and results in interaction with an adaptation process in negative ISI correlations. With increasing spike frequency we observe a transition to a regime that is dominated by colored noise with the respective ISI distributions and the corresponding positive ISI correlations. This suggests that the dominating biophysical mechanisms generating the intrinsic noise change with increasing spike frequency.
Modeling
To uncover potential biophysical mechanisms causing the observed ISI variability we used a model of the locust auditory receptor neuron and compared the ISI statistics resulting from various possible noise sources with the experimentally measured data. In the model (Fig. 1A; see Methods for a detailed description), sound waves cause vibrations of the tympanal membrane. As a result mechanosensory ion channels in the membrane of auditory receptor neurons open and close and thereby transform the mechanical vibrations into electrical currents. The resulting change of the receptor cell's membrane potential activates voltage-dependent ion channels that finally trigger action potentials.
Locust auditory receptor cells differ in their sensitivity from cell to cell but have comparable variability measures, CV and D, as a function of spike frequency (Fig. 3). This excludes extrinsic noise and tympanal noise (see also below) as possible noise sources. Furthermore, synaptic noise can be ruled out because locust auditory receptors are bipolar neurons that are directly attached to the eardrum (Gray, 1960) and generate action potentials without intermediate synapses. Thermal noise due to the membrane resistance was shown to have only a minor importance in neurons compared with other noise origins (see below). Therefore, we expect that intrinsic noise caused by the random gating of ion channels is the main source of noise (Fig. 1B). Especially for small channel populations fluctuations between open and closed states of single ion channels give rise to fluctuations of the ionic currents mediated by the channel population and cause membrane potential fluctuations as well as variability in spike timing.
For a minimal single-compartment conductance-based model of the locust auditory receptor neuron four different types of ionic currents need to be included: (1) the mechanosensory receptor current transducing the sound wave into an electrical signal, the (2) sodium and (3) delayed-rectifier potassium current for action potential generation, and (4) an adaptation current mediating spike-frequency adaptation. In the following simulations we explicitly model the stochastic channel dynamics of each of these currents and investigate whether the resulting stochasticity of the ionic currents might explain the experimentally measured ISI statistics.
Single current stochasticity
In a first set of simulations we studied the effects of ion-channel stochasticity for each of the involved ionic currents individually. That is, in each of the simulations either (1) the receptor current, IR; (2) the M-type adaptation current, IM; or the voltage-dependent (3) sodium, INa, or (4) potassium current, IK, was modeled as a stochastic current resulting from a finite population of ion channels, while all other ionic currents were modeled as deterministic currents corresponding to an infinite population of ion channels. For each case we varied the number of channels carrying the respective current and at the same time scaled the respective single-channel conductances inversely proportional to the number of channels. This resulted in approximately the same spike frequencies but different ISI variability as quantified by both the coefficient of variation, CV, and the diffusion coefficient, D.
All stochastic ionic currents resulted in a high CV for stimuli close to the firing threshold that declined with increasing sound intensity (data not shown). This finding is consistent with the observed statistics of the spike responses of the auditory receptor cells.
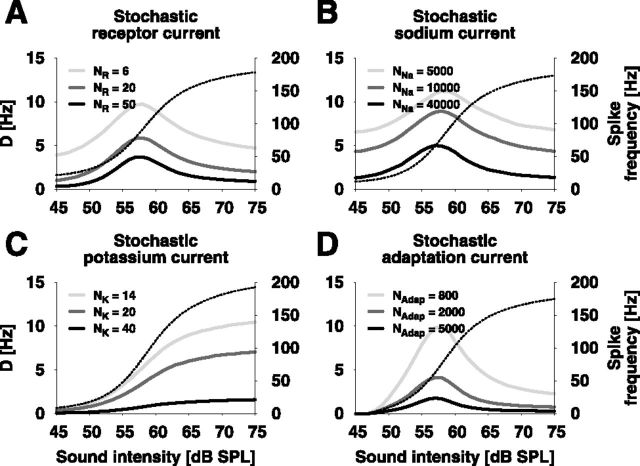
In contrast, D showed qualitative differences between the different stochastic ionic currents (Fig. 7). Stochastic receptor channels (Fig. 7A) generated a peak in D similar to the measured experimental data (Fig. 3E,F). The peak occurs at approximately the sound intensity inducing a tympanal displacement which causes an opening of the receptor channels with a mean probability of 0.5 (as defined by Eq. 12). For this open probability the variability of the ionic current and thus of the ISIs is maximal (Sigworth, 1980).
Figure 7.
Comparison of the ISI variability resulting from different channel-noise sources. A, Stochastic receptor current. B, Stochastic sodium current. C, Stochastic potassium current. D, Stochastic adaptation current. Shown is the diffusion coefficient D as a measure for the ISI variability computed from simulations of the auditory transduction cascade with different ionic currents modeled as populations of N stochastic ion channels. The right ordinate labels the corresponding mean spike frequency over sound intensity (dashed black line).
Voltage-gated sodium channels are responsible for action potential initiation. At membrane potentials close to the spike threshold, a random opening of channels can easily initiate an action potential (Schneidman et al., 1998). Similar to the model with stochastic receptor channels, sodium channel noise resulted in a peak of D in the lower dynamic range of the receptor's response (Fig. 7B).
A stochastic delayed-rectifier potassium current responsible for the termination of an action potential, however, resulted in a sigmoidal increase of D with increasing sound intensity (Fig. 7C). This phenomenon is not in agreement with the experimental data.
For modeling the adaptation current we used a population of voltage-gated M-type potassium channels. These channels are mainly activated during action potentials and slowly deactivate between them. Stochasticity of the adaptation channels again can reproduce the experimentally measured values of D with a peak in the lower dynamic range (Fig. 7D).
To distinguish between stochastic currents showing similar ISI variability we investigated the shapes of the ISI distributions as well as ISI correlations next. For the analysis of the ISI histogram shapes, we adjusted the size of the stochastic channel populations such that all simulations with the different stochastic ionic currents resulted in the same steady-state spike frequency as well as the same CV and D. Stochastic simulations of ionic currents with fast gating dynamics, i.e., sodium and receptor current, yielded ISI distributions that are well described by the white-noise density pwn (Eq. 1; Fig. 8A). Simulations with stochastic M-type adaptation currents, however, resulted in ISI distributions that are more peaked than pwn. These distributions can be well described by the colored-noise density pcn (Eq. 2) with a correlation time constant τ which is similar to the adaptation time constant (Fig. 8B).
Figure 8.
ISI distributions generated by fast and slow channel noise. The ISI distribution resulting from the model with (A) fast stochastic receptor channels (NR = 50, gray) and (B) fast stochastic sodium channels (NNa = 70000, gray) in comparison with the white-noise density (dashed line; Eq. 1). C, Simulation of slow stochastic adaptation channels (NAdap = 2000, gray) in comparison with white-noise (dashed line; Eq. 1) and colored-noise density (solid line; Eq. 2). In all simulations the steady-state spike frequency (f ≈ 100 Hz) and the coefficient of variation (CV ≈ 0.25), as well as the diffusion coefficient (D ≈ 3 Hz), was kept the same.
Serial correlations were determined from the ISIs of the simulations used for Figure 7. Both the fast stochastic receptor (Fig. 9A) and sodium currents (Fig. 9B) generated negative correlations at lag one. The negative correlations are strongest at spike frequencies of ∼20 Hz. In contrast, the slow stochastic adaptation current lead to positive correlation coefficients ρ1 that increased with higher spike frequencies (Fig. 9C).
Figure 9.
ISI correlations caused by fast and slow channel noise. The serial correlation coefficients resulting from the model with (A) fast stochastic receptor channels, (B) fast stochastic sodium channels, and (C) slow stochastic adaptation channels.
In addition to the various channel-noise sources, stochastic responses may result from thermal noise of the eardrum. We simulated such eardrum fluctuation using additive Gaussian white noise on the sound pressure wave. The white noise together with the signal is filtered by the tympanum that we modeled as a damped harmonic oscillator. Sufficiently large noise intensities can lead to ISI statistics that are comparable to those caused by the stochastic receptor or sodium current. However, at these noise intensities the resulting variance of the tympanum deflections is already three orders of magnitude higher than the variance caused by the sound wave. Using the Einstein relation and a minimal effective area of 1% of the total area of the tympanum leads to a rough estimate according to which the variance of the thermal noise is at least half an order of magnitude lower than the signal variance. We have checked that with this value, the effect of thermal noise on the ISI statistics is too small to explain the experimental data.
Mixed channel noise
The simulations of single-current noise showed that stochastic M-type adaptation currents can explain both the ISI distributions and positive correlations of the experimentally measured spike responses in the upper dynamic range. In contrast, stochastically gated sodium as well as receptor channels reproduced the ISI distributions in the lower dynamic range. In interaction with the deterministic adaptation current these two channel types also reproduced the observed negative correlations.
This suggests that at least two processes are needed to explain the experimental data: (1) a process generating fast current fluctuations, which dominate at low sound intensities, and (2) a slow adaptation process both for generating negative correlations in interaction with the fast noise and for generating slow current fluctuations, which dominate at high sound intensities. To test this hypothesis we simulated the model with a stochastic M-type adaptation current in combination with stochastic currents mediated by either voltage-dependent sodium or mechanosensory receptor channels.
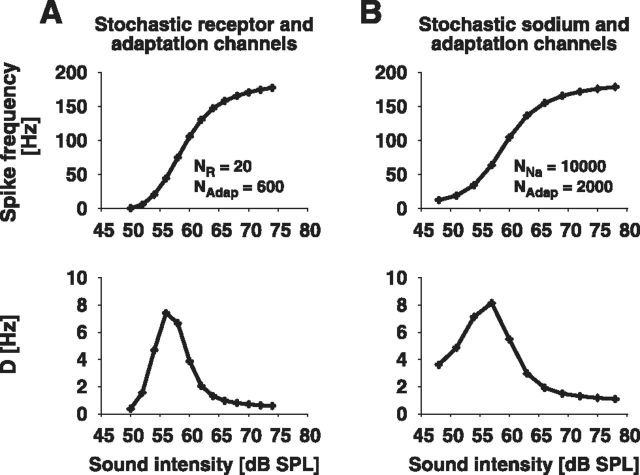
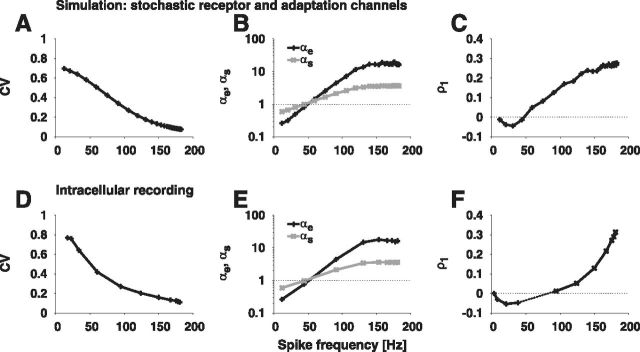
Both mixed-case models explained the ISI statistics of the auditory receptor cells' spike responses (Fig. 10). The ISI variability quantified by D showed a peak at the lower dynamic range of the receptor's response. The coefficient of variation revealed a high variability for low steady-state spike frequencies, which declined with increasing rate (Fig. 11A). In addition to the CV, both the rescaled skewness αs and kurtosis αe confirmed the transition from an inverse Gaussian to the more strongly peaked colored-noise distribution (Fig. 11B). For low spike frequencies, αs and αe took values close to one indicating a strong white-noise influence. With increasing spike frequency, αs and αe showed a monotonic rise to large values. This implies that the ISI density is more skewed and more peaked compared with an inverse Gaussian, which illustrates the prevalence of colored noise in this firing-rate regime. Furthermore, with increasing spike frequency, ISI correlations exhibited a transition from negative values resulting from predominant white noise driving interacting with the adaptation current to positive values indicating strong impact of colored noise (Fig. 11C).
Figure 10.
ISI statistics of the mixed stochastic-channel models. Shown are the spike frequency (top) and the diffusion coefficient D (bottom) as a function of sound intensity of the model with both stochastic adaptation channels and either (A) stochastic receptor channels or (B) stochastic sodium channels.
Figure 11.
Comparison of the model including stochastic receptor and adaptation channels with experimental data. Coefficient of variation (CV) (A, D), rescaled skewness (αs; Eq. 4) and kurtosis (αe; Eq. 5) (B, E), and serial correlation coefficient of lag 1 (ρ1; Eq. 6) (C, F) as a function of spike frequency. Note, that for most recordings the serial correlations saturate (compare Fig. 6A). For the simulation (top row) we used NR = 20 and NAdap = 600 receptor and adaptation channels, respectively. The data of the intracellular recording (bottom row) is from one cell of the data shown in Figures 3C,D, 5C, and 6A, except for the negative serial correlation coefficients in F that have been measured with 1 min long stimuli in a different cell.
Discussion
This study aims at characterizing intrinsic neuronal noise sources solely from the resulting ISI statistics. Our data from in vivo axonal recordings of locust auditory receptor neurons show that with increasing spike frequency the shape of the ISI histograms changes from an inverse Gaussian to a more peaked probability density with a heavier tail, whereas the corresponding ISI correlations go from negative to positive values.
In response to pure tones the auditory receptor neurons exhibit firing rates of up to a few hundred Hertz (Römer, 1976). Together with the nonexponential ISI distributions (Schaette et al., 2005) this strongly indicates that these neurons operate in the suprathreshold regime, i.e., far beyond a bifurcation from quiescence to tonic (repetitive) firing. The canonical model for such limit-cycle dynamics is the PIF model; to first approximation, any tonically firing, real or model, neuron can be described by this simple model. When driven by additive white Gaussian noise, the PIF's ISI distribution is given by an inverse Gaussian (Eq. 1) (Gerstein and Mandelbrot, 1964). Vice versa, observing an inverse-Gaussian ISI distribution of a periodically spiking neuron in the suprathreshold regime suggests that the dominating noise is Gaussian and effectively white, i.e., has a cutoff frequency much larger than the firing rate.
The locust's receptor neurons also show pronounced spike-frequency adaptation (Römer, 1976; Benda et al., 2001; Gollisch and Herz, 2004). Despite this additional slow dynamics the ISI density of a PIF neuron model with additive white noise can be approximated by an inverse Gaussian (Schwalger et al., 2010), but the ISI correlations become negative (Wang et al., 1998; Chacron et al., 2000; Liu and Wang, 2001; Benda et al., 2010; Schwalger et al., 2010)—a feature that is absent in a white noise-driven PIF model without adaptation. Negative ISI correlations have been reported for many different preparations (for review, see Farkhooi et al., 2009; Avila-Akerberg and Chacron, 2011), and have been suggested to play a role in reducing long-term variability (Ratnam and Nelson, 2000; Chacron et al., 2001, 2007).
At low spike frequencies our recorded ISI distributions agree with inverse Gaussians and ISI correlations were small but significantly negative. Both findings suggest that in this regime the dominating noise source generates white Gaussian noise that interacts with a deterministic adaptation dynamics.
Colored Gaussian noise like Ornstein–Uhlenbeck noise with sufficiently long correlation times results in different ISI statistics. The ISI distribution is more peaked and has longer tails compared with the inverse Gaussian and the noise correlations directly translate into positive correlations between successive ISIs (Lindner, 2004; Schwalger et al., 2010). Positive correlations have been observed in neural systems (Lowen and Teich, 1992; Gabbiani and Krapp, 2006), but the origin of the corresponding colored noise was unknown or hypothesized to be of synaptic origin (Chacron et al., 2001). Recently, Schwalger et al. (2010) demonstrated analytically that stochastic adaptation currents also generate Ornstein–Uhlenbeck noise with a correlation time proportional to the time constant of the adaptation dynamics.
The peaked shape of the ISI distribution as well as the positive ISI correlations observed at higher spike frequencies may thus be caused by a colored-noise source in the adaptation current. The additional match of the correlation time constant of the noise obtained from the ISI distributions (Fig. 5A) with the time constant of spike-frequency adaptation (Fig. 2A,B) supports this hypothesis.
Our simulations of conductance-based models further support our findings that a stochastic adaptation current together with fast channel noise indeed reproduces both the white-noise ISI distributions and negative ISI correlations at low spike frequencies and the transition to colored-noise ISI distributions and positive correlations at higher spike frequencies. The strength of positive ISI correlations and the deviations of the ISI density from an inverse Gaussian grow as the ratio between adaptation time scale and mean ISI becomes larger with increasing firing rate (Schwalger et al., 2010). Additionally, in our model the mean fraction of open adaptation channels increases with spike frequency from values close to zero to at most 10%, as measured in the simulations of the modified Traub–Miles model (Ermentrout, 1998). Because the SD of the fraction of open channels is zero when all channels are closed and monotonically rises until half of the channels are open (a state that is never reached here), the fluctuations of the adaptation current increase with spike frequency and so does the strength of the resulting colored noise. In marked contrast, the level of fluctuations for the fast noise sources saturates at large signal amplitude or high firing rates (simulation data not shown). We note that a stochastic adaptation current could also explain very similar data on CV and ISI correlations found in response to current pulse injections in a looming-sensitive neuron (Gabbiani and Krapp, 2006), in particular, the observed transition from negative ISI correlations at low rate and high CV to positive ISI correlations at high firing rate and low CV.
Which of the many potential adaptation mechanisms, such as M-type or AHP-type currents (Sah and Davies, 2000) or slow inactivation of the sodium current (French, 1987), is causing spike-frequency adaptation and the colored noise in the locust auditory receptor neuron is not known and cannot be deduced by our indirect methods that only use the ISI statistics. For simulations we took M-type currents as a prototypical adaptation mechanism, because in the suprathreshold regime, the exact origin of the mean adaptation effect and the adaptation noise does not matter as long as both are associated with the slow part of the adaptation dynamics (Benda and Herz, 2003; Schwalger et al., 2010).
What, however, is a possible source of the white noise? Excluding thermal noise due to the membrane resistance (Johnston noise; Manwani and Koch, 1999) or fluctuations of the eardrum (see Results) leaves channel noise resulting from random opening and closing of ion channels as the most likely candidate for the white noise (White et al., 2000). In our simulations channel noise originating from the delayed rectifier failed to reproduce the peak in D. However, stochastic receptor currents as well as stochastic sodium currents reproduced the experimental data. This agrees with other studies, which demonstrate the dominance of sodium-channel noise over potassium-channel noise in (1) shaping spike-timing variability (Chow and White, 1996; Schneidman et al., 1998), (2) placing limits on axon miniaturization (Faisal et al., 2005), or (3) driving slow membrane potential oscillations (Dorval and White, 2005).
Assuming that the white noise can be mainly attributed to stochastic receptor currents, the simulations allow one to estimate the numbers of ion channels of the receptor current from the ISI statistics. This will be a rough estimate because, for example, decreasing the number of receptor channels can be partially compensated by increasing the number of channels of the adaptation current without significantly changing the ISI statistics. Still, the number of receptor channels we used in the mixed-case model (NR = 20; Fig. 11) matches the reported order of magnitude of channel numbers of other mechanosensory transducer currents (Drosophila: N ≈ 20 per sensory neuron, Nadrowski et al., 2008; bullfrog: N = 85 ± 45 per hair bundle, Howard and Hudspeth, 1988).
Especially at higher firing rates the ISI variability is quite small in locust auditory receptor cells, both by relative (CV ≈ 0.1) and absolute measures ( < 1 ms). Such high spike-timing precision was also observed during natural (Ronacher et al., 2004, 2008) and dynamic stimulation and underlies their coding efficiency (Machens et al., 2001; Rokem et al., 2006). This and the small negative correlations at low spike frequencies explain the good performance of a renewal model in reproducing mean firing rate and spike count statistics in response to dynamic stimuli (Schaette et al., 2005) by using the regularizing effect of neural refractoriness (Berry and Meister, 1998).
Direct measurements of the current noise close to the site of receptor current and spike generation potentially damage the delicate sensory structures. In contrast, indirect methods that deduce properties of the transduction cascade from recordings of the auditory nerve that leave the ear intact allow one to precisely investigate functional aspects of sensory transduction and set detailed references for future invasive measurements. For example, using the iso-response method, Gollisch et al. (2002) and Gollisch and Herz (2005) have been able to characterize the auditory transduction cascade of locust auditory receptor neurons and to differentiate between input- and output-driven adaptation processes in these neurons (Gollisch and Herz, 2004).
Using auditory-nerve recordings, we measured ISI statistics far away from the site of spike generation. Using generic models we deduced from these data key properties of the underlying noise sources. This indirect approach for dissecting intrinsic noise sources can be generalized to other neurons as well as to the important case of external synaptic noise.
Footnotes
This work was supported by BMBF Bernstein Collaboration for Computational Neuroscience 01GQ0722 (K.F.) to A.V.M.H., the Bernstein Center for Computational Neuroscience Munich LMU 01GQ1004A (K.F.) to A.V.M.H., the BMBF Bernstein Center for Computational Neuroscience Berlin HU 01GQ1001A (B.L.), and the BMBF Bernstein Award Computational Neuroscience 01GQ0802 (J.B.).
References
- Avila-Akerberg O, Chacron MJ. Nonrenewal spike train statistics: causes and functional consequences on neural coding. Exp Brain Res. 2011;210:353–371. doi: 10.1007/s00221-011-2553-y. [DOI] [PMC free article] [PubMed] [Google Scholar]
- Benda J, Herz AV. A universal model for spike-frequency adaptation. Neural Comput. 2003;15:2523–2564. doi: 10.1162/089976603322385063. [DOI] [PubMed] [Google Scholar]
- Benda J, Bethge M, Hennig M, Pawelzik K, Herz A. Spike-frequency adaptation: phenomenological model and experimental tests. Neurocomput. 2001;38–40:105–110. [Google Scholar]
- Benda J, Maler L, Longtin A. Linear versus nonlinear signal transmission in neuron models with adaptation currents or dynamic thresholds. J Neurophysiol. 2010;104:2806–2820. doi: 10.1152/jn.00240.2010. [DOI] [PubMed] [Google Scholar]
- Berry MJ, 2nd, Meister M. Refractoriness and neural precision. J Neurosci. 1998;18:2200–2211. doi: 10.1523/JNEUROSCI.18-06-02200.1998. [DOI] [PMC free article] [PubMed] [Google Scholar]
- Breckow J, Sippel M. Mechanics of the transduction of sound in the tympanal organ of adults and larvae of locusts. J Comp Physiol A. 1985;157:619–629. doi: 10.1007/BF01351356. [DOI] [PubMed] [Google Scholar]
- Britten KH, Newsome WT, Shadlen MN, Celebrini S, Movshon JA. A relationship between behavioral choice and the visual responses of neurons in macaque MT. Vis Neurosci. 1996;13:87–100. doi: 10.1017/s095252380000715x. [DOI] [PubMed] [Google Scholar]
- Calvin WH, Stevens CF. Synaptic noise as a source of variability in the interval between action potentials. Science. 1967;155:842–844. doi: 10.1126/science.155.3764.842. [DOI] [PubMed] [Google Scholar]
- Chacron MJ, Longtin A, St-Hilaire M, Maler L. Suprathreshold stochastic firing dynamics with memory in P-type electroreceptors. Phys Rev Lett. 2000;85:1576–1579. doi: 10.1103/PhysRevLett.85.1576. [DOI] [PubMed] [Google Scholar]
- Chacron MJ, Longtin A, Maler L. Negative interspike interval correlations increase the neuronal capacity for encoding time-dependent stimuli. J Neurosci. 2001;21:5328–5343. doi: 10.1523/JNEUROSCI.21-14-05328.2001. [DOI] [PMC free article] [PubMed] [Google Scholar]
- Chacron MJ, Lindner B, Longtin A. Threshold fatigue and information transfer. J Comput Neurosci. 2007;23:301–311. doi: 10.1007/s10827-007-0033-y. [DOI] [PMC free article] [PubMed] [Google Scholar]
- Chow CC, White JA. Spontaneous action potentials due to channel fluctuations. Biophys J. 1996;71:3013–3021. doi: 10.1016/S0006-3495(96)79494-8. [DOI] [PMC free article] [PubMed] [Google Scholar]
- de Ruyter van Steveninck RR, Lewen GD, Strong SP, Koberle R, Bialek W. Reproducibility and variability in neural spike trains. Science. 1997;275:1805–1808. doi: 10.1126/science.275.5307.1805. [DOI] [PubMed] [Google Scholar]
- Dorval AD, Jr, White JA. Channel noise is essential for perithreshold oscillations in entorhinal stellate neurons. J Neurosci. 2005;25:10025–10028. doi: 10.1523/JNEUROSCI.3557-05.2005. [DOI] [PMC free article] [PubMed] [Google Scholar]
- Ermentrout B. Linearization of F-I curves by adaptation. Neural Comput. 1998;10:1721–1729. doi: 10.1162/089976698300017106. [DOI] [PubMed] [Google Scholar]
- Faisal AA, White JA, Laughlin SB. Ion-channel noise places limits on the miniaturization of the brain's wiring. Curr Biol. 2005;15:1143–1149. doi: 10.1016/j.cub.2005.05.056. [DOI] [PubMed] [Google Scholar]
- Faisal AA, Selen LP, Wolpert DM. Noise in the nervous system. Nat Rev Neurosci. 2008;9:292–303. doi: 10.1038/nrn2258. [DOI] [PMC free article] [PubMed] [Google Scholar]
- Farkhooi F, Strube-Bloss MF, Nawrot MP. Serial correlation in neural spike trains: experimental evidence, stochastic modeling, and single neuron variability. Phys Rev E Stat Nonlin Soft Matter Phys. 2009;79 doi: 10.1103/PhysRevE.79.021905. 021905. [DOI] [PubMed] [Google Scholar]
- French AS. Removal of rapid sensory adaptation from an insect mechanoreceptor neuron by oxidizing agents which affect sodium channel inactivation. J Comp Physiol A. 1987;161:275–282. doi: 10.1007/BF00615247. [DOI] [PubMed] [Google Scholar]
- Gabbiani F, Krapp HG. Spike-frequency adaptation and intrinsic properties of an identified, looming-sensitive neuron. J Neurophysiol. 2006;96:2951–2962. doi: 10.1152/jn.00075.2006. [DOI] [PMC free article] [PubMed] [Google Scholar]
- Gerstein GL, Mandelbrot B. Random walk models for the spike activity of a single neuron. Biophys J. 1964;4:41–68. doi: 10.1016/s0006-3495(64)86768-0. [DOI] [PMC free article] [PubMed] [Google Scholar]
- Gibson MA, Bruck J. Efficient exact stochastic simulation of chemical systems with many species and many channels. J Phys Chem A. 2000;104:1876–1889. [Google Scholar]
- Gillespie DT. A general method for numerically simulating the stochastic time evolution of coupled chemical reactions. J Comp Phys. 1976;22:403–434. [Google Scholar]
- Gollisch T, Herz AM. Disentangling sub-millisecond processes within an auditory transduction chain. PLoS Biol. 2005;3:e8. doi: 10.1371/journal.pbio.0030008. [DOI] [PMC free article] [PubMed] [Google Scholar]
- Gollisch T, Herz AV. Input-driven components of spike-frequency adaptation can be unmasked in vivo. J Neurosci. 2004;24:7435–7444. doi: 10.1523/JNEUROSCI.0398-04.2004. [DOI] [PMC free article] [PubMed] [Google Scholar]
- Gollisch T, Schütze H, Benda J, Herz AV. Energy integration describes sound-intensity coding in an insect auditory system. J Neurosci. 2002;22:10434–10448. doi: 10.1523/JNEUROSCI.22-23-10434.2002. [DOI] [PMC free article] [PubMed] [Google Scholar]
- Gray EG. The fine structure of the insect ear. Philos Trans R Soc Lond B Biol Sci. 1960;243:75–94. [Google Scholar]
- Grewe J, Kretzberg J, Warzecha AK, Egelhaaf M. Impact of photon noise on the reliability of a motion-sensitive neuron in the fly's visual system. J Neurosci. 2003;23:10776–10783. doi: 10.1523/JNEUROSCI.23-34-10776.2003. [DOI] [PMC free article] [PubMed] [Google Scholar]
- Howard J, Hudspeth AJ. Compliance of the hair bundle associated with gating of mechanoelectrical transduction channels in the bullfrog's saccular hair cell. Neuron. 1988;1:189–199. doi: 10.1016/0896-6273(88)90139-0. [DOI] [PubMed] [Google Scholar]
- Hudspeth AJ, Choe Y, Mehta AD, Martin P. Putting ion channels to work: mechanoelectrical transduction, adaptation, and amplification by hair cells. Proc Natl Acad Sci U S A. 2000;97:11765–11772. doi: 10.1073/pnas.97.22.11765. [DOI] [PMC free article] [PubMed] [Google Scholar]
- Kara P, Reinagel P, Reid RC. Low response variability in simultaneously recorded retinal, thalamic, and cortical neurons. Neuron. 2000;27:635–646. doi: 10.1016/s0896-6273(00)00072-6. [DOI] [PubMed] [Google Scholar]
- Kreiman G, Krahe R, Metzner W, Koch C, Gabbiani F. Robustness and variability of neuronal coding by amplitude-sensitive afferents in the weakly electric fish eigenmannia. J Neurophysiol. 2000;84:189–204. doi: 10.1152/jn.2000.84.1.189. [DOI] [PubMed] [Google Scholar]
- Lindner B. Interspike interval statistics of neurons driven by colored noise. Phys Rev E Stat Nonlin Soft Matter Phys. 2004;69 doi: 10.1103/PhysRevE.69.022901. 022901. [DOI] [PubMed] [Google Scholar]
- Liu YH, Wang XJ. Spike-frequency adaptation of a generalized leaky integrate-and-fire model neuron. J Comput Neurosci. 2001;10:25–45. doi: 10.1023/a:1008916026143. [DOI] [PubMed] [Google Scholar]
- Lowen SB, Teich MC. Auditory-nerve action potentials form a nonrenewal point process over short as well as long time scales. J Acoust Soc Am. 1992;92:803–806. doi: 10.1121/1.403950. [DOI] [PubMed] [Google Scholar]
- Machens CK, Stemmler MB, Prinz P, Krahe R, Ronacher B, Herz AV. Representation of acoustic communication signals by insect auditory receptor neurons. J Neurosci. 2001;21:3215–3227. doi: 10.1523/JNEUROSCI.21-09-03215.2001. [DOI] [PMC free article] [PubMed] [Google Scholar]
- Machens CK, Gollisch T, Kolesnikova O, Herz AV. Testing the efficiency of sensory coding with optimal stimulus ensembles. Neuron. 2005;47:447–456. doi: 10.1016/j.neuron.2005.06.015. [DOI] [PubMed] [Google Scholar]
- Manwani A, Koch C. Detecting and estimating signals in noisy cable structure. I: Neuronal noise sources. Neural Comput. 1999;11:1797–1829. doi: 10.1162/089976699300015972. [DOI] [PubMed] [Google Scholar]
- Michelsen A. The physiology of the locust ear. I. Frequency sensitivity of single cells in the isolated ear. J Comp Physiol A Neuroethol Sens Neural Behav Physiol. 1971;71:49–62. [Google Scholar]
- Michelsen A, Rohrseitz K. Directional sound processing and interaural sound transmission in a small and a large grasshopper. J Exp Biol. 1995;198:1817–1827. doi: 10.1242/jeb.198.9.1817. [DOI] [PubMed] [Google Scholar]
- Nadrowski B, Albert JT, Göpfert MC. Transducer-based force generation explains active process in Drosophila hearing. Curr Biol. 2008;18:1365–1372. doi: 10.1016/j.cub.2008.07.095. [DOI] [PubMed] [Google Scholar]
- Neher E, Stevens CF. Conductance fluctuations and ionic pores in membranes. Annu Rev Biophys Bioeng. 1977;6:345–381. doi: 10.1146/annurev.bb.06.060177.002021. [DOI] [PubMed] [Google Scholar]
- Pearson KG, Robertson RM. Interneurons coactivating hindleg flexor and extensor motoneurons in the locust. J Comp Physiol. 1981;144:391–400. [Google Scholar]
- Ratnam R, Nelson ME. Nonrenewal statistics of electrosensory afferent spike trains: implications for the detection of weak sensory signals. J Neurosci. 2000;20:6672–6683. doi: 10.1523/JNEUROSCI.20-17-06672.2000. [DOI] [PMC free article] [PubMed] [Google Scholar]
- Rokem A, Watzl S, Gollisch T, Stemmler M, Herz AV, Samengo I. Spike-timing precision underlies the coding efficiency of auditory receptor neurons. J Neurophysiol. 2006;95:2541–2552. doi: 10.1152/jn.00891.2005. [DOI] [PubMed] [Google Scholar]
- Römer H. Die Informationsverarbeitung tympanaler Rezeptorelemente von Locusta migratoria (Acrididae, Orthoptera) J Comp Physiol. 1976;109:101–122. [Google Scholar]
- Ronacher B, Franz A, Wohlgemuth S, Hennig RM. Variability of spike trains and the processing of temporal patterns of acoustic signals - problems, constraints, and solutions. J Comp Physiol A Neuroethol Sens Neural Behav Physiol. 2004;190:257–277. doi: 10.1007/s00359-004-0494-7. [DOI] [PubMed] [Google Scholar]
- Ronacher B, Wohlgemuth S, Vogel A, Krahe R. Discrimination of acoustic communication signals by grasshoppers (Chorthippus biguttulus): temporal resolution, temporal integration, and the impact of intrinsic noise. J Comp Psychol. 2008;122:252–263. doi: 10.1037/0735-7036.122.3.252. [DOI] [PubMed] [Google Scholar]
- Sah P, Davies P. Calcium-activated potassium currents in mammalian neurons. Clin Exp Pharmacol Physiol. 2000;27:657–663. doi: 10.1046/j.1440-1681.2000.03317.x. [DOI] [PubMed] [Google Scholar]
- Schaette R, Gollisch T, Herz AV. Spike-train variability of auditory neurons in vivo: dynamic responses follow predictions from constant stimuli. J Neurophysiol. 2005;93:3270–3281. doi: 10.1152/jn.00758.2004. [DOI] [PubMed] [Google Scholar]
- Schiolten P, Larsen ON, Michelsen A. Mechanical time resolution in some insect ears. J Comp Physiol. 1981;143:289–295. [Google Scholar]
- Schneidman E, Freedman B, Segev I. Ion channel stochasticity may be critical in determining the reliability and precision of spike timing. Neural Comput. 1998;10:1679–1703. doi: 10.1162/089976698300017089. [DOI] [PubMed] [Google Scholar]
- Schwalger T, Fisch K, Benda J, Lindner B. How noisy adaptation of neurons shapes interspike interval histograms and correlations. PLoS Comput Biol. 2010;6:e1001026. doi: 10.1371/journal.pcbi.1001026. [DOI] [PMC free article] [PubMed] [Google Scholar]
- Sigworth FJ. The variance of sodium current fluctuations at the node of ranvier. J Physiol. 1980;307:97–129. doi: 10.1113/jphysiol.1980.sp013426. [DOI] [PMC free article] [PubMed] [Google Scholar]
- Tolhurst DJ, Movshon JA, Dean AF. The statistical reliability of signals in single neurons in cat and monkey visual cortex. Vision Res. 1983;23:775–785. doi: 10.1016/0042-6989(83)90200-6. [DOI] [PubMed] [Google Scholar]
- Traub RD, Miles R. Neuronal networks of the hippocampus. New York: Cambridge UP; 1991. [Google Scholar]
- Vilela RD, Lindner B. Are the input parameters of white noise driven integrate and fire neurons uniquely determined by rate and CV? J Theor Biol. 2009;257:90–99. doi: 10.1016/j.jtbi.2008.11.004. [DOI] [PubMed] [Google Scholar]
- Vogel A, Hennig RM, Ronacher B. Increase of neuronal response variability at higher processing levels as revealed by simultaneous recordings. J Neurophysiol. 2005;93:3548–3559. doi: 10.1152/jn.01288.2004. [DOI] [PubMed] [Google Scholar]
- Wang HS, Pan Z, Shi W, Brown BS, Wymore RS, Cohen IS, Dixon JE, McKinnon D. KCNQ2 and KCNQ3 potassium channel subunits: molecular correlates of the M-channel. Science. 1998;282:1890–1893. doi: 10.1126/science.282.5395.1890. [DOI] [PubMed] [Google Scholar]
- White JA, Rubinstein JT, Kay AR. Channel noise in neurons. Trends Neurosci. 2000;23:131–137. doi: 10.1016/s0166-2236(99)01521-0. [DOI] [PubMed] [Google Scholar]


