

Abstract
Humans are able to flexibly devise and implement rules to reach their desired goals. For simple situations, we can use single rules, such as “if traffic light is green then cross the street.” In most cases, however, more complex rule sets are required, involving the integration of multiple layers of control. Although it has been shown that prefrontal cortex is important for rule representation, it has remained unclear how the brain encodes more complex rule sets. Here, we investigate how the brain represents the order in which different parts of a rule set are evaluated. Participants had to follow compound rule sets that involved the concurrent application of two single rules in a specific order, where one of the rules always had to be evaluated first. The rules and their assigned order were independently manipulated. By applying multivariate decoding to fMRI data, we found that the identity of the current rule was encoded in a frontostriatal network involving right ventrolateral prefrontal cortex, right superior frontal gyrus, and dorsal striatum. In contrast, rule order could be decoded in the dorsal striatum and in the right premotor cortex. The nonhomogeneous distribution of information across brain areas was confirmed by follow-up analyses focused on relevant regions of interest. We argue that the brain encodes complex rule sets by “decomposing” them in their constituent features, which are represented in different brain areas, according to the aspect of information to be maintained.
Introduction
Humans use rules to organize their thoughts and actions to reach their desired goals (Bunge and Wallis, 2007). The complexity of the required rule sets varies widely. For simple situations, a single rule that links a triggering condition (“if the phone is ringing”) to a consequence (“then answer the phone”) might be sufficient. In other cases, more complex rule sets are required. Consider, for example, the large number of nested rules involved in the professional use of a digital camera.
Prefrontal cortex is involved in rule representation. In monkeys, a network that includes the prefrontal cortex and striatum encodes information on active rules (Hoshi et al., 1998; White and Wise, 1999; Asaad et al., 2000; Wallis et al., 2001; Genovesio et al., 2005; Muhammad et al., 2006). In humans, the lateral prefrontal cortex has been associated with rule representation and implementation (Bunge et al., 2003; Sakai and Passingham, 2003, 2006; Bengtsson et al., 2009; Bode and Haynes, 2009; Woolgar et al., 2011; Reverberi et al., 2012a,b).
Most studies on neural representation of rules have explored relatively simple rule sets. This has left aside the critical issue of how prefrontal cortex encodes more complex rule sets. From a theoretical viewpoint, there are several possibilities of how such complex rules might be encoded in the brain. For example, all rule sets might be represented in the same “rule-specific” prefrontal area, regardless of their complexity. Alternatively, more complex rule sets, which, for example, require the application of multiple rules at different hierarchical levels, may progressively be represented in more anterior prefrontal areas (Koechlin et al., 2003; Bunge and Zelazo, 2006; Badre and D'Esposito, 2007; Christoff and Keramatian, 2007).
Recent work by our group hints at a different possibility. We showed (Reverberi et al., 2012b) that ventrolateral prefrontal cortex (VLPFC) uses a compositional code to represent complex rules that consist of multiple parts: the neural representation of a rule set composed of two independent rules A and B is coded as the superposition of the neural representation for A and B alone. In other words, the compound rule set AB is not represented as a unique token “AB” but it is “decomposed” into the neural representations of its constituent features A and B. In this case, the individual rules were encoded as patterns of brain activity in the same area (VLPFC). But this raises the question of how the neural representation of an additional hierarchical order or sequence between the two rules would be encoded. The order could either be coded in VLPFC as well, or there might be a separate region that encodes the rule order independent from the rules themselves.
The present study investigates where and how two features defining a rule set—the identity of multiple rules and their execution order—are represented in the brain. For this, multivariate decoding was applied to fMRI data collected while participants represented rule sets.
Materials and Methods
Participants
Seventeen healthy subjects participated in the experiment. Of those, three participants were discarded: one because of technical problems during data acquisition and two because of too wide head movements inside the scanner. The 14 remaining participants had a mean age of 24.3 years (range 19–28). Five were males. All participants gave written informed consent. They were right-handed and had normal or corrected to normal vision, no neurological or psychiatric history, and no structural brain abnormalities. Participants received monetary reward. The study was approved by the local ethics committee.
Experimental stimuli
Our task required participants to retrieve, maintain, and then apply sets of conditional rules to different target stimuli (Fig. 1). Each rule set was composed of two single rules (Fig. 1A). Each single rule (e.g., “if there is furniture, then B”) linked the presence of an object from one category (e.g., “furniture”) to a consequence (press either “A” or “B”). When the relevant category was present in the target screen, subjects had to press the button corresponding to the position of the letter specified by the rule (Fig. 1C, “A” or “B” could be presented either to left or right of fixation). Four different single rules were used (S1–S4). For the subject subgroup 1 (n = 6), the single rules (S) were as follows: S1, “if there is a musical instrument, then A”; S2, “if there is food, then B”; S3, “if there is a musical instrument, then B”; S4, “if there is food, then A.” For the subgroup 2 (n = 9), musical instrument/food were changed with furniture/transport, respectively. Analogously to a previous study (Reverberi et al., 2012b), the four single rules were combined to create six compound rules (C1–C6), each formed by two single rules (Fig. 1, Table 1). The identity of a compound rule was uniquely determined by the single rules composing it. For example, the compound rule C1 (S1 + S2) is different from C2 (S3 + S4) because C1 and C2 are composed of different single rules. Compound rules from 3 to 6 (Table 1) were only used in catch trials (see below).
Figure 1.

Schema of the experimental paradigm. A, Experimental rules used in the paradigm: four different single rules (S1–S4) were combined in two experimental compound rules (C1, C2) and four catch compound rules (C3–C6; Table 1). Furthermore, two alternative orders were implemented for each compound rule, thereby generating four different experimental rule sets (C1α, C1β, C2α, C2β) and eight catch rule sets (Table 1). B, Each of the four single rules used in the experiment were associated with two visual cues. The resulting redundancy of the cue code made it possible to disentangle visual features of the cues from their meaning (i.e., the rule). C, Timeline of the experiment. At the beginning of each trial, two cues were presented. The cues informed the participants which compound rule had to be applied in the current trial. The top cue always coded the rule to be evaluated first. A delay of 6 s followed cue presentation. A fixation cross was shown during delay. After the delay, the target image was presented. Participants had to apply the active rules to the target stimuli and derive as fast as possible which symbols to choose (A, B, or both) and in which order (AB or BA, in case both symbols had to be chosen). After having chosen the symbol(s), the participants had to press the right, left, or both buttons, depending on the position of the relevant symbols on the target screen. The short time available during target presentation forced the participants to retrieve and represent the relevant rule set as soon as the cue was presented. Following target presentation and before the succeeding trial, a blank screen was presented for a variable time. D, Examples of correct answers given a specific target screen and an active rule set. In the first two cases only the rule order changes.
Table 1.
Type of trials used during fMRI scanninga
| Order α | Order ß | |
|---|---|---|
| Experimental trials | ||
| C1 | S1, S2 | S2, S1 |
| C2 | S3, S4 | S4, S3 |
| Catch trials | ||
| C3 | S1, S3 | S3, S1 |
| C4 | S2, S4 | S4, S2 |
| C5 | S1, S4 | S4, S1 |
| C6 | S2, S3 | S3, S2 |
aFor each different “compound rule” (e.g., C1), the composing single rule (e.g., S1, S2; Figure 1) and the relevant order (α or ß) are reported. The first single rule mentioned is always the single rule to be evaluated first (order factor).
During the target phase, subjects had to evaluate the single rules composing the active compound rule in a specific order. To check that this requirement was met, the responses associated to the rules had also to be generated according to the order of evaluation (Fig. 1D). Two alternative orders per each compound rule were considered (Fig. 1A, Table 1). In particular, four rule sets were used as experimental trials (C1α, C1β, C2α, C2β), differing either in rule identity (C1 vs C2) or in rule order (C1α vs C1β; C2α vs C2β). The remaining eight rule sets were only used in catch trials.
Two visually unrelated cues were used to code for each single rule (Fig. 1B) composing a compound rule, thus resulting in a total of eight cues. This redundant code was used to allow the decoding of individual rules independently of the visual properties of the cues (Reverberi et al., 2012b). Participants learned the cues and their associated rules in separate training sessions. The assignment of cues was randomized across participants, so that each participant used different cue–rule associations.
The target images were colored 3D drawings belonging to four categories: furniture, musical instruments, food, and means of transportation. For each category, we had three different exemplars (images courtesy of Michael J. Tarr, Carnegie Mellon University, http://www.tarrlab.org/). For each participant, two of four categories were used in rules, while the other two were never used. The two relevant categories changed across participants. The experiment was devised and administered using Cogent 2000 developed by the Cogent 2000 team at the FIL and the ICN, and Cogent Graphics developed by John Romaya at the LON at the Wellcome Department of Imaging Neuroscience.
Experimental procedure
At the beginning of each trial, two cues were presented for 1 s. The two cues were displayed one above the other on the vertical midline of the screen. The cues informed participants about the active rule set for the current trial and the order assignment. Each cue always corresponded to one single rule, thus informing about the rule identity. The relative position of the two cues informed the participants about the order: the single rule corresponding to the cue at the top had to be evaluated first. A delay of 6 s followed the presentation of the cue screen in all but catch trials (see below). During the delay, subjects had to keep the fixation on a cross. Finally, the response screen was presented for ≤1.2 s. It disappeared as soon as a button was pressed. The response screen contained two target images, presented one above the other aligned to the midline, and the letters “A” and “B”, displayed on the right and the left side of the target images (Fig. 1). The subjects had to evaluate the active compound rule following the order instructed by the cues, infer which letter(s) are appropriate (e.g., “B and then A”), and then press the button(s) corresponding to the side in which the relevant letter(s) are displayed on the response screen (e.g., “right and then left button”, since B is on the right of the midline). The position of A and B was randomly changed on a trial-by-trial basis. In this way, participants could not anticipate the side where a specific letter would be presented and, consequently, could not prepare any motor act during the delay. Responses had to be produced as fast as possible: participants were informed that they had to respond before the response screen disappeared. The short time available for the response, as well as the short duration between cue and target presentation in catch trials, forced participants to retrieve the relevant rule set as soon as the cue screen was presented.
Twenty percent of all trials administered were catch trials. Catch trials differed from experimental trials in two ways. First, all catch trials used compound rules (C3–C6) different from those used in regular experimental trials. These alternative compound rules were important to prevent the presence in the stimuli of strong associations between single rules (e.g., “S1 is always together with S2”). The alternative compound rules, used in catch trials, were S1-S3, S1-S4, S2-S3, S2-S4 and their respective alternative order S3-S1, S4-S1, S3-S2, S4-S2 (Table 1). Second, in 50% of the catch trials, we shortened the delay between cue and response screen (2 s instead of 6 s). Shorter delays were used both to force the participants to represent the relevant rule set as soon as possible after cue presentation, and to assess whether participants indeed quickly represented the rule sets.
Given the type of rules and target images in the task, three outcomes were possible: (1) all criteria of both single rules composing the active compound rule are met; (2) only the criterion of the single rule to be evaluated first is met; or (3) only the triggering criterion of the single rule to be evaluated last is met. For the first outcome, two button presses had to be produced, one per rule, in the assigned order. For the other two outcomes, only one button press had to be produced. Without considering catch trials, the first outcome was present in 40% of all trials, the second in 20%, and last in 40%. Outcome 1 is critical for allowing us to assess whether subjects correctly followed the instructions on rule order. Outcome 3 was the only in which responses associated to the rule to be evaluated last were implemented first. This is why both Outcomes 1 and 3 were overrepresented compared with Outcome 2. On one hand, we wanted to have enough trials for assessing whether subjects correctly applied order assignments (Outcome 1). On the other hand, we wanted to make sure that subjects did not apply extreme strategies to reduce the cognitive load, like ignoring the order dimension or ignoring the single rule to be evaluated second. In catch trials, Outcome 1 was present in 50% of the trials, Outcome 2 and 3 in 16% of the trials each, and in the remaining 16% of the catch trials no response should be generated.
Before scanning, participants performed a short “warm-up” training of ∼10 min. During scanning, participants performed 360 trials divided into six runs. In each run, participant performed 48 experimental trials, 12 for each different experimental rule set (Table 1), and 12 catch trials, six with short delay and six with normal delay. Catch trials were selected pseudorandomly from eight alternatives (Table 1), so that each alternative was presented at least once in each fMRI run. Trial order was randomized so that the same cue combination never appeared twice in a row.
All participants underwent an extensive training before fMRI scanning. The training sessions were scheduled on two separate days, at most 3 d before scanning. During training, the participants first learned the specific cue–rule associations. Afterward, they practiced the flexible application of the relevant rules in a way similar to the final experimental paradigm described above, the only difference being the presence of correctness feedback. The training procedure lasted overall ∼2 h. The training procedure stopped when participants correctly responded four times in a row to each of the four experimental rule sets.
Image acquisition
Functional imaging was conducted on a 3 tesla Siemens Trio scanner equipped with a 12-channel head coil. In each of the six scanning sessions, 305 T2*-weighted gradient-echo echo-planar images (EPI) containing 32 slices (3 mm thick) separated by a gap of 0.75 mm were acquired. Imaging parameters were as follows: repetition time (TR), 2000 ms; echo time (TE), 30 ms; flip angle, 90°; matrix size, 64 × 64; and a field of view (FOV), 192 mm; thus yielding an in-plane voxel resolution of 3 mm2, resulting in a voxel size of 3 × 3 × 3.75 mm. A T1-weighted structural dataset was also collected. The parameters were as follows: TR, 1900 ms; TE, 2.52 ms; matrix size, 256 × 256; FOV, 256 mm; 192 slices (1 mm thick); flip angle, 9°.
Data analysis
Preprocessing and first-level analysis.
Preprocessing, parameter estimation, and group statistics of the functional data were performed using SPM8 (Wellcome Department of Imaging Neuroscience, Institute of Neurology, London, UK). Images were slice-time corrected and realigned. To preserve fine-grained patterns of individual voxels, no spatial normalization or spatial smoothing was applied at this point of the analysis. A finite impulse response (FIR) model was applied to the realigned and slice-timed images (Henson, 2004). Each condition was modeled using 16 time bins of 2 s each. We considered eight conditions corresponding to the cells of a 2 (compound rules: C1 vs C2) × 2 (order assignments: α vs β) × 2 (cue sets) factorial design (Table 1). Only correct trials were used for the estimation of the parameters. The onset time for all regressors was the cue appearance. Separate regressors were estimated for each of the six runs.
Multivariate pattern analysis using “searchlights.”
To identify where the brain codes information about rule identity and rule order, we applied multivariate pattern analysis (Kamitani and Tong, 2005; Haynes and Rees, 2006; Norman et al., 2006; Pereira et al., 2009) using a “searchlight” approach (Kriegeskorte et al., 2006; Haynes et al., 2007). The searchlight approach (Fig. 2B) examines whether two given classes can be distinguished based on the local fMRI patterns surrounding a voxel vi, thus providing evidence on whether a brain region contains information about the two classes. For a given voxel vi, a small spherical cluster (e.g., radius, 4 voxels) is defined centered on vi. For each voxel in this local cluster, the parameter estimates are separately extracted for two given classes and separated in two independent datasets: a training dataset and a test dataset. A linear support vector pattern classifier (Müller et al., 2001) with a fixed regularization parameter C = 1 is trained to distinguish the two classes using only the data from the training set. The performance of the classifier is then evaluated on the test dataset to assess how much information could be extracted about the conditions from the training dataset. The same procedure is repeated for all voxels in the analyzed image. The decoding accuracy for each local searchlight position vi is used to create a decoding accuracy map that has the same dimensions as the original EPI images. A decoding accuracy significantly above chance implies that the local pattern of activation in the sphere vi encodes information about the relevant conditions.
Figure 2.

A, The factors considered in the two main analyses on rule identity and rule order. The rule identity analysis contrasts different compound rules. Notice that in both rule classes, the same basic elements are involved: furniture/transport and A/B symbols. Rule-order analysis contrasts the same compound rules but with different order assignments. B, Schema of the searchlight decoding analyses. We considered only the brain activation during the cue and the delay phase. Local pattern of activation in spherical clusters were extracted for each condition and in each fMRI run. The data were then separated into a training set and a test set. A pattern classifier, Support Vector Classification (SVC) was trained to distinguish the two experimental classes (e.g., C1 vs C2) using only the data from the training set. The performance of the classifier was then assessed on the test set and the computed accuracy assigned to the voxel at the center of the spherical cluster. The position of the spherical cluster was then systematically changed to explore the whole brain. The result of this iterative process is a whole-brain accuracy map showing the distribution of local information on the two considered experimental classes.
The accuracy maps are normalized to MNI-space using the parameters estimated during preprocessing, and then submitted to a second-level analysis in SPM8 to test where in the brain decoding accuracies differ significantly from chance level (50% in the present case) across all participants at group level. Statistic images were assessed for cluster-wise significance using a cluster-defining threshold of p = 0.0005. The minimum cluster size was then set to obtain a probability of familywise error (FWE) of 0.05 at cluster level. This restricted to a maximum of 0.05 the probability of falsely finding a cluster with a size equal or above a critical threshold. The minimum cluster size was variable and automatically computed by SPM8 for each analysis on the basis of the estimated smoothness of the accuracy images (Friston et al., 1996; Worsley et al., 1996; Kiebel et al., 1999; Hayasaka et al., 2004).
Decoding rule identity.
The first decoding analysis aimed at exploring where information on the active compound rules is encoded in the brain, irrespective of the order assigned (Fig. 2). This analysis was devised so that information concerning visual appearance of the cues could not contribute to classifier performance. Classifiers were trained to distinguish the two experimental compound rules C1 and C2, introduced by one set of cues (e.g., by Cue Set 1). This classifier was then tested on an independent test dataset, containing the same two compound rules (C1 vs C2) but this time introduced by the alternative cue set (e.g., the Cue Set 2). In this way, the classifiers could only use information on the active rule sets (i.e., the meaning of the cues), but not on the visual features of the associated cues. Notice that this implements a cross-validation procedure across cue sets, preventing overfitting of the data. Decoding of rule identity was independent of rule order: each class contained data with all possible order assignment for each compound rule.
More in detail, four decoding analyses were implemented (see Table 1 for the notation). These analyses were as follows: first analysis: training, C1 (Cue Set 1) versus C2 (Cue Set 1); test, C1 (Cue Set 2) versus C2 (Cue Set 2); second analysis: same as first, but with training and test dataset switched; third analysis: training, C1 (Cue Set 1) versus C2 (Cue Set 2); test, C1 (Cue Set 2) versus C2 (Cue Set 1); fourth analysis: same as third, but with training and test dataset switched. Only data from the FIR time bins from 2 to 4 were used, corresponding to the time interval from 2 to 8 s after stimulus onset. This time window is the same used in a previous related study by our group (Reverberi et al., 2012b). Considering the delay of the hemodynamic response function, this time window grants that only the cue phase and the delay phase are considered in the analysis. Overall, 72 images were available for the training set, and other 72 images were available for the test set (2 orders × 6 runs × 3 time bins × 2 cue sets). For each participant, the four accuracy maps resulting from the four analyses described above were averaged before submission to the final second-level analysis.
Decoding rule order.
The procedure to identify regions containing information about order (Fig. 2) was similar to the one used for the analysis on rule identity. In contrast to rule identity, eight different decoding analyses were performed. In each analysis, a classifier was trained and tested to distinguish the alternative orders assigned to the same compound rule (e.g., to distinguish C1α from C1β). Again, different cue sets were used for training and testing.
Specifically, we performed the following eight analyses: first analysis: training, C1α versus C1β (both Cue set 1); test, C1α versus C1β (both Cue set 2); second analysis: same as first, but with training and test dataset switched; third analysis: training, C1α (Cue set 1) versus C1β (Cue set 2); test, C1α (Cue set 2) versus C1β (Cue set 1); fourth analysis: same as third, but with training and test dataset switched; fifth analysis: training, C2α versus C2β (both Cue set 1); test, C2α versus C2β (both Cue set 2); sixth analysis: same as fifth, but with training and test dataset switched; seventh analysis: training, C2α (Cue set 1) versus C2β (Cue set 2); test, C2α (Cue set 2) versus C2β (Cue set 1); eighth analysis: same as the seventh, but with training and test dataset switched. For each participant, the four resulting accuracy maps for compound rule 1 (analyses 1–4) and compound rule 2 (analyses 5–8) were averaged before the second-level analysis. Thus, two accuracy maps per subject were used in the second-level analysis for each participant.
Univariate control analysis.
Standard GLM analyses were also run. For these analyses, the data were spatially smoothed after movement and slice-time correction (kernel size, 6 voxels FWHM), by contrast with the decoding analysis where no smoothing was applied. A standard first-level GLM HRF model was estimated for each subject, using one regressor for each compound rule–order combination, yielding four regressors per subject: C1α, C1β, C2α, C2β. Cue-onset times were used as onsets for the regressors; duration was set to 0. In contrast to the decoding analyses, all runs were used for the estimation of the regressors, and trials were not separated according to the use of different visual cues: neither of these two features of the decoding analyses (i.e., the separation into runs and the separation according to cue identity) was relevant in a standard GLM analysis. Contrasts between the conditions were calculated for each participant. Specifically, the rule identity contrast (one image per subject) was calculated as C1α + C1β − C2α − C2β, thus without considering rule order. For rule order, two contrast images were calculated per participant: C1α − C1β and C2α − C2β. The resulting two contrast images were averaged for each participant. The contrast images were then normalized to MNI space, and submitted to one-sample t tests to check for differences between compound rules, and between alternative order assignments.
Results
Behavioral results
During scanning, participants applied the relevant rules with high accuracy. The average proportion of correct responses in experimental trials was 86.7% (SD, 5.6%). Participants were also very fast in generating the responses: the average reaction time (RT) from target appearance to first button press was 884 ms (SD, 81 ms) when only one answer had to be produced and 809 ms (SD, 67 ms) when two answers had to be produced. The mean RT until the second button press when two answers had to be produced was 1009 ms (SD, 86 ms; Fig. 3). In trials where one response was required, the single rule generating the response should be either evaluated first or last (order dimension). If the participants correctly processed rule order, then responses following rules to be evaluated first should have been produced faster than responses following rules to be evaluated last. We found that participants were faster in producing an answer associated to a rule to be evaluated first [839 ms (SD, 64 ms) vs 928 ms (SD, 71 ms), t(13) = 8.75, p < 0.001]. This shows that participants prepared, as required, after cue presentation not only to apply the active rule set, but also to first evaluate the appropriate single rule. At the same time, however, participants allocated enough cognitive resources for adequately processing both the rules to be evaluated first and the rules to be evaluated second, so that accuracy remained similar in the two situations. With 84.9% (SD = 0.06) and 82.8% (SD = 0.07), respectively, accuracy was not significantly different (t(13) = 1.51, p = 0.15).
Figure 3.

Plot of the average response accuracy (top) and average reaction times (bottom) in different trials. All: average across all trial types. R1–R4: single rule 1–4. Exp: experimental trials. Catch: catch trials. Short: catch trials with short delay (2 s). Both: trials requiring a response involving both A and B (i.e. AB or BA). First: trials in which the response should be derived from the rule to be evaluated first. Last: trials in which the response should be derived from the rule to be evaluated last. Both1, Both2, reaction times to the first and second response, respectively, when two responses are due. Error bars display SEM.
Two types of catch trials were also administered. In both, participants performed similar to the experimental trials. In catch trials with normal and short delays, participants had an overall accuracy of respectively 87.4% (SD, 10%) and 84.6% (SD, 11.9%), while they answered in respectively 774 ms (SD, 88 ms) and 786 ms (SD, 73 ms). Accuracy was not significantly different from experimental trials, while RTs in catch trials were faster (normal-delay catch trials: accuracy, t(13) = 0.28, p = 0.79; RT, t(13) = 5.70, p < 0.001; short-delay catch trials: accuracy, t(13) = 0.85, p = 0.41; RT, t(13) = 4.00, p = 0.0015). The faster RTs in catch trials are arguably due to the fact that they are easier to process on the target phase: in all catch trials, the two active rules either share the same trigger (e.g., “food”), or they share the same consequence (e.g., “A”). Together, the high accuracy and fast reaction times in both catch and experimental trials confirm that participants encoded the relevant rule sets immediately after cue presentation. These findings also show that participants explicitly represented both single rules composing the active rule set in experimental and catch trials. Otherwise this would have surfaced in measurable behavioral differences between catch and experimental trials.
Assessment of behavioral differences across rules
For each single rule we extracted all trials in which participants had to apply only that specific single rule. We then compared mean accuracies and reaction times for all these trials (Fig. 3). No significant difference between either accuracy or RT between any of the four single rules could be found (accuracy, F(3,52) = 1.66, p = 0.19; RT, F(3,52) = 0.07, p = 0.97).
Participants produced on average 13.3% errors when experimental and catch trials were considered together. Participants made errors for different reasons. They made order errors: when required, they correctly produced two responses, but without observing the order assignments. Participants also produced insertions and omissions. In the first case, participants gave two answers instead of one (e.g., correct response, left; answer, left-right); in the second case they gave one answer instead of two (e.g., correct response, left-right; answer, left). Finally, participants might have substituted one button press with the alternative one, thus producing a substitution error (e.g., correct response, left; answer, right). Order errors are due to a failure in considering the specific order in which rules should be evaluated, while insertions, omissions, and substitutions are related to the appropriate selection and application of the single rules involved in the active compound rule. Some error kinds could be produced only in a subset of trials. For example, order errors could only be produced in trials requiring two answers. When this fact was taken into account, the probability of producing order errors was on average 2.3% (SD, 2.3%); for insertions, it was 2.8% (SD, 1.7%); for omissions, it was 7.1% (SD, 3.6%); and finally for substitutions, it was 3.7% (SD, 1.9%). Overall, the probability of producing an error related to the selection and application of the relevant single rules was 12.1% (SD, 5.2%). The distribution of error types suggests that selecting and applying the rules was more demanding than complying with the order assignments.
Imaging results
Decoding rule identity
The aim of this first decoding analysis was to identify the brain areas coding the identity of the active compound rule, regardless of the order assigned to the composing single rules (Fig. 4, Table 2). Two key features of the paradigm assured independence between decoding identity and decoding rule order. First, each compound rule was administered with all possible rule-order combinations. Second, the two compound rules considered for rule identity decoding comprised entirely different single rules: C1 was composed of S1 and S2, while C2 was composed of S3 and S4. Given that order information is assigned to single rules, any order information on S1 or S2 cannot transfer on S3 or S4 and vice versa. Further paradigm features were important for making identity decoding specific under other respects. First, each of the compound rules was instructed by one of two visually different cues. In this way we could train the pattern classifiers on rule instances that were introduced by one of the two cues with the same meaning, and then test on other instances of the same rules, but introduced by the alternative, visually different cue. This way the visual appearance of the cues would not interfere with rule identity decoding. Second, either compound rule was constituted by the same basic elements. In both compound rules, both letters A and B, and both musical instruments and food (in group 2, means of transportation and furniture) were involved. The only feature changing between the two experimental compound rules (i.e., Table 1, C1 and C2) was the conditional rule linking the same basic elements (Fig. 3, Table 1). This also assured that the same cognitive resources (e.g., working memory) were needed to represent the two compound rules.
Figure 4.
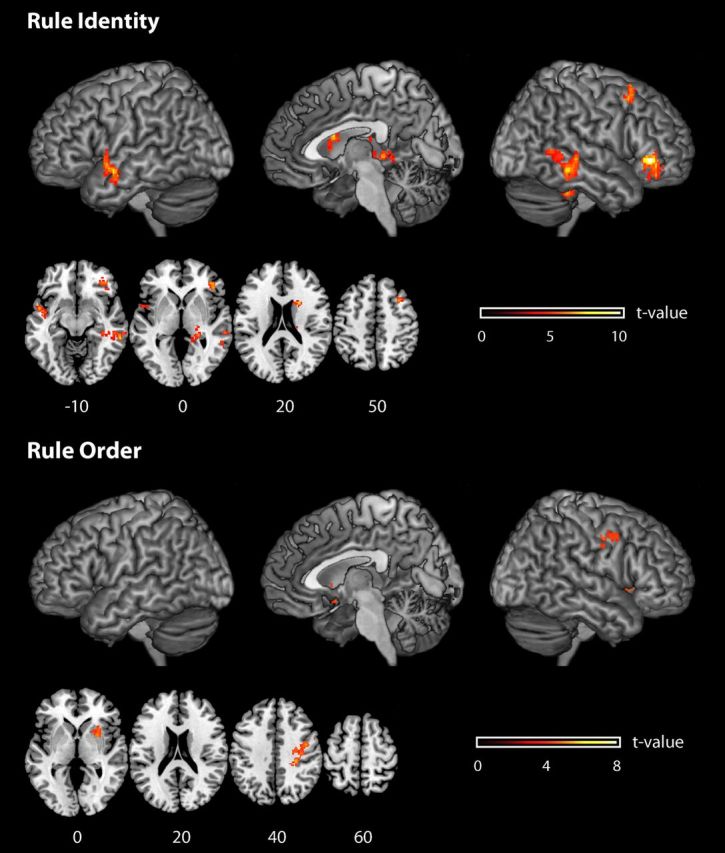
Brain regions from whole-brain analyses where it was possible to decode from local patterns of activation the identity of the active rule set (top), and the rule order (bottom). Informative brain regions are rendered onto a T1-weighted brain image. The reported effects are all significant at p < 0.05, corrected for multiple comparisons. Color scales (t values) are reported separately for each plot.
Table 2.
Decoding of rule identity and rule order: brain areas showing decoding accuracies significantly higher than chance (50%)a
| Anatomical region | Cluster size (k) | p (FWE) | x | y | z | Accuracy at t peak | Average cluster accuracy | Main BA |
|---|---|---|---|---|---|---|---|---|
| Identity decoding | ||||||||
| Inferior frontal gyrus | 262 | <0.001 | 44 | 36 | −4 | 62.8 | 53.2 | 47 |
| 44 | 40 | −16 | 56.5 | |||||
| 34 | 46 | −10 | 54.7 | |||||
| Superior frontal gyrus | 113 | 0.03 | 30 | 18 | 62 | 57.6 | 53.1 | 8, 9 |
| 30 | 20 | 44 | 57.0 | |||||
| 34 | 16 | 52 | 56.6 | |||||
| Caudate nucleus | 127 | 0.018 | 22 | 12 | 22 | 59.0 | 53.5 | |
| 16 | 12 | 6 | 55.1 | |||||
| 12 | 16 | 24 | 54.7 | |||||
| Middle temporal gyrus | 678 | <0.001 | 60 | −36 | −12 | 57.1 | 53.8 | 21, 20, 37 |
| 50 | −34 | −6 | 56.8 | |||||
| 30 | −34 | −22 | 56.8 | |||||
| Superior temporal gyrus | 208 | 0.001 | −48 | 0 | −12 | 57.3 | 53.3 | 21 |
| −52 | −2 | −20 | 55.5 | |||||
| −54 | 8 | −2 | 55.3 | |||||
| Hippocampus | 106 | 0.038 | 24 | −32 | 2 | 56.3 | 53.3 | 27 |
| 22 | −24 | 0 | 55.2 | |||||
| 22 | −22 | 12 | 55.1 | |||||
| Order decoding | ||||||||
| Precentral gyrus (premotor cortex) | 436 | 0.002 | 28 | −28 | 40 | 55.4 | 54.1 | 6, 3 |
| 34 | −18 | 36 | 55.3 | |||||
| 42 | −6 | 40 | 55.2 | |||||
| Putamen | 206 | 0.037 | 28 | 8 | 0 | 55.0 | 54.1 | |
| 24 | 10 | −10 | 54.8 | |||||
| 30 | 16 | −2 | 54.8 |
aCoordinates x, y, and z in space of MNI template and selection of cluster maxima according to the conventions of SPM8. The reported p values refer to cluster level inference and are familywise corrected for multiple comparisons. We report the decoding accuracy of the searchlight at each t peak and the average decoding accuracy over all searchlights within clusters.
We were able to decode the identity of the active compound rule from local activation patterns in the right ventrolateral frontal cortex [Brodmann area (BA) 47, p < 0.05 FWE-corrected for multiple comparisons; accuracy at the t value peak, 62.8%], in the right superior frontal lobe (BA 8/9, p < 0.05 FWE-corrected; accuracy at the t value peak, 57.6%), in the right caudate nucleus (p < 0.05 FWE-corrected; accuracy at the t value peak, 59.0%), in left temporal pole (BA 21, p < 0.05 FWE-corrected; accuracy at the t value peak, 57.2%), right posterior temporal lobe (BA 20/21/37, p < 0.05 FWE-corrected; accuracy at the t value peak, 57.1%), and in the right hippocampus (p < 0.05 FWE-corrected; accuracy at the t value peak, 56.3%).
Decoding order
The aim of this second decoding analysis was to identify the brain areas coding the order in which the single rules composing the rule set (Fig. 4, Table 2) had to be evaluated. We were interested in exploring in more detail which brain areas encoded the order in compound rules composed of exactly the same single rules. Thus, for example, we asked which brain areas encode the difference between rule set C1α (S1 and S2; S1 to be evaluated first) compared with rule set C1β (S1 and S2; S2 to be evaluated first). As in the preceding analysis, to control for the correlated visual features of the cues, we trained the pattern classifiers on rule instances introduced by one of the two cues with the same meaning, and then test on other instances of the same rules, but introduced by the alternative, different cue.
We were able to decode single-rule order associated with the active compound rule from local patterns of activation in an area centered in dorsal premotor cortex (PMd; accuracy at the t value peak, 55.4%; extending also into postcentral cortex) and the right putamen (accuracy at the t value peak, 55.0%).
There was no overlap between the brain areas in which rule identity or rule order could be decoded (but see ROI analyses, below). Even though the right striatum was involved in both cases, the two types of information did not overlap at a finer scale: rule identity information was found in the caudate, while rule order information was found in the putamen.
Univariate analyses
We evaluated by means of a standard GLM analysis whether there was any reliable difference in the average bold signal between the two experimental compound rules C1 and C2, and between the two pairs of alternative order assignment (Table 1). No significant differences were found in any of the analyses. In particular, none of the brain areas that we found to encode information on rule identity or rule order with the multivariate analysis showed any reliable univariate difference across conditions.
ROI analyses
In the preceding whole-brain analyses, we found that it was possible to decode identity and order information in several brain regions. However, we found no brain regions in which it was possible to decode both types of information. We ran an ROI analysis with three aims: (1) to further assess the relative performance of the two main decoding analyses to check whether a different analytical approach would find an overlap; (2) to formally check, with a specific focus on VLPFC, whether brain regions are differently involved in representing identity and order information; and (3) to check whether minor differences in the processing difficulty of the rules we decoded might have contributed to the classifier performance.
A preliminary step for the first analyses is the appropriate definition of the relevant ROIs. To avoid overfitting and circular inference, we considered as ROI the brain areas involved in rule-order representation for the analysis on rule identity, while for the analysis on rule order we considered brain areas that were involved in rule-identity representation (Fig. 4, Table 2). We then computed for each participant the average accuracy attained by the two classifiers across all voxels in the ROI. Those values were then submitted to a one-sample t test analysis. In this way, no risk of circular analyses is introduced for the analyses, given that rule identity and rule order are two statistically independent features. We applied Bonferroni correction to the ROI analyses so that the target α-level was equal to 0.05 divided by the number of ROIs considered (2 in the identity analysis using order ROIs and six in the order analysis using identity ROIs), as implemented in the toolbox MarsBaR (http://marsbar.sourceforge.net). Even by using ROI-based analyses, we could not find order information in the brain areas coding the identity of the active rules: in all the identity ROIs, the average accuracy rate across all voxels did not differ from chance level (p > 0.1 for all p values, corrected for multiple comparisons; all clusters, but caudate nucleus, remained nonsignificant even when noncorrected p values were considered). By contrast, the ROI analysis showed that the brain areas involved in order representation also contain information on the identity of the active rules: it was possible to identify the active rule with a higher than chance accuracy in both the lateral premotor (t(13) = 4.06, p < 0.05, corrected) and in the putamen ROI (t(13) = 2.71, p < 0.05 corrected).
In the first set of ROI analyses, we showed that both identity and order information were available in putamen and premotor cortex, while we found information pertaining only to identity in other frontal and temporal regions. In particular, no order information was found in VLPFC, which has been shown to be involved in rule representation and implementation. The second set of ROI analyses was a follow-up set devoted to formally test whether there was a difference in the information that could be found across brain regions; more specifically, we were interested in differences between VLPFC and regions involved in order representation. We thus checked for the presence of an interaction brain region × information across the relevant ROIs. Again, an important preliminary step is to implement a procedure for defining ROI boundaries that avoids overfitting and circular inference. Compared with the first set of ROI analyses, in this case it was necessary to define ROIs independently from decoding analyses on both rule identity and rule order. Therefore, a cross-validation procedure was implemented. The cross-validation procedure was applied across subjects by rerunning the two main analyses on rule identity and rule order. Importantly, one subject was left out in each cross-validation step (i.e., we ran 2 × 14 analysis with nsubjects = 13 in each step). In this way, we obtained two functional maps (1 for identity, 1 for order, p < 0.0005, uncorrected) per each cross-validation run. These maps were then segmented into different ROIs by intersecting the functional maps with the anatomical regions of the automatic anatomical labeling (AAL) map (Tzourio-Mazoyer et al., 2002). Only informative voxels within each AAL region were considered. Furthermore, to obtain reliable estimates of average decoding accuracies in the AAL regions, we selected all those functional–anatomical ROIs that contained at least 20 “informative” voxels for the following analyses. Next, for each subject si, we extracted the si's decoding accuracies for both identity and order analyses by using the functional–anatomical ROIs that were calculated leaving out si. Overall, this procedure generated slightly different ROIs in each AAL region for each left-out subject. Besides, this procedure may identify a particular AAL region only in a subset of subjects. For our final analyses, we only considered AAL regions present in all 14 subjects. Overall, we identified four ROIs in the frontal cortex (orbital and triangular part of the inferior frontal gyrus, precentral gyrus, and middle frontal gyrus, all right sided), two in the basal ganglia (right caudate and putamen), and six in the temporal lobe (on the right: hippocampus, parahippocampal gyrus, fusiform gyrus, middle temporal gyrus; on the left: middle and superior temporal gyrus, superior temporal pole). We first checked for region–information interaction between VLPFC (inferior frontal gyrus, both pars orbitalis and pars triangularis) and “order regions” (putamen and right precentral cortex). We found that the interaction was significant (F(3,39) = 3.44, p = 0.026). With that established, we tested all possible pairwise comparisons to understand whether any of these was driving the overall effect. Each frontal inferior subregion showed a significant region × information interaction with putamen (pars orbitalis: F(1,13) = 5.00, p = 0.044; pars triangularis: F(1,13) = 6.74, p = 0.022), while the interactions involving precentral gyrus showed only a statistical trend (p < 0.1 for both p values). By contrast with VLPFC, caudate and middle frontal gyrus did not show a significant interaction with putamen and precentral gyrus (p > 0.1 for all p values). Finally, we checked for the presence of the same interaction between precentral gyrus/putamen and all temporal regions. The interaction was significant (F(8,104) = 16.15, p = 0.037). Overall, these analyses corroborate the idea that the distribution of identity and order information is inhomogeneous within the brain regions that we found to be involved in complex rule representation.
In the third set of ROI analyses, we checked whether the main decoding analyses exploited small differences in difficulty across the decoded rule sets (Cole et al., 2011). If this were the case, one would expect a higher decoding performance in subjects with the largest difference in difficulty across rules. For each subject, we computed the average performance of the classifiers: in each identity cluster for identity decoding, and in each order cluster for order decoding (Table 2). Furthermore, we computed two behavioral indices for difficulty: the absolute difference in (1) accuracy and (2) RT between trials belonging to each of the two alternative classes considered for identity and order fMRI decoding. Overall, we had eight decoding values (one decoding value for each cluster in which information about identity or order could be detected; Table 2) and four behavioral indices for processing difficulty (RT and accuracy in trials relevant for either identity or order decoding) for each subject. We then tested whether the classifier performance in any of the ROIs correlated with the behavioral indices of processing difficulty. We found no significant correlation in any test (p > 0.1 for all p values, Bonferroni corrected for multiple comparisons). Even when uncorrected statistics were considered, only 1 of 16 correlations became significant: in this case we found a significant correlation between the classifier for rule identity and the absolute RT difference in the ROI centered on middle temporal gyrus (R2 = 0.47, p = 0.01, uncorrected). These findings do not corroborate the hypothesis that processing difficulty contributes to the decoding analyses of this study.
Formal comparison with preceding study
We formally compared the findings of the present study to those of a previous study of our group on rule representation using a paradigm similar to the one used here (Reverberi et al., 2012b). In that study, one of the analyses explored the brain structures involved in the representation of compound rules. Importantly, however, in our preceding study, we did not introduce any order assignment on the compound rules: when the single rules of an active compound rule were both triggered by the target, the participants were free to answer by choosing any of the two relevant responses. Moreover, in our preceding study the single rules directly linked a visual stimulus (e.g., “house”) to a motor response (e.g., “press left”).
The representation of rule identity in the two studies overlaps in ventrolateral prefrontal cortex (95 voxels with maximum in MNI coordinates 44 38 −4), but not in other regions. To increase sensitivity to the possible presence of small effects in any of the regions found in the two studies, we assessed whether the average accuracy in those regions was above chance by using an ROI analysis. First, we applied the two ROIs extracted from our preceding study to the present one. The analysis confirmed that the ventrolateral prefrontal ROI had an average accuracy higher than chance (t = 4.56, p < 0.001, corrected), while this was not the case for the parietal ROI. Second, we applied the ROIs extracted from this study to the preceding one. Again, the only significant ROI was the VLPFC (t = 2.87, p < 0.05, corrected).
Discussion
Humans are able to devise and implement complex rules involving the integration of multiple layers of control (Badre and D'Esposito, 2007; Koechlin and Summerfield, 2007). Prefrontal cortex is involved in the representation and the implementation of rule sets. However, it is still unclear how representation of complex rule sets is organized within prefrontal cortex.
In the present study, participants represented compound rule sets involving the concurrent application of two single rules (Fig. 1). These rules had to be evaluated in a specific order (Table 1). The compound rules and the rule order were independently manipulated.
The identity of the active compound rule was encoded in a network (Fig. 4, Table 2) comprising VLPFC, superior frontal gyrus, dorsal striatum, and temporal lobe. No information about rule order could be found in any of these brain areas, neither in a whole-brain analysis nor in ROI analyses focused on the brain areas encoding rule identity. The order in which rules were evaluated could be decoded in a smaller set of areas comprising dorsal premotor cortex and dorsal striatum (Fig. 4). No information about identity could be found in these areas in a whole-brain analysis. However, a more sensitive ROI analysis showed that these two regions also contained information on the identity of the active rule. Finally, the nonhomogeneous distribution of information across the relevant brain regions was confirmed in a further ROI analysis showing a region × information interaction.
Complex rule sets: distributed representation
The finding that rule identity and rule order are represented in different brain areas suggests that the brain encodes complex rules by “decomposing” them in their defining aspects. This is consistent with and extends previous work by our group showing that the neural code representing compound rules is compositional (Momennejad and Haynes, 2012; Reverberi et al., 2012b). In a previous study (Reverberi et al., 2012b), the neural code of the single rules (e.g., “Rule A”) building up a compound rule (e.g., “Rule AB”) was shown to be similar to the neural code making up single rules (e.g., “Rule A” and “Rule B”). Thus, also in that case, the compound rules were decomposed in their elementary constituents. In contrast with the present study, however, the two constituents, which belonged to the same control layer, were represented in the same brain area.
A distributed representation of features is a central hypothesis in recent theories of prefrontal cortex function (Botvinick, 2007; Koechlin and Summerfield, 2007; Frank and Badre, 2012). These theories claim that information on the active rule set anatomically segregates in different control layers, depending on the level of abstraction (Frank and Badre, 2012; Badre and Frank, 2012), or on the time window of the control signal (Koechlin and Summerfield, 2007). However, evidence available to date referred to brain activation differences during task execution, which may be only loosely related to representation of task information. Our findings provide direct evidence that the hypothesized segregation of information is taking place.
Rule identity representation in VLPFC
In a preceding study by our group (Reverberi et al., 2012b), we showed that right VLPFC (approximately BA47) encoded rule sets simpler than those considered here. Similar to the current experiment, they involved compound rules, but without order assignment. Thus, in that case, multiple levels of control were not necessary. Here, we found that the same VLPFC area also represented more complex rule sets involving order as an additional control layer. This is consistent with evidence showing that VLPFC is active during maintenance of task rules (Bunge et al., 2003; Sakai and Passingham, 2003; Rowe et al., 2007; Bengtsson et al., 2009). Interestingly, however, not all information on the active rule set in the present study could be found in VLPFC. In this region it was possible to decode which rules were active, but not the order assignments. Furthermore, a follow-up ROI analysis confirmed a reliable difference in information distribution between VLPFC and putamen/precentral gyrus. This evidence suggests that VLPFC cannot be considered the general controller of task set preparation, orchestrating lower level brain areas, as suggested, for example, by the findings of Sakai and collaborators (Sakai and Passingham, 2003, 2006; Bengtsson et al., 2009). VLPFC should rather be conceived as a (specialized) part of a larger system of control also involving brain structures coding for other necessary information, such as that on order.
Rule identity representation in temporal lobe
The active rules were also represented in temporal areas including posterior middle temporal lobe, superior temporal lobe, and fusiform gyrus. It has been shown that these areas are involved in the representation of object categories (Martin, 2007; Patterson et al., 2007; Mahon and Caramazza, 2009; Mion et al., 2010; Visser et al., 2010). However, the decoding analysis on rule identity we performed here implies not only that those areas were involved in coding categories, but critically that they were involved in representing associations between categories and specific symbols like “A” or “B”. Only the combination of category (e.g., food) and symbol (“A” or “B”) could differentiate between our rule sets. This finding is consistent with a recent decoding study (Baron and Osherson, 2011) showing that the combination of concepts, such as “male” and “child”, was encoded in a network of brain areas broadly similar to the one found here. Our findings also confirm preceding studies showing that the temporal cortex, particularly the posterior temporal gyrus, is involved in rule retrieval (Bunge et al., 2003; Donohue et al., 2005). Meanwhile, they suggest that rule information can be kept active in temporal lobes also during a delay.
Thus, brain areas arguably involved in processing the target objects represent associations of those categories and symbols already during preparation. This may be instrumental to the fast application of the appropriate rules in the time-constrained target phase (Sakai and Passingham, 2003). In line with this interpretation, the temporal lobes seem to be involved in rule representation only when rules consist of the combination of ≥2 visual stimuli (e.g., food items and letters: “if food, then A”). When the rules are actually directly linking a visual object with an action (e.g., “if food, then press left”), other parts of the semantic system are recruited (i.e., those dedicated to manipulable objects) (Kellenbach et al., 2003; Pobric et al., 2010). This was indeed the case in our preceding study on rule representation: information on rules combining a category (house, face) to an action (left, right button presses) was not found in temporal but in parietal cortex.
Rule identity and rule order representation in basal ganglia and premotor cortex
The dorsal striatum (putamen) and dorsal PMd were the only brain areas in which we could decode information about both order and rule identity. These two areas are connected in a common corticostriatal circuit (Haber, 2003; Leh et al., 2007; Cohen et al., 2008; Draganski et al., 2008). Beside putamen, another area in the dorsal striatum (caudate nucleus) encoded rule identity. This area may be connected with the area in the middle frontal gyrus also encoding identity (Draganski et al., 2008).
The dorsal striatum and its target areas in the frontal cortex are known to be involved in sequence learning and arbitrary rule learning (e.g., Toni et al., 2001; Boettiger and D'Esposito, 2005; Pasupathy and Miller, 2005; Averbeck et al., 2006; Mushiake et al., 2006; Brovelli et al., 2008; Graybiel, 2008; Jin et al., 2009; Badre et al., 2010; Yin, 2010). However, published studies mainly focused on rules involving stable stimulus–response or action–outcome associations (but see, e.g., Kubota et al., 2009), learned implicitly by trial and error, without the use of explicit verbal instructions. In this study, we showed that the dorsal striatum and PMd are also involved in the representation of explicit, verbally instructed conditional rules, a functional role attributed so far to prefrontal cortex and/or hippocampus (Poldrack and Packard, 2003; Yin and Knowlton, 2006). Furthermore, we showed that the striatum can encode purely cognitive (i.e., not involving motor actions) rules linking a category (e.g., food) with an abstract symbol (e.g., “A”). Finally, we showed that striatum also represents stimulus–response associations that change on a trial-by-trial basis. These findings corroborate recent evidence showing that the dorsal striatum is involved in flexible switching between different rule sets (Ragozzino, 2007; Leber et al., 2008) and recent theories proposing that the dorsal striatum, in coordination with the hippocampus, is also involved in the implementation of explicitly learned abstract rules (Doll et al., 2009; Frank, 2011).
In agreement with recent theories of control function (Frank and Badre, 2012), one might speculate that rule-guided behavior depends on the functioning of different corticostriatal loops organized to handle different types of information. Thus, the caudate would contribute to select and activate the relevant single rules in coordination with more anterior frontal areas (middle frontal gyrus, VLPFC), while the putamen would select or “tag” the single rule to be evaluated first in coordination with more posterior frontal areas (premotor cortex).
Conclusions
Multivariate pattern recognition techniques were applied to fMRI data to assess how and where the human brain encodes complex rule sets. We found that human frontal cortex and striatum were involved in representing two independent features defining complex rule sets. Importantly, these features were encoded in different brain areas. This shows that the human brain represents complex rule sets by decomposing them in more elementary features. The constituents are then represented in brain structures appropriate for the type of information.
Footnotes
This work was supported by the German Bundesministerium für Bildung und Forschung (Grants 01GQ0411, 01GQ1001B, 01GQ1001C) and the Deutsche Forschungsgemeinschaft (GRK1589/1).
References
- Asaad WF, Rainer G, Miller EK. Task-specific neural activity in the primate prefrontal cortex. J Neurophysiol. 2000;84:451–459. doi: 10.1152/jn.2000.84.1.451. [DOI] [PubMed] [Google Scholar]
- Averbeck BB, Sohn JW, Lee D. Activity in prefrontal cortex during dynamic selection of action sequences. Nat Neurosci. 2006;9:276–282. doi: 10.1038/nn1634. [DOI] [PubMed] [Google Scholar]
- Badre D, D'Esposito M. Functional magnetic resonance imaging evidence for a hierarchical organization of the prefrontal cortex. J Cogn Neurosci. 2007;19:2082–2099. doi: 10.1162/jocn.2007.19.12.2082. [DOI] [PubMed] [Google Scholar]
- Badre D, Frank MJ. Mechanisms of hierarchical reinforcement learning in cortico-striatal circuits 2: evidence from fMRI. Cereb Cortex. 2012;22:527–536. doi: 10.1093/cercor/bhr117. [DOI] [PMC free article] [PubMed] [Google Scholar]
- Badre D, Kayser AS, D'Esposito M. Frontal cortex and the discovery of abstract action rules. Neuron. 2010;66:315–326. doi: 10.1016/j.neuron.2010.03.025. [DOI] [PMC free article] [PubMed] [Google Scholar]
- Baron SG, Osherson D. Evidence for conceptual combination in the left anterior temporal lobe. Neuroimage. 2011;55:1847–1852. doi: 10.1016/j.neuroimage.2011.01.066. [DOI] [PubMed] [Google Scholar]
- Bengtsson SL, Haynes JD, Sakai K, Buckley MJ, Passingham RE. The representation of abstract task rules in the human prefrontal cortex. Cereb Cortex. 2009;19:1929–1936. doi: 10.1093/cercor/bhn222. [DOI] [PMC free article] [PubMed] [Google Scholar]
- Bode S, Haynes JD. Decoding sequential stages of task preparation in the human brain. Neuroimage. 2009;45:606–613. doi: 10.1016/j.neuroimage.2008.11.031. [DOI] [PubMed] [Google Scholar]
- Boettiger CA, D'Esposito M. Frontal networks for learning and executing arbitrary stimulus–response associations. J Neurosci. 2005;25:2723–2732. doi: 10.1523/JNEUROSCI.3697-04.2005. [DOI] [PMC free article] [PubMed] [Google Scholar]
- Botvinick MM. Multilevel structure in behaviour and in the brain: a model of Fuster's hierarchy. Philos Trans R Soc Lond B Biol Sci. 2007;362:1615–1626. doi: 10.1098/rstb.2007.2056. [DOI] [PMC free article] [PubMed] [Google Scholar]
- Brovelli A, Laksiri N, Nazarian B, Meunier M, Boussaoud D. Understanding the neural computations of arbitrary visuomotor learning through fMRI and associative learning theory. Cereb Cortex. 2008;18:1485–1495. doi: 10.1093/cercor/bhm198. [DOI] [PubMed] [Google Scholar]
- Bunge SA, Zelazo PD. A brain-based account of the development of rule use in childhood. Curr Dir Psychol Sci. 2006;15:118–121. [Google Scholar]
- Bunge SA, Kahn I, Wallis JD, Miller EK, Wagner AD. Neural circuits subserving the retrieval and maintenance of abstract rules. J Neurophysiol. 2003;90:3419–3428. doi: 10.1152/jn.00910.2002. [DOI] [PubMed] [Google Scholar]
- Bunge SA, Wallis JD, editors. Neuroscience of rule-guided behavior. New York: Oxford UP; 2007. [Google Scholar]
- Christoff K, Keramatian K. Abstraction of mental representations: theoretical considerations and neuroscientific evidence. In: Bunge SA, Wallis JD, editors. Neuroscience of rule-guided behavior. New York: Oxford UP; 2007. pp. 107–126. [Google Scholar]
- Cohen MX, Lombardo MV, Blumenfeld RS. Covariance-based subdivision of the human striatum using T1-weighted MRI. Eur J Neurosci. 2008;27:1534–1546. doi: 10.1111/j.1460-9568.2008.06117.x. [DOI] [PubMed] [Google Scholar]
- Cole MW, Etzel JA, Zacks JM, Schneider W, Braver TS. Rapid transfer of abstract rules to novel contexts in human lateral prefrontal cortex. Front Hum Neurosci. 2011;5:142. doi: 10.3389/fnhum.2011.00142. [DOI] [PMC free article] [PubMed] [Google Scholar]
- Doll BB, Jacobs WJ, Sanfey AG, Frank MJ. Instructional control of reinforcement learning: a behavioral and neurocomputational investigation. Brain Res. 2009;1299:74–94. doi: 10.1016/j.brainres.2009.07.007. [DOI] [PMC free article] [PubMed] [Google Scholar]
- Donohue SE, Wendelken C, Crone EA, Bunge SA. Retrieving rules for behavior from long-term memory. Neuroimage. 2005;26:1140–1149. doi: 10.1016/j.neuroimage.2005.03.019. [DOI] [PubMed] [Google Scholar]
- Draganski B, Kherif F, Klöppel S, Cook PA, Alexander DC, Parker GJ, Deichmann R, Ashburner J, Frackowiak RS. Evidence for segregated and integrative connectivity patterns in the human basal ganglia. J Neurosci. 2008;28:7143–7152. doi: 10.1523/JNEUROSCI.1486-08.2008. [DOI] [PMC free article] [PubMed] [Google Scholar]
- Frank MJ. Computational models of motivated action selection in corticostriatal circuits. Curr Opin Neurobiol. 2011;21:381–386. doi: 10.1016/j.conb.2011.02.013. [DOI] [PubMed] [Google Scholar]
- Frank MJ, Badre D. Mechanisms of hierarchical reinforcement learning in corticostriatal circuits 1: computational analysis. Cereb Cortex. 2012;22:509–526. doi: 10.1093/cercor/bhr114. [DOI] [PMC free article] [PubMed] [Google Scholar]
- Friston KJ, Holmes A, Poline JB, Price CJ, Frith CD. Detecting activations in PET and fMRI: levels of inference and power. Neuroimage. 1996;4:223–235. doi: 10.1006/nimg.1996.0074. [DOI] [PubMed] [Google Scholar]
- Genovesio A, Brasted PJ, Mitz AR, Wise SP. Prefrontal cortex activity related to abstract response strategies. Neuron. 2005;47:307–320. doi: 10.1016/j.neuron.2005.06.006. [DOI] [PMC free article] [PubMed] [Google Scholar]
- Graybiel AM. Habits, rituals, and the evaluative brain. Annu Rev Neurosci. 2008;31:359–387. doi: 10.1146/annurev.neuro.29.051605.112851. [DOI] [PubMed] [Google Scholar]
- Haber SN. The primate basal ganglia: parallel and integrative networks. J Chem Neuroanat. 2003;26:317–330. doi: 10.1016/j.jchemneu.2003.10.003. [DOI] [PubMed] [Google Scholar]
- Hayasaka S, Phan KL, Liberzon I, Worsley KJ, Nichols TE. Nonstationary cluster-size inference with random field and permutation methods. Neuroimage. 2004;22:676–687. doi: 10.1016/j.neuroimage.2004.01.041. [DOI] [PubMed] [Google Scholar]
- Haynes JD, Rees G. Decoding mental states from brain activity in humans. Nat Rev Neurosci. 2006;7:523–534. doi: 10.1038/nrn1931. [DOI] [PubMed] [Google Scholar]
- Haynes JD, Sakai K, Rees G, Gilbert S, Frith C, Passingham RE. Reading hidden intentions in the human brain. Curr Biol. 2007;17:323–328. doi: 10.1016/j.cub.2006.11.072. [DOI] [PubMed] [Google Scholar]
- Henson R. Analysis of fMRI time series. In: Frackowiak RSJ, Friston KJ, Frith CD, Dolan RJ, Price CJ, Zeki S, Ashburner JT, Penny WD, editors. Human brain function. second edition. London: Academic; 2004. pp. 793–822. [Google Scholar]
- Hoshi E, Shima K, Tanji J. Task-dependent selectivity of movement-related neuronal activity in the primate prefrontal cortex. J Neurophysiol. 1998;80:3392–3397. doi: 10.1152/jn.1998.80.6.3392. [DOI] [PubMed] [Google Scholar]
- Jin DZ, Fujii N, Graybiel AM. Neural representation of time in cortico-basal ganglia circuits. Proc Natl Acad Sci U S A. 2009;106:19156–19161. doi: 10.1073/pnas.0909881106. [DOI] [PMC free article] [PubMed] [Google Scholar]
- Kamitani Y, Tong F. Decoding the visual and subjective contents of the human brain. Nat Neurosci. 2005;8:679–685. doi: 10.1038/nn1444. [DOI] [PMC free article] [PubMed] [Google Scholar]
- Kellenbach ML, Brett M, Patterson K. Actions speak louder than functions: the importance of manipulability and action in tool representation. J Cogn Neurosci. 2003;15:30–46. doi: 10.1162/089892903321107800. [DOI] [PubMed] [Google Scholar]
- Kiebel SJ, Poline JB, Friston KJ, Holmes AP, Worsley KJ. Robust smoothness estimation in statistical parametric maps using standardized residuals from the general linear model. Neuroimage. 1999;10:756–766. doi: 10.1006/nimg.1999.0508. [DOI] [PubMed] [Google Scholar]
- Koechlin E, Summerfield C. An information theoretical approach to prefrontal executive function. Trends Cogn Sci. 2007;11:229–235. doi: 10.1016/j.tics.2007.04.005. [DOI] [PubMed] [Google Scholar]
- Koechlin E, Ody C, Kouneiher F. The architecture of cognitive control in the human prefrontal cortex. Science. 2003;302:1181–1185. doi: 10.1126/science.1088545. [DOI] [PubMed] [Google Scholar]
- Kriegeskorte N, Goebel R, Bandettini P. Information-based functional brain mapping. Proc Natl Acad Sci U S A. 2006;103:3863–3868. doi: 10.1073/pnas.0600244103. [DOI] [PMC free article] [PubMed] [Google Scholar]
- Kubota Y, Liu J, Hu D, DeCoteau WE, Eden UT, Smith AC, Graybiel AM. Stable encoding of task structure coexists with flexible coding of task events in sensorimotor striatum. J Neurophysiol. 2009;102:2142–2160. doi: 10.1152/jn.00522.2009. [DOI] [PMC free article] [PubMed] [Google Scholar]
- Leber AB, Turk-Browne NB, Chun MM. Neural predictors of moment-to-moment fluctuations in cognitive flexibility. Proc Natl Acad Sci U S A. 2008;105:13592–13597. doi: 10.1073/pnas.0805423105. [DOI] [PMC free article] [PubMed] [Google Scholar]
- Leh SE, Ptito A, Chakravarty MM, Strafella AP. Fronto-striatal connections in the human brain: a probabilistic diffusion tractography study. Neurosci Lett. 2007;419:113–118. doi: 10.1016/j.neulet.2007.04.049. [DOI] [PMC free article] [PubMed] [Google Scholar]
- Mahon BZ, Caramazza A. Concepts and categories: a cognitive neuropsychological perspective. Annu Rev Psychol. 2009;60:27–51. doi: 10.1146/annurev.psych.60.110707.163532. [DOI] [PMC free article] [PubMed] [Google Scholar]
- Martin A. The representation of object concepts in the brain. Annu Rev Psychol. 2007;58:25–45. doi: 10.1146/annurev.psych.57.102904.190143. [DOI] [PubMed] [Google Scholar]
- Mion M, Patterson K, Acosta-Cabronero J, Pengas G, Izquierdo-Garcia D, Hong YT, Fryer TD, Williams GB, Hodges JR, Nestor PJ. What the left and right anterior fusiform gyri tell us about semantic memory. Brain. 2010;133:3256–3268. doi: 10.1093/brain/awq272. [DOI] [PubMed] [Google Scholar]
- Momennejad I, Haynes JD. Human anterior prefrontal cortex encodes the ‘what’ and ‘when’ of future intentions. Neuroimage. 2012;61:139–148. doi: 10.1016/j.neuroimage.2012.02.079. [DOI] [PubMed] [Google Scholar]
- Muhammad R, Wallis JD, Miller EK. A comparison of abstract rules in the prefrontal cortex, premotor cortex, inferior temporal cortex, and striatum. J Cogn Neurosci. 2006;18:974–989. doi: 10.1162/jocn.2006.18.6.974. [DOI] [PubMed] [Google Scholar]
- Müller KR, Mika S, Rätsch G, Tsuda K, Schölkopf B. An introduction to kernel-based learning algorithms. IEEE Trans Neural Netw. 2001;12:181–201. doi: 10.1109/72.914517. [DOI] [PubMed] [Google Scholar]
- Mushiake H, Saito N, Sakamoto K, Itoyama Y, Tanji J. Activity in the lateral prefrontal cortex reflects multiple steps of future events in action plans. Neuron. 2006;50:631–641. doi: 10.1016/j.neuron.2006.03.045. [DOI] [PubMed] [Google Scholar]
- Norman KA, Polyn SM, Detre GJ, Haxby JV. Beyond mind-reading: multi-voxel pattern analysis of fMRI data. Trends Cogn Sci. 2006;10:424–430. doi: 10.1016/j.tics.2006.07.005. [DOI] [PubMed] [Google Scholar]
- Pasupathy A, Miller EK. Different time courses of learning-related activity in the prefrontal cortex and striatum. Nature. 2005;433:873–876. doi: 10.1038/nature03287. [DOI] [PubMed] [Google Scholar]
- Patterson K, Nestor PJ, Rogers TT. Where do you know what you know? The representation of semantic knowledge in the human brain. Nat Rev Neurosci. 2007;8:976–987. doi: 10.1038/nrn2277. [DOI] [PubMed] [Google Scholar]
- Pereira F, Mitchell T, Botvinick M. Machine learning classifiers and fMRI: a tutorial overview. Neuroimage. 2009;45:S199–S209. doi: 10.1016/j.neuroimage.2008.11.007. [DOI] [PMC free article] [PubMed] [Google Scholar]
- Pobric G, Jefferies E, Lambon Ralph MA. Category-specific versus category-general semantic impairment induced by transcranial magnetic stimulation. Curr Biol. 2010;20:964–968. doi: 10.1016/j.cub.2010.03.070. [DOI] [PMC free article] [PubMed] [Google Scholar]
- Poldrack RA, Packard MG. Competition among multiple memory systems: converging evidence from animal and human brain studies. Neuropsychologia. 2003;41:245–251. doi: 10.1016/s0028-3932(02)00157-4. [DOI] [PubMed] [Google Scholar]
- Ragozzino ME. The contribution of the medial prefrontal cortex, orbitofrontal cortex, and dorsomedial striatum to behavioral flexibility. Ann N Y Acad Sci. 2007;1121:355–375. doi: 10.1196/annals.1401.013. [DOI] [PubMed] [Google Scholar]
- Reverberi C, Bonatti LL, Frackowiak RS, Paulesu E, Cherubini P, Macaluso E. Large scale brain activations predict reasoning profiles. Neuroimage. 2012a;59:1752–1764. doi: 10.1016/j.neuroimage.2011.08.027. [DOI] [PubMed] [Google Scholar]
- Reverberi C, Görgen K, Haynes JD. Compositionality of Rule Representations in Human Prefrontal Cortex. Cereb Cortex. 2012b;22:1237–1246. doi: 10.1093/cercor/bhr200. [DOI] [PubMed] [Google Scholar]
- Rowe JB, Sakai K, Lund TE, Ramsøy T, Christensen MS, Baare WF, Paulson OB, Passingham RE. Is the prefrontal cortex necessary for establishing cognitive sets? J Neurosci. 2007;27:13303–13310. doi: 10.1523/JNEUROSCI.2349-07.2007. [DOI] [PMC free article] [PubMed] [Google Scholar]
- Sakai K, Passingham RE. Prefrontal interactions reflect future task operations. Nat Neurosci. 2003;6:75–81. doi: 10.1038/nn987. [DOI] [PubMed] [Google Scholar]
- Sakai K, Passingham RE. Prefrontal set activity predicts rule-specific neural processing during subsequent cognitive performance. J Neurosci. 2006;26:1211–1218. doi: 10.1523/JNEUROSCI.3887-05.2006. [DOI] [PMC free article] [PubMed] [Google Scholar]
- Toni I, Rushworth MF, Passingham RE. Neural correlates of visuomotor associations. Spatial rules compared with arbitrary rules. Exp Brain Res. 2001;141:359–369. doi: 10.1007/s002210100877. [DOI] [PubMed] [Google Scholar]
- Tzourio-Mazoyer N, Landeau B, Papathanassiou D, Crivello F, Etard O, Delcroix N, Mazoyer B, Joliot M. Automated anatomical labeling of activations in SPM using a macroscopic anatomical parcellation of the MNI MRI single-subject brain. Neuroimage. 2002;15:273–289. doi: 10.1006/nimg.2001.0978. [DOI] [PubMed] [Google Scholar]
- Visser M, Jefferies E, Lambon Ralph MA. Semantic processing in the anterior temporal lobes: a meta-analysis of the functional neuroimaging literature. J Cogn Neurosci. 2010;22:1083–1094. doi: 10.1162/jocn.2009.21309. [DOI] [PubMed] [Google Scholar]
- Wallis JD, Anderson KC, Miller EK. Single neurons in prefrontal cortex encode abstract rules. Nature. 2001;411:953–956. doi: 10.1038/35082081. [DOI] [PubMed] [Google Scholar]
- White IM, Wise SP. Rule-dependent neuronal activity in the prefrontal cortex. Exp Brain Res. 1999;126:315–335. doi: 10.1007/s002210050740. [DOI] [PubMed] [Google Scholar]
- Woolgar A, Thompson R, Bor D, Duncan J. Multi-voxel coding of stimuli, rules, and responses in human frontoparietal cortex. Neuroimage. 2011;56:744–752. doi: 10.1016/j.neuroimage.2010.04.035. [DOI] [PubMed] [Google Scholar]
- Worsley KJ, Marrett S, Neelin P, Vandal AC, Friston KJ, Evans AC. A unified statistical approach for determining significant signals in images of cerebral activation. Hum Brain Mapp. 1996;4:58–73. doi: 10.1002/(SICI)1097-0193(1996)4:1<58::AID-HBM4>3.0.CO;2-O. [DOI] [PubMed] [Google Scholar]
- Yin HH. The sensorimotor striatum is necessary for serial order learning. J Neurosci. 2010;30:14719–14723. doi: 10.1523/JNEUROSCI.3989-10.2010. [DOI] [PMC free article] [PubMed] [Google Scholar]
- Yin HH, Knowlton BJ. The role of the basal ganglia in habit formation. Nat Rev Neurosci. 2006;7:464–476. doi: 10.1038/nrn1919. [DOI] [PubMed] [Google Scholar]