

Abstract
Leptin is an adipocyte-derived hormone that controls energy balance by acting primarily in the CNS, but its action is lost in common forms of obesity due to central leptin resistance. One potential mechanism for such leptin resistance is an increased hypothalamic expression of Suppressor of cytokine signaling 3 (Socs3), a feedback inhibitor of the Jak-Stat pathway that prevents Stat3 activation. Ample studies have confirmed the important role of Socs3 in leptin resistance and obesity. However, the degree to which Socs3 participates in the regulation of energy homeostasis in nonobese conditions remains largely undetermined. In this study, using adult mice maintained under standard diet, we demonstrate that Socs3 deficiency in the mediobasal hypothalamus (MBH) reduces food intake, protects against body weight gain, and limits adiposity, suggesting that Socs3 is necessary for normal body weight maintenance. Mechanistically, MBH Socs3-deficient mice display increased hindbrain sensitivity to endogenous, meal-related satiety signals, mediated by oxytocin signaling. Thus, oxytocin signaling likely mediates the effect of hypothalamic leptin on satiety circuits of the caudal brainstem. This provides an anatomical substrate for the effect of leptin on meal size, and more generally, a mechanism for how the brain controls short-term food intake as a function of the energetic stores available in the organism to maintain energy homeostasis. Any dysfunction in this pathway could potentially lead to overeating and obesity.
Introduction
Leptin is an adipocyte-derived hormone that acts in the CNS to control energy homeostasis, but its effects are lost in common forms of obesity due to central leptin resistance (Münzberg and Myers, 2005). One potential mechanism for such leptin resistance is an increased hypothalamic expression of Suppressor of cytokine signaling 3 (Socs3), a feedback inhibitor of the Jak-Stat pathway normally activated by leptin signaling (Münzberg et al., 2004; Münzberg and Myers, 2005; Howard and Flier, 2006). Accordingly, hypothalamic overexpression of Socs3 triggers leptin resistance and obesity (Reed et al., 2010), whereas Socs3 deficiency improves leptin sensitivity and attenuates obesity in mice fed a high-fat diet (Howard et al., 2004; Mori et al., 2004; Kievit et al., 2006).
Despite its important role in leptin resistance and obesity, the degree to which Socs3 participates in the regulation of energy homeostasis in nonobese animals is still largely unresolved. Indeed, Socs3-deficient mice not exposed to a high-fat diet display very limited metabolic phenotype, and more surprisingly, body weight homeostasis is not altered despite increased leptin sensitivity (Howard et al., 2004; Mori et al., 2004; Kievit et al., 2006; Zhang et al., 2008; Briancon et al., 2010). As this could be due to compensatory mechanisms inherent to the genetic models (Bouret et al., 2004, 2012; Reed et al., 2010), whether endogenous leptin efficiently protects against body weight gain in nonobese animals remains undetermined. Resolving this issue is crucial for understanding the role of central leptin resistance in the pathogenesis of obesity (Morton et al., 2006).
Here, we used a conditional genetic system to permanently inactivate Socs3 in adult mice, through stereotaxic delivery of recombinant adenoviruses targeting the mediobasal hypothalamus (MBH), a key hypothalamic region enriched in leptin-responsive neurons. We show that when maintained under standard diet, mutant mice display a lean phenotype accompanied by increased leptin sensitivity and reduced food intake, suggesting that MBH Socs3 participates in body weight homeostasis in standard conditions. Further investigations revealed that MBH Socs3 deficiency increases the response to endogenous, meal-related satiety signals, thus providing a mechanism for the reduced food intake.
We also sought to determine which neuronal substrate might relay MBH leptin signaling to long-distance satiety circuits of the caudal brainstem (for review, see Grill, 2010). Previous studies proposed that a subset of hypothalamic oxytocin neurons located in the paraventricular nucleus and projecting to the nucleus tractus solitarius (NTS) could relay the leptin signal (Blevins et al., 2004), as recently shown for other metabolic cues (Blouet et al., 2009; Maejima et al., 2009). Oxytocin was also implicated in the pathogenesis or attenuation of obesity in rodent models (Deblon et al., 2011; Zhang and Cai, 2011; Zhang et al., 2011; Morton et al., 2012), further supporting a possible link with leptin. Here, we find that hindbrain oxytocin signaling mediates the increased response to satiety signals in MBH Socs3-deficient mice, strengthening the idea that oxytocin is a downstream mediator of hypothalamic leptin. Oxytocin could thus exert anti-obesity effects by circumventing leptin resistance.
Materials and Methods
Animals.
Colonies of Socs3Lox/Lox and ROSA26R mice were maintained on a C57BL/6J background and genotyped according to published protocols (Soriano, 1999; Mori et al., 2004). Before virus injections, male mice were transferred to a BSL-2 facility, and individually housed at 21 ± 2°C, with 12 h light/dark cycle (07:00 h lights on). Mice had ad libitum access to standard diet (Harlan Teklad 2018, containing 18% kcal from fat; 24% kcal from protein; 58% kcal from carbohydrate) and water throughout the study, except as noted. All procedures conformed to the Guide for the Care and Use of Laboratory Animals (N.R.C., 1996), and the European Communities Council Directive of September 22, 2010 (2010/63/EU). Experimental protocols were performed in compliance with institutional Ethical Committee guidelines for animal research (accreditations no. C13–055-6 and C13–055-8) and with the French Genetic Council guidelines (agreement no. 4968). All surgery was performed under xylazine/ketamine anesthesia, and every effort was made to minimize the number of animals used and their suffering.
Drugs.
Devazepide (Tocris Bioscience), an antagonist of CCK-A receptors, was first dissolved in dimethylsulfoxide (DMSO), then further diluted in sterile saline (0.9% NaCl) containing 5% DMSO and 5% Tween 80 (both from Sigma-Aldrich). The selective oxytocin receptor antagonist SSR126768A was obtained from C. Serradeil-Le Gal (Sanofi-Synthélabo Recherche, Toulouse, France), dissolved in 100% ethanol, and further diluted in sterile saline to a final concentration of 0.2% ethanol. Sulfated cholecystokinin (CCK-8S; Tocris Bioscience) was dissolved in sterile saline. Murine leptin (Peprotech) was dissolved in sterile, distilled water (1 mg/ml).
Depending on the experiments, we used various doses of recombinant leptin. Since we anticipated that MBH-selective inactivation of Socs3 might increase leptin sensitivity, we used minimal doses of exogenous leptin (1 mg/kg or less). This was expected to limit stimulation of leptin signaling in control animals, thereby allowing better detection of enhanced leptin sensitivity when Socs3 is inactivated. In details, for immunohistochemical examination of leptin signaling, leptin was injected at 1 mg/kg, a dose that produces significant but submaximal Stat3 activation in the hypothalamus (Faouzi et al., 2007). In vivo leptin sensitivity on food intake was assessed with 1 mg/kg leptin, administered twice daily (Mori et al., 2004). To study the synergy with CCK (for review, see Grill, 2010), we used a lower dose of leptin (0.5 mg/kg) that had no effect by itself on food intake. Finally, a high dose of leptin (3.5 mg/kg) was used in biochemical analyzes, including detection of Socs3 by Western blot and measurement of mature oxytocin tissue content by enzyme immunoassay, to achieve sufficient assay sensitivity (Mori et al., 2004).
Bilateral virus injections in the MBH.
Male mice at the age of 12–14 weeks were anesthetized with ketamine (120 mg/kg) and xylazine (10 mg/kg), and placed in a stereotaxic apparatus (World Precision Instruments) in flat skull position. After shaving and exposing the skull, a square window (2 × 2 mm) centered at −1.4 mm posterior to bregma was carefully drilled across the midline. Care was taken to avoid damaging the underlying brain tissue and vasculature, and residual bone fragments were removed with fine forceps. A dual injection cannula, built by gluing together, 0.7 mm apart, two cannulae obtained from a Brain Infusion Kit 3 (30 gauge tubing; Alzet), was used to inject both sides of the MBH in a single procedure. Each cannula was connected through tubing to a 5 μl Hamilton placed in a syringe pump (Carnegie Medicin). Recombinant adenovirus encoding Cre recombinase (Ad-Cre; 1012 pfu/ml) was obtained from the Gene Transfer Vector Core at the University of Iowa. For virus injections, cannulae, tubing, and syringes were first filled with sterile 0.9% saline. A volume of 1 μl was then pushed out of the syringes, and the plungers were withdrawn so that 500 nl of air was introduced in the tubing. Then, 500 nl of Ad-Cre was loaded into each cannula and tubing. The dual cannula was carefully centered above the exposed midline, so that each cannula was placed 0.3–0.4 mm lateral to the midline, at −1.4 mm posterior to bregma. Cannulae were then slowly lowered into the brain to reach −6.0 mm from the skull, and each side of the MBH received 500 nl of Ad-Cre, infused at 100 nl/min. The cannulae were left in place for another 10–15 min, before being carefully retracted. After the injection, the skin was sutured with veterinary glue and animals were returned to their cages. For postsurgical recovery, animals were left on a heating pad (AgnTho's AB) and received daily intraperitoneal injections of sterile NaCl 0.9% (1 ml) for 3–4 d. Food pellets were made available on the bottom of the cage for 8–10 d after surgery. Correct bilateral targeting of the MBH using the above procedure in independent sets of mice was verified on postmortem tissue by analyzing each brain at the histological level. In ROSA26R mice, we used X-gal staining or β-galactosidase (β-gal) immunohistochemistry to reveal Cre-mediated recombination events, as described below. In Socs3Lox/Lox and wild-type (WT) mice used for the behavioral studies and killed 12–14 months after adenovirus delivery, we first confirmed that cannula tracks were located in the expected brain regions in all animals. In half of these animals, we further quantified leptin-induced neuronal activation of Stat3 in the MBH, revealed by phospho(Y705)-Stat3 (pStat3) immunohistochemistry as described below, as an indicator of Socs3 deficiency.
Fourth ventricle cannulation.
Six months after Ad-Cre delivery in the MBH (see above), mice were anesthetized with ketamine (120 mg/kg) and xylazine (10 mg/kg), and placed in a stereotaxic apparatus (World Precision Instruments) in flat skull position. After shaving and exposing the skull, a small hole was drilled at +1.0 mm anterior to the occipital suture and on the midline. A chronic guide cannula (26 gauge; Plastics One) was then lowered through the cerebellum up to −3.3 mm from the skull, placing the tip of the guide cannula ∼0.6–0.7 mm above the fourth ventricle. The guide cannula was fixed to the skull with dental cement, and obturated with a dummy cannula (Plastics One). After the surgery, the skin was sutured with veterinary glue and animals were returned to their cages. Fourth ventricular injections were performed using an injector extending 1.0 mm below the tip of the guide cannula (Plastics One) and connected to a 1.0 ml syringe placed in a syringe pump (KD Scientific). Before injections, the syringe and tubing were filled with sterile saline. A small air bubble was then introduced through the injector by withdrawing the syringe plunger, followed by 1 μl of the solution to be injected. The injector was then introduced in the guide cannula and sealed. The injection itself was performed over a 2–3 min period. For habituation and to prevent cannula obturation, mice were injected with sterile saline every 48 h for 3 weeks, starting 1 week after surgery. Fourth ventricle cannula placement was functionally verified by measuring the hyperglycemic response to central glucopenia. Animals received an injection of 2-deoxyglucose (Sigma) in the fourth ventricle (0.5–0.75 mg of 2-deoxyglucose dissolved in 1 μl of sterile saline), and glycemia was measured 45 min after injection with a glucometer (Accu-Check Active; Roche). Only animals responding with at least a 2 mm rise in glycemia were included in the experiments. Postmortem analyses of each brain at the histological level also confirmed fourth ventricle cannula placement at the end of the experiments.
Food intake and body weight measurements.
For the first 3 months after Ad-Cre delivery, body weight and 24 h food intake were recorded daily (at 18:00 h). Food intake was recorded by weighing food left in the hanging compartment, the bottom of each cage being systematically inspected for food debris. Mice were then habituated to daily handling and intraperitoneal injection of sterile saline (10 μl/g) for at least 3 weeks before starting other studies.
For short-term, nocturnal food intake measurements, mice were fasted for a total of 70–90 min. Beginning 30–40 min before lights off, body weight was determined, and food was removed from each cage, weighed, and placed in individual containers attributed to each animal. Counterbalanced devazepide (1 mg/kg; i.p.) or vehicle injections began 40–50 min after lights off, and food was immediately returned to the animals. Injections were repeated every 72 h, each animal being tested for devazepide or vehicle at least twice. Values for each animal were then averaged. Counterbalanced fourth ventricle (4V) injections of SSR126768A or vehicle were initiated 15–20 min before lights off, and food was returned 40–50 min after lights off. Injections were repeated every 6 d, each animal being tested for SSR126768A or vehicle at least twice. Values for each animal were then averaged. Between treatments, mice received a 4V injection of sterile saline every 2 d. Food intake was recorded at 2 h, by weighing food left in the hanging compartment, the bottom of each cage being systematically inspected for food debris under red light illumination.
Counterbalanced combined treatment with CCK (2 μg/kg) and leptin (0.5 mg/kg) was given to mice that had fasted overnight (16–18 h). Animals were pretreated intraperitoneally with leptin 90 min before CCK administration. Food was immediately returned to each mouse after CCK injection, and food intake was recorded after 30 min. Injections were repeated every 7 d, each mouse receiving either one of the available treatments (Veh/Veh; CCK/Veh; Veh/Lep; CCK/Lep).
Glucose tolerance test.
An intraperitoneal bolus of glucose (1.5 g/kg) dissolved in sterile saline was injected into mice 4 months after Ad-Cre delivery, after a 6 h fast, food being removed at 09:00 h. Blood glucose was measured in tail vein samples with a glucometer (AccuCheck Active; Roche) at the indicated time points after glucose injection.
Leptin sensitivity.
The effect of leptin on 24 h food intake was tested on mice 9 months after Ad-Cre delivery, by injecting leptin (1 mg/kg; i.p.) twice daily at 10:00 h and 18:00 h for 2 d. Food intake was measured every 24 h (at 18:00 h). Baseline 24 h food intake after vehicle injections was obtained by averaging values obtained over the 5 d preceding the initiation of leptin treatment.
Tissue collection.
For collection of MBH or dorsal vagal complex (DVC) samples, mice were killed by decapitation between 10:00 A.M. and 12:00 P.M. The brain was quickly removed and immerged in ice-cold, sterile PBS 0.1 m, pH 7.4. Meninges were removed with fine forceps, and 0.5-mm-thick slices were cut using a Vibroslice (Campden Instruments). Slices were transferred onto cold 2% agarose plates, and regions of interest were removed using scalpel blades under dissecting binoculars, transferred into 1.5 ml Eppendorf tubes, and snap-frozen into liquid nitrogen. Samples were stored in −80°C freezer until further processing.
Collection of white adipose tissue fat pads (epididymal, retroperitoneal, and inguinal) was performed in mice that received lethal anesthesia just before intracardiac perfusion (see below). Fat pads were collected and weighed, and adiposity was calculated by dividing fat pad mass by body weight for each animal.
Western blot analyses.
Mice were fasted overnight and killed 5 h after an injection of vehicle or leptin (3.5 mg/kg; i.p.). MBH samples were homogenized on ice during 15 min in 50 μl radioimmunoprecipitation assay lysis buffer (Pierce) with added protease inhibitor mixture and phosphatase inhibitors (Sigma). Samples were then sonicated, centrifuged for 10 min at 12,000 g, 4°C, and supernatants were collected and diluted twice in Laemmli buffer. Total sample for each animal was loaded into 10% SDS-PAGE gels. Proteins were transferred onto polyvinylidene difluoride membranes using transfer buffer (50 mm Tris, 20 mm glycine, 10% ethanol). Membranes were then blocked in 20 mm Tris buffer, pH 7.4, containing 5% bovine serum albumin and 0.1% Tween 20 and incubated with a rabbit polyclonal anti-Socs3 antibody (1:1000; Cell Signaling Technology) overnight at 4°C. Membranes were then washed three times and incubated 2 h with anti-rabbit horseradish peroxidase (HRP)-conjugated secondary antibodies (1:2000; DAKO), washed again, developed by enhanced chemiluminescence (ECL substrate; Pierce), and exposed to Kodak BioMax films. Equal loading and transfer were verified using a mouse monoclonal anti-β-actin antibody (1:5000; Sigma-Aldrich) followed by anti-mouse HRP-conjugated secondary antibody (1:2000; DAKO). Autoradiographic films were scanned and band intensity from the generated digital images was measured using ImageJ (W.S. Rasband, U.S. National Institutes of Health, Bethesda, Maryland; http://imagej.nih.gov/ij/). β-actin levels were used for normalization of Socs3 levels.
Oxytocin enzyme immunoassay.
Mice were fasted overnight and killed 5 h after an injection of vehicle or leptin (3.5 mg/kg; i.p.). The DVC samples were processed as described previously (Schaller et al., 2010). Quantification of mature oxytocin content was performed by enzyme immunoassay analyses, according to the manufacturer's instructions (Phoenix Pharmaceuticals).
Tissue processing and histology.
Mice were transcardially perfused with cold 0.1 m phosphate buffer (PB), pH 7.4, followed by fresh, cold 4% paraformaldehyde in PB. Brains were removed and fixed for another 2–3 h, washed overnight in PB at 4°C, then immersed in PB containing 20% sucrose for 48 h before being frozen in chilled isopentane at −28°C. Coronal brain sections (20 μm) were cut with a cryostat (model CM3050; Leica) and collected on Superfrost Plus slides (Fisher Scientific).
To reveal β-gal activity, tissue sections were incubated in 5 mm potassium ferrocyanide, 5 mm potassium ferricyanide, 2 mm MgCl2, and 1 mg/ml X-gal (Eurogentec) overnight at 37°C.
For immunohistochemical staining, we used rabbit anti-β-gal (1:4000; Cappel), mouse anti-HuC/D (1:100; Life Technologies), and rabbit anti-pStat3 (1:100; Cell Signaling Technology) antibodies. pStat3 staining required heat-mediated antigen retrieval, using boiling citrate buffer 0.1 m, pH 6.0, for 30 min. Sections were then incubated in species-specific secondary antibodies conjugated to Alexa Fluor 488 or 568 (Life Technologies).
Quantification of pStat3-positive nuclei.
Twelve months after Ad-Cre delivery, mice were fasted overnight (16–18 h) and perfused 3 h after vehicle or leptin injection (1 mg/kg; i.p.). Sections were labeled with anti-HuC/D and anti-pStat3 antibodies, and nuclei were stained with DAPI. Neuronal nuclei positive for pStat3 staining were quantified in the MBH by an observer blind from the experimental conditions, using an Olympus microscope. Three to four sections chosen near the Ad-Cre injection site with visible cannula tracks were averaged per animal.
Statistical analysis.
All results are presented as mean ± SEM. Statistical analyses were performed using Prism version 5.0b (GraphPad Software). Two-tailed, Mann–Whitney test was used for simple comparisons between two groups. Food intake measurements were analyzed using two-way, repeated-measures ANOVA, and oxytocin levels were analyzed using two-way ANOVA. Post hoc analyses were performed using Bonferroni multiple-comparison test. Differences were considered significant if p < 0.05.
Results
Efficiency of Cre-mediated recombination in the MBH
To inactivate Socs3 selectively in the MBH, we stereotaxically injected an adenovirus expressing Cre recombinase (Ad-Cre) into adult mice carrying floxed Socs3 alleles (Socs3lox/lox mice) (Mori et al., 2004). This strategy was used in an effort to minimize potential compensatory mechanisms that could occur when genes are inactivated during development, particularly when studying leptin signaling (Bouret et al., 2004, 2012; Reed et al., 2010).
We first performed preliminary studies to define optimal experimental procedures for bilateral delivery of Ad-Cre into the adult mouse MBH, using 3-month old, male ROSA26 reporter mice (Soriano, 1999) that received injections of various volumes of Ad-Cre. In these mice, Cre recombinase induces the expression of LacZ, so that the extent of Cre-mediated recombination is easily visualized by β-gal immunohistochemistry. We found that injecting 500 nl of Ad-Cre on each side of the MBH produced extensive β-gal staining, while allowing subjects to recover quickly from the surgery.
In these conditions, widespread Cre-mediated recombination was visualized bilaterally in the vicinity of the third ventricle, in regions comprising the arcuate nucleus of the hypothalamus (ARC), the ventromedial hypothalamus (VMH), and the dorsomedial hypothalamus (DMH) (Fig. 1A). Most cells expressing β-gal were identified as neurons, by dual staining with Hu C/D, a neuronal marker (Fig. 1A). Adjacent brain areas were largely devoid of staining. In regions more rostral to the injection site, such as the paraventricular nucleus of the hypothalamus (PVN), β-gal staining was virtually absent (Fig. 1A), indicating that the diffusion of the virus was limited to the site of injection. Furthermore, no recombination was detected in distant brain regions, including the NTS (data not shown). Such pattern of β-gal staining was reproducibly observed on four of five brains processed for histological examination after Ad-Cre delivery.
Figure 1.

Efficiency of Cre-mediated recombination and validation of functional Socs3 inactivation. A, Representative pictures showing typical β-gal immunohistochemical staining (red) obtained 2 weeks after Ad-Cre delivery in the MBH of 3-month-old, ROSA26R male mice. Cre-mediated recombination is extensively detected in Hu C/D-positive neurons (green) in the ARC, VMH, and DMH (top). However, virtually no β-gal staining is detected in the PVN (bottom). 3V, 3rd ventricle; AHP, anterior hypothalamic area, posterior part; DM, dorsomedial hypothalamic nucleus; ME, median eminence; VMHDM, dorsomedial part of the VMH; VMHVL, ventrolateral part of the VMH. B, Neurons transduced with Ad-Cre in the MBH show leptin-induced Stat3 Y705-phosphorylation (pStat3, brown) in mice injected with leptin (1 mg/kg; i.p.) and perfused 1 h later. Transduced neurons were also stained with X-gal (blue) to reveal β-gal activity. C, D, Western blot analyses of Socs3 and β-actin in MBH lysates of WT and Socs3ΔMBH mice. Mice were fasted overnight and tissues were processed 5 h after vehicle (Veh) or leptin injection (3.5 mg/kg; i.p.). Each lane in C represents one animal. In D, Socs3 expression normalized to β-actin levels, quantified by densitometry (n = 6–8 animal per group). Data are mean ± SEM **p = 0.004, Mann–Whitney test. NS, nonsignificant. Scale bars: 100 μm.
We also checked that MBH neurons transduced with Ad-Cre could still respond to leptin. For this experiment, we examined the expression of phospho(Y705)-Stat3 (pStat3), a marker of leptin-responsive neurons, 1 h after exogenous, intraperitoneal leptin injection (1 mg/kg). Dual staining revealed that 30–50% of the neurons responsive to leptin also expressed β-gal (Fig. 1B). Thus, this approach produces extensive Cre-mediated recombination that is restricted to regions of the adult mouse MBH, and is highly selective for neurons, including neurons that respond to leptin.
Functional Socs3 inactivation in the MBH
To investigate whether delivery of Ad-Cre to the MBH of Socs3lox/lox adult mice could alter leptin signaling, we generated a first cohort of experimental animals. As controls, we used WT mice from the colony that also received Ad-Cre injections. Six to 12 weeks after viral delivery, mice were fasted overnight to deplete endogenous leptin, and received an injection of either vehicle or exogenous leptin (3.5 mg/kg; i.p.). The MBH was then collected 5 h later, and processed for Western blot analysis of Socs3 (Fig. 1C).
Consistent with previous studies (Bjørbaek et al., 1998; Howard et al., 2004; Mori et al., 2004), we found that leptin treatment in WT animals induced a significant twofold increase in Socs3 expression compared with the vehicle-treated group (Fig. 1D; p = 0.004, Mann–Whitney test). In contrast, although basal Socs3 levels were not altered in vehicle-treated mice when comparing both genotypes, the typical Socs3 induction observed in response to exogenous leptin was completely abolished in Socs3lox/lox mice (Fig. 1D; p = 0.48, Mann–Whitney test). The residual Socs3 expression observed in vehicle-treated Socs3lox/lox mice is likely explained by the high proportion of nonrecombined cells in the tissue sample collected for Western blot analysis, compared with the relatively low proportion of cells transduced with Ad-Cre (Fig. 1B). Nevertheless, the lack of Socs3 response to leptin injection in adult Socs3lox/lox mice that received Ad-Cre in the MBH demonstrates impaired leptin-induced Socs3 expression, and confirms the functional alteration of leptin signaling. These mice are thus further designated as Socs3ΔMBH mice in the studies below.
Socs3ΔMBH mice display a lean phenotype associated with reduced food intake
We then investigated whether MBH Socs3 deficiency could produce a metabolic phenotype. We generated two independent cohorts of WT and Socs3ΔMBH mice, all injected with Ad-Cre at 10–14 weeks of age. Mice were fed ad libitum with a standard diet providing 18% kcal from fat, and each cohort was studied for >12 months.
Before Ad-Cre delivery, body weight and food intake were similar in both genotypes (Fig. 2A,B). Surgery induced an initial decrease in body weight of the same amplitude in WT and Socs3ΔMBH mice, after which body weight slowly began to recover toward presurgery values, without any difference observed between genotypes for up to 5 weeks after Ad-Cre injection (Fig. 2A). Food intake returned to presurgery values by 2 weeks after viral delivery, and was initially not different between WT and Socs3ΔMBH mice (Fig. 2B). Thereafter, although food intake remained constant in WT animals at levels similar to that observed before surgery, it slowly declined in Socs3ΔMBH mice to become significantly reduced compared with WT controls 5 weeks after Ad-Cre injection (Fig. 2B; p = 0.003, Mann–Whitney test). At the same time, Socs3ΔMBH mice showed attenuated body weight gain, and became significantly lighter compared with WT controls by 6 weeks following viral delivery (Fig. 2A; p = 0.013, Mann–Whitney test). Afterward, daily food intake of Socs3ΔMBH mice remained consistently 10–15% lower than that of WT animals, whereas the initially small difference in body weight gradually increased over time. By 12 weeks after Ad-Cre injection, mean body weight of Socs3ΔMBH mice was 5.84 ± 0.93 g lower than that of WT animals (Fig. 2A; p < 0.001, Mann–Whitney test), representing an approximate 15% body weight loss.
Figure 2.

MBH Socs3-deficient mice display attenuated body weight and adiposity associated with decreased food intake. WT and Socs3ΔMBH mice were maintained on standard diet after Ad-Cre delivery, performed at time 0. A, Weekly variations of body weight up to 12 weeks after Ad-Cre delivery. Values correspond to the average body weight measured in two independent cohorts (n = 21 WT and n = 20 Socs3ΔMBH mice). B, Weekly variations of 24 h food intake up to 12 weeks after Ad-Cre delivery, measured in a single cohort (n = 11 WT and n = 12 Socs3ΔMBH mice). C, Glucose tolerance test was performed 16 weeks after Ad-Cre delivery in WT (n = 11) and Socs3ΔMBH mice (n = 10). Plasma glucose concentrations (mg/dl) were determined at the indicated time points (minutes) before and after a glucose injection (1.5 g/kg; i.p.; given at time 0). The inset represents the area under the curve (AUC), in arbitrary units. D, Monthly variations of body weight up to 10 months after Ad-Cre delivery. Values correspond to the average body weight measured in two independent cohorts (n = 21 WT and n = 20 Socs3ΔMBH mice). E, Final adiposity 14 months after Ad-Cre delivery. The weight of individual fat pads was normalized to body weight for each animal (n = 8 WT and n = 9 Socs3ΔMBH mice). Data are mean ± SEM. *p < 0.05, **p < 0.01, and ***p < 0.001, Mann–Whitney test.
We further evaluated glucose homeostasis in Socs3ΔMBH mice and WT animals by performing a glucose tolerance test 16 weeks after virus injection. Despite the difference in body weight observed at that time, glucose homeostasis appeared similar in both genotypes, with no difference in the area under curve (Fig. 2C; p = 0.3, Mann–Whitney test).
Mice were studied for >10 months after Ad-Cre delivery. The difference in body weight between genotypes remained constant, despite a gradual increase in body weight in both genotypes (Fig. 2D). Consistent with this observation, weighing postmortem fat pads indicated that adiposity of Socs3ΔMBH mice was significantly lower than that of WT animals (19.2 ± 3.7% reduction; Fig. 2E; p = 0.027, Mann–Whitney test), with inguinal and retroperitoneal, but not epididymal depots being significantly reduced (Fig. 2E; p = 0.006 for inguinal or retroperitoneal fat pads, and p = 0.4 for epididymal fat pads, Mann–Whitney test). Therefore, our data indicate that MBH Socs3 deficiency in adult mice fed a standard diet protects against body weight gain, limits adiposity, and reduces food intake.
Socs3ΔMBH mice display increased sensitivity to exogenous leptin
Socs3 deficiency is reported to enhance leptin sensitivity in vivo (Howard et al., 2004; Mori et al., 2004). We thus asked whether this also occurs in Socs3ΔMBH mice, by measuring food intake after 2 d of treatment with repeated leptin injections (1 mg/kg; i.p, twice daily). Data obtained in WT controls and Socs3ΔMBH mice after leptin injections were compared with those measured after vehicle treatment in the corresponding animals, and were analyzed using two-way, repeated-measures ANOVA. This revealed a main effect of treatment as the within-subjects, repeated-measures variable (F(1,16) = 21.63; p < 0.001). Post hoc analysis indicated that leptin significantly reduced food intake in Socs3ΔMBH mice, whereas it produced a nonsignificant effect in WT mice (Fig. 3; p < 0.001 and p > 0.05, respectively; determined using Bonferroni post-test). However, when considering data obtained in WT controls separately, the slight leptin-induced reduction in food intake reached significance (Fig. 3; p = 0.049; determined using a paired, two-tailed Student's t test), indicating that WT animals still retained some sensitivity to the dose of leptin used. The above analysis also revealed a main effect of genotype as the between-subjects variable (F(1,16) = 16.58; p < 0.001; determined using two-way, repeated-measures ANOVA). Consistent with our previous findings (Fig. 2B), post hoc analysis indicated that Socs3ΔMBH mice had reduced basal, 24 h food intake compared with WT controls in animals treated with vehicle (Fig. 3; p < 0.05; determined using Bonferroni post-test). Interaction between the two variables was not significant (F(1,16) = 2.17; p = 0.16).
Figure 3.

MBH Socs3-deficient mice display an increased response to exogenous leptin. Leptin sensitivity was determined by measuring 24 h food intake on the second day of treatment with exogenous leptin (1 mg/kg; i.p.), administered twice daily (n = 8 WT and n = 10 Socs3ΔMBH mice). Data are mean ± SEM. *p < 0.05 and ***p < 0.001, determined by Bonferroni multiple-comparison test following repeated-measures, two-way ANOVA. NS, nonsignificant; Veh, vehicle; Lep, leptin.
We also investigated whether leptin signaling is increased in the MBH of Socs3ΔMBH mice. For this experiment, mice were fasted overnight, and perfused 3 h after an acute leptin injection (1 mg/kg; i.p.). We then performed pStat3 and Hu C/D dual immunohistochemistry to quantify neuronal nuclei exhibiting pStat3 staining. This analysis indicated a twofold increase in the number of pStat3-positive neuronal nuclei in the MBH of Socs3ΔMBH mice compared with WT animals in response to acute leptin administration (219.5 ± 27.0 vs 116.5 ± 25.4 in Socs3ΔMBH mice (n = 10) vs WT mice (n = 7), respectively; p = 0.011, Mann–Whitney test). Collectively, these data indicate that Socs3ΔMBH mice display an increased sensitivity to leptin, which is consistent with their lean phenotype and hypophagia, and with the known role of Socs3 as a negative regulator of leptin signaling in vivo (Howard et al., 2004; Mori et al., 2004).
Socs3ΔMBH mice display increased sensitivity to endogenous CCK
Leptin is a long-term regulator of energy homeostasis, but it also reduces short-term food intake by reinforcing the action of satiety signals in the hindbrain, hence decreasing meal size (Grill, 2010). However, which of the various leptin-responsive brain regions participate in this intake-reducing effect of leptin remains poorly understood (Morton et al., 2005; Grill, 2010; Hayes et al., 2010; Scott et al., 2011).
Using Socs3ΔMBH mice, we investigated whether endogenous hypothalamic leptin signaling modulates the hindbrain response to meal-related satiety signals. Because Socs3ΔMBH mice display reduced food intake, we postulated that these mice might be more sensitive to endogenous meal-related satiety signals. This hypothesis was tested by measuring short-term food intake at the beginning of the dark phase in nonfasted animals, i.e., at a time of strong natural orexigenic drive in rodents, without altering endogenous levels of circulating leptin.
Basal food intake was monitored 30 min, 1 h, and 2 h after lights off in both genotypes, and cumulative data were analyzed using two-way, repeated-measures ANOVA. This revealed a significant effect of genotype (Fig. 4A; F(1,19) = 6.01; p = 0.024) and a significant interaction between genotype and time (Fig. 4A; F(2,38) = 5.48; p = 0.008). Post hoc comparisons indicated that Socs3ΔMBH mice ingested significantly less food than WT controls at 2 h (Fig. 4A; p < 0.01; determined using Bonferroni post-test), whereas no difference was found between genotypes at earlier time points (Fig. 4A; p > 0.05 at 30 min and 1 h; determined using Bonferroni post-test). In addition, although food intake increased significantly between the 30 min and 1 h time points in WT controls, the increase was not significant in Socs3ΔMBH mice (Fig. 4A; p < 0.001 and p > 0.05, respectively; determined using Bonferroni post-test). Altogether, these data indicate that food intake is significantly reduced in Socs3ΔMBH mice 2 h after lights off, in part because these mice ingest less food after the initial, 30 min nocturnal period. This suggests, in agreement with our hypothesis, that Socs3ΔMBH mice may be more sensitive to endogenous satiety signals.
Figure 4.

MBH Socs3 deficiency triggers an increased hindbrain response to endogenous meal-related satiety signals. A, Cumulative short-term food intake at the beginning of the dark phase measured in nonfasted WT (n = 11) and Socs3ΔMBH mice (n = 10) at 30 min, 1 h, and 2 h after lights off. B, Nocturnal, 2 h food intake in nonfasted WT (n = 12) and Socs3ΔMBH mice (n = 9) measured after injection of vehicle (Veh) or devazepide (1 mg/kg; i.p.), an antagonist of CCK-A receptors. C, After an overnight fast, 30 min food intake was measured in WT (n = 8) and Socs3ΔMBH mice (n = 6) injected with leptin (Lep; 0.5 mg/kg; i.p.) or vehicle (Veh), in combination with CCK (2 μg/kg; i.p.) or vehicle. Data are mean ± SEM. Two-way, repeated-measures ANOVA, followed by Bonferroni multiple-comparison test was used in A–C, where *p < 0.05 and **p < 0.01. In C, ##p < 0.01 versus vehicle-treated Socs3ΔMBH mice, determined by Bonferroni multiple-comparison test following two-way, repeated-measures ANOVA. NS, nonsignificant.
Satiety and meal termination are triggered by a variety of neuronal and humoral signals, including the gut peptide CCK (Berthoud, 2008; Grill, 2010). To more directly test whether Socs3ΔMBH mice could be more sensitive to endogenous satiety signals, we repeated the same experiment but blocked the action of endogenous CCK by injecting devazepide, a selective antagonist of CCK-A receptors. Food intake was measured 2 h after lights off in WT and Socs3ΔMBH mice that received counterbalanced treatment with devazepide (1 mg/kg) or vehicle, and data were analyzed using two-way, repeated-measures ANOVA. Genotype and drug treatment had a significant effect (respectively, F(1,19) = 4.91; p = 0.039; and F(1,19) = 8.42; p = 0.009), with no interaction between the two variables (F(1,19) = 3.08; p = 0.095). Consistent with our previous findings, post hoc analysis indicated that Socs3ΔMBH mice ingested significantly less food than WT controls in the vehicle condition (Fig. 4B; p < 0.05; determined using Bonferroni post-test). Devazepide treatment abolished this difference between genotypes (p > 0.05; determined using Bonferroni post-test), producing a significant increase in food intake over the vehicle baseline in Socs3ΔMBH mice while having no effect in WT controls (Fig. 4B; respectively, p < 0.05 and p > 0.05; determined using Bonferroni post-test). Thus, Socs3ΔMBH mice appear more sensitive to the action of endogenous CCK.
Finally, we measured short-term food intake during refeeding after an overnight fast. Fasting depletes circulating leptin levels and induces a state of negative energy balance that triggers a hyperphagic response. This allowed us to test the synergy between leptin and CCK in WT and Socs3ΔMBH mice, by measuring 30 min food intake after injection of recombinant leptin (0.5 mg/kg; i.p.), with or without a low dose of CCK (2 μg/kg; i.p.). Data were analyzed using a two-way, repeated-measures ANOVA, and showed that drug treatment, as the within-subjects, repeated-measures variable, significantly affected food intake (F(3,36) = 2.90; p = 0.048). Genotype had no effect (F(1,12) = 3.15; p = 0.102), and there was a trend toward significant interaction between the two variables (F(3,36) = 2.58; p = 0.069). Post hoc analysis indicated that treatment with CCK or leptin alone did not affect food intake compared with the vehicle baseline in either genotype (Fig. 4C; p > 0.05; determined using Bonferroni post-test). In contrast, pretreatment with leptin robustly promoted CCK-induced satiety in Socs3ΔMBH mice (Fig. 4C; p < 0.01 compared with vehicle; determined using Bonferroni post-test), but had no effect in WT controls (Fig. 4C; p > 0.05 compared with vehicle; determined using Bonferroni post-test). Food intake was also significantly reduced in Socs3ΔMBH mice versus WT controls after treatment with both drugs (Fig. 4C; p < 0.05; determined using Bonferroni post-test). These results confirm the increased sensitivity to CCK in Socs3ΔMBH mice compared with WT mice, in conditions where circulating leptin levels are experimentally controlled. Interestingly, the fact that CCK alone did not affect short-term food intake compared with the vehicle baseline in leptin-depleted animals reveals that the higher CCK sensitivity in Socs3ΔMBH mice is leptin dependent. Collectively, these data suggest that the heightened leptin signaling mediated by MBH-selective Socs3 deficiency triggers an increased hindbrain response to endogenous satiety signals, which presumably limits food intake.
Increased response to satiety signals in Socs3ΔMBH mice is mediated by hindbrain oxytocin signaling
Our data indicate that the action of endogenous leptin is conveyed from the MBH to the hindbrain, where a downstream cue acts to modulate the sensitivity to meal-related satiety signals. Various populations of hypothalamic neurons are known to project directly to the dorsal hindbrain, and could support such action. Among these, parvocellular oxytocin neurons located in the PVN, a structure that receives copious input from the MBH, were previously hypothesized to relay hypothalamic leptin signaling to hindbrain satiety circuits (Blevins et al., 2004). This interpretation was based on data showing that exogenous leptin activates a subset of parvocellular oxytocin neurons projecting to the NTS, and that blocking central oxytocin receptors attenuates leptin-induced decreased food intake in nonobese, adult rats (Blevins et al., 2004). However, because the oxytocin receptor antagonist and leptin were both injected into the third ventricle, this study could not determine which brain regions, —the hypothalamus, the hindbrain, or both—, were involved in the observed responses. Using Socs3ΔMBH mice, we thus investigated whether oxytocin signaling in the hindbrain could mediate the increased sensitivity to endogenous satiety signals induced by MBH Socs3 deficiency.
We first tested whether blocking oxytocin receptors in the caudal brainstem of Socs3ΔMBH mice attenuates their increased sensitivity to endogenous satiety signals. We used Socs3ΔMBH and WT mice that were implanted with a chronic guide cannula aimed at the 4V, which provides access to the caudal brainstem, including the NTS and adjacent regions, to inject a selective oxytocin receptor antagonist, SSR126768A (Serradeil-Le Gal et al., 2004). Injections were performed just before lights off, and short-term nocturnal food intake was measured after 2 h. In this experiment, genotype and treatment had a significant effect (respectively, F(1,11) = 15.17; p = 0.003; and F(2,22) = 4.87; p = 0.018; determined using two-way, repeated-measures ANOVA), but no interaction was found between the two variables (F(2,22) = 1.76; p = 0.195). As previously, post hoc analysis indicated that Socs3ΔMBH mice ingested significantly less food than WT controls in the vehicle condition (Fig. 5A; p < 0.05; determined using Bonferroni post-test). A low dose of SSR126768A (150 ng) did not modify nocturnal food intake compared with vehicle-treated animals in either genotype (Fig. 5A; p < 0.01 between Socs3ΔMBH and WT mice; determined using Bonferroni post-test). In contrast, injection of 1000 ng of SSR126768A completely prevented the decreased short-term food intake observed in Socs3ΔMBH mice during the beginning of the dark phase (Fig. 5A; p < 0.01 compared with vehicle-treated Socs3ΔMBH mice; determined using Bonferroni post-test), normalizing food intake to the level of WT animals, whereas it had no significant effect in WT controls (Fig. 5A; p > 0.05 compared with vehicle-treated WT mice; determined using Bonferroni post-test). Thus, blocking central oxytocin receptors in regions of the caudal brainstem surrounding the 4V, including the NTS, counteracts the increased sensitivity to endogenous satiety signals in Socs3ΔMBH mice.
Figure 5.
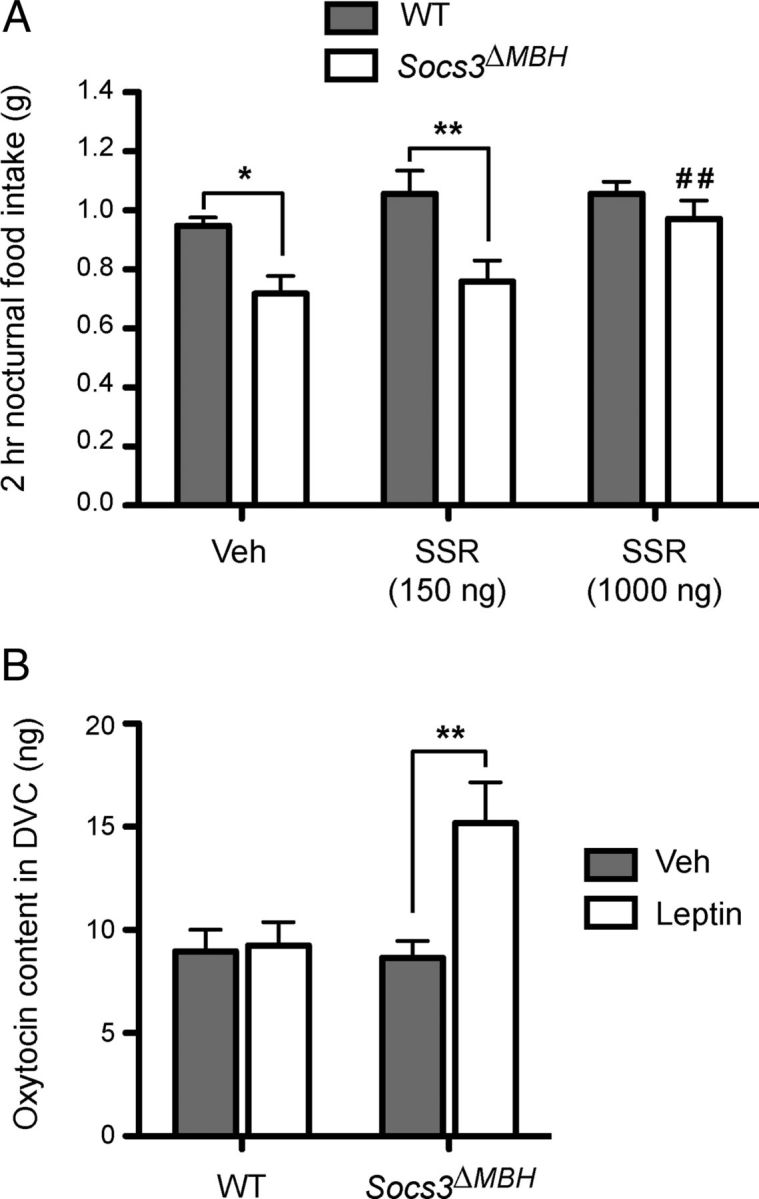
Hindbrain oxytocin signaling mediates the increased sensitivity to satiety signals in Socs3ΔMBH mice. A, Nocturnal food intake in nonfasted WT (n = 6) and Socs3ΔMBH mice (n = 7) measured 2 h after 4V injection of vehicle (Veh) or SSR126768A (SSR), an oxytocin receptor antagonist. B, Mature oxytocin tissue content in the DVC of WT and Socs3ΔMBH mice (n = 8 or n = 7 in each genotype for the vehicle or leptin-treated groups, respectively) subjected to an overnight fast was determined by enzyme immunoassay 5 h after injection of vehicle (Veh) or leptin (3.5 mg/kg; i.p.). Data are mean ± SEM. *p < 0.05 and **p < 0.01, determined by Bonferroni multiple-comparison test following two-way, repeated-measures ANOVA in A or two-way ANOVA in B. In A, ##p < 0.01 versus vehicle-treated Socs3ΔMBH mice, determined by Bonferroni multiple-comparison test following two-way, repeated-measures ANOVA.
The above data suggest that endogenous leptin action in the hypothalamus is relayed to hindbrain satiety circuits via oxytocin signaling. Such conclusion implies that oxytocin tone in the caudal brainstem should be modulated by leptin input. We tested this hypothesis by measuring the content of mature oxytocin within the DVC of the hindbrain, which includes the NTS, the area postrema, and the dorsal motor nuclei of the vagus nerve, after an injection of vehicle or recombinant leptin. In this experiment, WT and Socs3ΔMBH mice were fasted overnight to deplete endogenous leptin levels and treated with vehicle or leptin (3.5 mg/kg; i.p.). Mature oxytocin tissue content was then measured 5 h later by enzyme immunoassay (Schaller et al., 2010), and data were analyzed using two-way ANOVA. Leptin treatment and genotype significantly affected DVC oxytocin levels (respectively, F(1,26) = 7.03; p = 0.014 and F(1,26) = 4.76; p = 0.038), with significant interaction between the two variables (F(1,26) = 5.93; p = 0.022). Post hoc analysis indicated that exogenous leptin produced a significant increase in DVC oxytocin levels compared with the vehicle baseline in Socs3ΔMBH mice (up to 150% of vehicle-treated animals; Fig. 5B; p < 0.01; determined using Bonferroni post-test), whereas no variation was observed in WT mice (Fig. 5B; p > 0.05; determined using Bonferroni post-test). These results are consistent with the idea that leptin increases oxytocin tone within the DVC in Socs3ΔMBH mice.
Collectively, our results suggest that heightened hypothalamic leptin signaling in Socs3ΔMBH mice increases oxytocin signaling in the DVC, including the NTS, which in turn acts to reinforce the response to endogenous satiety signals. This provides evidence for an integrated framework linking hypothalamic action of endogenous leptin to hindbrain satiety circuits via oxytocin signaling, which may operate in the NTS as a downstream mediator of hypothalamic leptin to regulate the sensitivity to meal-related satiety signals.
Discussion
Here, we studied the phenotype of floxed Socs3 mice compared with WT animals from the colony that both received Ad-Cre delivery targeting the MBH at 3 months of age. All mice were maintained under standard diet providing 18% kcal from fat before and after surgery. Under these conditions, the growth curve of WT controls appears consistent with previously published data obtained in similar conditions (Turturro et al., 1999; Tatsumi et al., 2008; Reed et al., 2010). Furthermore, WT controls did not show altered glucose homeostasis and retained sensitivity to exogenous leptin, respectively, 4 and 12 months after Ad-Cre delivery, arguing against the development of obesity. Finally, food intake in WT controls was similar before and after viral delivery, and remained constant for the rest of the study. In contrast, food intake in Socs3ΔMBH mice, although initially similar to controls, slowly declined to become significantly reduced by 5 weeks after viral delivery. This likely participated in body weight gain attenuation observed in these mice. Therefore, our data indicate that MBH-selective inactivation of Socs3 in adult nonobese mice reduces food intake and protects against weight gain.
Socs3ΔMBH mice also had improved leptin signaling and sensitivity, which is consistent with previous genetic studies showing that Socs3 deficiency improves leptin signaling in vivo and attenuates high-fat diet-induced obesity (Howard et al., 2004; Mori et al., 2004; Kievit et al., 2006; for a contrasting view, see Zhang et al., 2008 and Briancon et al., 2010), whereas Socs3 upregulation in proopiomelanocortin (POMC) neurons induces leptin resistance and obesity (Reed et al., 2010). Although Socs3 has been associated with pathological conditions (Münzberg and Myers, 2005), its function in nonobese animals has received less attention, perhaps because very limited phenotype is observed in Socs3-deficient mouse models not exposed to high-fat diet (Kievit et al., 2006; Zhang et al., 2008; Briancon et al., 2010). In contrast, we show that MBH Socs3-deficient mice display a strong phenotype under standard diet, probably because Socs3 inactivation was performed in adult animals, hence bypassing the early postnatal period during which compensatory mechanisms could operate in genetically modified mice (Bouret et al., 2004; 2102; Reed et al., 2010).
Collectively, our data suggest that MBH Socs3 is necessary for body weight homeostasis in mice fed a standard diet, and that endogenous leptin efficiently contributes to body weight homeostasis in nonobese conditions, revealing an important feature of this hormone.
In our hands, stereotaxic delivery of Ad-Cre produced extensive Cre-mediated recombination, presumably reflecting Socs3 deletion, in a brain area limited to the MBH, but spread across several hypothalamic nuclei, including the ARC, VMH, and DMH, three regions enriched in leptin-responsive neurons (Myers et al., 2009). This may have been instrumental in generating the strong phenotype we describe here, considering that leptin engages multiple brain regions to produce its effects (Dhillon et al., 2006; Vong et al., 2011).
One limitation with adenovirus is that transgene expression in the brain is generally transient, but in our study, this may have proved beneficial in limiting potential Cre toxicity to neurons (Forni et al., 2006), without interfering with its ability to induce recombination of the floxed alleles. Indeed, Cre efficiently targeted β-gal expression in ROSA26R mice within 2 weeks after viral delivery, consistent with other studies (Thévenot et al., 2003), and likely deleted Socs3 as well, since the Socs3 response to exogenous leptin was absent in the MBH of Socs3ΔMBH mice. Therefore, it is fair to assume that the phenotype we report here is due to the local, MBH-restricted, deletion of Socs3.
Although MBH-specific Socs3 inactivation produced a clear functional alteration of leptin signaling, signaling by other cytokines could also be affected. Since adenoviruses could induce brain inflammation, we cannot rule out that the phenotype observed in Socs3ΔMBH mice could be due, in part, to altered neuroinflammatory response. However, this possibility seems rather unlikely, because both WT and Socs3 mice received the same viral injection and showed similar body weight variations up to 4 weeks after viral delivery (Fig. 2A). Reaction to viral delivery was thus identical in both genotypes, suggesting similar levels of brain inflammation and similar response to neuroinflammation. Furthermore, the differences observed in Socs3ΔMBH mice appeared after body weight had recovered to presurgery levels, i.e., most likely once viral delivery-mediated neuroinflammation had resumed. This temporal dissociation suggests that the phenotype of Socs3ΔMBH mice is independent from the inflammatory response, but more likely related to altered metabolic signaling. Beyond leptin signaling, Socs3 deficiency could also alter other metabolic signaling pathways, such as the insulin/phosphoinositide 3 kinase/AKT pathway (Ernst et al., 2009).
Leptin reduces food intake by potentiating the response to meal-related satiety signals. Recent findings indicate that this involves endogenous leptin signaling in the NTS (Hayes et al., 2010), but whether other leptin-sensitive brain areas also participate in this process is unclear. Although there is no doubt that leptin signaling in the hypothalamus is essential for many effects of leptin, whether endogenous hypothalamic leptin signaling could modulate hindbrain satiety processes remains elusive. Previously, adenovirus-mediated re-expression of leptin receptors in the ARC was reported to improve satiety processes in rats with severe obesity due to global leptin receptor deficiency (Morton et al., 2005). With this approach, however, expression of leptin receptors presumably occurred in neurons that do not normally respond to leptin and was most likely not physiologically relevant. Furthermore, factors secondary to the constitutive lack of leptin receptors and/or obesity, such as increased levels of plasma leptin, CCK resistance (Cheung et al., 2009), or aberrant hypothalamic neurocircuitry (Bouret et al., 2012) may have influenced the outcome of this study. It was therefore important to investigate this question in nonobese conditions using an animal model in which endogenous leptin signaling is altered. Here, data from pharmacological blockade of CCK-A receptors in nonfasted animals and from leptin and CCK cotreatments in fasted mice collectively suggest that MBH Socs3 deficiency increases the response to endogenous satiety signals, including endogenous CCK, presumably due to improved synergy between leptin and satiety signals resulting from heightened hypothalamic leptin sensitivity. Therefore, endogenous leptin signaling in the hypothalamus likely contributes to modulating the hindbrain response to meal-related satiety signals, as it does in the NTS (Hayes et al., 2010), supporting the view that leptin acts in distributed brain regions to control short-term food intake (Grill, 2010).
The observation that leptin signaling in the hypothalamus modulates long-distance hindbrain satiety circuits implies that a signal, acting in the NTS downstream of hypothalamic leptin-responsive neurons, must both reinforce satiety signaling and respond to hypothalamic leptin input. Here, we provide evidence that oxytocin signaling in the dorsal brainstem fulfills both characteristics. First, pharmacological blockade of oxytocin receptors around the 4V, using a highly selective antagonist (Serradeil-Le Gal et al., 2004), counteracted the increased sensitivity to endogenous satiety signals in nonfasted Socs3ΔMBH mice. Second, exogenous leptin increased the content of mature oxytocin in the DVC of fasted Socs3ΔMBH mice. Collectively, these data suggest that oxytocin tone in the DVC modulates the response to satiety signals as a downstream mediator of hypothalamic leptin signaling. Interestingly, other studies recently reported that the intake-reducing effects of nesfatin-1 (Maejima et al., 2009) and leucine (Blouet et al., 2009) were attenuated after blocking hindbrain oxytocin receptors. Here, we further provide direct evidence, using Socs3ΔMBH mice, that leptin increases oxytocin content within the DVC, suggesting that oxytocin released in this region modulates short-term food intake in response to leptin. This is consistent with recent findings showing that toxin-mediated ablation of oxytocin receptor-expressing neurons in the NTS blunts the intake-reducing effect of exogenous CCK (Baskin et al., 2010). Altogether, these data support the hypothesis that modulation of oxytocin tone in the NTS constitutes a common substrate regulating hindbrain satiety circuits in response to hypothalamic actions of various metabolic signals, including leptin, nesfatin-1, and leucine.
PVN oxytocin neurons could respond to leptin either directly or through the activation of arcuate POMC neurons, which project to the PVN and release α-MSH, an agonist of the melanocortin-4-receptor abundantly expressed in the PVN and key to the regulation of energy intake (Balthasar et al., 2005; Ghamari-Langroudi et al., 2011). Importantly, arcuate POMC neurons also contribute to another major descending pathway from the hypothalamus to the NTS, and available data suggest that this projection could also modulate hindbrain satiety circuits in response to arcuate leptin injection (Zheng et al., 2010).
In conclusion, our data support the view that MBH-selective Socs3 deficiency in adult mice improves leptin signaling and sensitivity, leading to an increased oxytocin tone within the DVC, which in turn acts to reinforce the response to endogenous satiety signals (Peters et al., 2008). Therefore, oxytocin signaling presumably plays a major role in providing hypothalamic feedback to the NTS, so that the brain may adequately control meal size as a function of the energetic stores available in the organism, thereby maintaining energy homeostasis (Fig. 6). This reveals a potential mechanism for the integration of long-term adipose signals with short-term, meal-related satiety signals, through a dialog between distant brain regions. Any dysfunction in this pathway could potentially lead to overeating and obesity (Zhang et al., 2011).
Figure 6.

Oxytocin relays hypothalamic action of leptin onto hindbrain satiety circuits. Schematic representation of the rodent brain showing two major brain regions involved in the control of energy homeostasis: the hypothalamus (yellow) and the NTS (red) in the caudal brainstem. The hypothalamus receives adipose signals such as leptin, and is involved in the long-term regulation of energy balance by fine-tuning various biological processes, including meal size, which is controlled by satiety circuits in the NTS. Here, inactivation of Socs3 selectively in the MBH of adult mice reveals a critical function of Socs3 in the regulation of energy balance in physiological conditions, as this reduced food intake and protected against body weight gain. This Socs3-dependent reduction of food intake is explained by an increased sensitivity to endogenous, meal-related satiety signals, mediated by oxytocin signaling in the caudal brainstem. We conclude that oxytocin likely relays hypothalamic action of leptin onto NTS satiety circuits. These data provide an anatomical substrate for the effect of leptin on meal size, and more generally, a mechanism for how the brain controls meal size as a function of the energetic stores available in the organism to maintain energy homeostasis.
Footnotes
This work was supported by Centre National de la Recherche Scientifique, Institut National de la Santé et de la Recherche Médicale, Institut National de la Recherche Agronomique, Université Aix-Marseille, and by a grant from the Société Française de Nutrition to S.B. We are grateful to P.H. Patterson, B.E. Deverman, and the Gene Transfer Vector Core at the University of Iowa for providing the floxed Socs3 mice and Ad-Cre and to C. Serradeil-Le Gal (Sanofi-Synthélabo Recherche, Toulouse, France) for the kind gift of SSR126768A. We also kindly acknowledge C. Tardivel for help with genotyping, P. Delmas and C. Faivre-Sarrailh for access to laboratory equipment, and the Jean-Roche Institute for access to BSL2 animal facility and equipment.
The authors declare no competing financial interests.
References
- Balthasar N, Dalgaard LT, Lee CE, Yu J, Funahashi H, Williams T, Ferreira M, Tang V, McGovern RA, Kenny CD, Christiansen LM, Edelstein E, Choi B, Boss O, Aschkenasi C, Zhang CY, Mountjoy K, Kishi T, Elmquist JK, Lowell BB. Divergence of melanocortin pathways in the control of food intake and energy expenditure. Cell. 2005;123:493–505. doi: 10.1016/j.cell.2005.08.035. [DOI] [PubMed] [Google Scholar]
- Baskin DG, Kim F, Gelling RW, Russell BJ, Schwartz MW, Morton GJ, Simhan HN, Moralejo DH, Blevins JE. A new oxytocin-saporin cytotoxin for lesioning oxytocin-receptive neurons in the rat hindbrain. Endocrinology. 2010;151:4207–4213. doi: 10.1210/en.2010-0295. [DOI] [PMC free article] [PubMed] [Google Scholar]
- Berthoud HR. The vagus nerve, food intake and obesity. Regul Pept. 2008;149:15–25. doi: 10.1016/j.regpep.2007.08.024. [DOI] [PMC free article] [PubMed] [Google Scholar]
- Bjørbaek C, Elmquist JK, Frantz JD, Shoelson SE, Flier JS. Identification of SOCS-3 as a potential mediator of central leptin resistance. Mol Cell. 1998;1:619–625. doi: 10.1016/s1097-2765(00)80062-3. [DOI] [PubMed] [Google Scholar]
- Blevins JE, Schwartz MW, Baskin DG. Evidence that paraventricular nucleus oxytocin neurons link hypothalamic leptin action to caudal brain stem nuclei controlling meal size. Am J Physiol Regul Integr Comp Physiol. 2004;287:R87–R96. doi: 10.1152/ajpregu.00604.2003. [DOI] [PubMed] [Google Scholar]
- Blouet C, Jo YH, Li X, Schwartz GJ. Mediobasal hypothalamic leucine sensing regulates food intake through activation of a hypothalamus-brainstem circuit. J Neurosci. 2009;29:8302–8311. doi: 10.1523/JNEUROSCI.1668-09.2009. [DOI] [PMC free article] [PubMed] [Google Scholar]
- Bouret SG, Draper SJ, Simerly RB. Trophic action of leptin on hypothalamic neurons that regulate feeding. Science. 2004;304:108–110. doi: 10.1126/science.1095004. [DOI] [PubMed] [Google Scholar]
- Bouret SG, Bates SH, Chen S, Myers MG, Jr, Simerly RB. Distinct roles for specific leptin receptor signals in the development of hypothalamic feeding circuits. J Neurosci. 2012;32:1244–1252. doi: 10.1523/JNEUROSCI.2277-11.2012. [DOI] [PMC free article] [PubMed] [Google Scholar]
- Briancon N, McNay DE, Maratos-Flier E, Flier JS. Combined neural inactivation of suppressor of cytokine signaling-3 and protein-tyrosine phosphatase-1B reveals additive, synergistic, and factor-specific roles in the regulation of body energy balance. Diabetes. 2010;59:3074–3084. doi: 10.2337/db10-0481. [DOI] [PMC free article] [PubMed] [Google Scholar]
- Cheung GW, Kokorovic A, Lam CK, Chari M, Lam TK. Intestinal cholecystokinin controls glucose production through a neuronal network. Cell Metab. 2009;10:99–109. doi: 10.1016/j.cmet.2009.07.005. [DOI] [PubMed] [Google Scholar]
- Deblon N, Veyrat-Durebex C, Bourgoin L, Caillon A, Bussier AL, Petrosino S, Piscitelli F, Legros JJ, Geenen V, Foti M, Wahli W, Di Marzo V, Rohner-Jeanrenaud F. Mechanisms of the anti-obesity effects of oxytocin in diet-induced obese rats. PLoS One. 2011;6:e25565. doi: 10.1371/journal.pone.0025565. [DOI] [PMC free article] [PubMed] [Google Scholar]
- Dhillon H, Zigman JM, Ye C, Lee CE, McGovern RA, Tang V, Kenny CD, Christiansen LM, White RD, Edelstein EA, Coppari R, Balthasar N, Cowley MA, Chua S, Jr, Elmquist JK, Lowell BB. Leptin directly activates SF1 neurons in the VMH, and this action by leptin is required for normal body-weight homeostasis. Neuron. 2006;49:191–203. doi: 10.1016/j.neuron.2005.12.021. [DOI] [PubMed] [Google Scholar]
- Ernst MB, Wunderlich CM, Hess S, Paehler M, Mesaros A, Koralov SB, Kleinridders A, Husch A, Münzberg H, Hampel B, Alber J, Kloppenburg P, Brüning JC, Wunderlich FT. Enhanced Stat3 activation in POMC neurons provokes negative feedback inhibition of leptin and insulin signaling in obesity. J Neurosci. 2009;29:11582–11593. doi: 10.1523/JNEUROSCI.5712-08.2009. [DOI] [PMC free article] [PubMed] [Google Scholar]
- Faouzi M, Leshan R, Björnholm M, Hennessey T, Jones J, Münzberg H. Differential accessibility of circulating leptin to individual hypothalamic sites. Endocrinology. 2007;148:5414–5423. doi: 10.1210/en.2007-0655. [DOI] [PubMed] [Google Scholar]
- Forni PE, Scuoppo C, Imayoshi I, Taulli R, Dastr ù W, Sala V, Betz UA, Muzzi P, Martinuzzi D, Vercelli AE, Kageyama R, Ponzetto C. High levels of Cre expression in neuronal progenitors cause defects in brain development leading to microencephaly and hydrocephaly. J Neurosci. 2006;26:9593–9602. doi: 10.1523/JNEUROSCI.2815-06.2006. [DOI] [PMC free article] [PubMed] [Google Scholar]
- Ghamari-Langroudi M, Srisai D, Cone RD. Multinodal regulation of the arcuate/paraventricular nucleus circuit by leptin. Proc Natl Acad Sci U S A. 2011;108:355–360. doi: 10.1073/pnas.1016785108. [DOI] [PMC free article] [PubMed] [Google Scholar]
- Grill HJ. Leptin and the systems neuroscience of meal size control. Front Neuroendocrinol. 2010;31:61–78. doi: 10.1016/j.yfrne.2009.10.005. [DOI] [PMC free article] [PubMed] [Google Scholar]
- Hayes MR, Skibicka KP, Leichner TM, Guarnieri DJ, DiLeone RJ, Bence KK, Grill HJ. Endogenous leptin signaling in the caudal nucleus tractus solitarius and area postrema is required for energy balance regulation. Cell Metab. 2010;11:77–83. doi: 10.1016/j.cmet.2009.10.009. [DOI] [PMC free article] [PubMed] [Google Scholar]
- Howard JK, Flier JS. Attenuation of leptin and insulin signaling by SOCS proteins. Trends Endocrinol Metab. 2006;17:365–371. doi: 10.1016/j.tem.2006.09.007. [DOI] [PubMed] [Google Scholar]
- Howard JK, Cave BJ, Oksanen LJ, Tzameli I, Bjørbaek C, Flier JS. Enhanced leptin sensitivity and attenuation of diet-induced obesity in mice with haploinsufficiency of Socs3. Nat Med. 2004;10:734–738. doi: 10.1038/nm1072. [DOI] [PubMed] [Google Scholar]
- Kievit P, Howard JK, Badman MK, Balthasar N, Coppari R, Mori H, Lee CE, Elmquist JK, Yoshimura A, Flier JS. Enhanced leptin sensitivity and improved glucose homeostasis in mice lacking suppressor of cytokine signaling-3 in POMC-expressing cells. Cell Metab. 2006;4:123–132. doi: 10.1016/j.cmet.2006.06.010. [DOI] [PubMed] [Google Scholar]
- Maejima Y, Sedbazar U, Suyama S, Kohno D, Onaka T, Takano E, Yoshida N, Koike M, Uchiyama Y, Fujiwara K, Yashiro T, Horvath TL, Dietrich MO, Tanaka S, Dezaki K, Oh-I S, Hashimoto K, Shimizu H, Nakata M, Mori M, et al. Nesfatin-1-regulated oxytocinergic signaling in the paraventricular nucleus causes anorexia through a leptin-independent melanocortin pathway. Cell Metab. 2009;10:355–365. doi: 10.1016/j.cmet.2009.09.002. [DOI] [PubMed] [Google Scholar]
- Mori H, Hanada R, Hanada T, Aki D, Mashima R, Nishinakamura H, Torisu T, Chien KR, Yasukawa H, Yoshimura A. Socs3 deficiency in the brain elevates leptin sensitivity and confers resistance to diet-induced obesity. Nat Med. 2004;10:739–743. doi: 10.1038/nm1071. [DOI] [PubMed] [Google Scholar]
- Morton GJ, Blevins JE, Williams DL, Niswender KD, Gelling RW, Rhodes CJ, Baskin DG, Schwartz MW. Leptin action in the forebrain regulates the hindbrain response to satiety signals. J Clin Invest. 2005;115:703–710. doi: 10.1172/JCI200522081. [DOI] [PMC free article] [PubMed] [Google Scholar]
- Morton GJ, Cummings DE, Baskin DG, Barsh GS, Schwartz MW. Central nervous system control of food intake and body weight. Nature. 2006;443:289–295. doi: 10.1038/nature05026. [DOI] [PubMed] [Google Scholar]
- Morton GJ, Thatcher BS, Reidelberger RD, Ogimoto K, Wolden-Hanson T, Baskin DG, Schwartz MW, Blevins JE. Peripheral oxytocin suppresses food intake and causes weight loss in diet-induced obese rats. Am J Physiol Endocrinol Metab. 2012;302:E134–E144. doi: 10.1152/ajpendo.00296.2011. [DOI] [PMC free article] [PubMed] [Google Scholar]
- Münzberg H, Flier JS, Björbaek C. Region-specific leptin resistance within the hypothalamus of diet-induced obese mice. Endocrinology. 2004;145:4880–4889. doi: 10.1210/en.2004-0726. [DOI] [PubMed] [Google Scholar]
- Münzberg H, Myers MG., Jr Molecular and anatomical determinants of central leptin resistance. Nat Neurosci. 2005;8:566–570. doi: 10.1038/nn1454. [DOI] [PubMed] [Google Scholar]
- Myers MG, Jr, Münzberg H, Leinninger GM, Leshan RL. The geometry of leptin action in the brain: more complicated than a simple ARC. Cell Metab. 2009;9:117–123. doi: 10.1016/j.cmet.2008.12.001. [DOI] [PMC free article] [PubMed] [Google Scholar]
- Peters JH, McDougall SJ, Kellett DO, Jordan D, Llewellyn-Smith IJ, Andresen MC. Oxytocin enhances cranial visceral afferent synaptic transmission to the solitary tract nucleus. J Neurosci. 2008;28:11731–11740. doi: 10.1523/JNEUROSCI.3419-08.2008. [DOI] [PMC free article] [PubMed] [Google Scholar]
- Reed AS, Unger EK, Olofsson LE, Piper ML, Myers MG, Jr, Xu AW. Functional role of suppressor of cytokine signaling 3 upregulation in hypothalamic leptin resistance and long-term energy homeostasis. Diabetes. 2010;59:894–906. doi: 10.2337/db09-1024. [DOI] [PMC free article] [PubMed] [Google Scholar]
- Schaller F, Watrin F, Sturny R, Massacrier A, Szepetowski P, Muscatelli F. A single postnatal injection of oxytocin rescues the lethal feeding behaviour in mouse newborns deficient for the imprinted Magel2 gene. Hum Mol Genet. 2010;19:4895–4905. doi: 10.1093/hmg/ddq424. [DOI] [PubMed] [Google Scholar]
- Scott MM, Williams KW, Rossi J, Lee CE, Elmquist JK. Leptin receptor expression in hindbrain Glp-1 neurons regulates food intake and energy balance in mice. J Clin Invest. 2011;121:2413–2421. doi: 10.1172/JCI43703. [DOI] [PMC free article] [PubMed] [Google Scholar]
- Serradeil-Le Gal C, Valette G, Foulon L, Germain G, Advenier C, Naline E, Bardou M, Martinolle JP, Pouzet B, Raufaste D, Garcia C, Double-Cazanave E, Pauly M, Pascal M, Barbier A, Scatton B, Maffrand JP, Le Fur G. SSR126768A (4-chloro-3-[(3R)-(+)-5-chloro-1-(2,4-dimethoxybenzyl)-3-methyl-2-oxo-2,3-dihydro-1H-indol-3-yl]-N-ethyl-N-(3-pyridylmethyl)-benzamide, hydrochloride): a new selective and orally active oxytocin receptor antagonist for the prevention of preterm labor. J Pharmacol Exp Ther. 2004;309:414–424. doi: 10.1124/jpet.103.061200. [DOI] [PubMed] [Google Scholar]
- Soriano P. Generalized lacZ expression with the ROSA26 Cre reporter strain. Nat Genet. 1999;21:70–71. doi: 10.1038/5007. [DOI] [PubMed] [Google Scholar]
- Tatsumi S, Ito M, Asaba Y, Tsutsumi K, Ikeda K. Life-long caloric restriction reveals biphasic and dimorphic effects on bone metabolism in rodents. Endocrinology. 2008;149:634–641. doi: 10.1210/en.2007-1089. [DOI] [PubMed] [Google Scholar]
- Thévenot E, C∧ot é F, Colin P, He Y, Leblois H, Perricaudet M, Mallet J, Vodjdani G. Targeting conditional gene modification into the serotonin neurons of the dorsal raphe nucleus by viral delivery of the Cre recombinase. Mol Cell Neurosci. 2003;24:139–147. doi: 10.1016/s1044-7431(03)00131-3. [DOI] [PubMed] [Google Scholar]
- Turturro A, Witt WW, Lewis S, Hass BS, Lipman RD, Hart RW. Growth curves and survival characteristics of the animals used in the Biomarkers of Aging Program. J Gerontol A Biol Sci Med Sci. 1999;54:B492–B501. doi: 10.1093/gerona/54.11.b492. [DOI] [PubMed] [Google Scholar]
- Vong L, Ye C, Yang Z, Choi B, Chua S, Jr, Lowell BB. Leptin action on GABAergic neurons prevents obesity and reduces inhibitory tone to POMC neurons. Neuron. 2011;71:142–154. doi: 10.1016/j.neuron.2011.05.028. [DOI] [PMC free article] [PubMed] [Google Scholar]
- Zhang G, Cai D. Circadian intervention of obesity development via resting-stage feeding manipulation or oxytocin treatment. Am J Physiol Endocrinol Metab. 2011;301:E1004–E1012. doi: 10.1152/ajpendo.00196.2011. [DOI] [PMC free article] [PubMed] [Google Scholar]
- Zhang G, Bai H, Zhang H, Dean C, Wu Q, Li J, Guariglia S, Meng Q, Cai D. Neuropeptide exocytosis involving synaptotagmin-4 and oxytocin in hypothalamic programming of body weight and energy balance. Neuron. 2011;69:523–535. doi: 10.1016/j.neuron.2010.12.036. [DOI] [PMC free article] [PubMed] [Google Scholar]
- Zhang R, Dhillon H, Yin H, Yoshimura A, Lowell BB, Maratos-Flier E, Flier JS. Selective inactivation of Socs3 in SF1 neurons improves glucose homeostasis without affecting body weight. Endocrinology. 2008;149:5654–5661. doi: 10.1210/en.2008-0805. [DOI] [PMC free article] [PubMed] [Google Scholar]
- Zheng H, Patterson LM, Rhodes CJ, Louis GW, Skibicka KP, Grill HJ, Myers MG, Jr, Berthoud HR. A potential role for hypothalamomedullary POMC projections in leptin-induced suppression of food intake. Am J Physiol Regul Integr Comp Physiol. 2010;298:R720–R728. doi: 10.1152/ajpregu.00619.2009. [DOI] [PMC free article] [PubMed] [Google Scholar]