

Abstract
Depolarization of the neuronal soma augments synaptic output onto postsynaptic neurons via long-range, axonal cable properties. Here, we report that the range of this somatic influence is spatially restricted by not only axonal path length but also a branching-dependent decrease in axon diameter. Cell-attached recordings of action potentials (APs) from multiple axon branches of a rat hippocampal CA3 pyramidal cell revealed that an AP was broadened following a 20 mV depolarization of the soma and reverted to a normal width during propagation down the axon. The narrowing of the AP depended on the distance traveled by the AP and on the number of axon branch points through which the AP passed. These findings were confirmed by optical imaging of AP-induced calcium elevations in presynaptic boutons, suggesting that the somatic membrane potential modifies synaptic outputs near the soma but not long-projection outputs. Consistent with this prediction, whole-cell recordings from synaptically connected neurons revealed that depolarization of presynaptic CA3 pyramidal cells facilitated synaptic transmission to nearby CA3 pyramidal cells, but not to distant pyramidal cells in CA3 or CA1. Therefore, axonal geometry enables the differential modulation of synaptic output depending on target location.
Introduction
Chemical neurotransmission is conventionally considered a local event that occurs at synaptic junctions. However, several pioneering studies have demonstrated previously that the membrane potential of the neuronal cell body before action potential (AP) generation affects neurotransmission at synapses that are distant from the cell body (Alle and Geiger, 2006, 2008; Shu et al., 2006; Kole et al., 2007; Scott et al., 2008; Christie et al., 2011). Although the underlying mechanisms remain controversial, the long-distance effect of the axon is mediated, at least in part, by an analog-like distortion of the AP waveform (Shu et al., 2006, 2007; Kole et al., 2007); APs originating from more depolarized membrane potentials are broader, and the broadened APs facilitate downstream synaptic transmission. This form of synaptic augmentation may be mediated by enhanced calcium dynamics at presynaptic terminals (Awatramani et al., 2005; Hori and Takahashi, 2009; Christie et al., 2011) (but see Alle and Geiger, 2008; Scott et al., 2008).
This somatic depolarization is reported to decay along the axon with length constants (λ) of 430 μm in rat hippocampal mossy fibers (Alle and Geiger, 2006), 417 μm in layer 5 pyramidal cells in ferret prefrontal cortex (Shu et al., 2006), and 553 μm of layer 5 pyramidal cells in rat somatosensory cortex (Kole et al., 2007). On the other hand, cable theory predicts that these λ values are variable depending on cylinder diameter and the cable wiring pattern (Rall, 1959). Therefore, we hypothesized that AP modulation by somatic depolarization decays depending on not only axonal length but also branching. Cortical neurons often produce highly arborized axons; therefore, their somatic influence is expected to decrease rapidly during axon conduction and to differ markedly between proximal and distal synapses. However, this hypothesis has not been tested.
To test this hypothesis, we focused on hippocampal CA3 pyramidal cells because the axons in these neurons are locally arborized and synapse simultaneously on different postsynaptic targets, i.e., CA3 pyramidal cells (proximal or distal target) and CA1 pyramidal cells (distal target). In acute slice preparations, most Schaffer collaterals (long-projecting axons from CA3 to CA1) are severed, making it difficult to locate synaptically connected CA3-to-CA1 pairs. Therefore, we chose to use hippocampal slice cultures. The cultured network self-restores to an in vivo-like connectivity (Takahashi et al., 2010), providing a unique opportunity for direct comparisons between proximal and distal axonal connections in the same preparation, even in the same presynaptic neuron. Moreover, we previously established three imaging techniques that can be used to address our hypothesis: (1) fluorescent patch-clamp pipettes that enable direct recording from intact axon branches (Ishikawa et al., 2010; Sasaki et al., 2011; Takahashi et al., 2012), (2) wide-field confocal imaging that simultaneously monitors the calcium activity of presynaptic varicosities from multiple axon branches (Sasaki et al., 2011), and (3) reversal optical trawling (ROTing), which is a high-throughput, large-scale synapse mapping method that identifies long-distance synaptic connections (Sasaki et al., 2009; Takahashi et al., 2010). Using these techniques, we demonstrate that axonal topology influences the somatic modulation of APs and subsequent synaptic output.
Materials and Methods
Animal experiment ethics.
All experiments were performed with the approval of the animal experiment ethics committee at the University of Tokyo (approval number 19-43) and according to the University of Tokyo guidelines for the care and use of laboratory animals.
Hippocampal slice culture preparations.
Postnatal day 7 Wistar/ST rats of either sex were anesthetized with ketamine/xylazine and chilled on ice. The brains were removed and cut horizontally into 300-μm-thick slices using a DTK-1500 vibratome (Dosaka). During the generation of slices, brain tissues were submerged in aerated, ice-cold Gey's balanced salt solution supplemented with 25 mm glucose. Entorhinohippocampal slices were cultivated for 7–14 d on Omnipore membrane filters (JHWP02500; ϕ25 mm; Millipore) (Koyama et al., 2007). Cultures were incubated in 1 ml of 50% minimal essential medium, 25% HBSS (Invitrogen), and 25% horse serum (Cell Culture Laboratory) in a humidified incubator at 37°C in 5% CO2. The medium was changed every 3.5 d. Cultured slices were analyzed after 8–11 d in vitro unless specified otherwise.
Patch-clamp recordings.
A cultured slice was placed in a recording chamber and perfused at 3–4 ml/min with artificial CSF (ACSF) containing the following (in mm) unless specified otherwise: 127 NaCl, 26 NaHCO3, 3.3 KCl, 1.24 KH2PO4, 3.0 MgSO4, 3.0 CaCl2, and 10 glucose at 30–32°C. Whole-cell recordings were performed from visually identified pyramidal cells. Patch pipettes (5–7 MΩ) were filled with 135 mm K-gluconate, 4 mm KCl, 10 mm HEPES, 10 mm phosphocreatine, 4 mm MgATP, 0.3 mm NaGTP, and 200 μm Alexa Fluor 488 hydrazide, pH 7.2 (Invitrogen). Axonal cell-attached recordings were obtained using fluorophore-coated pipettes (Ishikawa et al., 2010). Immediately before use, the glass pipettes (9–12 MΩ) were filled with ACSF, and the tips were immersed for 5–10 s in 0.02% bovine serum albumin Alexa Fluor 488 conjugate (A-13100; Invitrogen). Action potentials were evoked by brief current injection (2–3 ms; 1–2 nA) into the soma. Signals were recorded at 20–100 kHz using two Multiclamp 700B amplifiers (Molecular Devices). Fast and slow pipette capacitive transients were minimized in the cell-attached configuration. No compensation was made to cancel access resistance. To apply the electrical stimulation, glass pipettes were filled with ACSF and placed in the dentate hilus. Single-pulse stimuli (80 μs; 100–200 μA) were applied at intervals of >10 s.
Presynaptic calcium imaging.
CA3 pyramidal cells were whole-cell patched using a pipette loaded with 250 μm Oregon Green 488 BAPTA-1 (OGB1) potassium salt. After allowing 30–60 min for intra-axonal dye diffusion, axon branches were monitored at 50 frames per second (fps) using a Nipkow-disk confocal unit (CSU-X1; Yokogawa Electric), a back-illuminated CCD camera (iXon DU897; Andor), and a water-immersion objective lens (40×; NA, 0.80; Nikon). Fluorophores were excited at 488 nm with a laser diode (HPU50101PFS; FITEL) and visualized using a 507 nm long-pass emission filter. The AP-induced calcium increase was measured as the mean change in the fluorescence intensity of five neighboring synaptic varicosities (ROI, 2 × 3 μm2 each) averaged for five trials to enhance the signal-to-noise ratio.
ROTing.
ROTing was used to detect synaptically coupled neurons (Sasaki et al., 2009). For dye loading, a glass pipette (1–3 MΩ) was filled with ACSF containing 200 μm OGB1 AM (Invitrogen) and inserted into the CA3 pyramidal cell layer. Using intrapipette pressure, neurons were bolus loaded with the calcium indicator. One or two CA3 or CA1 pyramidal cells were voltage clamped at −70 mV, and 10 μm glutamate was applied locally through iontophoretic pipettes (∼1 MΩ, 3–10 μA for 1–5 s each). This low concentration of glutamate evoked APs in a few CA3 neurons. The iontophoretic pipette was slowly moved over the CA3 networks, and the evoked APs were monitored at 50 fps using Nipkow-disk confocal microscopy with a water-immersion objective lens (16×; NA, 0.80; Nikon). APs were determined based on the onset times of individual calcium transients using an automatic machine-learning algorithm (Sasaki et al., 2008). To determine which pyramidal neurons were candidate presynaptic targets for subsequent patch clamping, the AP timing was compared to the onset of EPSCs recorded in the patch-clamped neurons.
In silico experiments.
Simulation was conducted in the Visual Basic environment using the conventional Hodgkin–Huxley (HH) model, which included potassium leak conductance, voltage-sensitive sodium channel conductance, and delayed-rectifier potassium channel conductance as follows (Hodgkin and Huxley, 1952; Dayan and Abbott, 2001):
 |
where Cm = 1 μF/cm2 is the specific membrane capacity; V is the difference between the resting potential and the instantaneous membrane potential; ENa = 115 mV, EK = −12 mV, EL = 10.6 mV, and Esyn = 70 mV are the reversal potentials for the sodium, potassium, leakage, and synaptic current components, respectively; gNa and gK are the V-dependent ionic conductance through the sodium and potassium components, respectively; ḡL = 0.3 mS/cm2 is the leakage current component; and gsyn is the synaptic conductance used to evoke an action potential. gsyn was changed from 0 to 0.2 mS/cm2 to generate an AP in the HH neuron. gNa and gK are given as follows:
where ḡNa = 120 mS/cm2 and ḡK = 36 mS/cm2 are the maximal ionic conductances, and m, n, and h are dynamic activation (or gating) variables. They evolve according to the following differential equations (Dayan and Abbott, 2001):
 |
 |
 |
The various functions α and β are empirical functions of V and given as follows (Dayan and Abbott, 2001):
f in Equation 3 is the inactivation function of voltage-dependent potassium channels and is defined as f = 1/(1 + 0.15e0.1(Vinit+20)), where Vinit, ranging from 0 to 40 mV, is the difference between the resting potential and the potential at the time when gsyn was changed to 0.2 mS/cm2. Simulations were conducted at a step size of 20 μs.
Data are reported as the mean ± SE.
Results
Computational prediction of somatic AP modulation
Whole-cell recordings were obtained from hippocampal CA3 pyramidal cells. To examine how the membrane potential immediately before AP initiation affects the subsequent AP waveform, a small step-pulse current was injected into the cell body to depolarize presynaptic neurons by 5–35 mV for 1 s before AP firing. The initiation time of an AP was determined at a threshold of d2V/dt2 = 0.25 μV/μs2, and the AP width was defined as its half-maximum width, i.e., the duration at 50% of the voltage difference between AP initiation and AP peak. Somatic depolarization increased AP width (Fig. 1A, left), and larger depolarizations produced more broadened APs (Fig. 1B). This relationship was supralinear and apparently approximated by − 7.5 × (1 − e−0.06 ΔVsoma), where ΔVsoma is the voltage difference from the resting potential of the soma. These experimental results were replicated using the conventional HH model (Fig. 1A, right, B).
Figure 1.

HH simulation of depolarization-induced broadening of action potentials. A, Comparison between experimental (left) and simulated (right) data of the waveform distortion of APs initiated from resting (black) and 20 mV-depolarized (colored) membrane potentials. Experimental data were obtained from a CA3 pyramidal cell. B, Nonlinear relationship between somatic depolarization (ΔVsoma) and resultant changes in AP width (blue, experimental data; red, HH model simulation). C, The HH model and cable theory predict a more rapid decay of increased AP width while an AP travels down the axon (red) than axonal depolarization induced by 20-mV somatic depolarization (black). D, The HH model and cable theory predict that different extents of depolarization (+10, +20, and +30 mV) result in different degrees of AP-width decay along the axon. The inset shows a nonlinear relationship between somatic depolarization (ΔVsoma) and the decay constant (λAP) of AP width relative to the axonal length constant (λ).
Using the assumption that the axon cable is a semi-infinite homogeneous cylindrical compartment, cable theory predicts that the voltage difference induced in the soma decays along the longitudinal axis of the axon as ΔV(x) = ΔVsoma e−x/λ, where x is the path length from the soma, and λ is the length constant (Dayan and Abbott, 2001). Because of the nature of the supralinear relationship between ΔV and AP broadening (Fig. 1B), the length constant in the recovery of AP broadening during axonal conduction (λAP) is smaller than λ. For example, the HH simulation indicated that λAP was 0.72 × λ when ΔVsoma = 20 mV (Fig. 1C). λAP depended on ΔVsoma and was consistently smaller than λ (Fig. 1D), indicating that the AP-broadening effect of ΔVsoma is less than that expected from the linear prediction of simple cable properties. In other words, ΔVsoma-induced AP broadening recovers more rapidly during axonal conduction than simply expected by the axon length constant.
The above simulations may be oversimplified because real axonal tubes are inhomogeneous and highly branched. One of the most influential factors is the axon diameter (d). According to cable theory, λ is proportional to the square root of d (Fig. 2A, left) (Dayan and Abbott, 2001). Given that the sibling axon branches are usually narrower than the parent axon, λ may vary between prebranch and postbranch cables (Fig. 2A, right) (Rall, 1959; Dayan and Abbott, 2001).
Figure 2.
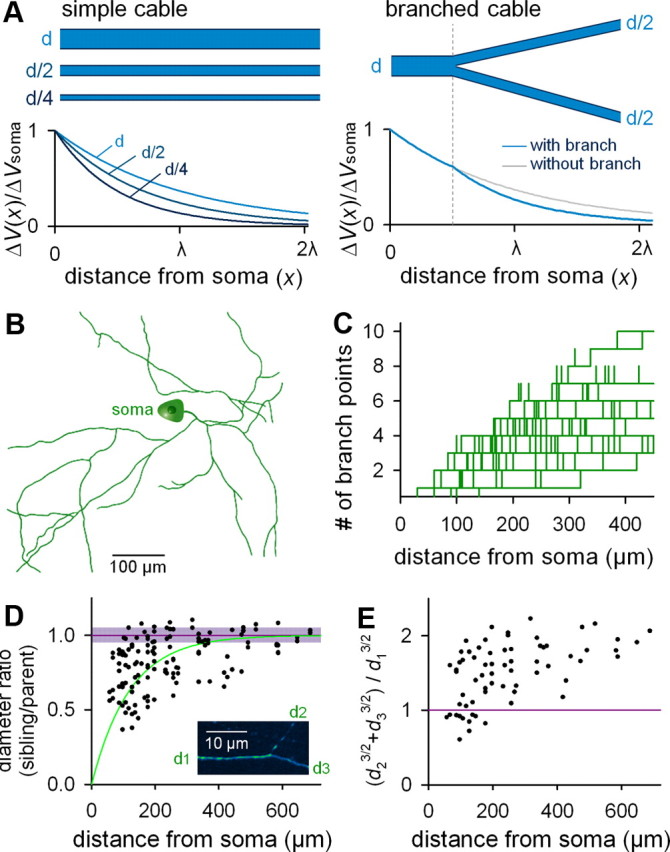
Anatomical characterization of the axonal arborization of CA3 pyramidal cells ex vivo. A, Cable theory predicts that recovery of the depolarized membrane potential (ΔV) along the longitudinal axis of the cable depends on cable diameter (left) and branching (right). B, Representative reconstruction of the CA3 pyramidal cell axon. C, The number of branch points between the soma and a given point on the axon is plotted as a function of the path length from the soma to the examined point (n = 5 cells). D, The ratio of the diameter of a pre-branch “parent” axon segment (d1) to those of the two postbranch “sibling ” axon segments (d2 or d3) is plotted as a function of the path length from the soma. The square root of the Alexa Fluor 488 fluorescence intensity of an axon segment within 10 μm of a given branch point was used as an estimate of axon diameter (n = 5 cells). As control, the mean and SD of the ratio in the fluorescence intensities between two axon points at a path interval of 20 μm without branching are shown in the purple line and shade. Inset, Example of high-magnification of a branching point. E, Ratios of the 3/2 power values of axon diameters [i.e., (d23/2 + d33/2)/d13/2] are plotted as a function of the path length from the soma (n = 5 cells). F, Computational simulation of depolarization-induced AP width along arborized axons when the axonal length constant (λ) is constant throughout the axon (left, without branch decay) or when a branch-dependent decrease in the axonal diameters was considered (right, with branch decay). Simulation was conducted on the neuron reconstructed in B.
To estimate the impact of axonal branching on λ, we reconstructed the axons of CA3 pyramidal cells that were intracellularly labeled with the membrane-impermeable fluorescent dye Alexa Fluor 488 hydrazide through patch-clamp pipettes (Fig. 2B). The dendrogram of the axonal branch patterns (Fig. 2C) indicates that the number of branch points between the soma and a given segment on the axon increased with the path length between the soma and the analyzed segment. These branching patterns were similar to those observed in the hippocampus in vivo (Li et al., 1994; Wittner et al., 2007).
The axon diameter cannot be measured directly by optical microscopy because it is often <1 μm and smaller than the point spread function (Conchello and Lichtman, 2005). Therefore, by assuming that the total fluorescence intensity (F) in a given axonal segment is proportional to the axonal volume [i.e., F ∝ volume = π(d/2)2 × unit length], we estimated the relative axon diameter as the square root of the Alexa Fluor 488 fluorescence intensity, i.e., d ∝ F1/2. In neurons held in the whole-cell configuration for >60 min, which was long enough to reach the steady state of dye diffusion in the axon, the F values were measured from three 5 μm sub-branch segments (i.e., a parent and two siblings) within 10 μm of each branch point, and the background autofluorescence Fback was measured from the parenchymal region 10 μm apart from to the branch point and subtracted from F. In most branch points, the putative diameters (F − Fback)1/2 of sibling axonal branches were smaller than the parent axonal diameter (Fig. 2D, black dots). According to this plot, branch-dependent decreases in the axon diameters were particularly marked within a distance of 200 μm from the soma. As control experiments, we measured F from two axonal points (20 μm apart) without a branch point and found no apparent change in the intensity between such a short interval; the diameter ratio was 0.99 ± 0.07 (Fig. 2D, purple line, shadow) (n = 108 randomly selected axonal shafts).
In the dendrites of some types of neurons, the fiber diameters are known to conform to the so-called 3/2 power law (Rall, 1959; Turner and Schwartzkroin, 1980; Desmond and Levy, 1984), in which the 3/2 power of the parent segment diameter d1 is equal to the sum of the two sibling segment diameters d2 and d3, both raised to the 3/2 power, i.e., d13/2 = d23/2 + d33/2. Note that if this relationship holds between any parent dendrite and its siblings, the complex dendritic tree of the neuron becomes equivalent to an unbranched cylinder for simplified electronic calculations. Surprisingly, the 3/2 power relationship has not been addressed in axonal branching. We found that the axon diameters show a complicated relationship (Fig. 2E). At branches close to the soma, the d13/2 value tended to be smaller than d23/2 + d33/2, whereas it was larger than d23/2 + d33/2 at distant branches. These results raise the possibility that ΔVsoma-induced AP broadening recovers more rapidly in branched axons, particularly in the vicinity of the soma, than in an unbranched axonal cylinder.
Using these detailed morphological data, we simulated the HH dynamics of the AP width during axonal conduction when the soma of the neuron reconstructed in Figure 2B was depolarized by ΔVsoma = 20 mV. ΔV was decayed along the axon length by an simple exponential decay equation, based on two assumptions (1) λ changes at every branch point, depending on a decrease in d (λ ∝ d1/2), and (2) d is constant in a axon shaft between two successive branch points. λ at the axon initial segment was set to be 450 μm. The AP waveform was determined by ΔV on the spot. We found that ΔVsoma-induced changes in the AP width occurred in a shorter range (Fig. 3A, right) compared to those when the branch effect was not considered (i.e., when ΔV was assumed to decay depending simply on the axon path length) (Fig. 3A, left). To determine how far somatic AP modulation is maintained along the axon, 80 axonal segments were randomly selected from the axon arbor and plotted against the axon path length (Fig. 3B) and the number of upstream branch points (Fig. 3C). We first fitted the data of Figure 3B to an exponential decay function using the least-squares method. The length constants λAP was 344 μm without branch decay (Fig. 3B, left; F(1,78) = ∞; p = 0.00) and 172 μm with branch decay (Fig. 3B, right; F(1,78) = 1244.9; p < 0.001), indicating that depolarization-broadened APs reverted more rapidly when the branching effect was taken into consideration. Because of the interdependence between the distance and the number of branch points (Fig. 2C), this AP recovery can also be considered to depend on the number of branches over which an AP passes; that is, increased narrowing of the widened APs occur at axonal branch points. We thus fitted the data of Figure 3C to the exponential decay function e−n/λAP, where n is the number of upstream branches at the focused point. λAP was 4.7 branches without branch decay (Fig. 3C, left; F(1,78) = 10.7; p < 0.001) and 2.1 branches with branch decay (Fig. 3C, right; F(1,78) = 294.7; p < 0.001), indicating again that the broadened APs reverted more rapidly when the branching effect was considered.
Figure 3.

HH simulation of depolarization-induced AP width along arborized axons. A, Simulation was conducted on the neuron reconstructed in Figure 2B. Left, The axonal length constant (λ = 450 μm) is constant throughout the axon (without branch decay). Right, A branch-dependent decrease in the axonal diameters was considered (with branch decay). B, Distance-dependent recovery of depolarization-broadened APs. The curve indicates the least-square best fit of the exponential decay function (left, without branch decay; %Δwidth = 17.9 × e−d/344; d, distance from the soma; F(1,78) = ∞; p = 0.0; right, with branch decay; %Δwidth = 18.3 × e−d/172; F(1,78) = 1244.9; p < 0.001). C, Branch number-dependent recovery of depolarization-broadened APs. The curve indicates the best fit of the exponential decay function (left, %Δwidth = 17.7 × e−n/4.7; n, number of upstream branches; F(1,78) = 10.7; p < 0.001; right; %Δwidth = 20.0 × e−n/2.1; F(1,78) = 294.7; p < 0.001). Data presented here were collected from 14 recordings.
Together, our simulations suggest that the axon length constant λ overestimates the spatial range of the ΔVsoma influence on the AP waveform (λAP) because the AP width is nonlinearly related to ΔV and because λ decreases at branch points. We expect that this spatial restriction is particularly prominent in axons that are highly arborized in the vicinity of the axon initial segments, such as associational fibers of CA3 pyramidal cells (Li et al., 1994; Wittner et al., 2007).
Extracellular APs monitored by cell-attached recording
We experimentally examined the effect of ΔVsoma on the AP waveform during conduction of branched axons by performing cell-attached recordings of intact axons. Alexa Fluor 488 hydrazide was injected into CA3 pyramidal cells through whole-cell patch-clamp pipettes, and visualized axons were targeted using fluorophore-coated pipettes under real-time confocal control (Fig. 4A). APs were evoked by brief current injections into the soma and extracellularly recorded at the axon as sharp sink potentials (eAPs). The half-maximum width of eAPs was increased by a 20 mV depolarization of the cell body before AP firing (Fig. 4B).
Figure 4.

Cell-attached recording of eAPs recapitulates the features of iAPs. A, Visually guided patch-clamp recording from the axon of a CA3 pyramidal cell. For visualization, the fluorescence contrast was emphasized around the axon tract. B, Typical traces of eAPs recorded from the axon of a resting (black) or 20 mV-depolarized CA3 neuron (blue). C, Simultaneous triple recordings of iAP, eAP, and eAP from the soma of the same cell. LFPs were recorded 15 and 30 μm from the cell body surface. D, Time-dependent evolution of the waveform of an eAP (left, cell attached; right, LFP at 15 μm) against the corresponding iAP waveform (top) and its derivative (bottom). E, Effects of 20 mV depolarization (n = 6 cells), 10 nm tetrodotoxin (n = 4), and 10 μm 4-AP (n = 4) on four AP-relevant parameters (i.e., amplitude, 20 to 80% rise time, decay constant, and amplitude half-width). *p < 0.01, paired t test. F, Changes in eAP width are linearly proportional to changes in iAP width (r = 0.58; p = 0.03).
Although eAPs recorded from local field potentials (LFPs) are thought to reflect the derivative of intracellularly recorded APs (iAPs), the origin of eAPs monitored by cell-attached recording is controversial (Raastad and Shepherd, 2003; Khaliq and Raman, 2006; Perkins, 2006). Therefore, we simultaneously recorded and compared the waveforms of iAPs (whole cell) and eAPs (cell attached) from cell bodies of CA3 pyramidal cells and eAPs recorded in LFPs (Fig. 4C). These three traces were phase-space analyzed (Fig. 4D). Although the eAPs (cell attached) were not exactly the inverse or derivative of the iAPs, they were similar to the inverted waveform of the iAPs. This was in contrast to the eAPs in LFPs, which were similar to the inverted waveform of the first derivative of the iAPs.
We then compared the sensitivity of the iAP and eAP waveforms to 20 mV depolarization; 10 nm tetrodotoxin, a voltage-sensitive sodium channel inhibitor; and 10 μm 4-aminopyridine (4-AP), a putative inhibitor of the Kv1 family of voltage-activated potassium channels. The AP amplitude, 20 to 80% rise time, decay time constant, and half-width were used to evaluate AP modulation (Fig. 4E). In both iAPs and eAPs, tetrodotoxin altered all of the AP waveform parameters measured, whereas depolarization and 4-AP primarily affected the AP decay and width, i.e., the late phase of the AP. Importantly, as expected from the data in Figure 4D, the changes in the eAP width were almost linearly proportional to the changes in the iAP width (Fig. 4F; r = 0.58; p = 0.03; n = 12). Accordingly, the eAP width can serve as an indicator of iAP width.
Effects of axonal length and branching on AP modulation
To determine how far somatic AP modulation is maintained along the axon, we performed dual or single recordings of eAPs from different axonal points (Fig. 5A). Broadened APs gradually reverted to a normal width as a function of the axonal distance over which they traveled (Fig. 5B). This curve was fitted to an exponential decay function using the least-squares method. The decay constant was 145 μm (F(1,12) = 229.8; p = 0.002). Additionally, we found that increased narrowing of the widened APs also occurred at axonal branch points, with a decay constant of 2.9 branches (Fig. 5C; F(1,12) = 158.4; p = 0.006). These decay constants are more similar to the result of our HH simulation with branch decay than that without branch decay (Fig. 2A).
Figure 5.

Depolarization-broadened APs return to a normal width along the length of the axon and through the branch points they traverse. A, Representative image of dual, cell-attached recordings of eAPs from different axonal branches. B, Distance-dependent recovery of depolarization-broadened APs. The curve indicates the least-square best fit of the exponential decay function (Δwidth = 19.6 × e−d/145; d, distance from the soma; F(1,12) = 229.8; p = 0.002). C, Branch number-dependent recovery of depolarization-broadened APs. The curve indicates the best fit of the exponential decay function (Δwidth = 12.4 × e−n/2.9; n, number of upstream branches; F(1,12) = 158.4; p = 0.006). Data presented here were collected from 14 recordings.
To investigate whether AP modulation influences the function of presynaptic terminals, we performed functional optical imaging. We used Nipkow disk confocal microscopy to measure intracellular calcium dynamics in axonal varicosities loaded anterogradely with OGB1 through somatic patch-clamp pipettes (Fig. 6A,B). This technique enables high-speed and wide-field monitoring without apparent phototoxicity (Sasaki et al., 2007). To enhance the signal-to-noise ratio, we averaged AP-evoked fluorescence signals from five neighboring synaptic varicosities. This measurement was further averaged across 6–10 successive trials, each of which alternated between the resting and 20 mV-depolarized states. After this spatiotemporal averaging, we could clearly observe depolarization-induced enhancement of AP-triggered calcium increases in synaptic boutons, an effect that may be mediated by specific types of voltage-sensitive calcium channels (Yu et al., 2010; Christie et al., 2011). Data collected from 81 axonal segments from seven cells were plotted against the distance the AP traveled or the axonal branch number (Fig. 6C). The depolarization-enhanced signal amplitude could be fitted to a single exponential decay function with a decay constant of either 176 μm (F(1,79) = 30.2; p < 0.001) or 3.4 branches (F(1,79) = 11.2; p = 0.0012).
Figure 6.

Depolarization-induced enhancement of AP-elicited calcium elevations in presynaptic terminals is dependent on the axonal length and the number of branch points through which the APs travel. A, Nipkow-disk confocal calcium imaging from a single presynaptic terminal of a CA3 pyramidal cell. Ten successive traces and their average AP-induced calcium dynamics were obtained from the presynaptic terminal, indicated by the broken-line circle in the left photo. The bottom photo was the 5× magnification of the while box in the top photo. B, Presynaptic calcium imaging from multiple axon segments on a single CA3 pyramidal cell. The axon trajectory (right) was reconstructed from the confocal image taken at a low magnification (left). Traces indicate typical examples of AP-evoked calcium transients recorded from synaptic terminals in three axonal segments (boxed) of a resting (black) or 20 mV-depolarized CA3 neuron (blue). C, Top, Distance-dependent recovery of depolarization-enhanced calcium responses. The curve indicates the least-squares best fit for a single exponential decay function (%Δamplitude = 33.1 × e−d/176; d, distance from the soma; F(1,79) = 30.2; p < 0.001). Bottom, Branch number-dependent recovery of depolarization-enhanced calcium responses. The curve indicates the best fit for a single exponential decay function (%Δamplitude = 32.3 × e−n/3.4; n, number of upstream branches; F(1,79) = 11.2; p = 0.0012). Data presented here were collected from 81 axonal segments from seven cells. D, Top, Representative AP-evoked calcium transients in a resting (black) or 20 mV-depolarized neuron (blue) were recorded from two axon segments at a distance of 209 μm from the soma. The numbers of branch points from the soma were two (left) and four (right). Bottom, Ratios of depolarization-induced enhancement of calcium transients at more branched axonal segments to that at less branched axonal segments are plotted against the distance from the soma. Colors indicate the difference in branching number between two axonal segments. *p = 2 × 10⁻⁵ (paired t test; n = 28 pairs from 13 cells).
Because we used relatively higher concentrations of divalent ions in the ACSF and a lower temperature to obtain these data, we repeated the same experiments under more physiological conditions (3.5 mm K+, 2.0 mm Mg2+, and 1.8 mm Ca2+ at 36°C). The best fit was given at τx = 161 μm and τn = 3.1 branches (single exponential fitting). We also used more mature slice preparations under our routine ionic compositions and temperature (4.54 mm K+, 3.0 mm Mg2+, and 3.0 mm Ca2+ at 30–32°C). After 20–22 d in vitro, the τx and τn values were found to be 159 μm and 3.2 branches. In both conditions, τx and τn values tended to be smaller than that observed under our experimental conditions, although the difference was not statistically significant (p > 0.1; z test for two regression coefficients).
These decay constants for axon lengths and branch points were consistently similar to those obtained when branching-dependent decrease in the axon diameter was assumed in the HH model. However, branch point numbers and axonal path lengths are interdependent in real neurons (Fig. 2C), and one cannot strictly discriminate the independent effects of these two factors using the curve fitting method alone. Therefore, to examine whether branching actually impacts the AP decay, we compared the effect of ΔVsoma at two axonal segments that had an identical distance from the soma but different branch numbers from the soma. For this purpose, we chose calcium-imaging experiments, rather than axon patch-clamp recordings, because of higher experimental throughputs. In an example in Figure 6D (top), calcium traces were recorded at a path distance of 209 μm from the soma; the left and right traces were obtained from axon segments at which two and four branch points existed in the path from the soma, respectively. In the segment with two branches, the size of calcium transients increased to 122% in response to ΔVsoma, whereas the four-branch segment did not show a change (95%). Thus, this two-branch difference produced a 77.9% (95 of 122) drop of the ΔVsoma effect. We repeated similar data sampling from 28 pairs of the axonal segments that had differences of one or two branches and plotted the ratios of ΔVsoma-induced increases in calcium transient sizes (Fig. 6D, bottom; n = 13 cells). We found that even at the same distance, axonal segments with more branches produced significantly smaller modulations by ΔVsoma; the mean ratio was 93.5 ± 1.3% (n = 28 pairs; t(27) = 5.14; p = 2.0 × 10⁻⁵, paired t test). These data are consistent with our theoretical hypothesis that somatic AP modulation is affected by axon length as well as branching.
Short-range somatic influence on CA3 synaptic transmission
To examine the influence of somatic depolarization on synaptic transmission, we performed simultaneous recordings from synaptically connected pairs or triplets of CA3 and CA1 pyramidal cells that were identified using the ROTing technique (Sasaki et al., 2009). For CA3 pairs, neurons located within 100 μm of one another (close pair) or >300 μm apart (distant pair) were selected. Presynaptic CA3 neurons were current injected 50 times at 10 s intervals to evoke single action potentials, and unitary EPSCs (uEPSCs) were recorded from the postsynaptic cells (Fig. 7A).
Figure 7.

Somatic depolarization of CA3 pyramidal cells facilitates CA3-to-CA3 but not CA3-to-CA1 synaptic transmission. A, Representative traces of triple recordings from a presynaptic CA3 pyramidal cell and postsynaptic CA3 (close target) and CA1 (distant target) pyramidal cells. Right traces indicate uEPSCs at CA3-to-CA3 (center) and CA3-to-CA1 synapses (bottom) in response to single APs in a presynaptic CA3 neuron (top) in a resting (black) or 20 mV depolarized state (blue). Fifty trials were averaged for each trace. B, Summary graph depicting somatic depolarization-induced changes in synaptic efficacy between CA3-to-CA3 neuron pairs located within 100 μm (close CA3–CA3 pair), CA3-to-CA3 pairs separated by >300 μm (distant CA3–CA3 pair), and CA3-to-CA1 pairs (CA1–CA3 pair). CA3–CA3 neuron pairs were searched with (closed column) and without ROTing (open column). Using ROTing, data were collected from 11 close CA3–CA3 pairs, 13 distant CA3–CA3 pairs, and 12 CA3–CA1 pairs (*p = 0.04, paired t test). Without ROTing, data were collected from five close and four distant CA3–CA3 pairs (*p = 0.03, paired t test).
The synaptic efficacy (the mean size of uEPSCs) of close CA3-to-CA3, distant CA3-to-CA3, and CA3-to-CA1 transmission was compared between resting and 20 mV depolarized states (Fig. 7B). Somatic depolarization increased the close CA3-to-CA3 synaptic efficacy compared with the efficacy at the resting potential (n = 11 pairs; t(10) = 2.40; p = 0.04, paired t test), whereas no depolarization-induced facilitation occurred at distant CA3-to-CA3 (n = 13 pairs; t(12) = 2.01; p = 0.11, paired t test) or CA3-to-CA1 synapses (n = 12 pairs; t(11) = 1.38; p = 0.19, paired t test).
The ROTing technique requires intracellular loading of calcium dyes into presynaptic neurons. Therefore, dye-mediated calcium chelating might interfere with calcium-dependent process associated with synaptic vesicle release and thereby affect our data. To exclude this possibility, we searched five close CA3-to-CA3 pairs and four distant CA3-to-CA3 pairs by random patching from two or three neurons, without the aid of ROTing. In these naive pairs, we obtained similar results (Fig. 7B; close CA3-to-CA3, t(4) = 3.26, p = 0.03, paired t test; distant CA3 -to-CA3, n = 4 pairs, t(3) = 2.11, p = 0.12, paired t test).
AP-width modulation by spontaneous network activity
Finally, to determine whether the AP width is subject to modulation by intrinsic fluctuations of subthreshold ΔVsoma, we modified the ionic composition of the ACSF to enhance the level of spontaneous activity (Sanchez-Vives and McCormick, 2000; Tsukamoto-Yasui et al., 2007; Lu et al., 2010). Somatic membrane potentials and axonal eAPs were simultaneously recorded from a CA3 pyramidal neuron. Hippocampal mossy fibers were stimulated by electrodes placed on the dentate hilus to mimic synchronous synaptic inputs from dentate granule cells (Fig. 8A). CA3 pyramidal neurons exhibited spontaneous fluctuations in subthreshold membrane potentials with spontaneous or stimuli-evoked APs (Fig. 8B). Changes in axonal eAP width correlated positively with the voltage differences between the resting potential and the mean membrane potentials 1–50 ms before the APs (Fig. 8C). This positive relationship was observed in both evoked (r = 0.53; t(24) = 3.04; p = 0.006) and spontaneous APs (r = 0.48; t(29) = 4.36; p < 0.0001). Our HH model simulation predicted that this relationship should be exponential rather than linear. Exact resting potentials could not be determined in the experiments, however, due to continuous, incoming synaptic activity. Thus, ΔVsoma was calculated as a voltage difference from the average of the minimal 1–10% values of membrane potentials during the observed period (putative resting potential), and the relationship to the AP width was fitted to a simple linear function. Regardless of whether the relationship is linear or nonlinear, our data indicate that, similar to artificially induced ΔVsoma, intrinsically occurring depolarization produces AP broadening, suggesting a physiological relevance for the impact of the internal state of a neuron on information transfer.
Figure 8.

Spontaneous depolarization results in AP broadening. A, Experimental design. The granule cell (GC) layer of the dentate gyrus was stimulated, and the membrane potential and iAPs were whole-cell recorded from a CA3 pyramidal cell (PC). eAPs were recorded from the axon in the cell-attached mode. Intrinsic neural activity was enhanced by low divalent cation concentrations. B, Representative whole-cell (top) and cell-attached (bottom) traces. Blue arrowheads indicate the times of electric stimulation. APs indicated by #1 (resting) and #2 (depolarized) are magnified 1000× in the inset. C, AP broadening was positively correlated with membrane potential at the time of AP initiation. This correlation was observed in stimulation-evoked (blue; r = 0.53, t(24) = 3.04, p = 0.006) and spontaneous APs (black; r = 0.48, t(29) = 4.36, p < 0.0001).
Discussion
In the present study, we demonstrated that ΔVsoma-induced modulation of the AP waveform and presynaptic calcium dynamics decayed depending on the length of the axon and the number of branch points over which AP passed. Unfortunately, the dependence on the number of branch points was not quantitatively shown by our experimental data, but it was confirmed by our HH model and was consistent with the calcium-imaging data. Based on our anatomical and computational analyses, we consider that this branch-dependent recovery of the distorted APs is at least in part due to branch-dependent narrowing of axonal fibers. However, we do not rule out the involvement of other unknown factors. In addition, the facilitatory effect of ΔVsoma on synaptic transmission was observed at nearby but not distant synapses.
In neocortical pyramidal cells and dentate granule cells in acute slice preparations, it has been shown that axonal depolarization by somatic depolarization is reduced with a length constant λ of 400–550 μm (Alle and Geiger, 2006; Shu et al., 2006; Kole et al., 2007). The present work proposes that this λ value may overestimate the true range of the ΔVsoma influence in some types of neurons because of to two facts: (1) λAP is smaller than λ, and (2) the axonal diameter is spatially inhomogeneous.
A nonlinear relationship between λAP and λ was also reported in layer 5 neocortical neurons (Kole et al., 2007). This is a natural consequence of the nonlinear relationship between ΔVsoma and the AP width; depolarization increased the AP width with a rate varying depending on the degree of depolarization. Our pharmacological investigations indicate that the waveform modulation of an AP occurs at the late phase of the AP and is probably caused by a change in the kinetics of voltage-sensitive potassium channels. The availability of potassium channels is well known to depend on the membrane potential at which an AP is initiated. Consistent with this, we succeeded in replicating the nonlinear relationship between ΔVsoma and the AP width by incorporating a voltage-dependent inactivation curve of potassium conductance into the HH model; note that the conventional HH neuron generates a stereotyped AP and does not exhibit ΔVsoma-induced AP broadening. Another important consequence of the nonlinear relationship between ΔVsoma and the AP width is that the relationship between λAP and λ depends on ΔVsoma; λAP is smaller than λ to more extents at larger ΔVsoma. Therefore, the effect of ΔVsoma drops more rapidly along the axon length under more depolarized states.
We found that ΔVsoma-augmented presynaptic calcium dynamics decayed with λcalcium = 176 μm, which is similar to λAP. Therefore, it is unlikely that the influence of ΔVsoma on synaptic transmission reaches the distance expected simply by λ. However, it remains controversial whether ΔVsoma-induced synaptic facilitation is mediated by modification of the AP waveform or presynaptic calcium dynamics. In cortical principal cells, ΔVsoma modulates the AP waveform by changing Kv1-type potassium channel kinetics (Kole et al., 2007; Shu et al., 2007). In contrast, presynaptic depolarization at the calyx of Held facilitates synaptic transmission without distorting AP waveforms (Awatramani et al., 2005). ΔVsoma-induced synaptic facilitation is mediated by calcium channel facilitation at the calyx of Held (Awatramani et al., 2005; Hori and Takahashi, 2009) and at GABAergic synapses in the molecular layer of the cerebellum (Christie et al., 2011) but not at hippocampal mossy fiber synapses (Alle and Geiger, 2006; Scott et al., 2008). Therefore, the mechanism underlying the ΔVsoma modulation of synaptic efficacy differs depending on the type of synapse. Our current study provides the first evidence that ΔVsoma affects both the AP waveform and the presynaptic calcium dynamics at recurrent fibers between hippocampal CA3 pyramidal cells.
Our imaging data must be interpreted with caution because we used a relatively high concentration (250 μm) of OGB1, a high-affinity calcium probe, to monitor calcium levels in presynaptic terminals. Because the dyes used to monitor calcium dynamics in distant synapses had to diffuse intra-axonally over a long range, we could not achieve usable signal-to-noise ratios for OGB1 fluorescence at lower concentrations or with other low-affinity calcium probes (Yu et al., 2010). The development of highly sensitive, genetically encoded calcium indicators will help clarify the true relationship between ΔVsoma and presynaptic calcium dynamics.
Although the decay constants (λ, λAP, and λcalcium) may vary between experimental systems, the data are consistent and suggest that ΔVsoma influences local but not distant synapses. Indeed, we found that at associational recurrent fibers of hippocampal CA3 pyramidal cells, the facilitatory effect of somatic depolarization was observed only at close CA3-to-CA3 synapses, but not distant CA3-to-CA3 or CA3-to-CA1 synapses. This target-selective synaptic facilitation is likely due to the axon distance as well as branch points between the soma and the synapses recorded, because the axons of CA3 pyramidal cells are highly arborized even in the vicinity of the soma. Thus, the somatic membrane potential of these neurons modified the internal computational operation in the local circuit without affecting long-projection output. If this locally selective modulation is the case in the neocortex, such differential modulations may work to differentiate the modes of intracolumnar and intercolumnar communications. In any case, excitatory projection neurons in the neocortex and hippocampus typically form synaptic connections with both local and distant target neurons simultaneously. Therefore, it is plausible that these neurons differentially modulate proximal and distal synaptic outputs depending on the activity states of the local network, e.g., active (depolarized, UP) or quiescent (hyperpolarized, DOWN) states.
Footnotes
This work was supported in part by Grants-in-Aid for Science Research 18021008, 22115003, 22115013, 22650080, and 22680025 from the Ministry of Education, Culture, Sports, Science and Technology of Japan; the Suzuken Memorial Foundation; the Kanae Foundation for the Promotion of Medical Science; the Daiichi-Sankyo Foundation of Life Science; and Funding Program for Next Generation World-Leading Researchers Grant LS023.
References
- Alle H, Geiger JR. Combined analog and action potential coding in hippocampal mossy fibers. Science. 2006;311:1290–1293. doi: 10.1126/science.1119055. [DOI] [PubMed] [Google Scholar]
- Alle H, Geiger JR. Analog signalling in mammalian cortical axons. Curr Opin Neurobiol. 2008;18:314–320. doi: 10.1016/j.conb.2008.08.006. [DOI] [PubMed] [Google Scholar]
- Awatramani GB, Price GD, Trussell LO. Modulation of transmitter release by presynaptic resting potential and background calcium levels. Neuron. 2005;48:109–121. doi: 10.1016/j.neuron.2005.08.038. [DOI] [PubMed] [Google Scholar]
- Christie JM, Chiu DN, Jahr CE. Ca2+-dependent enhancement of release by subthreshold somatic depolarization. Nat Neurosci. 2011;14:62–68. doi: 10.1038/nn.2718. [DOI] [PMC free article] [PubMed] [Google Scholar]
- Conchello JA, Lichtman JW. Optical sectioning microscopy. Nat Methods. 2005;2:920–931. doi: 10.1038/nmeth815. [DOI] [PubMed] [Google Scholar]
- Dayan P, Abbott LF. Theoretical neuroscience: computational and mathematical modeling of neural systems. Cambridge, MA: Massachusetts Institute of Technology; 2001. [Google Scholar]
- Desmond NL, Levy WB. Dendritic caliber and the 3/2 power relationship of dentate granule cells. J Comp Neurol. 1984;227:589–596. doi: 10.1002/cne.902270410. [DOI] [PubMed] [Google Scholar]
- Hodgkin AL, Huxley AF. A quantitative description of membrane current and its application to conduction and excitation in nerve. J Physiol. 1952;117:500–544. doi: 10.1113/jphysiol.1952.sp004764. [DOI] [PMC free article] [PubMed] [Google Scholar]
- Hori T, Takahashi T. Mechanisms underlying short-term modulation of transmitter release by presynaptic depolarization. J Physiol. 2009;587:2987–3000. doi: 10.1113/jphysiol.2009.168765. [DOI] [PMC free article] [PubMed] [Google Scholar]
- Ishikawa D, Takahashi N, Sasaki T, Usami A, Matsuki N, Ikegaya Y. Fluorescent pipettes for optically targeted patch-clamp recordings. Neural Netw. 2010;23:669–672. doi: 10.1016/j.neunet.2010.02.004. [DOI] [PubMed] [Google Scholar]
- Khaliq ZM, Raman IM. Relative contributions of axonal and somatic Na channels to action potential initiation in cerebellar Purkinje neurons. J Neurosci. 2006;26:1935–1944. doi: 10.1523/JNEUROSCI.4664-05.2006. [DOI] [PMC free article] [PubMed] [Google Scholar]
- Kole MH, Letzkus JJ, Stuart GJ. Axon initial segment Kv1 channels control axonal action potential waveform and synaptic efficacy. Neuron. 2007;55:633–647. doi: 10.1016/j.neuron.2007.07.031. [DOI] [PubMed] [Google Scholar]
- Koyama R, Muramatsu R, Sasaki T, Kimura R, Ueyama C, Tamura M, Tamura N, Ichikawa J, Takahashi N, Usami A, Yamada MK, Matsuki N, Ikegaya Y. A low-cost method for brain slice cultures. J Pharmacol Sci. 2007;104:191–194. doi: 10.1254/jphs.sc0070119. [DOI] [PubMed] [Google Scholar]
- Li XG, Somogyi P, Ylinen A, Buzsaki G. The hippocampal CA3 network: an in vivo intracellular labeling study. J Comp Neurol. 1994;339:181–208. doi: 10.1002/cne.903390204. [DOI] [PubMed] [Google Scholar]
- Lu B, Zhang Q, Wang H, Wang Y, Nakayama M, Ren D. Extracellular calcium controls background current and neuronal excitability via an UNC79-UNC80-NALCN cation channel complex. Neuron. 2010;68:488–499. doi: 10.1016/j.neuron.2010.09.014. [DOI] [PMC free article] [PubMed] [Google Scholar]
- Perkins KL. Cell-attached voltage-clamp and current-clamp recording and stimulation techniques in brain slices. J Neurosci Methods. 2006;154:1–18. doi: 10.1016/j.jneumeth.2006.02.010. [DOI] [PMC free article] [PubMed] [Google Scholar]
- Raastad M, Shepherd GM. Single-axon action potentials in the rat hippocampal cortex. J Physiol. 2003;548:745–752. doi: 10.1113/jphysiol.2002.032706. [DOI] [PMC free article] [PubMed] [Google Scholar]
- Rall W. Branching dendritic trees and motoneuron membrane resistivity. Exp Neurol. 1959;1:491–527. doi: 10.1016/0014-4886(59)90046-9. [DOI] [PubMed] [Google Scholar]
- Sanchez-Vives MV, McCormick DA. Cellular and network mechanisms of rhythmic recurrent activity in neocortex. Nat Neurosci. 2000;3:1027–1034. doi: 10.1038/79848. [DOI] [PubMed] [Google Scholar]
- Sasaki T, Matsuki N, Ikegaya Y. Metastability of active CA3 networks. J Neurosci. 2007;27:517–528. doi: 10.1523/JNEUROSCI.4514-06.2007. [DOI] [PMC free article] [PubMed] [Google Scholar]
- Sasaki T, Takahashi N, Matsuki N, Ikegaya Y. Fast and accurate detection of action potentials from somatic calcium fluctuations. J Neurophysiol. 2008;100:1668–1676. doi: 10.1152/jn.00084.2008. [DOI] [PubMed] [Google Scholar]
- Sasaki T, Minamisawa G, Takahashi N, Matsuki N, Ikegaya Y. Reverse optical trawling for synaptic connections in situ. J Neurophysiol. 2009;102:636–643. doi: 10.1152/jn.00012.2009. [DOI] [PubMed] [Google Scholar]
- Sasaki T, Matsuki N, Ikegaya Y. Action-potential modulation during axonal conduction. Science. 2011;331:599–601. doi: 10.1126/science.1197598. [DOI] [PubMed] [Google Scholar]
- Scott R, Ruiz A, Henneberger C, Kullmann DM, Rusakov DA. Analog modulation of mossy fiber transmission is uncoupled from changes in presynaptic Ca2+ J Neurosci. 2008;28:7765–7773. doi: 10.1523/JNEUROSCI.1296-08.2008. [DOI] [PMC free article] [PubMed] [Google Scholar]
- Shu Y, Hasenstaub A, Duque A, Yu Y, McCormick DA. Modulation of intracortical synaptic potentials by presynaptic somatic membrane potential. Nature. 2006;441:761–765. doi: 10.1038/nature04720. [DOI] [PubMed] [Google Scholar]
- Shu Y, Yu Y, Yang J, McCormick DA. Selective control of cortical axonal spikes by a slowly inactivating K+ current. Proc Natl Acad Sci U S A. 2007;104:11453–11458. doi: 10.1073/pnas.0702041104. [DOI] [PMC free article] [PubMed] [Google Scholar]
- Takahashi N, Sasaki T, Matsumoto W, Matsuki N, Ikegaya Y. Circuit topology for synchronizing neurons in spontaneously active networks. Proc Natl Acad Sci U S A. 2010;107:10244–10249. doi: 10.1073/pnas.0914594107. [DOI] [PMC free article] [PubMed] [Google Scholar]
- Takahashi N, Kitamura K, Matsuo N, Mayford M, Kano M, Matsuki N, Ikegaya Y. Locally synchronized synaptic inputs. Science. 2012 doi: 10.1126/science.1210362. in press. [DOI] [PubMed] [Google Scholar]
- Tsukamoto-Yasui M, Sasaki T, Matsumoto W, Hasegawa A, Toyoda T, Usami A, Kubota Y, Ochiai T, Hori T, Matsuki N, Ikegaya Y. Active hippocampal networks undergo spontaneous synaptic modification. PLoS One. 2007;2:e1250. doi: 10.1371/journal.pone.0001250. [DOI] [PMC free article] [PubMed] [Google Scholar]
- Turner DA, Schwartzkroin PA. Steady-state electrotonic analysis of intracellularly stained hippocampal neurons. J Neurophysiol. 1980;44:184–199. doi: 10.1152/jn.1980.44.1.184. [DOI] [PubMed] [Google Scholar]
- Wittner L, Henze DA, Zaborszky L, Buzsaki G. Three-dimensional reconstruction of the axon arbor of a CA3 pyramidal cell recorded and filled in vivo. Brain Struct Funct. 2007;212:75–83. doi: 10.1007/s00429-007-0148-y. [DOI] [PMC free article] [PubMed] [Google Scholar]
- Yu Y, Maureira C, Liu X, McCormick D. P/Q and N channels control baseline and spike-triggered calcium levels in neocortical axons and synaptic boutons. J Neurosci. 2010;30:11858–11869. doi: 10.1523/JNEUROSCI.2651-10.2010. [DOI] [PMC free article] [PubMed] [Google Scholar]