

Abstract
Background
Cytokines, chemokines, C-reactive proteins (CRP) and ferritin are known inflammatory markers. However, cytokines such as interleukin (IL-1β), (IL-6) and tumour necrosis factor (TNF-α) have been reported to interfere with both the bone resorption and bone formation processes. Similarly, immune cell cytokines are known to contribute to inflammation of the adipose tissue especially with obesity. IL-10 but not IL-33 has been linked to lower ferritin levels and anemia. In this study, we hypothesized that specific cytokine levels in the plasma of women with low bone mineral density (BMD) would be higher than those in the plasma of healthy women due to the actions of elevated levels of pro-inflammatory cytokines in inducing osteoclast formation and differentiation during senescence.
Results
Levels of cytokines (IFNα2, IFN-γ, IL-12p70, IL-33) and monocyte chemoattractant protein-1 (MCP-1) were significantly higher in the plasma of the osteoporotic group compared to the osteopenic and/or healthy groups. Meanwhile CRP levels were significantly lower in women with osteoporosis (P = 0.040) than the osteopenic and healthy groups. Hip BMD values were significantly lower in women with high/detectable values of IL-1β (P = 0.020) and IL-6 (P = 0.030) compared to women where these were not detected. Similarly, women with high/detectable values of IL-1β had significantly lower spine BMD than those where IL-1β was not detected (P = 0.030). Participants’ CRP levels were significantly positively correlated with BMI, fat mass and fat percentage (P < 0.001). In addition, ferritin levels of women with high/detectable values of anti-osteoclastogenic IL-10 (P = 0.012) and IL-33 (P = 0.017) were significantly lower than those where these were not detected. There was no statistically significant association between TNF-α and BMD of the hip and lumbar spine.
Conclusions
High levels of cytokines (IFNα2, IFN-γ, IL-12p70, IL-33) and MCP-1 in apparently healthy postmenopausal women are associated with bone health issues. In addition, an increase in levels of IL-10 and IL-33 may be associated with low ferritin levels in this age group.
Trial registration
ANZCTR, ACTRN12617000802303. Registered May 31st, 2017, https://www.anzctr.org.au/Trial/Registration/TrialReview.aspx?id=373020
Keywords: Inflammatory markers, Cytokines, Chemokines, Ferritin, Osteo-immunology, Bone mineral density, Bone health, Postmenopausal women, Aging
Background
Cytokines are a large group of peptides and proteins, which are known to be involved in the signaling between the cells of the immune system [1, 2]. Examples of cytokines include interleukins (ILs), chemokines, interferons (IFNs), colony stimulating factors, tumour necrosis factors (TNFs), transforming growth factors (TGFs) and adipokines. Cytokines affect almost all biological processes in the body and can be either detrimental or beneficial depending on the amounts produced and conditions surrounding the production [1]. Cytokines play a critical role in the coordination of the immune system that is necessary for resolving bacterial and viral attacks on the immune system.
Furthermore, osteoporosis is a major public health concern which as a result of the demineralisation and weakening of bones leads to increased fracture risk [3]. Annually, reports suggest that osteoporosis causes more than 8.9 million fractures worldwide, resulting in an osteoporotic fracture every three seconds [4]. The burden of osteoporosis is therefore not limited to economic costs but also significant emotional and physical consequences, especially for middle aged and elderly men and women.
Aberrant or prolonged immune responses resulting in low-grade inflammation have been implicated in the pathogenesis of osteoporosis. In postmenopausal women, this is coupled with a decrease in oestrogen levels that leads to an increase in bone resorption [5]. Inflammation has also been related to indices of musculoskeletal health and several age-related diseases such as atherosclerosis, Alzheimer’s disease and cancer [6].
C-reactive protein (CRP) is known to be a sensitive systemic inflammatory marker. The production of CRP in the liver, which upregulates levels of cytokines such as IL-1, IL-6 and TNF-α has been observed to be positively correlated with bone resorption including hip and spinal bone loss in healthy pre- and postmenopausal women [7–9].
Cytokines are also known as crucial regulators of the adipose tissue metabolism especially in obese individuals with body mass index (BMI) and fat percentage above 25 kg/m2 and 32% respectively as an indicator of obesity. Cell types, pre-adipocytes and mature adipocytes are able to promote secretion of cytokines and chemokines associated with increased mRNA expression, notably in obese individuals [10, 11].
Infection, injury or trauma influences iron status. Ferritin is known as an acute phase reactant, a marker of inflammation. In addition, serum ferritin concentration is well-known as an important indicator of total body iron stores. The hormone, hepcidin is a major regulator of systemic iron homeostasis in the liver and it is induced during inflammation leading to leakage of ferritin into the plasma from damaged cells. This causes sequestration of iron and increased serum ferritin.
Cytokines in general are often complicated to research due to their synergistic effects and their ability to affect or enhance each other’s secretion. For example, IL-1 acts in synergy with TNF-α [12]. However, the cytokine network is significant in the regulation of the immune cells (primarily lymphocytes and macrophages) and the skeletal system where a natural balance is needed for bone metabolic homeostasis [13].
Based on observations and research in animal and in-vitro studies, cytokines have been classified according to their stimulatory or inhibitory effect on proliferation and differentiation of osteoclasts. Cytokines such as receptor activator of nuclear factor kappa-Β ligand (RANKL), macrophage colony-stimulating factor (M-CSF), IL-1, IL-6, IL-7, IL-11, IL-15, IL-17, IL-23, IL-34, monocyte chemoattractant protein-1 (MCP-1), TNF-α, TNF-β have been reported for their stimulating effects on osteoclastogenesis (OC) [6, 14–18]. Meanwhile, IL-1ra, IL-3, IL-4, IL-10, IL-12, IL-18, IL-27, IL-33, interferon IFN-α, IFN-β, IFN-λ, OPG and transforming growth factor-β (TGF-β) have been reported to have inhibitory effect on the proliferation and differentiation of osteoclasts [6, 15, 19–22]. These studies have indicated that low-grade inflammation, due to the effect of pro-inflammatory cytokines, impairs DNA repair and leads to cellular and immunological senescence as well as biological ageing. Increase of IL-31 has also been linked to decreased BMD in postmenopausal women [23]. However, the course of inflammageing is multi-factorial, resulting not only from immunosenescence but also from several factors such as dietary patterns, obesity and gut microbiota status [6].
The aim of this study was to measure levels of inflammatory markers in postmenopausal women. The outcomes of this study were; 1. The relationship between levels of inflammatory markers and lumbar spine, hip BMD, bone markers and osteoporosis status. 2. The relationship between inflammatory markers and obesity/adiposity. 3. The relationship between anti-inflammatory cytokines and ferritin levels in apparently healthy postmenopausal women. To our knowledge, no study has related these 15 immune markers to bone health in postmenopausal women.
Methods
Subjects
A total of 127 New Zealand European postmenopausal women aged between 54 and 81 years participated in the ‘BugsnBones’ study that took place in the Human Nutrition Research Unit at Massey University, Palmerston North campus from June to December 2017 [24]. Eighty-six women were then selected to participate in phase 2 for this study based on their bone strength for groups of healthy, osteopenic and osteoporotic women. Sample size was calculated using G*Power software version 3.0.10 and eighty-eight subjects were required for each group at a 90% power and an alpha of 5% for T-test. During this cross-sectional study, two subjects were excluded from the study, one due to consumption of a ketogenic diet and the other for health reasons. Subjects were recruited by advertisement on campus, the Wanganui Chronicle and by using a recruitment agency; Trial Facts (https://trialfacts.com/). The inclusion criteria were menopause of at least 5 years based on no menstruation. Exclusion criteria were presence of any systemic disease, food intolerances affecting the gastrointestinal tract, smoking and high intake of alcohol. Subjects with significant weight loss or weight gain within the past year were also excluded. All subjects were free living and apparently healthy. Written informed consent was obtained from subjects before commencing data collection.
Anthropometric and body composition measurements of the subjects
The body weight of subjects was measured using the Detecto 437 eye-level weigh beam physician scale to the nearest 0.2 kg and standing height was measured using a stadiometer to the nearest 0.1 cm wearing light clothes and no shoes. Body mass Index (BMI) was calculated as weight divided by height squared (kg/m2) using the Quetelet’s index. Waist to hip ratio was determined by measuring the waist and hip circumference to the nearest 0.1 cm using a non-stretchable tape. Waist to hip ratio was calculated as a marker of abdominal obesity.
Body composition measurements including fat mass (FM), lean mass (LM) and fat percentage were measured and analysed using the Hologic QDR series Discovery A, Bone densitometer [Dual energy X-ray Absorptiometry (DXA)]. Bone mineral density was measured at the femoral neck (FN), lumbar spine (LS) [L1-L4], trochanter, Ward’s triangle and total hip. The in vivo reproducibility of the coefficient of variation ranged between 0.34–0.70% for all measured sites. The DXA machine was calibrated every morning for all the measurements and at the end of each day. The reported spine BMD values were calculated as means of four measured values from L1–L4. Apex System Software version 4.5.3 was used to analyse the DXA scans. Osteoporosis was defined as a T score ≤ − 2·5 and osteopenia as T score between − 1.0 and − 2.5 according to the WHO criteria [25].
Biochemical blood and bone marker collection and analyses
Plasma samples were collected from centrifuged fasting venous blood samples and stored frozen at -80 °C before analysis. Cytokine assays were prepared using BioLegend® LEGENDplex™ Multi-Analyte Flow Assay kit’s instructions and measured using the Beckman Coulter’s Gallios flow cytometer. Levels of 13 cytokines, namely IL-1β, IFN-α2, IFN-λ, TNF-α, MCP-1, IL-6, IL-8, IL-10, IL-12p70, IL-17A, IL-18, IL-23 and IL-33 were quantified in plasma from the subjects. LEGENDplex™ Data Analysis Software version 8.0 was used to analyze the data. Plasma levels of CRP and ferritin were measured using the electrochemiluminescence immunoassay “ECLIA”. Bone markers C-terminal telopetide (CTX-1) and total procollagen type 1 N-terminal propeptide (P1NP) were analysed by electrochemiluminescence immunoassay using the Roche COBAS® e411 system (Roche Diagnostics, Indianapolis, IN, USA), while vitamin 25(OH)D3 was analysed using isotope-dilution liquid chromatography-tandem mass spectrometry (ID-LC-MS-MS) by Canterbury Health, Christchurch, New Zealand.
Statistical analysis
IBM SPSS version 25 (IBM Company, Armonk, NY, USA) and Minitab were used for the tabular representation of data while R statistical software and Excel were used for the graphical representations. The outcome variables used were spine and hip BMD and T-score. The values of all variables are presented as mean ± standard deviation. One-way analysis of variance (ANOVA) was used to compare the mean values of the CRP quartiles with the subjects’ characteristics. Likewise, ANOVA was used for the comparison of the means of osteoporosis classes (healthy, osteopenia and osteoporosis groups) against levels of cytokines. The mean difference between grouped IL-1β and IL-6 levels and the subjects’ characteristics was determined using the independent t-test. Pearson correlations were used to investigate the relationship between inflammatory markers (continuous) and physiological parameters and bone markers. Partial correlation analyses of the inflammation markers (adjusted for age, height and BMI) were performed against lumbar spine and hip bone mineral content (BMC), BMD, T-score and the bone markers. Correlation results were presented as Pearson correlation coefficient (r) and p-value. All p-values were reported significant at 0.05 or less.
Results
The characteristics of the participants who were included in the study are shown in Table 1. Mean (SD) age for participants was 63.2 (4.6) years. The BMI, calculated using the Quetelet’s index, ranged from 14.9 to 38.3 kg/m2.
Table 1.
Characteristics of participants
| Parameters (n = 86) |
Mean ± SD | Min | Max |
|---|---|---|---|
| Age (years) | 63.2 ± 4.6 | 54 | 81 |
| Weight (kg) | 67.3 ± 10.2 | 43.0 | 89.2 |
| Height (cm) | 161.9 ± 5.2 | 149.1 | 1 73.5 |
| BMI (kg/m2) | 25.7 ± 3.8 | 14.9 | 38.3 |
| WC (cm) | 79.7 ± 10.9 | 57.0 | 110.0 |
| HC (cm) | 98.0 ± 7.0 | 78.0 | 112.0 |
| WH Ratio | 0.8 ± 0.1 | 0.7 | 1.0 |
| Spine BMC | 53.3 ± 11.6 | 31.3 | 82.6 |
| Spine BMD | 0.9 ± 0.2 | 0.5 | 1.3 |
| Spine T-score | −1.1 ± 1.4 | −4.6 | 2.6 |
| Hip BMC | 29.2 ± 5.2 | 19.0 | 44.2 |
| Hip BMD | 0.8 ± 0.1 | 0.6 | 1.1 |
| Hip T-score | −0.8 ± 0.9 | −2.5 | 1.4 |
| Total Fat% | 40.4 ± 6.0 | 14.8 | 51.1 |
| Total lean mass (kg) | 40.1 ± 4.5 | 30.7 | 51.2 |
| Ferritin (μg/L) | 142.9 ± 100.9 | 15.00 | 467.00 |
| 25(0H)D3 (nmol/L) | 78.1 ± 23.5 | 21.00 | 160.00 |
BMI Body mass index, WC Waist circumference, HC Hip circumference, WH Waist to hip, BMC Bone mineral content, BMD Bone mineral density
Subsequently, one-way ANOVA was performed to compare the mean differences according to the quartiles of CRP levels (Table 2). Significant increase in BMI and various body fat percentage was observed as CRP levels increased indicating a positive correlation. On the other hand, the relationship between BMD and T-score with CRP levels was inconsistent and not statistically significant.
Table 2.
Characteristics according to quartiles of CRP
| Parameters | < 0.60 mg/L (n = 26) | 0.61–1.0 mg/L (n = 17) | 1.01–2.20 mg/L (n = 20) | > 2.21 mg/L (n = 20) | F-value | P-value |
|---|---|---|---|---|---|---|
| Age (years) | 62.4(4.1) | 64.5(6.4) | 63.9(4.3) | 63.1(3.9) | 0.871 | 0.460 |
| BMI (kg/m2) | 23.3(3.4) | 25.7(3.4) | 27.6(2.6) | 27.2(4.3) | 7.489 | < 0.001 |
| WC (cm) | 73.3(9.7) | 80.6(12.0) | 84.7(7.2) | 83.0(11.3) | 5.853 | 0.001 |
| Waist to Hip ratio | 0.77(0.07) | 0.82(0.09) | 0.84(0.06) | 0.83(0.09) | 4.150 | 0.009 |
| Spine BMD | 0.89(0.18) | 0.91(0.14) | 0.93(0.15) | 0.94(0.16) | 0.434 | 0.729 |
| Spine T-score | −1.4(1.6) | −1.2(1.2) | −1.1(1.4) | −0.9(1.3) | 0.533 | 0.661 |
| Hip BMD | 0.81(0.12) | 0.86(0.12) | 0.84(0.12) | 0.85(0.08) | 0.715 | 0.546 |
| Hip T-score | −1.27(0.88) | −0.55(1.00) | −0.68(1.06) | − 0.73(0.67) | 0.795 | 0.500 |
| Android fat % | 32.3(8.1) | 35.0(8.6) | 39.9(5.9) | 39.3(8.2) | 4.795 | 0.004 |
| Gynoid fat % | 40.7(7.3) | 43.2(4.0) | 44.6(3.6) | 44.6(4.4) | 2.881 | 0.041 |
| Android:Gynoid ratio | 0.79(0.13) | 0.81(0.17) | 0.90(0.12) | 0.87(0.14) | 2.737 | 0.049 |
| Trunk fat % | 32.8(7.1) | 36.4(7.3) | 40.4(4.2) | 40.2(7.5) | 6.778 | < 0.001 |
| Body fat % | 36.9(6.9) | 40.2(5.7) | 42.9(2.9) | 42.9(5.6) | 6.072 | 0.001 |
| TFM/TLM | 0.6(0.2) | 0.7(0.2) | 0.8(0.1) | 0.8(0.2) | 7.094 | 0.001 |
| Ferritin (μg/L) | 134.0(118.9) | 160.4(105.8) | 130.5(89.5) | 154.1(93.0) | 0.398 | 0.755 |
| 25(OH)D3 (nmol/L) | 83.6(24.8) | 80.0(16.6) | 75.1(23.6) | 73.2(24.8) | 0.955 | 0.418 |
BMI Body mass index, WC Waist circumference, BMD Bone mineral density, TFM Total fat mass, TLM Total lean mass, CRP C-reactive protein. Variables are reported as mean values with their standard deviation (SD). Number of participants (n). Significant values are in bold text
The relationship between levels of inflammatory markers and osteoporosis status of the participants was also investigated (Table 3). The spine classification was used because of a higher incidence of osteoporosis at the spine than the hip. Mean levels of all the inflammatory markers were higher among the osteoporotic group except in the case of CRP, which was significantly lower in the osteoporotic women, and TNF-α and IL-6 levels which did not show consistent patterns. Meanwhile, there were significant differences for IFN-α2 (P = 0.027), IFN-γ (P = 0.009), MCP-1 (borderline), IL-12p70 (P = 0.049), and IL-33 (P = 0.048) across the groups.
Table 3.
Cytokines/inflammatory markers according to spine osteoporosis status
| Markers | Osteoporotic | Osteopenic | Healthy | F-value | P-value |
|---|---|---|---|---|---|
| (n = 13) | (n = 34) | (n = 39) | |||
| IL-1β (pg/ml) | 7.22(17.59) | 2.06(4.88) | 1.52(4.21) | 2.670 | 0.075 |
| IFN-α2 (pg/ml) | 35.28(48.19) | 9.96(18.95) | 18.42(26.63) | 3.783 | 0.027 |
| IFN-γ (pg/ml) | 153.38(222.32) | 50.67(58.72) | 57.91(73.24) | 4.956 | 0.009 |
| TNF-α (pg/ml) | 2.01(2.70) | 1.83(3.72) | 3.19(6.02) | 0.795 | 0.455 |
| MCP-1 (pg/ml) | 221.36(100.46) | 176.66(43.13) | 200.73(55.68) | 3.000 | 0.055 |
| IL-6 (pg/ml) | 3.22(4.29) | 3.14(11.26) | 3.09(10.61) | 0.001 | 0.999 |
| IL-8 (pg/ml) | 23.85(42.34) | 11.19(11.84) | 10.66(14.99) | 2.220 | 0.115 |
| IL-10 (pg/ml) | 4.62(15.67) | 0.57(1.52) | 0.75(1.95) | 2.261 | 0.111 |
| IL-12p70 (pg/ml) | 6.47(17.03) | 1.86(5.74) | 0.48(1.36) | 3.128 | 0.049 |
| IL-17A (pg/ml) | 102.40(227.62) | 41.75(79.92) | 31.11(45.72) | 2.303 | 0.106 |
| IL-18 (pg/ml) | 153.45(72.70) | 133.21(69.18) | 144.98(51.66) | 0.600 | 0.551 |
| IL-23 (pg/ml) | 103.40(173.69) | 56.60(91.14) | 42.84(55.70) | 1.970 | 0.146 |
| IL-33 (pg/ml) | 13.88(37.44) | 0.79(3.32) | 2.83(11.19) | 3.147 | 0.048 |
| CRP (μg/ml) | 0.75(1.07) | 1.39(1.36) | 2.04(2.05) | 3.219 | 0.044 |
| Ferritin (μg/L) | 149.46(116.16) | 124.45(94.57) | 156.29(103.72) | 0.890 | 0.415 |
IL Interleukin, IFN Interferon, MCP Monocyte chemoattractant protein, CRP C-reactive protein. Osteoporosis status was according to WHO classification [25]. Variables are reported as mean values with their standard deviation (SD). Number of participants (n). Significant values are in bold text
Based on the hip osteoporosis classification; ANOVA results of MCP-1 were significantly higher in the osteoporotic group compared to the osteopenic and healthy group (p = 0.003), however it should be noted that the osteoporotic group was small (n = 1).
The cytokines and chemokines were generally higher in the osteoporotic group than the healthy/normal or osteopenic groups in this apparently healthy postmenopausal women (Fig. 1).
Fig. 1.
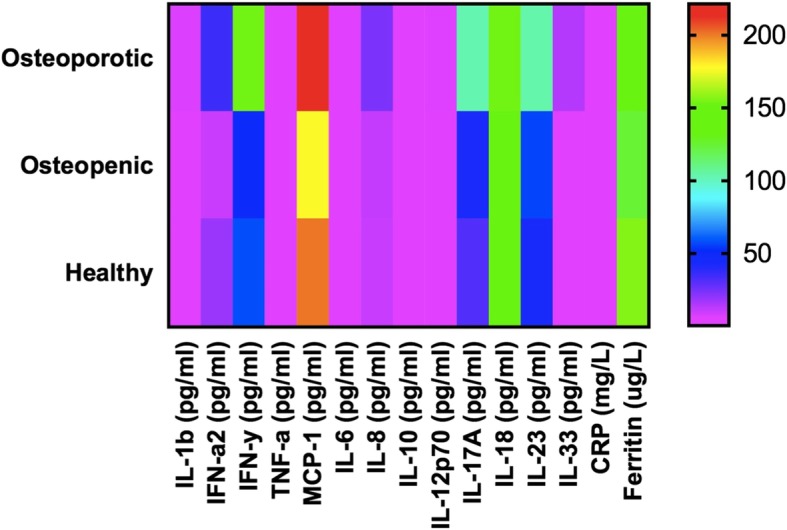
Heat map of inflammatory markers by spine osteoporosis classification
Investigating the relationship between IL-1β and bone status further, significant differences were found between categories of IL-1β (< 2.39 pg/ml and > 2.39 pg/ml) and spine BMC, BMD, T-score and hip BMD as shown in Table 4. Higher levels of IL-1β were associated with lower BMC, BMD and T-score.
Table 4.
Independent T-test of characteristics of participants by IL-1β
| Variables | IL-1β (< 2.39 pg/ml) [68] | IL-1β (> 2.39 pg/ml) [18] | P-value |
|---|---|---|---|
| Age (years) | 63.29 ± 4.58 | 62.89 ± 4.86 | 0.742 |
| Weight (kg) | 67.31 ± 10.28 | 67.37 ± 10.25 | 0.981 |
| Height (cm) | 161.65 ± 5.19 | 162.57 ± 5.20 | 0.506 |
| BMI (kg/m2) | 25.77 ± 3.87 | 25.48 ± 3.62 | 0.770 |
| WC (cm) | 79.79 ± 10.92 | 79.37 ± 11.10 | 0.885 |
| Waist-Hip ratio | 0.81 ± 0.08 | 0.81 ± 0.08 | 0.990 |
| Spine BMD | 0.94 ± 0.16 | 0.85 ± 0.14 | 0.028 |
| Spine T-score | −0.94 ± 1.43 | −1.77 ± 1.26 | 0.021 |
| Femoral Neck BMD | 0.71 ± 0.10 | 0.66 ± 0.08 | 0.019 |
| Hip BMD | 0.85 ± 0.12 | 0.79 ± 0.09 | 0.020 |
| Hip T-score | −0.73 ± 0.95 | −1.16 ± 0.86 | 0.071 |
| Lean mass (kg) | 40.07 ± 4.43 | 40.37 ± 4.78 | 0.798 |
| Total Fat% | 40.34 ± 6.22 | 40.40 ± 5.36 | 0.967 |
| Ferritin (μg/L) | 145.03 ± 107.45 | 134.28 ± 81.40 | 0.647 |
| 25(OH)D3 (nmol/L) | 78.32 ± 29.94 | 77.00 ± 18.62 | 0.806 |
IL Interleukin, BMI Body mass index, WC Waist circumference, BMC Bone mineral content, BMD Bone mineral density, CRP C-reactive protein. Variables are reported as mean values with their standard deviation (SD). Number of participants [n]. Significant values are in bold text
Table 5 shows the relationship between IL-6 and participants’ characteristics indicating significant differences between IL-6 and weight, waist circumference as well as the hip BMC and BMD. There were higher levels of IL-6 found in individuals with lower BMC, BMDs and T-scores.
Table 5.
Independent T-test of participants’ characteristics by IL-6
| Variables | IL-6 (< 1.62 pg/ml) [53] | IL-6 (> 1.62 pg/ml) [33] | P-value |
|---|---|---|---|
| Age (years) | 63.34 ± 4.86 | 63.00 ± 4.24 | 0.734 |
| Weight (kg) | 65.66 ± 10.05 | 70.00 ± 10.03 | 0.054 |
| Height (cm) | 161.66 ± 5.01 | 162.15 ± 5.49 | 0.672 |
| BMI (kg/m2) | 25.09 ± 3.47 | 26.69 ± 4.16 | 0.057 |
| WC (cm) | 77.59 ± 9.77 | 83.11 ± 11.88 | 0.021 |
| Waist-Hip ratio | 0.80 ± 0.07 | 0.84 ± 0.09 | 0.020 |
| Spine BMD | 0.94 ± 0.15 | 0.90 ± 0.17 | 0.343 |
| Spine T-score | −0.99 ± 1.37 | −1.32 ± 1.52 | 0.291 |
| Femoral Neck BMD | 0.71 ± 0.10 | 0.67 ± 0.09 | 0.035 |
| Hip BMD | 0.86 ± 0.12 | 0.81 ± 0.10 | 0.033 |
| Hip T-score | −0.64 ± 0.98 | −1.10 ± 0.82 | 0.023 |
| Lean mass (kg) | 39.55 ± 4.59 | 41.07 ± 4.18 | 0.117 |
| Total Fat% | 39.55 ± 6.37 | 41.65 ± 5.25 | 0.100 |
| Ferritin (μg/L) | 142.75 ± 107.04 | 143.12 ± 91.74 | 0.987 |
| 25(OH)D3 (nmol/L) | 80.17 ± 24.14 | 74.85 ± 22.46 | 0.303 |
IL Interleukin, BMI Body mass index, WC Waist circumference, BMC Bone mineral content, BMD Bone mineral density, CRP C-reactive protein. Variables are reported as mean values with their standard deviation (SD). Number of participants [n]. Significant values are in bold text
Table 6 shows the correlation coefficients of the inflammatory markers against bone health indicators. Significant negative correlations were found between IL-12p70 and bone health parameters as well as between CRP and the bone turnover markers P1NP and CTX-1. In Table 6, vitamin 25(OH)D3 was in general significantly positively correlated with inflammatory markers. An evidence of vitamin D as a stimulant of the innate immune system.
Table 6.
Correlations of inflammatory markers with bone health indicators across groups
| Spine BMD | Spine T-score |
Hip BMD | Hip T-score | P1NP (ug/L) | CTX-1 (ug/L) | PTH (pmol/L) | 25(OH)D3 (nmol/L) | |
|---|---|---|---|---|---|---|---|---|
| IL-1β (pg/ml) | − 0.211* | −0.216* | − 0.181 | − 0.154 | 0.010 | − 0.049 | − 0.027 | 0.092 |
| IFN-α2 (pg/ml) | − 0.065 | − 0.076 | − 0.130 | − 0.138 | − 0.154 | − 0.226* | 0.062 | 0.051 |
| IFN-γ (pg/ml) | −0.106 | − 0.115 | − 0.181 | − 0.175 | − 0.125 | − 0.189 | − 0.005 | 0.218* |
| TNF-α (pg/ml) | 0.153 | 0.151 | 0.075 | 0.068 | − 0.020 | − 0.003 | 0.068 | −0.067 |
| MCP-1 (pg/ml) | 0.049 | 0.035 | −0.024 | − 0.023 | − 0.117 | −0.124 | 0.013 | 0.287** |
| IL-6 (pg/ml) | −0.018 | − 0.036 | − 0.089 | − 0.094 | − 0.207 | − 0.145 | − 0.033 | 0.127 |
| IL-8 (pg/ml) | −0.120 | − 0.128 | − 0.164 | −0.155 | 0.039 | −0.049 | − 0.105 | 0.209 |
| IL-10 (pg/ml) | −0.172 | − 0.177 | − 0.157 | − 0.164 | − 0.051 | − 0.142 | − 0.104 | 0.185 |
| IL-12p70 (pg/ml) | −0.220* | − 0.227* | − 0.241* | − 0.250* | − 0.103 | −0.192 | − 0.148 | 0.195 |
| IL-17A (pg/ml) | −0.182 | − 0.189 | − 0.123 | − 0.092 | − 0.009 | −0.091 | − 0.180 | 0.245* |
| IL-18 (pg/ml) | 0.023 | 0.029 | −0.069 | − 0.075 | − 0.160 | −0.143 | − 0.002 | 0.097 |
| IL-23 (pg/ml) | −0.176 | − 0.185 | − 0.131 | −0.090 | − 0.026 | −0.046 | − 0.073 | 0.246* |
| IL-33 (pg/ml) | −0.098 | −0.102 | − 0.161 | −0.167 | − 0.026 | −0.087 | − 0.074 | 0.234* |
| CRP (μg/ml) | 0.190 | 0.196 | 0.148 | 0.164 | −0.253* | −0.223* | 0.132 | −0.132 |
| Ferritin (μg/L) | 0.190 | 0.228* | 0.178 | 0.197 | 0.080 | 0.064 | −0.156 | 0.024 |
* p < .05, **p < .01. IL Interleukin, IFN Interferon, TNF Tumour necrosis factor, MCP Monocyte chemoattractant protein, CRP C-reactive protein, BMD Bone mineral density. Significant values are in bold text
Partial correlations adjusted for the effect of age and BMI on the relationship between inflammatory markers and bone health were explored in Table 7. IL-6 was significantly negatively correlated with hip BMD, hip T-score and P1NP. Vitamin 25(OH)D3 was positively correlated with MCP-1, IL-6, IL-17A and IL-23.,
Table 7.
Partial correlations of inflammatory markers with bone health indicators adjusting for age and BMI
| Spine BMD | Spine T-score |
Hip BMD | Hip T-score | P1NP (ug/L) | CTX-1 (ug/L) | PTH (pmol/L) | 25(OH)D3 (nmol/L) | |
|---|---|---|---|---|---|---|---|---|
| IL-1β (pg/ml) | −0.188 | − 0.197 | − 0.217 | − 0.188 | 0.010 | −0.064 | − 0.039 | 0.092 |
| IFN-α2 (pg/ml) | −0.003 | − 0.017 | − 0.075 | − 0.087 | − 0.185 | − 0.222* | 0.065 | 0.054 |
| IFN-γ (pg/ml) | 0.020 | 0.008 | −0.103 | − 0.101 | − 0.145 | −0.221* | 0.028 | 0.174 |
| TNF-α (pg/ml) | 0.183 | 0.180 | 0.102 | 0.092 | −0.009 | − 0.012 | 0.064 | − 0.079 |
| MCP-1 (pg/ml) | 0.084 | 0.067 | 0.024 | 0.027 | −0.086 | − 0.154 | 0.037 | 0.277** |
| IL-6 (pg/ml) | −0.105 | −0.131 | − 0.256* | − 0.266* | − 0.222* | − 0.166 | − 0.107 | 0.228* |
| IL-8 (pg/ml) | 0.015 | 0.005 | −0.093 | −0.087 | 0.004 | −0.081 | − 0.093 | 0.190 |
| IL-10 (pg/ml) | −0.100 | −0.108 | − 0.160 | − 0.174 | − 0.069 | − 0.163 | − 0.115 | 0.190 |
| IL-12p70 (pg/ml) | −0.094 | − 0.102 | − 0.185 | − 0.202 | − 0.156 | − 0.228* | − 0.128 | 0.158 |
| IL-17A (pg/ml) | −0.057 | − 0.067 | − 0.049 | − 0.011 | − 0.062 | −0.123 | − 0.167 | 0.240* |
| IL-18 (pg/ml) | 0.109 | 0.117 | − 0.016 | − 0.025 | − 0.163 | − 0.169 | − 0.007 | 0.124 |
| IL-23 (pg/ml) | −0.051 | −0.062 | − 0.039 | 0.010 | − 0.079 | −0.076 | − 0.050 | 0.232* |
| IL-33 (pg/ml) | 0.016 | 0.011 | −0.096 | −0.108 | − 0.039 | −0.102 | − 0.053 | 0.205 |
| CRP (μg/ml) | 0.004 | 0.009 | −0.077 | −0.053 | − 0.257* | −0.256* | 0.072 | −0.030 |
| Ferritin (μg/L) | 0.112 | 0.157 | 0.136 | 0.160 | 0.093 | 0.058 | −0.191 | 0.049 |
* p < .05, **p < .01. IL Interleukin, IFN Interferon, TNF Tumour necrosis factor, MCP Monocyte chemoattractant protein, CRP C-reactive protein, BMD Bone mineral density. Significant values are in bold text
Furthermore, as shown in Table 8, partial correlations adjusted for age and height (to reflect BMC which varies with height) indicated stronger relationships between the 15 markers of inflammation and bone, especially negative correlations between IL-1β and IL-12p70 and spine BMC/spine BMD/spine T-score. In addition, Vitamin 25(OH)D3 was positively correlated with IFN-γ, MCP-1, IL-8, IL-10, IL-12p70, IL-17A, IL-23 and IL-33.
Table 8.
Partial correlations of inflammatory markers with bone health indicators adjusting for age and height
| Spine BMC | Spine BMD |
Spine T-score | Hip BMC | Hip BMD | Hip T-score | P1NP (ug/L) | CTX-1 (ug/L) | PTH (pmol/L) | 25(OH)D3 (nmol/L) | |
|---|---|---|---|---|---|---|---|---|---|---|
| IL-1β (pg/ml) | −0.224* | − 0.221* | − 0.229* | − 0.209 | − 0.264* | − 0.238* | 0.000 | − 0.079 | − 0.054 | 0.106 |
| IFN-α2 (pg/ml) | −0.015 | − 0.031 | − 0.044 | − 0.072 | − 0.109 | − 0.121 | − 0.198 | − 0.238* | 0.057 | 0.058 |
| IFN-γ (pg/ml) | − 0.111 | − 0.117 | − 0.129 | − 0.203 | − 0.260* | −0.258* | − 0.158 | − 0.245* | − 0.020 | 0.220* |
| TNF-α (pg/ml) | 0.182 | 0.157 | 0.154 | 0.073 | 0.050 | 0.039 | −0.047 | − 0.050 | 0.073 | − 0.155 |
| MCP-1 (pg/ml) | 0.004 | 0.022 | 0.005 | −0.015 | − 0.072 | − 0.070 | − 0.125 | − 0.200 | 0.029 | 0.267* |
| IL-6 (pg/ml) | −0.120 | 0.000 | −0.022 | − 0.075 | − 0.123 | − 0.133 | − 0.222* | − 0.156 | − 0.067 | 0.165 |
| IL-8 (pg/ml) | −0.089 | − 0.118 | − 0.128 | −0.194 | − 0.258* | − 0.253* | − 0.024 | − 0.121 | − 0.131 | 0.223* |
| IL-10 (pg/ml) | − 0.173 | − 0.166 | − 0.174 | − 0.229* | − 0.232* | − 0.244* | − 0.067 | − 0.169 | − 0.141 | 0.225* |
| IL-12p70 (pg/ml) | −0.257* | − 0.226* | − 0.234* | − 0.338** | − 0.331** | − 0.344** | − 0.152 | − 0.236* | − 0.173 | 0.222* |
| IL-17A (pg/ml) | −0.197 | − 0.188 | − 0.198 | − 0.248* | − 0.220 | −0.186 | − 0.082 | −0.156 | − 0.205 | 0.278* |
| IL-18 (pg/ml) | 0.087 | 0.040 | 0.046 | −0.019 | −0.116 | − 0.125 | − 0.205 | − 0.216 | −0.018 | 0.117 |
| IL-23 (pg/ml) | −0.193 | −0.178 | − 0.190 | −0.248* | − 0.217 | −0.172 | − 0.117 | − 0.125 | − 0.087 | 0.257* |
| IL-33 (pg/ml) | −0.094 | − 0.096 | − 0.101 | −0.187 | − 0.213 | −0.223* | − 0.039 | −0.112 | − 0.092 | 0.253* |
| CRP (μg/ml) | 0.142 | 0.171 | 0.177 | 0.061 | 0.137 | 0.157 | −0.233* | −0.216 | 0.127 | −0.105 |
| Ferritin (μg/L) | 0.182 | 0.182 | 0.223* | 0.261* | 0.197 | 0.218 | 0.066 | 0.041 | −0.145 | −0.027 |
* p < .05, **p < .01. IL Interleukin, IFN Interferon, TNF Tumour necrosis factor, MCP Monocyte chemoattractant protein, CRP C-reactive protein, BMC Bone mineral content, BMD Bone mineral density. Significant values are in bold text
Figure 2 shows the Pearson correlations of inflammatory markers against CTX-1 when separated into the osteoporotic, osteopenic, healthy and across all groups. There is a significant positive correlation between IFN-α2 and CTX-1 amongst the osteoporotic group, and a negative correlation between CRP and CTX-1 in the healthy group.
Fig. 2.

Pearson correlations of inflammatory markers by CTX-1
The relationship between inflammatory markers and fat percentage across groups
The bar graphs in Fig. 3 show the correlations between the 15 inflammatory markers and fat percentage. Levels of CRP were the most strongly positively correlated with whole body fat percentage (WBFatp), as oppose to IL-23 which was strongly negatively correlated.
Fig. 3.

Correlations of inflammation markers by fat percentage. * p < .05, **p < .01, *** p < .001
From Fig. 3, we observed significant positive correlations between ferritin, CRP and IL-6 and the fat percentage. All other cytokines were negatively correlated with the fat percentage, with statistically significant correlations for IL-33, IL-23, IL-12, IL-8 and IFN-γ.
Ferritin as a marker of inflammation
Analysis of anti-inflammatory cytokines’ production against ferritin levels indicated significant differences between IL-10 (p-value = 0.012), IL-33 (p-value = 0.017) and the levels of ferritin.. High levels of ferritin were significantly associated with low levels of IL-10 and IL-33, indicating a possible anti-inflammatory effect of IL-10 and IL-33 on the ferritin status of individuals.
In summary, these results provide important insights into a cross-sectional overview of inflammatory markers and bone health during midlife and senescence. Thereby, providing platforms for further hypotheses and research in this area.
Discussion
In general terms, the cytokines measured in this study can be described as
Inflammatory (osteoclastogenic) cytokines include IL-1β, IL-6, IL-8, IL-17, MCP-1, TNFα, IFN-α2 and IFN-γ). They are generally known for their degenerating and catabolic effects on tissue metabolism and homeostasis as well as the intracellular actions and signalling pathway to osteoclastic differentiation [26]. More so, in postmenopausal women, when coupled with the effect of oestrogen deficiency. Elevated levels of inflammatory cytokines have been linked with lower bone mineral density [12], as part of “inflammaging” [27].
Anti-Inflammatory (anti-osteoclastogenic) cytokines include IL-10, IL-18, IL-33. Most often anti-inflammatory cytokines exert opposite effects to those of inflammatory cytokines on bone.
Dual-role cytokines include IL-12 and IL-23. In certain circumstances, these cytokines provide a balancing act, with a dual-role in the regulation of the immune system.
It must be appreciated that although individual cytokines may be described as pro- or anti-inflammatory, they interact closely with one another as part of a dynamic network which creates a balance of both inhibitory and stimulatory immune effects [26].
Some studies, although limited and contradictory, have investigated the impact of immune cytokines, especially IL-6, on bone loss in postmenopausal women [28–32]. However, to our knowledge no study has investigated the relationship of all the 15 immune markers with bone health in postmenopausal women.
CRP
CRP is a sensitive marker of systemic inflammation. The production of CRP in the liver upregulates other inflammatory cytokines (including IL-1, IL-6 and TNFα) and has been shown to be positively correlated with bone resorption and hip and spinal bone loss in healthy pre- and post-menopausal women [7–9].
In our study CRP was significantly associated with measures of BMI and various measures of body fat. High BMI, body fat and fat percentage was associated with high CRP, supporting previous studies linking obesity with increased systemic inflammation [33]. These results are similar to those of the Dunedin study that reported a positive correlation between CRP and BMI [34]. Similar results to our findings was also reported by Berglundh et al. 2015, their results indicated that women with lower CRP quartiles had lower BMD values [8].
However, in contrast to the literature, CRP was lower in the osteoporotic women than those with osteopenia or healthy bone. This may reflect a lower body weight in women with osteoporosis or may be an effect of the small number of women with osteoporosis in this study. In addition, CRP was negatively correlated with both P1NP (a bone formation marker) and CTX-1 (a bone resorption marker), indicating a lower overall bone turnover with high levels of CRP. However, the findings of this study is in accordance to that of Huang and Schooling which found no association between higher hsCRP and lower BMD [35].
Of interest also was the observation that higher levels of CRP were associated with low vitamin 25(OH)D3 levels. Although this relationship did not reach statistical significance it is potentially worth investigating further in future studies.
Immune cytokines and bone health
With participants grouped to healthy, osteopenic and osteoporotic groups based on spine BMD measurements, (Table 3) the means of all immune markers (with the exception of CRP, discussed above) were higher in the osteoporotic group, and ANOVA demonstrated significant differences for IFN-α2, INF-γ, IL-12P70, IL-33, and trending increased in IL-1β, MCP-1, and IL-23. This increase in both pro- and anti-inflammatory markers may indicate a more active upregulated immune status in those with poor bone health.
Unexpectedly, we observed higher levels of IL-10 (an osteoprotective cytokine) in the osteoporotic group and correlations with bone health indicators were negative. In addition, although IL-33 has been reported as an anti-osteoclastogenic cytokine [6, 36], we found levels of IL-33 to be significantly higher in the osteoporotic group than the normal or osteopenia groups, and correlations with bone health parameters were negative although they did not reach statistical significance. The negative correlations between IL-33 and bone resorption marker CTX as reported by Ginaldi et al. (2019) is however similar to the result of this study [36]. However, further studies with larger numbers of women are needed in this area.
In agreement with the literature [29, 37, 38], independent T tests showed a significant negative relationship between IL-1β and bone parameters – high pro-inflammatory IL-1β was associated with lower BMC, BMD and T-scores (Table 4). For proinflammatory IL-6, there was a positive association with BMI, WC and waist-hip ratio, and a negative association with femoral neck BMD, hip BMD and hip T-score.
Correlations
Analysis of correlations between bone parameters and immune markers (Table 6) showed a significant negative correlation between IL-12p70 and spine and hip bone measurements. Adjustment for age and height retained this relationship, as well as showing a significant negative relationship between IL-1β and spine and hip bone measurements. The other associations with hip measurements are not discussed further due to low numbers of women with poor hip bone health. Additional data are needed to confirm these associations.
Of note from these correlations are the associations of immune markers with bone biomarkers: IFN-α2, IFN-γ, and IL-12p70 had a negative association with CTX-I, so high levels of potentially inflammatory cytokines were associated with low CTX-1 and hence low bone resorption activity.
Similarly, IL-6 showed a negative correlation with P1NP, so high levels of pro-inflammatory IL-6 were associated with low levels of bone formation.
Evidence for the anti-inflammatory effects of vitamin 25(OH)D3 were observed in its correlations with the inflammatory markers. Vitamin 25(OH)D3 was positively correlated with all the inflammatory cytokines except TNF-α and CRP.
Inflammatory markers and body fat percentage
Body fat and obesity have been reported to be positively associated with low-grade inflammation [33, 39]. This was further illustrated in our study, where BMI and various body fat measurements (including fat mass, fat percentage, abdominal fat, waist circumference, waist to hip ratio, android fat, gynoid fat, android to gynoid fat ratio, trunk fat percentage, and body fat percentage, and fat mass to lean mass ratio) all had significant positive correlations with CRP and IL-6 (both markers of inflammation).
In addition, we found significant negative correlations between several of the potentially anti-inflammatory markers (IL-23, IL33, and IL-12) and body fat percentage in all groups of women. The proinflammatory markers IL-8 and IFN-γ also had negative correlations with body fat percentage, which may reflect the complex cytokine interactions regulating/balancing the immune system. In general, high body fat percentage indicating obesity appears to be associated with increased inflammation and lower levels of anti-inflammatory cytokines.
Ferritin and anti-inflammatory cytokines
Infection, injury or trauma influences iron status. However, iron in the body is stored as ferritin in normal healthy individuals. Serum ferritin concentration is well-known as an important, convenient and accurate indicator of total body iron stores in humans. Hepcidin hormone is a major regulator of systemic iron homeostasis in the liver and it is induced during inflammation. Thus, ferritin is also known as an acute phase reactant, a marker of inflammation.
Hypoferremia and a high serum ferritin concentration during acute phase response has been linked to the actions of pro-inflammatory cytokines both in vivo and in vitro [40]. High levels of ferritin have been suggested to act as a potent oxidant causing oxidative stress which is associated with increased risk of various diseases [41]. Thus, iron levels must be regulated and controlled in order to provide an essential nutrient that is capable of oxygen delivery and metabolism with regulated redox reactions, but without causing cellular damage or apoptosis by guarding against excessive toxicities [42, 43].
In the liver, during infection with extracellular bacteria, hepcidin targets ferroportin (FP1) [a transmembrane protein that transports iron from the inside of a cell to the outside] and results in its degradation which causes a reduction in hepcidin levels produced by macrophages as a result of inflammatory cytokines; giving rise to hypoferremia (reduced iron availability for extracellular bacteria) and high levels of ferritin [44].
In an experimental study by Feelder et al., following an administration of inflammatory cytokines (TNF-α, IL-1 and IL-6), an increase in ferritin synthesis and a decrease in serum iron were observed [40]. Furthermore, Nairz et al. reported that in response to the actions of pro-inflammatory cytokines such as IL-6 and IFN-γ, systemic hypoferremia and increased ferritin were observed as a result of extracellular actions [44].
Furthermore, ferritin has been postulated as a disease marker and mediator [45]. However, contrary to our findings, ferritin has been suggested to be responsible for immune suppression via increased production of IL-10 in the presence of chemokines [45].
The results from our cross-sectional study showed that anti-inflammatory cytokines IL-10 and IL-33 are significantly related to lower plasma ferritin status in a cohort of post-menopausal women. This suggests a possible role of anti-inflammatory, anti-osteoclastogenic cytokines in iron metabolism and the regulation of iron stores. Further research work is needed to confirm the role of anti-inflammatory cytokines in iron homeostasis.
Overall, our findings showed that in a group of apparently healthy postmenopausal women, cytokine levels of IFNα2, IFN-γ, IL-12p70, IL-33 and MCP-1 were significantly higher in groups with low bone mass (osteoporosis) than those with higher bone mass (osteopenia and healthy). We also found that when converted into categorical data, there were significant differences in levels of IL-1β according to the spine and hip classifications. Similarly, we observed significant differences in levels of IL-6 by the hip categorical classification. Partial correlation coefficients with adjustment for age and height showed negative correlations between IL-1β, IFN-α2, IFN-γ, IL-6, IL-8, IL-10, IL-12p70, IL-23, IL-33 and hip and spine BMC, BMDs, and T-scores. Furthermore, we found that high levels of ferritin were significantly associated with low IL-10 and IL-33 levels in these postmenopausal women.
Limitations of this study include the cross-sectional nature preventing any cause and effect relationship and the small number of osteoporotic postmenopausal women compared to the healthy and osteopenic groups.
Conclusion
In summary, although specific individual cytokines were correlated with bone health (most clearly demonstrated by the observation that high levels of IL-β were associated with low spine and hip bone measurements), many cytokines (both pro- and anti-inflammatory) were shown to be elevated in osteoporotic women, perhaps indicating upregulation of the overall immune system in women with poor bone health.
Some inflammatory markers were also shown to have an impact on bone turnover: CRP was negatively correlated with both P1NP (a bone formation marker) and CTX-1 (a bone resorption marker), indicating lower overall bone turnover with high levels of CRP. High levels of potentially inflammatory cytokines (IFN-α2, IFN-γ, and IL-12p70) were associated with low CTX-1 and hence low bone resorption activity, and high levels of pro-inflammatory IL-6 were associated with low levels of the bone formation marker P1NP. Of note also, high fat percentage indicating obesity was associated with increased inflammation and lower levels of anti-inflammatory cytokines.
This study strengthens the knowledge of the role of immune factors in promoting bone degradation in older women. Despite these promising results, to develop a full picture of the impact of cytokines and chemokines on bone health, additional longitudinal intervention studies are recommended to confirm and expand the relationships described in this study.
Acknowledgements
The authors would like to thank Anne Broomfield, Shampa De and Gabby Plimmer from Massey University and Katie Young from University of Otago for their technical expertise and support.
Abbreviations
- BMC
Bone mineral content
- BMD
Bone mineral density
- CRP
C-reactive protein
- IFN
Interferon
- IL
Interleukin
- MCP
Monocyte chemoattractant protein
- OC
Osteoclast
- TNF
Tumour necrosis factor
Authors’ contributions
BLIO was involved in the experimental design, collected the data, performed the statistical analyses, and wrote the first manuscript draft. LS was involved with intellectual decision making. BKS was involved with the statistical analyses. MC was involved with the measurement and analysis of cytokine levels. SM was involved with cytokine measurement and some statistical analysis. JC was involved with the experimental design and data collection. NR was involved with the experimental design. MCK initiated the experimental idea, was involved in the experimental design, data collection and sourced the research funding. All the authors read, reviewed and approved the final manuscript.
Funding
The following institutions funded this research:
1. Riddet CoRE: The Riddet Institute, a New Zealand Centre of Research Excellence, funded by the Tertiary Education Commission, provided Doctoral scholarship for BLIO. 2. Palmerston North Medical Research Foundation. 3. Fonterra Cooperative Group Ltd. 4. Allen Foundation, USA.
Availability of data and materials
The datasets used and/or analysed during the current study are available from the corresponding author on reasonable request.
Ethics approval and consent to participate
Massey University Human Ethics Committee approved this study: Southern A, Application 17/17. The study was also registered with the Australian New Zealand Clinical Trials Registry (ANZCTR) with the number ACTRN12617000802303. Written informed consent was obtained from all study participants.
Consent for publication
Not applicable, however part of this study has been presented as an abstract and poster at the New Zealand Nutrition Society meeting 2018. The abstract was published in the Multidisciplinary Digital Publishing Institute Proceedings of the Nutrition Society of New Zealand [46].
Competing interests
The authors declare that they have no competing interests.
Footnotes
Publisher’s Note
Springer Nature remains neutral with regard to jurisdictional claims in published maps and institutional affiliations.
References
- 1.Grimble RF. Interaction between nutrients, pro-inflammatory cytokines and inflammation. Clin Sci (Lond) 1996;91(2):121–130. doi: 10.1042/cs0910121. [DOI] [PubMed] [Google Scholar]
- 2.Zhang H-F, et al. IL-33 promotes IL-10 production in macrophages: a role for IL-33 in macrophage foam cell formation. Exp Mol Med. 2017;49(11):e388. doi: 10.1038/emm.2017.183. [DOI] [PMC free article] [PubMed] [Google Scholar]
- 3.Fuggle N, et al. Relationships between markers of inflammation and bone density: findings from the Hertfordshire cohort study. Osteoporos Int. 2018;29(7):1581–9. doi: 10.1007/s00198-018-4503-z. [DOI] [PMC free article] [PubMed] [Google Scholar]
- 4.Johnell O, Kanis J. An estimate of the worldwide prevalence and disability associated with osteoporotic fractures. Osteoporos Int. 2006;17(12):1726–1733. doi: 10.1007/s00198-006-0172-4. [DOI] [PubMed] [Google Scholar]
- 5.Hsu E, Pacifici R. From Osteoimmunology to osteomicrobiology: how the microbiota and the immune system regulate bone. Calcif Tissue Int. 2018;102(5):512–21. doi: 10.1007/s00223-017-0321-0. [DOI] [PMC free article] [PubMed] [Google Scholar]
- 6.Amarasekara DS, et al. Regulation of osteoclast differentiation by cytokine networks. Immune Netw. 2018;18(1):e8. 10.4110/in.2018.18.e8. eCollection 2018 Feb. [DOI] [PMC free article] [PubMed]
- 7.Ginaldi L, Di Benedetto MC, De Martinis M. Osteoporosis, inflammation and ageing. Immun Ageing. 2005;2(1):14. doi: 10.1186/1742-4933-2-14. [DOI] [PMC free article] [PubMed] [Google Scholar]
- 8.Berglundh S, et al. C-reactive protein, bone loss, fracture, and mortality in elderly women: a longitudinal study in the OPRA cohort. Osteoporos Int. 2015;26(2):727–735. doi: 10.1007/s00198-014-2951-7. [DOI] [PubMed] [Google Scholar]
- 9.Ginaldi L, De Martinis M. Osteoimmunology and beyond. Curr Med Chem. 2016;23(33):3754–3774. doi: 10.2174/0929867323666160907162546. [DOI] [PMC free article] [PubMed] [Google Scholar]
- 10.Fain JN. Release of interleukins and other inflammatory cytokines by human adipose tissue is enhanced in obesity and primarily due to the nonfat cells. Vitam Horm. 2006;74:443–477. doi: 10.1016/S0083-6729(06)74018-3. [DOI] [PubMed] [Google Scholar]
- 11.Coppack SW. Pro-inflammatory cytokines and adipose tissue. Proc Nutr Soc. 2001;60(3):349–356. doi: 10.1079/PNS2001110. [DOI] [PubMed] [Google Scholar]
- 12.McLean RR. Proinflammatory cytokines and osteoporosis. Curr Osteoporos Rep. 2009;7(4):134–139. doi: 10.1007/s11914-009-0023-2. [DOI] [PubMed] [Google Scholar]
- 13.Ciccarelli F, De Martinis M, Ginaldi L. Glucocorticoids in patients with rheumatic diseases: friends or enemies of bone? Curr Med Chem. 2015;22(5):596–603. doi: 10.2174/0929867321666141106125051. [DOI] [PubMed] [Google Scholar]
- 14.Li X, et al. Parathyroid hormone stimulates osteoblastic expression of MCP-1 to recruit and increase the fusion of pre/osteoclasts. J Biol Chem. 2007;282(45):33098–33106. doi: 10.1074/jbc.M611781200. [DOI] [PubMed] [Google Scholar]
- 15.Maugeri D, et al. Interleukin-18 (IL-18) and matrix metalloproteinase-9 (MMP-9) in post-menopausal osteoporosis. Arch Gerontol Geriatr. 2005;40(3):299–305. doi: 10.1016/j.archger.2004.10.001. [DOI] [PubMed] [Google Scholar]
- 16.Hwang S-J, et al. Interleukin-34 produced by human fibroblast-like synovial cells in rheumatoid arthritis supports osteoclastogenesis. Arthritis Res Ther. 2012;14(1):R14. doi: 10.1186/ar3693. [DOI] [PMC free article] [PubMed] [Google Scholar]
- 17.Jules J, et al. Molecular basis of requirement of receptor activator of nuclear factor κB signaling for interleukin 1-mediated osteoclastogenesis. J Biol Chem. 2012;287(19):15728–15738. doi: 10.1074/jbc.M111.296228. [DOI] [PMC free article] [PubMed] [Google Scholar]
- 18.Kudo O, et al. Interleukin-6 and interleukin-11 support human osteoclast formation by a RANKL-independent mechanism. Bone. 2003;32(1):1–7. doi: 10.1016/S8756-3282(02)00915-8. [DOI] [PubMed] [Google Scholar]
- 19.Weitzmann MN, et al. Interleukin-7 stimulates osteoclast formation by up-regulating the T-cell production of soluble osteoclastogenic cytokines. Blood. 2000;96(5):1873–1878. [PubMed] [Google Scholar]
- 20.Evans KE, Fox SW. Interleukin-10 inhibits osteoclastogenesis by reducing NFATc1 expression and preventing its translocation to the nucleus. BMC Cell Biol. 2007;8(1):4. doi: 10.1186/1471-2121-8-4. [DOI] [PMC free article] [PubMed] [Google Scholar]
- 21.Nagata N, et al. Inhibition of RANKL-induced osteoclast formation in mouse bone marrow cells by IL-12: involvement of IFN-γ possibly induced from non-T cell population. Bone. 2003;33(4):721–732. doi: 10.1016/S8756-3282(03)00213-8. [DOI] [PubMed] [Google Scholar]
- 22.Shukla Priyanka, Mansoori Mohd Nizam, Kakaji Manisha, Shukla Manoj, Gupta Sushil Kumar, Singh Divya. Interleukin 27 (IL-27) Alleviates Bone Loss in Estrogen-deficient Conditions by Induction of Early Growth Response-2 Gene. Journal of Biological Chemistry. 2017;292(11):4686–4699. doi: 10.1074/jbc.M116.764779. [DOI] [PMC free article] [PubMed] [Google Scholar]
- 23.Ginaldi L, et al. Increased levels of interleukin 31 (IL-31) in osteoporosis. BMC Immunol. 2015;16(1):60. doi: 10.1186/s12865-015-0125-9. [DOI] [PMC free article] [PubMed] [Google Scholar]
- 24.Ilesanmi-Oyelere BL, et al. Lean body mass in the prediction of bone mineral density in postmenopausal women. Biores Open Access. 2018;7(1):150–158. doi: 10.1089/biores.2018.0025. [DOI] [PMC free article] [PubMed] [Google Scholar]
- 25.World Health Organization . WHO scientific group on the assessment of osteoporosis at primary health care level. Geneva: World Health Organization; 2011. [Google Scholar]
- 26.Wojdasiewicz Piotr, Poniatowski Łukasz A., Szukiewicz Dariusz. The Role of Inflammatory and Anti-Inflammatory Cytokines in the Pathogenesis of Osteoarthritis. Mediators of Inflammation. 2014;2014:1–19. doi: 10.1155/2014/561459. [DOI] [PMC free article] [PubMed] [Google Scholar]
- 27.Franceschi C, et al. Inflamm-aging: an evolutionary perspective on immunosenescence. Ann N Y Acad Sci. 2000;908(1):244–254. doi: 10.1111/j.1749-6632.2000.tb06651.x. [DOI] [PubMed] [Google Scholar]
- 28.Fischer V, et al. Influence of menopause on inflammatory cytokines during murine and human bone fracture healing. Int J Mol Sci. 2018;19(7):17. doi: 10.3390/ijms19072070. [DOI] [PMC free article] [PubMed] [Google Scholar]
- 29.Papadopoulos N, et al. Correlation of interleukin-6 serum levels with bone density in postmenopausal women. Clin Rheumatol. 1997;16(2):162–165. doi: 10.1007/BF02247845. [DOI] [PubMed] [Google Scholar]
- 30.Mckane WR, et al. Circulating levels of cytokines that modulate bone resorption: effects of age and menopause in women. J Bone Miner Res. 1994;9(8):1313–1318. doi: 10.1002/jbmr.5650090821. [DOI] [PubMed] [Google Scholar]
- 31.Kania D, et al. Elevated plasma levels of interleukin-6 in postmenopausal women do not correlate with bone density. J Am Geriatr Soc. 1995;43(3):236–239. doi: 10.1111/j.1532-5415.1995.tb07328.x. [DOI] [PubMed] [Google Scholar]
- 32.Hustmyer FG, et al. Cytokine production and surface antigen expression by peripheral blood mononuclear cells in postmenopausal osteoporosis. J Bone Miner Res. 1993;8(1):51–59. doi: 10.1002/jbmr.5650080108. [DOI] [PubMed] [Google Scholar]
- 33.Ilich JZ, et al. Low-grade chronic inflammation perpetuated by modern diet as a promoter of obesity and osteoporosis. Arch Ind Hyg Toxicol. 2014;65(2):139–148. doi: 10.2478/10004-1254-65-2014-2541. [DOI] [PubMed] [Google Scholar]
- 34.Belsky DW, et al. Quantification of biological aging in young adults. Proc Natl Acad Sci. 2015;112(30):E4104–E4110. doi: 10.1073/pnas.1506264112. [DOI] [PMC free article] [PubMed] [Google Scholar]
- 35.Huang JV, Schooling CM. Inflammation and bone mineral density: a Mendelian randomization study. Sci Rep. 2017;7(1):8666. doi: 10.1038/s41598-017-09080-w. [DOI] [PMC free article] [PubMed] [Google Scholar]
- 36.Ginaldi L, et al. Interleukin-33 serum levels in postmenopausal women with osteoporosis. Sci Rep. 2019;9(1):3786. doi: 10.1038/s41598-019-40212-6. [DOI] [PMC free article] [PubMed] [Google Scholar]
- 37.Ishimi Y, et al. IL-6 is produced by osteoblasts and induces bone resorption. J Immunol. 1990;145(10):3297–3303. [PubMed] [Google Scholar]
- 38.Zheng S, et al. Increase in cytokine production (IL-1β, IL-6, TNF-α but not IFN-γ, GM-CSF or LIF) by stimulated whole blood cells in postmenopausal osteoporosis. Maturitas. 1997;26(1):63–71. doi: 10.1016/S0378-5122(96)01080-8. [DOI] [PubMed] [Google Scholar]
- 39.Schmidt FM, et al. Inflammatory cytokines in general and central obesity and modulating effects of physical activity. PLoS One. 2015;10(3):e0121971. doi: 10.1371/journal.pone.0121971. [DOI] [PMC free article] [PubMed] [Google Scholar]
- 40.Eijk V. Regulation of iron metabolism in the acute-phase response: interferon γ and tumour necrosis factor α induce hypoferraemia, ferritin production and a decrease in circulating transferrin receptors in cancer patients. Eur J Clin Investig. 1998;28(7):520–527. doi: 10.1046/j.1365-2362.1998.00323.x. [DOI] [PubMed] [Google Scholar]
- 41.Moen IW, et al. Increased plasma ferritin concentration and low-grade inflammation—a Mendelian randomization study. Clin Chem. 2018;64(2):374–385. doi: 10.1373/clinchem.2017.276055. [DOI] [PubMed] [Google Scholar]
- 42.Wessling-Resnick M. Iron homeostasis and the inflammatory response. Annu Rev Nutr. 2010;30:105–122. doi: 10.1146/annurev.nutr.012809.104804. [DOI] [PMC free article] [PubMed] [Google Scholar]
- 43.Ward RJ, et al. Iron and the immune system. J Neural Transm. 2011;118(3):315–328. doi: 10.1007/s00702-010-0479-3. [DOI] [PubMed] [Google Scholar]
- 44.Nairz M, et al. Iron at the interface of immunity and infection. Front Pharmacol. 2014;5:152. doi: 10.3389/fphar.2014.00152. [DOI] [PMC free article] [PubMed] [Google Scholar]
- 45.Kernan KF, Carcillo JA. Hyperferritinemia and inflammation. Int Immunol. 2017;29(9):401–409. doi: 10.1093/intimm/dxx031. [DOI] [PMC free article] [PubMed] [Google Scholar]
- 46.Ilesanmi-Oyelere BL, et al. Cytokine production, ferritin levels and bone mineral density in healthy postmenopausal women. Multidiscipl Digit Publ Inst Proc. 2019;8(1):28. [Google Scholar]
Associated Data
This section collects any data citations, data availability statements, or supplementary materials included in this article.
Data Availability Statement
The datasets used and/or analysed during the current study are available from the corresponding author on reasonable request.