

Abstract
The mossy fiber (MF)–granule cell (GC) pathway conveys multiple modalities of information to the cerebellar cortex, converging on Purkinje cells (PC), the sole output of the cerebellar cortex. Recent in vivo experiments have shown that activity in GCs varies from tonic firing at a few hertz to phasic bursts >500 Hz. However, the responses of parallel fiber (PF)–PC synapses to this wide range of input frequencies are unknown, and there is controversy regarding several frequency-related parameters of transmission at this synapse. We performed recordings of unitary synapses and combined variance–mean analysis with a carefully adapted extracellular stimulation method in young and adult rats. We show that, although the probability of release at individual sites is low at physiological calcium concentration, PF–PC synapses release one or more vesicles with a probability of 0.44 at 1.5 mm [Ca2+]e. Paired-pulse facilitation was observed over a wide range of frequencies; it renders burst inputs particularly effective and reproducible. These properties are primarily independent of synaptic weight and age. Furthermore, we show that the PF–PC synapse is able to sustain transmission at very high frequencies for tens of stimuli, as a result of accelerated vesicle replenishment and an apparent recruitment of release site vesicles, which appears to be a central mechanism of paired-pulse facilitation at this synapse. These properties ensure that PF–PC synapses possess a dynamic range enabling the temporal code of MF inputs to be transmitted reliably to the PC.
Introduction
The very abundant granule cell (GC)–Purkinje cell (PC) synapses are believed to be the storage site for much of the information that is acquired during motor learning and then used during the execution of coordinated movements. Synaptic plasticity at this connection, in part controlled by the activity of climbing fibers, has been studied extensively: the synapse exhibits at least postsynaptic LTD and LTP (Hansel et al., 2001; Lev-Ram et al., 2002; Coesmans et al., 2004; Ito, 2006), as well as a form of presynaptic LTP (Salin et al., 1996). These plasticities are thought to result in the broad range of synaptic weights observed in paired recordings from the adult and also to generate the large majority of synapses that have been deduced to be silent (Ekerot and Jörntell, 2001; Isope and Barbour, 2002; Brunel et al., 2004).
Recent studies have highlighted the ability of GCs to discharge action potentials over an extraordinarily wide range of frequencies, up to 1 kHz (Chadderton et al., 2004; Jörntell and Ekerot, 2006; Rancz et al., 2007; Arenz et al., 2008). Moreover, burst firing appears to play a critical role in the rules governing the induction of synaptic plasticity (Jörntell and Ekerot, 2002; Brown et al., 2003; Bidoret et al., 2009). At a synaptic level, however, the corresponding properties of GC–PC synaptic transmission are unclear. It is unknown, for instance, whether the synapse can sustain such high rates of transmission. There is also some uncertainty in the literature regarding the release probability and the paired-pulse ratio (PPR), with apparently different results being obtained depending on the precise stimulation and recording conditions (Perkel et al., 1990; Atluri and Regehr, 1996; Isope and Barbour, 2002).
We therefore set out to investigate several interrelated properties of this key cerebellar synapse, focusing particularly on frequency-related parameters, such as the release probability and the PPR. We used recordings of unitary synapses and compared them with responses to a carefully designed extracellular stimulation method, enabling us to obtain equivalent results with both techniques. We find that, despite a release probability greater than reported previously, the parallel fiber (PF)–PC synapse is able to facilitate over short bursts and sustain transmission at very high frequencies.
Materials and Methods
Slice preparation.
All experimental procedures conform to national and National Institutes of Health guidelines on animal experimentation. Slices were prepared from young and adult male Wistar rats (young, P17–P21; adult, 2–3 months, 250–450 g). The short time window for young animals was chosen to minimize the impact of developmental variation on the studied parameters. Methods for adult slices preparation and paired recordings have been described previously (Isope and Barbour, 2002). The (similar) methods detailed below are those used for the young animals. Rats were anesthetized by inhalation of isoflurane. Animals were killed by decapitation, and the cerebellum was dissected out and placed in a cold ACSF (4°C) bubbled with carbogen (95% O2, 5% CO2) containing the following (in mm): 120 NaCl, 3 KCl, 26 NaHCO3, 1.25 NaH2PO4, 2.5 CaCl2, 2 MgCl2, 10 glucose, 0.00005 minocyclin (Sigma-Aldrich). Transverse slices (330-μm-thick) were prepared (Microm HM 650V; Microm) in potassium-based medium containing the following (in mm): 130 K-gluconate, 14.6 KCl, 2 EGTA, 20 HEPES, 25 glucose, 0.00005 minocyclin, and 0.05 d-AP-5 (Dugué et al., 2005). After cutting, slices were soaked a few seconds in a sucrose-based medium at 34°C containing the following (in mm): 230 sucrose, 2.5 KCl, 26 NaHCO3, 1.25 NaH2PO4, 25 glucose, 0.8 CaCl2, 8 MgCl2, 0.00005 minocyclin, and 0.05 d-APV. Slices were maintained in a water bath at 34°C in bubbled ACSF. Experiments were done at 34°C (in young and at 32°C in adult animals) using the same bubbled ACSF containing 100 μm picrotoxin to block all inhibitory transmission. In experiments using extracellular stimulations, NMDA, adenosine, CB1, and GABAB receptors were blocked to limit modulation of EPSC amplitude by stimulation-dependent activation of these receptors; respectively, the following antagonists were added (in mm): 0.001 AM251 (N-(Piperidin-1-yl)-5-(4-iodophenyl)-1-(2,4-dichlorophenyl)-4-methyl-1H-pyrazole-3-carboxamide), 0.05 d-AP5 (d-(−)-2-Amino-5-phosphonopentanoic acid), 0.0005 DPCPX (8-cyclopentyl-1,3-dipropylxanthine), and 0.001 CGP52432 (3-[[(3,4-dichlorophenyl)-methyl]amino]propyl] (diethoxymethyl)phosphinic acid). JNJ16259685 (3,4-dihydro-2H-pyrano[2,3]β-quinolin-7-yl)(cis-4-methoxycyclohexyl) methanone) (mGluR1 receptor antagonist) was also added at 0.002 mm for 100 Hz trains. Drugs were obtained from Tocris Bioscience or Ascent Scientific.
Recordings.
In young rats (P17–P21), whole-cell patch-clamp recordings in voltage-clamp mode were obtained using 3–4 MΩ pipettes with a Multiclamp 700 amplifier (Molecular Devices), and optimal series resistance (Rs) compensation (80% of 5–10 MΩ, typically) was applied. Rs was monitored in all experiments, and cells were held at −60 mV. The pipette internal solution contained the following (in mm): 135 KMeSO4, 6 NaCl, 10 HEPES, 4 MgATP, and 0.4 Na2GTP, with pH adjusted to 7.3 with KOH (osmolarity to 300 mOsm). Voltages were not corrected for the liquid junction potential, which was calculated to be 9 mV (i.e., the real membrane potential was 9 mV more hyperpolarized than reported). We accepted recordings for which the inward current at −60 mV did not exceed 1 nA. No correlation between PPR and leak current (Spearman's rank order test for PPR at 50 Hz, p > 0.05, n = 55) was observed. Synaptic currents in PCs were low-pass filtered at 2 kHz and then sampled at 20–50 kHz.
For paired recordings, loose cell-attached stimulation and recording of GCs was performed using a purpose-built amplifier as described previously (Barbour and Isope, 2000). Only GCs in which an action potential could be distinguished clearly and elicited reliably were analyzed. Only connections in which postsynaptic responses and presynaptic action potentials had the same threshold were retained. Stimulation was adjusted to be just suprathreshold so as to minimize the probability of stimulating other nearby GCs or axons. To calculate the mean EPSCs, we averaged together all sweeps in which GC excitation was successful.
Repetitive extracellular GC stimulation was effected by stimulating in the GC layer with a 16-site iridium microelectrode array (type “A” probe; NeuroNexus Technologies) combined with an ISO-STIM 01D (NPI Electronic), allowing us to make bipolar stimulations between arbitrary pairs of sites. Stimulation intensity was adjusted to evoke an initial current of ∼100 pA (110 ± 61 pA; n = 60). The low intensity and short duration of the stimulation (6 ± 3 V for 70 μs, n = 60) minimized the duration of the artifact. No correlation was observed between stimulation intensity and PPR (PPR at 50 Hz, Spearman's rank order test, ρ = 0.16, p = 0.31, n = 41) or between EPSC1 (A1) and PPR (PPR at 50 Hz, Spearman's rank order test, ρ = −0.13, p = 0.42, n = 41). By stimulating in the deeper regions of the GC layer, we minimized PF recruitment that might occur when stimulating near the molecular layer. The extracellular stimulating electrodes were systematically placed laterally to the PC (in the direction of the PFs) and at a sufficient distance to ensure that only parallel and not ascending axon synapses were activated. This placement also facilitated avoidance of antidromic activation of the PC and stimulation of the climbing fiber.
Definitions.
It will be important below to distinguish clearly three different definitions of release probability and related parameters. We first consider the quantal definition of a release site, which is a associated with the release of zero or one quantum or vesicle. We term the probability of this event Prsite and the complementary failure probability Pfsite. A connection between a GC and a PC is likely to comprise several such sites, whose number we denote n. The combined probability of at least one vesicle being released at a connection is defined as Prsyn, whereas the complementary failure probability (release of no vesicles at a connection) is termed Pfsyn:
Finally, N, P, Q are reserved for the mean–variance analysis of compound synaptic responses evoked by extracellular stimulation described below.
Analysis of recordings from pairs of neurons.
Data acquisition was performed using pClamp10 (Molecular Devices). Analysis was performed in the Igor graphing and analysis environment (Wavemetrics), using Synaptix (B.B.), SpAcAn (Guillaume Dugué, Instituto Gulbenkian de Ciencia, Lisbon, Portugal), and macros developed in house (A.M.V. and P.I.). Response amplitudes of individual EPSCs were measured automatically as follows: (1) after smoothing of the raw trace, the procedure found the minimum of the trace in a 5 ms time window after the stimulus onset; and (2) the peak was estimated by averaging 20 points centered on the minimum and subtracting the baseline value. Noise measurements were obtained by applying exactly the same procedure to portions of traces that contained no evoked responses. We define A1, A2, and A3 as the evoked EPSC amplitude resulting from the first, second, and third stimuli:
For frequencies >50 Hz, A2 and A3 were corrected for the residual current of the preceding EPSC by fitting the preceding EPSC decay phase with a single exponential and subtracting its value at the time point of the EPSC peak being measured. Above 200 Hz, only the peak of the burst response was measured (see Results). In a few pairs, the amplitude histograms of evoked EPSCs and the noise histogram did not overlap, and failures could then be identified unequivocally (n = 7 pairs). However, in all other paired recordings, the low signal-to-noise ratio (SNR) precluded direct identification of failures and obliged us to use more indirect methods for estimating this parameter. Our overall approach was to compare amplitude histograms with measurements of noise to estimate the proportion of failures (Pfsyn) in a given paired recording (Isope and Barbour, 2002). Once the EPSC amplitude and noise histograms had been obtained, Pfsyn was estimated by scaling part of the noise distribution to fit the corresponding range of the EPSC amplitude distribution. We chose to scale the noise histogram to the EPSC amplitude histogram for values greater than zero (EPSCs having negative amplitudes by convention; for additional illustration, see Isope and Barbour, 2002, their Figs. 4, 5). This analysis was performed for all pairs recorded (n = 18). This procedure overestimates the proportion of failures when the SNR is low. Therefore, although it is not accurate under all conditions, the estimate does represent a reliable lower bound on the failure proportion. This is useful in the present context because we shall seek below to establish that the Prsyn is higher than previously estimated.
Figure 4.
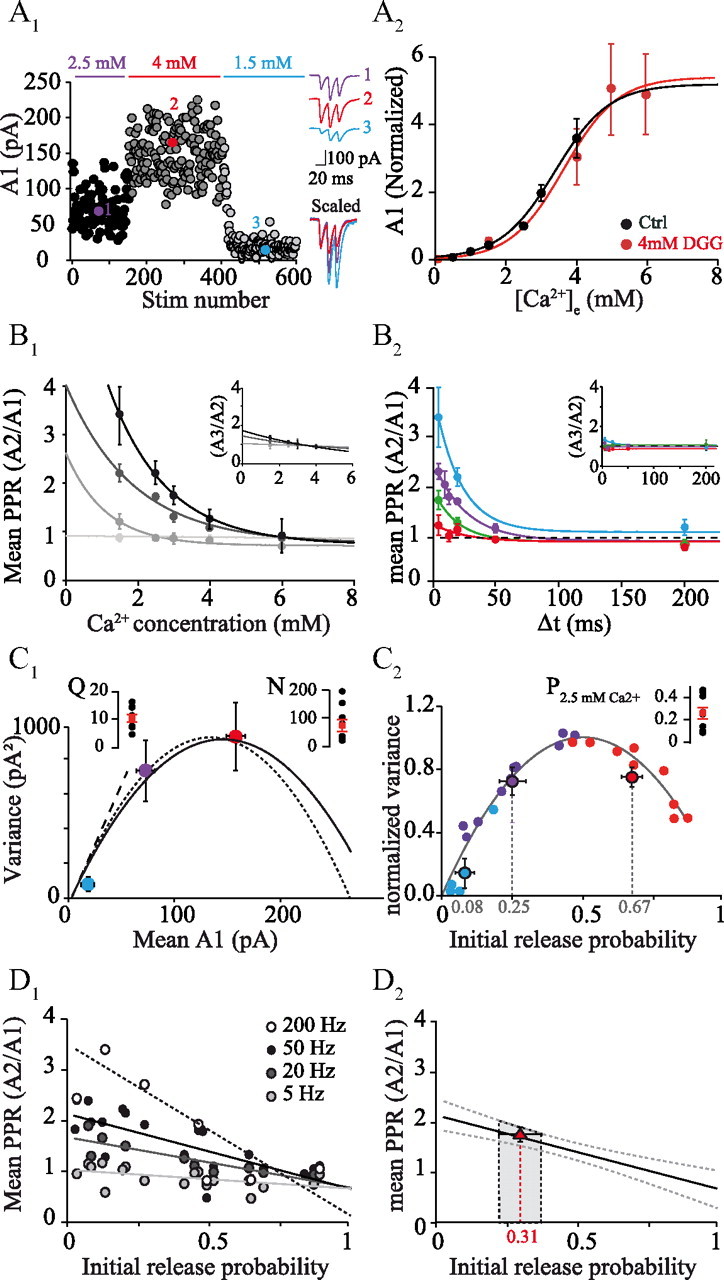
Estimation of initial Prsite at GC–PC synapses. A1, Time course of A1 as [Ca2+]e was varied: 2.5, 4, and 1.5 mm. Insets at right, Averages of 10 traces at 2.5, 4, and 1.5 mm [Ca2+]e. Numbers refer to the time points identified in the time course. A2, Average of mean A1 for all experiments as a function of [Ca2+]e, normalized to the value at 2.5 mm [Ca2+]e, in control conditions (black circles; n = 9) and in the presence of γDGG (red circles; n = 5) fitted by a sigmoid using the following formula: base + max/(1 + exp (([Ca2+]half − [Ca2+]e)/rate))). In control conditions, base = 0.02, max = 5.17, [Ca2+]half = 3.38, rate = 0.76; in γDGG, base = 0, max = 5.28, [Ca2+]half = 3.64, rate = 0.77. B1, Mean PPRA2/A1 at different interstimulus intervals (from black line to light gray line: 5, 20, 200, and 2000 ms), as a function of [Ca2+]e (n = 10) fitted by a single exponential. Inset, Same plot for mean PPRA3/A2. B2, Mean PPRA2/A1 as a function of interstimulus interval at 1.5 mm (blue, n = 4), 2.5 mm (purple, n = 10), 3 mm (green, n = 4), and 4 mm (red, n = 9) [Ca2+]e fitted by a single exponential. Inset, Same plot for mean PPRA3/A2. C1, Variance–mean analysis: example of variance of A1 at 1.5, 2.5, and 4 mm [Ca2+]e for one experiment plotted against mean A1 (same cell as in A1) and same color code as in C1. Each experiment was fitted by a parabola using a binomial model (dotted line) or a multinomial model with CVI = 0.2 and CVII = 0.34 (solid line). Error bars are an evaluation of the theoretical error of the sample variance (σsample) for n observations. Inset, Individual values of Q and N (n = 9) obtained using the multinomial model. C2, Parabolae for all cells (n = 9 cells) normalized at the maximum variance (varmax) and maximum amplitude (N · Q). Color-filled circles represent the mean variance of A1 for all experiments and the corresponding initial Prsite for 1.5 mm (blue, Prsite = 0.08 ± 0.08), 2.5 mm (purple, Prsite = 0.25 ± 0.16), and 4 mm (red, Prsite = 0.67 ± 0.17) [Ca2+]e. Inset, Individual values of Prsite at 2.5 mm Ca2+ (n = 9). D1, PPRA2/A1 of each experiment as a function of initial Prsite estimated in Figure 4C2 and fitted by a line (n = 9 cells) at 5, 20, 50, and 200 Hz. D2, Initial Prsite of GC–PC paired recordings estimated by comparison of their PPR with the data in D1. The estimated Prsite was 0.31 ± 0.26 (red triangle) at 2.5 mm [Ca2+]e.
Figure 5.

Additional release sites during high-frequency triplet stimulation. A, Example of variance–mean analysis of A1 (filled black circle) and A2 (open black circle) for one experiment at 75 Hz and 2.5 mm [Ca2+]e. Error bars are σsample (see Results). Errors of the variance calculated by the bootstrap method were similar (σA2 = 484 pA2 vs σsample Α2 = 403 pA2). The parabola was estimated from variance of A1 at 1.5, 2.5, and 4 mm [Ca2+]e. Dashed line is the simulated parabola expected if no replenishment of vesicles occurred between A1 and A2 (N · P vesicles released between A1 and A2). Open light gray circles, Corresponding points of same mean amplitude on simulated parabolae. B, Averaged variance–mean analysis for A2 at increasing frequencies (5–75 Hz, open circles) superimposed on the average parabola of normalized variance–mean analysis for A1 (solid line and filled circles). Dashed line is the averaged simulated parabola expected if no replenishment of vesicles occurred between A1 and A2.
Extracellular stimulation protocols and analysis.
Acquisition of data was performed using the WinWCP 4.2.x freeware (John Dempster, Strathclyde Institute of Pharmacy and Biomedical Sciences, University of Strathclyde, UK). For PPR analysis, three stimuli were systematically applied at various frequencies distributed randomly throughout the protocol and repeated at a rate of 0.1–0.14 Hz. All measurements were made on averages of 20 traces. Because high-frequency stimuli were used, the residual decay of A1 contaminated A2 (see Fig. 3B). For frequencies ≤100 Hz, A2 was calculated as described above by subtracting the extrapolated exponential fit of the preceding EPSC. The fitting function was calculated between 2 ms after the peak and the following artifact. For frequencies ≥200 Hz, A1, A2, and A3 could not be discriminated. Mean A1 was then the average of traces with a single stimulus. Mean A2 was given by (average double-stimulus response − mean A1) and mean A3 by (average triple-stimulus response) − (average double-stimulus response). When measuring individual EPSCs at the second stimulus (A2), residual current from A1 could not be estimated by a simple exponential fit because of noise. We then used the mean decay time constant from averaged EPSCs to correct amplitudes of individual EPSCs. In trains of 30 stimuli, individual amplitudes were determined as follows: (1) each EPSCn of the averaged train was fitted using a biexponential function; and (2) these fits were then used as templates to fit individual EPSCs in each train and used to estimate residual current during the subsequent response.
Figure 3.

High fidelity of synaptic transmission during high-frequency bursts. A, Increased reliability of GC–PC transmission during high-frequency bursts of stimuli. Top, Example of GC–PC paired recordings for one stimulus and three stimuli at 400 Hz. Solid dark line, Their averages. Bottom left, Amplitude of summated EPSCs against interstimulus interval. Bottom right, CV against interstimulus interval. Red, Mean A1. B, Extracellular triplet stimulation in the GC layer. Top, Examples of traces with intra-triplet frequencies ranging from 5 to 500 Hz. Bottom left, EPSC decays were fitted with a single exponential (dotted line), and the amplitudes of EPSCs were measured after correction for residual amplitude of the preceding EPSC. Bottom right, At frequencies >100 Hz, EPSC amplitudes were extracted from average responses to single, double, and triple stimuli. C, Red, Mean PPRA2/A1 as a function of interstimulus interval using extracellular stimulation (with a logarithmic x-axis). Black, Mean PPRA2/A1 in paired recordings (same as Fig. 1). Inset, Same data with a linear axis. D, Mean PPRA3/A2 as a function of interstimulus interval with a logarithmic x-axis. Inset, Same data with a linear axis.
Variance of the mean EPSC at the first stimulation (mean A1) was calculated from at least 100 individual traces. Traces were analyzed only if series resistance fluctuations were <15%. Because a slight linear rundown was sometimes observed during recordings, spurious variance was subtracted by using a linear fit of the time course of A1.
Variance–mean analysis.
Variance–mean analysis was developed and described in detail in previous studies (Silver et al., 1998; Reid and Clements, 1999; Clements and Silver, 2000; Humeau et al., 2001, 2002, 2007; Clements, 2003; Silver, 2003; Saviane and Silver, 2007; Doussau et al., 2010). Because of the long stable recordings required for these analyses, they were applied to recordings in which compound GC responses were elicited in PCs by extracellular stimulation in the GC layer. The responses therefore comprised multiple synaptic connections. As a first approach to analyzing these data, we applied a simple binomial model to the responses. This represents the stimulated synapses as an ensemble of N independent release sites with a release probability P, and quantal size Q.
This simple model assumes that P and Q are uniform; because this is an unlikely physiological situation, the influence of possible heterogeneity was also taken into account (see below). It should be noted that N is a functional parameter and release statistics will only reflect sites that are able to release vesicles. Thus, N does not take into account long-lasting silent sites. In practical terms, only sites containing a readily-releasable vesicle (i.e., docked and fully primed) would contribute to the observed N (Humeau et al., 2001, 2002, 2007). Individual responses are assumed to sum linearly (a significant approximation in the presence of multivesicular release). By the independence of the sites, their means and variances also sum linearly. According to a simple binomial model, the mean of the response (Ā) is given by
with fluctuations of the responses around the mean having variance,
When only P is modified (by changing [Ca2+]e), var = f(Ā) is a parabola:
This can be used to estimate Prsite, because Prsite = 0.5 at the peak of the parabola and 1 at the greater root of the parabola:
The initial slope of the parabola provides an estimate of the weighted average of Q and the greater root of the parabola gives (N · Q). Neither Prsite nor Q is likely to be uniform in practice. We have shown previously that synaptic weights can vary widely without evidence of correlated changes in release probability, which could imply strong variation of Q (Isope and Barbour, 2002). Variation of Q in a multisite binomial model will preserve the parabolic shape of the variance–mean relation, but the apparent Q will be weighted toward the larger individual values of Q. Variation in Prsite causes departure from the parabolic form. For this reason, we applied multiple-probability fluctuation analysis (MPFA) (Clements and Silver, 2000; Silver, 2003), which explicitly models non-uniform Prsite values and also incorporates intersite and intrasite sources of variance in the quantal size Q (Clements, 1991; Clements and Silver, 2000; Silver, 2003). Using this analysis, quantal parameters were estimated by fitting the variance (var) of the mean amplitude (Ā) at different Prsite (by changing [Ca2+]e) in each individual experiment by a simplified multinomial:
 |
were CVQI and CVQII are the coefficients of variation (CV) of the intrasite and intersite quantum variability, and α is a family of β distributions that mimics dispersion of Prsite (Silver, 2003). Because CVQI and CVQII could not be evaluated separately, we made an estimation of the total quantum variability (CVQ) by recording quantal events in ACSF in which Ca2+ was replaced by 5 mm Sr2+ (see Results). Therefore, we fixed CVQI and CVQII at different values such that
Fits of the var = f(Ā) plots were weighted by the theoretical error of the variance (σsample) for n observations (i.e., n EPSCs):
where μ2 and μ4 are the second and fourth central population moments, respectively; h statistics were used to estimate these parameters (Silver, 2003). The dispersion in release probability was estimated as follows:
If the number of releasable vesicles in a given experimental condition is not fixed, this can cause an increase of EPSC variance without changing the mean, tending to lead to an overestimation of N.
Simple model of PPR.
Let N1 and P1 represent the number of functional release sites and their release probability at the first stimulus, whereas N2 and P2 represent the analogous values at the second stimulus. At the first stimulus, P1 · N1 vesicles are released, leaving (1 − P1) · N1 sites filled with a release-ready vesicle. In the time interval between stimuli 1 and 2, a fraction (R) of the sites emptied at stimulus 1 is resupplied with release-ready vesicles; their number is R · (P1 · N1). Thus, at the second stimulus, the number of sites with a releasable vesicle is N2 = (1 − P1) · N1 + R · (P1 · N1). Accordingly, if the quantal size does not change between the stimuli 1 and 2,
which can be rearranged to
Thus, the values of PPR depend on the rate of vesicle replenishment. If no replenishment occurs between the two stimuli, PPR reaches its minimal theoretical value:
In contrast, if complete replenishment occurs, PPR reaches a maximum theoretical value:
We also considered the situation during which the number N of release sites increases between the two stimuli. Therefore, the PPR may be given by
where Nextra is the number of extrasites with a releasable vesicle at stimulus 2 that were reluctant at stimulus 1. In such a case, even if P1 = P2 = 1 and no refilling occurs, PPR can theoretically reach values >1 (i.e., > 1).
Statistics.
Unless stated, means are reported with SDs, whereas error bars in figures represent SEMs, except in Figures 1E, 2A, 4C1, and 5. Unless stated, statistical tests were the nonparametric Mann–Whitney U and Spearman's rank order tests. On several occasions, we applied the nonparametric “bootstrap” method (Efron and Tibshirani, 1993) for estimating the standard error of complex parameters, in particular the probability of failure (see Figs. 1, 3). Briefly, traces were selected randomly, with replacement, from those initially analyzed, until an equal number was accumulated. The original analysis was then simply reapplied to this replicate data set and “bootstrap replicates” of the desired parameter produced. Repetition of this procedure 10,000 times generated sufficient replicates to estimate the SE of the parameter replicates. Despite the apparent circularity of reusing the sample data, the theory underpinning bootstrap methods has demonstrated that the SE obtained will be a good approximation to that of the underlying population.
Figure 1.
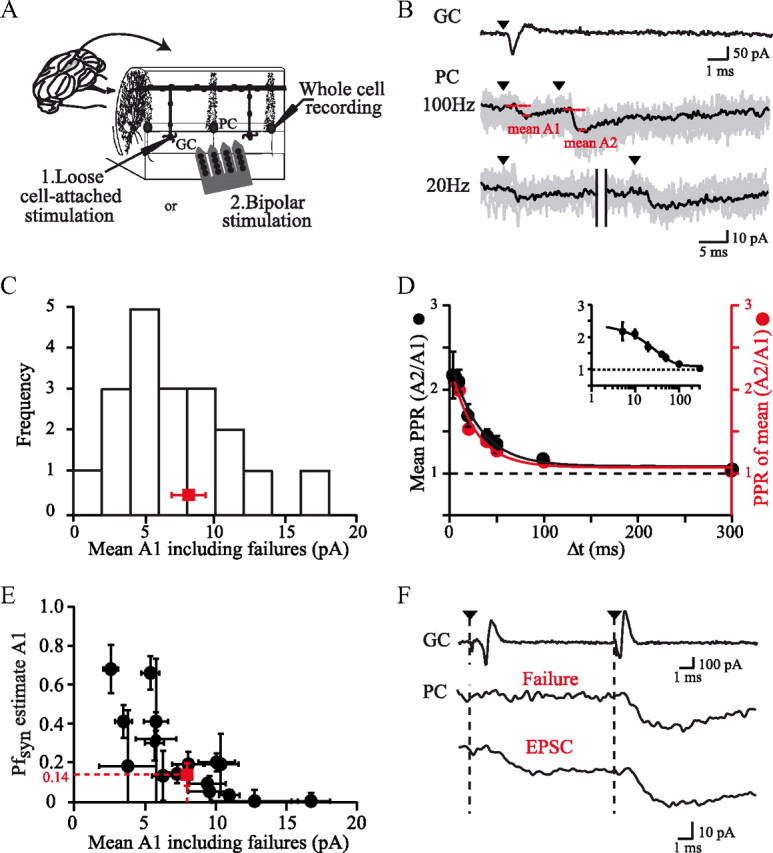
Properties of unitary GC–PC synapses in young rats (P17–P21). A, Diagram showing the typical orientation of cell pairs recorded in this study and the positioning of extracellular stimulation. PCs were whole-cell clamped near the surface of transverse cerebellar slices. GCs were stimulated and recorded in loose cell-attached mode or stimulated using bipolar stimulations. B, Typical GC–PC paired recording. The GC action potential was evoked and recorded as a capacitive current in loose-cell attached mode. The stimulus artifact (black triangle) has been subtracted. Evoked EPSCs were recorded in a connected PC at varying frequencies. Gray, Individual traces; black, averaged traces; red, mean A1 and A2. C, Histogram of the mean EPSC amplitudes including failures at the first stimulation (mean A1) for all pairs (n = 18). Red, Average EPSC amplitude. D, Left axis, Average PPR as a function of interstimulus interval fitted by a single exponential (solid line, τ = 29.4 ± 8.49 ms). Inset, Same data but with a logarithmic x-axis. Right axis and red, PPR calculated as (mean A2 of all pairs)/(mean A1 of all pairs). E, Distribution of estimated failure probabilities plotted as a function of mean A1 with their bootstrap SE estimates (error bars). F, Comparison of mean A2 when failures of release occurred at the first stimulus (middle trace) and when failures of release were excluded (bottom trace) at 100 Hz for one connection. The action potentials in the presynaptic GC stimulated and recorded in the loose-cell attached mode are shown in the top trace.
Figure 2.

PPR at unitary GC–PC connections in young and adult rats. A1, Plot of all PPRs against mean A1 including failures at 25 Hz for GC–PC connections in young rats. Error bars are bootstrap estimates of the SE of the mean A1 (x-axis). For the ratios (y-axis), error bars were calculated using the following formula: SEA2/A1 ≈ (A2/A1).sqrt.((SEA1/A1)2 + (SEA1/A2)2). A2, Same plot for adult connections. Dashed lines represent the 5th and 95th percentiles of the distribution of ratios of two Gaussian distributions, whose means are in the ratio (A2/A1) = 1.25, of which the lesser amplitude (A1) is given on the x-axis of the plot. The SDs of the Gaussians are the mean SE of the amplitude measurements (1 pA). Note that adult pairs were recorded at 2 mm [Ca2+] and young pairs at 2.5 mm [Ca2+]. B1, Plot of mean A2 including failures against mean A1 including failures for all individual connections and linear fit (solid line) for three different frequencies of stimulation (100, 25, and 10 Hz). B2, Same plot for adult pairs at 25 Hz.
Results
PF-PC connections
We recorded unitary GC–PC synaptic responses at near-physiological temperature in transverse slices prepared from young rats (Fig. 1; P17–P21, 2.5 mm [Ca2+]e; 34°C) or adult rats (Fig. 2; 2 mm [Ca2+]e; 32°C). PCs were whole-cell clamped at −60 mV via a somatic patch pipette and the EPSCs were elicited by stimulating GCs. Combined loose cell-attached stimulation and recording (Barbour and Isope, 2000; Isope and Barbour, 2002) was applied to GCs. Paired- or triple-pulse stimulations at varying frequencies were applied. An example of a paired recording in a young rat (Fig. 1B) shows the action potential recorded in the GC as a capacitive current and several EPSCs recorded in the PC. Identification of connected GCs was performed by eye and confirmed by offline averaging of individual traces. For each connection, we calculated the mean amplitude of EPSCs elicited by each stimulus (mean A1 and mean A2; Fig. 1B) including failures (which often could not be identified). PPRA2/A1 was then given by (mean A2)/(mean A1) as suggested by Kim and Alger (2001). In all, 18 GC-PC pairs with detectable responses were obtained. The mean amplitude of the first EPSC was 8.1 ± 4.1 pA (n = 18; Fig. 1C) in young rats.
Modest paired-pulse facilitation and low failure probability at unitary synapses
For each individual unitary connection, the PPRA2/A1 was determined for a wide range of frequencies (0.3–200 Hz; Fig. 1D) and plotted against interstimulus interval (Δt). In all but one pair recorded, only facilitation was observed. In 16 of 18 pairs, the time course of facilitation could be fitted by a single exponential. Figure 1D, in which PPRs were averaged (n = 18; PPRA2/A1 at 50 Hz = 1.7 ± 0.14, PPRA2/A1 at 100 Hz = 2.1 ± 0.15; τ = 29.4 ± 8.49 ms; [Ca2+]e = 2.5 mm), shows that facilitation is modest and decays more quickly than reported previously using compound stimulation in the molecular layer (Atluri and Regehr, 1996; Foster et al., 2005). Because averaging PPR across pairs gives the same importance to small, noisy connections as to strong connections, we also averaged the mean amplitude from all pairs and then plotted the ratio of these means as a function of interstimulus interval. Very similar values of PPR and time course of facilitation were obtained (PPRA2/A1 at 50 Hz = 1.54, PPRA2/A1 at 100 Hz = 1.99; τfit = 25.3 ± 8.7 ms, n = 18; Fig. 1D), suggesting that the modest PPR did not result from a bias toward small connections. The PPR appeared not to depend on the level of the PF connection in the molecular layer, because PPR was not correlated with the EPSC decay time constant (Spearman's rank order test, ρ = −0.28, p = 0.25, n = 18), which is a reasonable proxy for distance from the PC layer (Roth and Häusser, 2001).
Because the PPR is generally assumed to reflect the release probability, we then set out to quantify this parameter. Because paired GC–PC recordings do not allow the long protocols required for extensive direct characterization of Prsite (Silver et al., 1998, 2003; Oleskevich et al., 2000; Humeau et al., 2002), we sought to determine the probability of failures of transmission, Pfsyn (see definitions in Materials and Methods). We first used the approach of Isope and Barbour (2002), based on the comparison of the histogram of EPSC amplitudes and that of the noise. Pfsyn at 2.5 mm [Ca2+]e was obtained by scaling the two amplitude histograms (mean Pfsyn at A1 = 0.14 ± 0.15; n = 18). Note that here we refer to the global failures of transmission at the GC-PC connection; these require a failure of vesicle fusion at each release site of the connection. Figure 1E shows a scatter plot of the failure probability estimates against mean A1. Reproducing this analysis for the second response (A2) at 25 Hz showed a significant decrease in Pfsyn at the second stimulus (mean Pfsyn A2 = 0.05 ± 0.09; n = 9, p < 0.01, Wilcoxon's paired rank test), leading to an absence of failures in five pairs. It should be noted that this method overestimates Pfsyn when EPSC amplitude and noise histogram overlap (Isope and Barbour, 2002). The actual composite Pfsyn is thus certainly equal to or lower than 0.14 at 2.5 mm [Ca2+]e. This value of Pfsyn allows us to make a first estimate of the release probability at an individual site, by combination with the estimate of seven to eight docked vesicles at the PF–PC synapse reported by Xu-Friedman et al. (2001). Thus, Pfsyn = (1 − Prsite)n where n = 7 or 8, which yields Prsite = 0.22–0.24.
We tested the possibility that desensitization of postsynaptic receptors could reduce PPR. We choose a sample of paired recordings in which the amplitude histogram did not overlap with that of the noise, allowing successes of transmission to be discriminated unequivocally from failures (Saviane and Silver, 2006). Although this method might appear biased by the selection of stronger connections, the putative involvement of desensitization at the second stimulus would presumably tend to be overestimated. At 100 Hz, we compared the average amplitude of the second EPSC when a failure occurred at the first stimulus with the average EPSC when release of vesicles was observed at the first stimulation (Fig. 1F). Remarkably, no difference in the amplitudes of the EPSCs elicited by the second stimulus was detected between the two conditions (mean A2 when there were failures at the first stimulation = 12.8 ± 2.4 pA; mean A2 when there were successes at the first stimulation = 12.9 ± 1.6 pA; n = 7 cells, Wilcoxon's paired rank test, p = 0.93). This suggests that neither postsynaptic desensitization nor depletion of vesicles play a significant role under these conditions.
Variability of paired-pulse facilitation at unitary connections
Paired GC-PC recordings allowed us to study the variability of PPR between unitary connections. Thus, at 25 Hz, PPRA2/A1 ranged from 0.8 to 2.1. Plotting PPR against mean EPSC amplitude for all pairs recorded in young rats (Fig. 2A1) and in adult rats (Fig. 2A2; dataset described by Isope and Barbour, 2002) appeared to show a tendency for PPR to increase with decreasing EPSC amplitude. Similar trends have been interpreted as reflecting a decreasing Prsyn with amplitude (Markram et al., 1997). However, the effect of the low SNR of the small connections must be taken into account. In general, any ratio with a small, noisy denominator can show great variation. This can be understood by considering the ratio of two Gaussians; the resulting Cauchy distribution has neither mean nor SD because sometimes a division by zero occurs. The effect of the small noisy denominator is apparent in the broad spread of PPR values at small A1. This spread can plausibly be explained as the result of a noisy ratio with a fixed underlying PPR, as shown by the 5th and 95th percentiles of the simulated distribution of the ratio of two Gaussians whose means were in the ratio 1.25 and whose SDs were the (approximate) SE (1 pA) of the mean amplitude (Fig. 2A2). Thus, in adult rats, all connections may share similar values of paired-pulse facilitation (∼1.25 in adult pairs at 25 Hz and 2 mm [Ca2+]e). We then plotted mean A2 versus mean A1 for all connections (Fig. 2B), because this representation does not suffer from the same sensitivity to noise as does a ratio with a small and noisy denominator (Kim and Alger, 2001). The plot could be well fitted by a line, the slope of which gave the PPR. Determination of PPR by averaging all A1 and A2 (Fig. 1D) or by fitting A2 versus A1 of all connections with a single line (Fig. 2B) give very similar PPRA2/A1 values for all frequencies tested in both young rats (Fig. 2B1, PPR10 ms = 2.06 ± 0.12, PPR40 ms = 1.35 ± 0.01, PPR100 ms = 1.15 ± 0.05; 2.5 mm [Ca2+]e) and adult rats (Fig. 2B2; PPR40 ms = 1.26 ± 0.05; 2 mm [Ca2+]e). These findings demonstrate that PPR at the PF-to-PC synapse is a parameter that depends on the frequency of stimulation but appears to be independent of synaptic weight.
High fidelity of synaptic transmission at unitary synapses during high-frequency bursts
Because in vivo experiments have shown that GCs can fire at very high frequency (Chadderton et al., 2004; Jörntell and Ekerot, 2006; Rancz et al., 2007; Arenz et al., 2008), we applied short bursts of three stimuli at higher frequencies (up to 1 kHz; Fig. 3A) to investigate the behavior of the synaptic response at these frequencies. Separation of EPSCs was not possible >200 Hz, so we measured the amplitude and CV of the compound EPSC. As shown in Figure 3A, bursts of action potentials led to a fourfold increase in the compound response, a fourfold decrease in CV and a corresponding fourfold increase in the SNR (SNRpeak1 = 2.2 vs SNR400 Hz = 10, where SNR = mean/SD), showing that release of vesicles was sustained to the third stimulus. At 1 kHz, the modest enhancement in burst amplitude and the higher CV than at lower frequencies suggested that action potential initiation failed in a few trials because of the refractory period, which is ∼1 ms under these conditions (Isope and Barbour, 2002).
We conclude the following from our unitary synapses: (1) the GC–PC connection shows a low probability of failure of transmission; (2) the synapse nevertheless facilitates; and (3) high-frequency bursts of action potentials elicit strong, reliable responses. To understand the mechanisms underlying these phenomena, we then studied more systematically the properties of the GC–PC synapse.
GC layer stimulation reproduces the PPR of unitary connections
Unfortunately, paired recordings between GCs and PCs do not allow extensive characterization of synaptic parameters, such as the probability of release and the rate of vesicle replenishment, because high-frequency stimulation in the loose cell-attached configuration frequently led to breakdown of the GC membrane. For this reason, we used extracellular stimulation using iridium multi-electrode arrays placed deep in the granular layer (see Materials and Methods and Fig. 1A). GC stimulation should generate a more diffuse pattern of active PFs than stimulation in the molecular layer. The use of the metal electrode arrays enabled balanced and low-voltage bipolar stimulation, reducing the artifact and accelerating recovery between stimuli. The deep position in the GC layer prevented inadvertent stimulation of PFs. We applied up to three stimuli at high frequencies. For frequencies up to 100 Hz, EPSC amplitudes were corrected for the residual current from the preceding current (Fig. 3B; see Materials and Methods), whereas above 100 Hz, the mean A1, A2, and A3 were estimated using a three-step protocol in which sequences of one, two, and three stimuli were applied. The mean A2 and A3 were then estimated by subtraction (Fig. 3B; see Materials and Methods). No significant differences were observed between PPR values from unitary connections and those obtained using GC layer stimulation (Fig. 3C; nonlinear regression analysis test, p = 0.11). For intervals of 5 ms and greater, PPRA2/A1 decreased exponentially with interval; the values obtained were lower than most published values over the whole frequency range (Matsukawa et al., 2003; Foster et al., 2005). Furthermore, as observed in paired recordings, for all these frequencies, the facilitation of the response induced by the first stimulus was maintained from the second to the third stimulus (Fig. 3D). PPRA3/A2 and PPRA2/A1 at the shortest intervals, 1 and 2 ms, deviated from the extrapolated curves fitting the data for longer intervals. The reciprocal decrease of PPRA2/A1 and increase of PPRA3/A2 suggested that the deviations were caused by failures of excitation. Some stimuli could plausibly have fallen into at least the relative refractory period at these intervals (measurement of the refractory period in GCs under similar conditions found values ∼1 ms; Isope and Barbour, 2002).
The combination of a significant release probability (see the above estimate Prsite = 0.22–0.24) and paired-pulse facilitation might be expected to lead to rapid exhaustion of the readily-releasable pool (RRP). If we assume a slow rate of vesicle replenishment (Pyle et al., 2000) at 2.5 mm [Ca2+]e and an initial Prsite = 0.22, 22% vesicles in the RRP would be released at the first stimulus and 78% remain available. Given a PPRA2/A1 = 2.3 at 200 Hz (Fig. 3C), 51% of quanta would be released at the second stimulus. After two stimuli, only a fraction 100-51-22 = 27% of vesicles of the initial RRP would remain for a third response, which should therefore be severely depressed (predicted PPRA3/A2, 27/51 = 0.5). This prediction was, however, not verified, because PPRA3/A2 = 1.13, indicating that 1.13 × 51 = 58% of the initial RRP was again released (Fig. 3D). This implies that a number of vesicles equivalent to 31% of the initial pool were recruited, docked, and fully primed to be ready for release in 10 ms. This calculation clearly indicates that the observed PPR values obtained at 2.5 mm [Ca2+]e during triplet stimulation at high frequency cannot be explained simply by an increase of a uniform Prsite at the time of stimuli 2 and 3.
Three scenarios could explain the increase in the number of vesicles released during short bursts of three action potentials: (1) initial release probability at individual release sites was lower than estimated; (2) the apparent number of active release sites (N) increased during the interstimulus interval or reluctant sites are recruited; and (3) a high rate of fusion site replenishment with release-ready vesicles compensates for vesicles released. We shall first explore in detail the initial release probability.
Determination of release probability at the PF-to-PC connection
The determination of release probability of individual release sites, Prsite, by the identification of quantal peaks in synaptic amplitude histograms was precluded by the small size of the quantal event and its variability compared with the level of noise (Clements, 1991; Larkman et al., 1991). We therefore used protocols modifying initial Prsite. Varying extracellular [Ca2+]e dramatically altered A1 (Fig. 4A) as expected if initial Prsite varied. For example, in the experiment in Figure 4A, A1 ranged from 2.5 pA at 1.5 mm [Ca2+]e to 277 pA at 4 mm [Ca2+]e (mean A1 = 17.3 pA at 1.5 mm [Ca2+]e; mean A1 = 171.4 pA at 4 mm [Ca2+]e; n = 9). The relation between mean A1 and [Ca2+]e could be well fitted by a sigmoid function (Fig. 4A2) as shown previously at many connections (Augustine and Neher, 1992; Mintz et al., 1995; Foster et al., 2005). If we assume that the plateau of fits represents the maximal release probability and not saturation of postsynaptic receptors (see below), we can interpret the EPSC amplitude relative to the plateau as being approximately proportional to the release probability. Thus, based on the sigmoid fit, average Prsite would be close to 0.7 at 4 mm [Ca2+]e (Fig. 4A2; Prsite = 0.2 at 2.5 mm [Ca2+]e; Prsite = 0.08 at 1.5 mm [Ca2+]e). The possible influence of postsynaptic receptor saturation was examined by performing a set of experiments using the low-affinity competitive antagonist γ-d-glutamylglycine (γDGG) (4 mm) to relieve AMPA receptor saturation. Application of γDGG (4 mm) reduced EPSC amplitudes by 94.1% at 2.5 mm [Ca2+]e (control: mean A1 = 518.9 ± 306.5 pA; γDGG: mean A1 = 32.3 ± 28.5 pA, n = 5 cells). [Ca2+]e was then varied from 1.5 to 6 mm, and mean EPSC amplitudes were measured at the steady state. Figure 4A2 (red dots) shows that the normalized relation EPSC = f([Ca2+]e) in γDGG is close to that observed in control conditions (Prsite = 0.1 ± 0.04 at 1.5 mm [Ca2+]e; Prsite = 0.26 ± 0.17 at 2.5 mm [Ca2+]e; Prsite = 0.57 ± 0.09 at 4 mm [Ca2+]e, n = 5). Assuming that the effect of γDGG is at least partially competitive with the synaptic glutamate transient (i.e., that some γDGG unbinds before the glutamate transient decays), these data suggest that AMPA receptor saturation did not influence our results at concentrations up to 4 mm [Ca2+]e. We note, however, that a competitive antagonist would be expected to deform the curve of A1 versus [Ca2+]e by inhibiting more strongly the smaller EPSCs, which are presumably produced by a lower glutamate concentration. This does not appear to have occurred. An absence of multivesicular release could provide an explanation, but this would contradict our and others' estimates of n = 7 releasable vesicles at this synapse. It also seems unlikely that γDGG is entirely uncompetitive given its widespread use as a competitive antagonist, although slow kinetics of glutamate unbinding from the receptors combined with rapid dilution of released glutamate might conceivably prevent the γDGG from competing effectively.
The release probability of 0.25 and the maximum response estimated to correspond to seven releasable vesicles can be interpreted to give information about AMPA receptor occupancy. The AMPA receptor occupancy resulting from the release of a single vesicle is unlikely to exceed 100/7 = 14%. This is significantly lower than that estimated at the mossy fiber–GC synapse (DiGregorio et al., 2007), possibly reflecting differences in synapse geometry or receptor properties, but agrees closely with modeling of diffusion and receptor activation at small synapses (Barbour, 2001).
Plotting mean PPRA2/A1 against [Ca2+]e (Fig. 4B1) highlights the strong correlation between PPR and initial Prsite at the first stimulus. Interestingly, when the time courses of the PPR were plotted at all calcium concentrations, they could be fitted by single exponentials having very similar time constants whose mean was 22.6 ± 2.7 ms (Fig. 4B2; respectively, τ = 20.4, 25.3, 19.3, and 25.2 ms at 1.5, 2.5, 3, and 4 mm [Ca2+]e). The time course of paired-pulse facilitation was therefore relatively independent of calcium concentration.
To obtain an independent estimate of Prsite, we analyzed the synaptic amplitude fluctuations of compound EPSCs (A1) evoked by extracellular stimulation in the GC layer at different [Ca2+]e (see Materials and Methods). The variance of A1 was then determined and plotted against the corresponding mean A1 at different [Ca2+]e (n = 9; Fig. 4C1). The var = f(mean A1) relationships were well fitted by parabolae (Eq. 1), as expected for a variation in Prsite. From the individual parabolae obtained in each experiment, we determined Q and N (mean Q = 10.8 ± 3.9 pA, mean N = 72 ± 64, n = 9). According to Equation 2, Prsite = 0.26 ± 0.15 (n = 9) at 2.5 mm [Ca2+]e in agreement with previous results (Sims and Hartell, 2005). The value of Q is also in agreement with the estimate deduced from the amplitudes of asynchronous individual (i.e., monoquantal) events when EPSCs recorded in PCs were evoked after replacement of extracellular Ca2+ ions by 5 mm Sr2+ (median = 11.5 pA; mean = 13.1 ± 6.3; n = 1007 mEPSCs from 6 cells). However, it should be noted that both of these quantal estimates may suffer from error. Detection of mEPSCs is subject to a threshold, and it is likely that some mEPSCs fall below it. The mean of the detected mEPSCs will therefore tend to overestimate the true amplitude. Conversely, the simple binomial model overestimates Q, too, in the way that it does not take into account the quantum variability (see below), overestimating Q by a factor (1 + CVQ2) (Silver, 2003).
Because the simple binomial model does not take into account non-uniformity of Prsite and Q, we also analyzed our data using MPFA (Silver, 2003). Quantal parameters were extracted by fitting the var = f(mean A1) relationships obtained from each experiment with a multinomial (Eq. 3) weighted by the theoretical error of the sample variance for n observations (i.e., n EPSCs; Fig. 4C1; see Materials and Methods). The compound CVQ (i.e., intrasite and intersite variability) was estimated from the amplitudes of asynchronous individual events recorded in 5 mm Sr2+. The value CVQ = 0.4 was similar to those reported for other excitatory synapses (Silver et al., 1998, 2003; Bekkers and Clements, 1999). Because it was not possible to estimate the coefficients of variation of the intrasite (CVQI) and intersite (CVQII) quantal variability, we tested several scenarios that all gave similar estimates of Prsite (Table 1). For the rest of the study, we used CVQI = 0.2 (Silver et al., 1996) and thus CVQII = 0.34 (see Materials and Methods). Overall, the parameter α introduced in Equation 3 to mimic dispersion of Prsite was found to be scattered (median = 2.11), suggesting that variability in Prsite between the different synaptic release sites was not strongly modified when Prsite was modified. We also estimated the non-uniformity of Prsite: mean CV of Prsite = 0.47 ± 0.43 (n = 9). To pool the variance–mean data obtained from multiple experiments, individual plots were normalized by their peak variance (varmax) and by A1max given by NQ (Fig. 4C2; Doussau et al., 2010). Figure 4C2 shows a summary of the data fitted with the MPFA method and then normalized as explained. In Figure 4C2, the mean values were Prsite = 0.08 ± 0.08 at [Ca2+]e = 1.5 mm, Prsite = 0.25 ± 0.16 at [Ca2+]e = 2.5 mm and Prsite = 0.67 ± 0.17 at [Ca2+]e = 4 mm. The Prsite values at 1.5, 2.5, and 4 mm [Ca2+]e from the four different methods used were summarized in Table 1. They all gave very similar results.
Table 1.
Estimated Prsite using different methods
| [Ca2+]e (mm) | Control | γDGG | Binomial | MPFA (CVI= 0.4, CVII= 0.4) | MPFA (CVI= 0.2, CVII= 0.34) |
|---|---|---|---|---|---|
| 1.5 | 0.08 ± 0.04 | 0.1 ± 0.04 | 0.08 ± 0.08 | 0.07 ± 0.08 | 0.08 ± 0.08 |
| 2.5 | 0.2 | 0.26 ± 0.17 | 0.26 ± 0.15 | 0.24 ± 0.15 | 0.25 ± 0.16 |
| 4 | 0.7 ± 0.41 | 0.57 ± 0.09 | 0.71 ± 0.14 | 0.65 ± 0.18 | 0.67 ± 0.17 |
Prsitewere estimated directly from the A1 = f([Ca2+]e) relationship in control conditions (first column) and during perfusion of 4 mm γDGG (second column) or from variance–mean plots fitted by a simple binomial model (third column) or a multinomial model (fourth and fifth columns).
The relation between PPRA2/A1 and Prsite was constructed from experiments in which the PPR was determined and the Prsite was obtained from a variance–mean analysis (Fig. 4D1). A linear relationship between PPRA2/A1 and Prsite could be established for each frequency of stimulation: for instance, at 50 Hz, PPRA2/A1 = 2.12–1.48 Prsite. As already suggested by Figure 3 C and D, for all frequencies of stimulation PPR > 1, even for Prsite > 0.5. The maximum theoretical values of PPR (see model of PPR in Materials and Methods) occur when Prsite = 1 at the second stimulus (P2 = 1) and thus PPRmax = 1/P1 (P1 corresponding to Prsite at the first stimulus). We found that, at 200 Hz, when P1 = 0.25, PPRA2/A1 = 2.8 (Fig. 4D1), which is below the theoretical maximum of 4 (i.e., 1/P1 = 1/0.25). However, when P1 = 0.65, PPRA2/A1 = 1.5 which corresponds to the maximum theoretical value (i.e., 1/0.65 = 1.54; Fig. 4D1), suggesting that all release sites were replenished between the two stimuli (in 5 ms). Note that, at 200 Hz, receptor desensitization cannot be excluded and the observed PPR may even underestimate the number of vesicles released. Such a high rate of reloading of individual empty sites would be in the range of the fastest rates reported (Dittman et al., 2000; Crowley et al., 2007). An alternative possibility is that release sites that were nonfunctional (or reluctant) at the first stimulus could contribute to exocytosis at the second stimulus. This hypothesis will be tested below.
Using the calibration relation of Figure 4D1 between PPR and Prsite, we then estimated that the average Prsite at individual GC-PC connections was 0.31 ± 0.4 at 2.5 mm [Ca2+]e (Fig. 4D2). Having obtained several independent estimates that were all consistent with a Prsite of 0.24, we could then combine this value with the estimated Pfsyn (0.14) obtained from the stronger connections among the paired recordings (Fig. 1E) to estimate the average number of release sites, n, at a single GC-PC connection. According to a binomial model, n = log(Pfsyn)/log(1 − Prsite), which gives n = 6.8 release sites, a number close to the number of docked vesicles reported at this synapse (Xu-Friedman et al., 2001).
Additional release sites during high-frequency triplet stimulation
The combination of a release probability of ∼0.24 and paired-pulse facilitation might be expected to lead to rapid exhaustion of the RRP (see above). We therefore investigated whether recruitment of additional release sites (i.e., an increase in the number of functional release sites, N) could explain the strongly facilitated second and third responses (Fig. 4B). We used variance–mean plots, which allow a graphical determination of modifications of the binomial parameters N, P, or Q (see Materials and Methods; Clements and Silver, 2000; Humeau et al., 2001). The respective means and variances of the amplitudes of the first (A1) and second (A2) EPSCs at 2.5 mm [Ca2+]e were calculated at 5, 20, 50, and 75 Hz (Fig. 5) in five experiments. These were fitted by either Equation 1 (Fig. 5) or Equation 3 (data not shown). Whereas the individual (varA1, mean A1) points should fall on the parabola by construction, this is not necessarily the case for the points (varA2, mean A2) from the second stimulus. If no change in Q occurred, the (varA2, mean A2) points should fall on a varA2 = f(mean A2) relationship with the same initial slope (Q unchanged) but with a different N2, which determines the greater root of the parabola. N2 represents the number of release sites at which a vesicle ready for release was available at the time of A2. Two extreme situations can arise depending on the rate of vesicle replenishment. If no replenishment occurred between stimuli, then N2 = N1 · (1 − P1); if replenishment were complete, however, N2 = N1 (see model in Materials and Methods). Thus, if no extra sites (Nextra) are recruited between A1 and A2, the (varA2, mean A2) points should fall between the parabolae, corresponding to these two extremes (Fig. 5A, gray area). Conversely, if extra sites are recruited between stimuli, the extent of the var = f(mean A2) relationships may be larger than those determined for A1. In this case, its extent would be determined by the number of sites not used at A1 (i.e., at which a vesicle remains) + the number of emptied sites replenished between A1 and A2 + Nextra sites (see model in Materials and Methods). If Nextra is greater than the number of nonreplenished sites after A1 (varA2, mean A2), points may lie above the parabolae for A1. Note that the increase in amplitude of A2 may combine alterations in N and of Prsite (as a result of residual calcium). Because release is probabilistic, N2 will vary, and this additional variance may obscure the reduction expected from the vesicle depletion resulting from the first release.
We observed that, up to 50 Hz, although ∼25% of the sites would have been emptied at the first stimulus (Prsite = 0.25 at 2.5 mm [Ca2+]e), the points for A1 and A2 both lay on the same parabola (Fig. 5B). This suggests that, during the corresponding interstimulus interval, sites emptied at A1 have been fully replenished or recruitment of Nextra sites had compensated those not replenished at the time of A2. However, at 75 Hz, A2 points clearly deviated from the reference parabola toward higher values (Fig. 5A,B). To evaluate whether the observed deviations were significant, we calculated the theoretical error of the sample variance (σsample; Eq. 4) for A2 and compared it with the error of the sample variance deduced for the reference relationship at the corresponding mean amplitude (Fig. 5A; error bars are σsample). In four of five experiments, the increase in variance was found to be significant (Student's t test, p < 0.01). Calculating the error in variance using the bootstrap method (see Materials and Methods) gave the same results (see legend of Fig. 5A). Note that, for the statistical comparison, we compared varA2 with the estimated variance of the reference parabola, which implied N2 = N1, a full replenishment of emptied sites between the two stimuli. Because complete recovery was unlikely, we therefore underestimated the differences in variance at A2 and A1 of the number of sites not replenished between the two stimuli. If we make the assumption that a frequency-dependent increase of Q is unlikely, the points obtained at 75 Hz indicate a significant increase in N between the first and second stimuli. By varying N in the reference varA1 = f(mean A1) relationship, we estimated the increase in apparent N to be between 1.6-fold and 2.2-fold with full replenishment of emptied sites and between 2.1-fold and 2.7-fold without replenishment.
We further investigated this deviation from the reference varA1 = f(mean A1) relationship during high-frequency trains (30 stimuli at 100 Hz; Fig. 6A; see Materials and Methods). We verified that EPSC amplitudes were stable across successive trains. The variance (varAn) for each stimulus number (An) in the train was calculated and plotted against the corresponding mean amplitude (mean An; Fig. 6A). These data were then compared with a reference varA1 = f(mean A1) relationship constructed as a parabola from the observed (varA1, mean A1) point and an estimate of Q obtained from evoked mEPSCs in the presence of strontium (Fig. 6A; Saviane and Silver, 2006). As reported above in the triplet stimulation protocol (Fig. 5), the (varAn, mean An) points for the second and third stimuli deviated from the reference parabola, but the variance of the following responses converged toward that of the first response. These findings show that the increased variances of A2 and A3 and their deviation from the predicted parabola were attributable to an increase in N, the number of readily-releasable vesicles, which then declined again as the train continued. It seems likely that the numbers of available vesicles varied stochastically in the steady-state phase of the response to trains; such variation may have increased the variance beyond that expected for a small fixed value of N.
Figure 6.

Sustained GC–PC synaptic transmission during trains of stimuli. A, Variance–mean analysis at each stimulus number in 100 Hz trains (numbers identify stimulus number) superimposed on the initial parabola having an initial slope of Q = 10.8 pA and based on the variance of the first stimulus (A1). B, Average of EPSCn/EPSC1 ratios in trains at 100, 75, 50, and 20 Hz as a function of stimulus number (n = 6). C, Cumulative plot of EPSC amplitudes (normalized to A1) during trains at 100, 75, 50, and 20 Hz. Dotted blue line, Linear fit of the steady-state region of the cumulative plot. Red dots, y-Axis intercepts of the fits indicating the estimation of N (RRP). Inset, Detail of the data within the black rectangle; solid line, prediction of y-axis intercept if N were constant (N = 1/Prelease). D, Same cumulative plots against stimulus number.
Ultrafast replenishment during high-frequency activity
Previous studies have shown that fast vesicle replenishment can occur at PF synapses (Crowley et al., 2007). The rate of this process is calcium dependent at climbing fiber synapses on PCs (Dittman and Regehr, 1998), and this has been extrapolated to models of transmission at PF synapses (Dittman et al., 2000). We therefore investigated the rate of replenishment of emptied site with release-ready vesicles during trains of stimuli at different frequencies. As can be seen in Figure 6B, responses first increased in amplitude before slowly decaying back to a level comparable with the first response, the exception being 20 Hz trains, during which facilitation was maintained throughout. These data offer several insights. First, the initial large responses presumably reflect emptying of the RRP of vesicles. Second, because the steady-state amplitude is smaller than the largest responses observed, it seems likely that release site replenishment is the limiting process during the late portion of the trains. To quantify these two aspects of the release process, we calculated the cumulative EPSC amplitude for each experiment, normalized by the first response (Fig. 6C). A line was fitted to the steady-state region of the plot and extrapolated to time 0. This intercept gives an estimate of the size of the initial RRP (or N) if Prsite during trains is maximal (Schneggenburger et al., 2002). The ratio of the amplitude of the first EPSC in the train to the RRP size is also an estimate of the initial release probability. Finally, the slope of the asymptotic fitted line can be used to calculate the relative rate of release site replenishment (Schneggenburger et al., 1999, 2002). Our results are reported after normalization to A1 in each experiment. Figure 6C shows that both the slope of the linear fits and the size of the initial RRP (N) increased at higher frequencies of stimulation. At 20, 50, 75, and 100 Hz, the r · t + N functions, with t in milliseconds, were respectively, 0.028 · t + 3.23, 0.046 · t +5.72, 0.07 · t + 9.66, and 0.12 · t + 7.19. The greater slope of the steady-state region at high frequency indicated accelerated replenishment, increasing fourfold (from 0.028 to 0.12 per millisecond) between 20 and 100 Hz. Interestingly, at higher frequencies, the replenishment rate appeared to be approximately proportional to the rate of release, because similar amplitude time courses with respect to stimulus number were observed at different frequencies (Fig. 6D).
Surprisingly, we also observed that the apparent size of the RRP (given by the intercept of the back-extrapolated fit of the linear portion of cumulative plot with y-axis) increased with stimulation frequency and thus that the ratio A1/RRPfrequency (which is an estimate of Prsite at the time of first stimulus) decreased. RRP/A1 in the cumulative plots gives a value close to 4, at low frequencies consistent with the estimate of Prsite = 0.25, with higher values (∼8) occurring with higher frequencies. Thus, estimated RRP and therefore N increased approximately twofold between 20 and 100 Hz (Fig. 6C), confirming the deduction made using mean–variance analysis.
Because at 100 Hz the An were ∼1.25 times amplitude of A1 (Fig. 6B), the rate of replenishment was ∼1.25 · n sites · Prsite = 1.25 · 6.8 · 0.25 = ∼2 vesicles in 10 ms. We assume that facilitation by residual calcium reaches high levels in the steady-state phase of the trains. If true, each stimulus will release all release-ready vesicles. If replenishment is described by a simple exponential time course, the number of replenished sites = n(1 − exp(−t/τ)), and we can calculate the time constant (during 100 Hz trains) from τ = −10 ms/ln(1 − 2/n). Depending on whether we take n = ∼7 (the estimate for control conditions) or n = ∼14 (i.e., assuming that n doubles because of the recruitment of sites), we obtain τ = 30 or 65 ms.
Discussion
Our experiments enable us to quantify at least approximately several parameters of transmission at the GC–PC synapse. We shall first describe its operation at 2.5 mm [Ca2+]e and 34°C, conditions chosen to facilitate comparison with previous work, before evaluating the physiological implications of our findings.
Modest PPR
We found modest paired-pulse facilitation (Figs. 1, 3, 4) that decayed with a single exponential of 25–30 ms. These properties were identical in paired recordings and in the experiments using extracellular stimulation; in the latter, we also showed that the decay of facilitation was quite insensitive to the extracellular calcium concentration. These properties differ significantly from those of some previous studies (Atluri and Regehr, 1996; but see Foster et al., 2005; Sims and Hartell, 2005), which reported higher PPR values with a slower, calcium-dependent decay. The reasons for these differences remain unclear. The use of molecular layer stimulation in most previous studies may contribute, as we have reported previously higher PPR values with this method (Isope and Barbour, 2002), but this difference is not systematic (Sims and Hartell, 2005). A strong gradient of PPR with respect to stimulation position in the molecular layer has been reported (Foster et al., 2005), but the absence of any correlation between PPR and EPSC decay time constant in our paired recordings suggests they were not subject to such a positional gradient, because EPSCs of synapses higher in the molecular layer tend to display longer time constants (Roth and Häusser, 2001). In the paired recordings, no evidence was obtained that either PPR or release probability was correlated with EPSC amplitude, once the effects of noise on the analyses were taken into account (Fig. 2; see simulation in the study of Isope and Barbour, 2002, their Fig. 5). We note that the present recordings were obtained with extracellular stimulation lateral to the PC at distances precluding activation of ascending axons or local GCs. The low PPR we obtain can therefore not be attributed to differential properties of ascending axon inputs (Sims and Hartell, 2006); this confirms our previous results in the adult rat (Isope and Barbour, 2002).
Release probability
The PPR is widely reported to be related to the release probability, a finding we confirm with the linear relation reported here (Fig. 4). Because we found a lower PPR than in previous reports, we expected to obtain correspondingly higher estimates of release probability, which we measured through multiple experimental approaches. Activated from the resting state, the synapse displayed a low failure probability (failure to release any vesicles, Pfsyn), estimated by histogram analysis of the paired recordings to be 15% or less. The dependence of EPSC amplitude (elicited by extracellular stimulation in the GC layer) on the extracellular calcium concentration indicated that the control probability of release (Prsite) was ∼0.25 of the maximum; the insensitivity of this relation to the low-affinity AMPA receptor antagonist γDGG suggested that receptor saturation did not affect this determination (assuming, however, that the antagonist was at least partially competitive during transmission at this synapse). Combining the Pfsyn from paired recordings with the estimated Prsite yielded an estimate of the RRP of ∼7 vesicles, which is in perfect agreement with an electron microscopic count of the number of docked vesicles at this synapse (Xu-Friedman et al., 2001). This estimated release probability was corroborated by using variance–mean analysis of compound EPSCs, which provided an almost identical value of Prsite (0.25). Use of the more sophisticated MPFA yielded similar values to the simple binomial analysis (Table 1) but suggested that release probability might be quite heterogeneous (CVPr = 0.47). Because neither the release probability estimates nor the PPRs from the paired recordings displayed significant variation in excess of that expected from the action of noise in the analyses, it is likely that the heterogeneity of release probability is between release sites of individual synapses rather than between synapses. Such intrasynaptic heterogeneity provides a plausible mechanism for the apparent recruitment of release sites we observe (see below). Compared under similar experimental conditions ([Ca2+]e and temperature), the Prsite we have determined is thus several fold greater than previous estimates (Prsite = 0.08 and Prsyn = 0.44 at 1.5 mm [Ca2+]e in our study; Prsite = 0.02 and Prsyn = 0.13 in the study of Foster et al., 2005).
Recruitment of release sites
Two strands of evidence suggest that the apparent number of release sites—equivalent to the number of releasable vesicles—can increase during high-frequency stimulation. The first is the deviation of the second and the third responses from the reference variance–mean parabola, which is most simply explained by a variation in N. The second is the estimate of the RRP derived from the cumulative EPSC amplitude plots during the trains. In both cases, the apparent number of release sites increases approximately twofold. The size of the apparent recruitment (twofold at 75 Hz, equivalent to an interval of ∼13 ms) and its frequency dependence (apparent at 75 Hz but not 50 Hz), coupled with the simple exponential kinetics of paired-pulse facilitation, strongly suggest that the recruitment is an integral, indeed dominant, aspect of the facilitation mechanism. Non-uniformity of release probability across sites at a synapse could explain this phenomenon. We propose that only high-release-probability sites respond effectively to the first stimulus but that facilitatory mechanisms—for instance, binding of residual calcium to the release machinery—at low-probability sites then enables them to respond to the second stimulus. The non-uniformity of release probabilities could reflect distance of the release sites from calcium channels. The kinetics and calcium independence of the PPR would be consistent with a mechanism as simple as binding of calcium to a single site. It is unclear whether the putative low-probability sites can be recruited at the first stimulus when calcium is raised or whether their recruitment always necessitates a conditioning pulse, as has been reported at the calyx of Held (Sakaba and Neher, 2001; Neher, 2006). If a conditioning pulse is required, the conversion of reluctant vesicles into active ones must occur rapidly but not instantaneously, thus affecting the time course of the PPR at the smaller interpulse intervals. However, the time course of PPR displayed remarkably simple kinetics except at the very short intervals in which spike propagation failure can also occur.
Fast vesicle replenishment
Our results indicate that vesicle replenishment becomes limiting during trains at frequencies higher than ∼20 Hz (at 2.5 mm [Ca2+]e), because EPSC amplitudes decrease below their maximum, whereas facilitatory residual calcium would be expected to increase toward a plateau (Fig. 6B). This enables us to estimate the rate of replenishment. We find that the rate increases with the frequency of stimulation, reaching the equivalent of one control EPSC, corresponding to approximately two vesicles per stimulus at 100 Hz or one vesicle in 5 ms. We also calculated a replenishment time constant of 30 or 65 ms (depending on the assumed number of release sites in operation) at 100 Hz; this may be compared with the one vesicle per 20 ms reported for the GC–interneuron synapse (Crowley et al., 2007). Recruitment of release sites during trains may enhance the process of supplying vesicles to the active zone. The fact that similarly sized EPSCs can be maintained as the frequency of trains increases (Fig. 6B) suggests that the rate of replenishment adapts to compensate for the increased release. One possible mechanism for this observation could be calcium-dependent recovery from depression. This process has been clearly demonstrated at the climbing fiber–PC connection, in which a rapid, calcium-dependent phase of recovery from paired-pulse depression is observed (Dittman and Regehr, 1998). The process has also been suggested to operate at PF–PC synapses on the basis of modeling of responses to trains (Dittman et al., 2000), although no direct evidence of a time-dependent recovery phase exists for this connection.
After a period of inactivity, vesicle supply mechanisms will have equilibrated and may be able to furnish initial rates of replenishment exceeding those occurring in the steady state, when supply gradients have been established. Such enhanced initial replenishment could help explain the apparent absence of depressing mechanisms in the paired recordings, in which the responses to a second stimulus were independent of whether the first stimulus triggered release of a vesicle or not (Fig. 1). Both vesicle depletion and receptor desensitization would normally reduce the response to the second stimulus if there was release at the first, but no such effect was observed, suggesting that neither mechanism was significant. However, when a release occurred, >25% of vesicles would have been released (failures were excluded in this case); these were therefore presumably essentially replenished in 10 ms.
Although it is possible that accelerated replenishment might underlie the early increase in the number of releasable vesicles during high-frequency stimulation, for this to be the only mechanism would require an extremely fast, maybe unrealistically fast, process, and its activity-dependent regulation would also need to allow a twofold “overshoot” of the control response that nevertheless decays away rapidly. We believe that it is unlikely that this combination of properties would be satisfied and therefore favor separate mechanisms for the apparent recruitment/facilitation and for replenishment.
Physiological implications
GCs are able to discharge action potentials at frequencies exceeding 1 kHz in vivo (Chadderton et al., 2004; Jörntell and Ekerot, 2006; Rancz et al., 2007; Arenz et al., 2008), but it was not known how such high rates were transmitted to the postsynaptic PC. We show that, at both low (20 Hz) and high (up to 700 Hz) rates of stimulation, the transmission facilitates and can be maintained during long trains (Figs. 3, 6) at 2.5 mm [Ca2+]e. The postsynaptic response to a burst is therefore much stronger and less variable than that to a single action potential or that predicted from simple summation of single action potential responses. For example, three action potentials at 400 Hz elicit a compound EPSC fourfold greater than that after a single action potential; the CV is similarly reduced fourfold (Fig. 3A).
Several of our experiments, including high-frequency stimulations, were performed at 2.5 mm [Ca2+]e, to facilitate comparisons with previous literature. How might our results be extrapolated to a more physiological free calcium concentration ∼1.5 mm [Ca2+]e (Silver and Erecińska, 1990; see also Rancz et al., 2007)? We measured the release probability directly at this concentration and found a value of 0.08 per site (Prsite), translating to 0.44 for release of at least one vesicle at a synapse (Prsyn). Frequency-dependent facilitation is stronger at the lower calcium concentration (Fig. 4). We furthermore expect that recruitment of release sites and acceleration of vesicle replenishment will enable even higher frequencies of activity to be transmitted with high fidelity at the lower extracellular calcium concentration. Our experiments on pairs from the young and the adult suggest that the basic synaptic properties are essentially preserved between the two developmental stages.
In summary, our results show how the GC–PC is particularly well adapted to transfer high-frequency activity from GCs to PCs, thereby preserving the high dynamic range of the mossy fiber/GC system.
Footnotes
This work was supported by the Centre National pour la Recherche Scientifique, Ecole Normale Supérieure, Université de Strasbourg, Ministère de la Recherche, Agence Nationale pour la Recherche Grants ANR-09-MNPS-038, ANR-2010-JCJC-1403-1, and ANR-08-SYSC-005. We thank Jean-Luc Rodeau and Jean de Barry for helpful discussions and Sophie Reibel-Foisset for technical assistance (Animal Care Center, IFR37, Strasbourg).
References
- Arenz A, Silver RA, Schaefer AT, Margrie TW. The contribution of single synapses to sensory representation in vivo. Science. 2008;321:977–980. doi: 10.1126/science.1158391. [DOI] [PMC free article] [PubMed] [Google Scholar]
- Atluri PP, Regehr WG. Determinants of the time course of facilitation at the granule cell to Purkinje cell synapse. J Neurosci. 1996;16:5661–5671. doi: 10.1523/JNEUROSCI.16-18-05661.1996. [DOI] [PMC free article] [PubMed] [Google Scholar]
- Augustine GJ, Neher E. Calcium requirements for secretion in bovine chromaffin cells. J Physiol. 1992;450:247–271. doi: 10.1113/jphysiol.1992.sp019126. [DOI] [PMC free article] [PubMed] [Google Scholar]
- Barbour B. An evaluation of synapse independence. J Neurosci. 2001;21:7969–7984. doi: 10.1523/JNEUROSCI.21-20-07969.2001. [DOI] [PMC free article] [PubMed] [Google Scholar]
- Barbour B, Isope P. Combining loose cell-attached stimulation and recording. J Neurosci Methods. 2000;103:199–208. doi: 10.1016/s0165-0270(00)00318-6. [DOI] [PubMed] [Google Scholar]
- Bekkers JM, Clements JD. Quantal amplitude and quantal variance of strontium-induced asynchronous EPSCs in rat dentate granule neurons. J Physiol. 1999;516:227–248. doi: 10.1111/j.1469-7793.1999.227aa.x. [DOI] [PMC free article] [PubMed] [Google Scholar]
- Bidoret C, Ayon A, Barbour B, Casado M. Presynaptic NR2A-containing NMDA receptors implement a high-pass filter synaptic plasticity rule. Proc Natl Acad Sci USA. 2009;106:14126–14131. doi: 10.1073/pnas.0904284106. [DOI] [PMC free article] [PubMed] [Google Scholar]
- Brown SP, Brenowitz SD, Regehr WG. Brief presynaptic bursts evoke synapse-specific retrograde inhibition mediated by endogenous cannabinoids. Nat Neurosci. 2003;6:1048–1057. doi: 10.1038/nn1126. [DOI] [PubMed] [Google Scholar]
- Brunel N, Hakim V, Isope P, Nadal JP, Barbour B. Optimal information storage and the distribution of synaptic weights: perception versus Purkinje cell. Neuron. 2004;43:745–757. doi: 10.1016/j.neuron.2004.08.023. [DOI] [PubMed] [Google Scholar]
- Chadderton P, Margrie TW, Häusser M. Integration of quanta in cerebellar granule cells during sensory processing. Nature. 2004;428:856–860. doi: 10.1038/nature02442. [DOI] [PubMed] [Google Scholar]
- Clements J. Quantal synaptic transmission? Nature. 1991;353:396. doi: 10.1038/353396a0. [DOI] [PubMed] [Google Scholar]
- Clements JD. Variance–mean analysis: a simple and reliable approach for investigating synaptic transmission and modulation. J Neurosci Methods. 2003;130:115–125. doi: 10.1016/j.jneumeth.2003.09.019. [DOI] [PubMed] [Google Scholar]
- Clements JD, Silver RA. Unveiling synaptic plasticity: a new graphical and analytical approach. Trends Neurosci. 2000;23:105–113. doi: 10.1016/s0166-2236(99)01520-9. [DOI] [PubMed] [Google Scholar]
- Coesmans M, Weber JT, De Zeeuw CI, Hansel C. Bidirectional parallel fiber plasticity in the cerebellum under climbing fiber control. Neuron. 2004;44:691–700. doi: 10.1016/j.neuron.2004.10.031. [DOI] [PubMed] [Google Scholar]
- Crowley JJ, Carter AG, Regehr WG. Fast vesicle replenishment and rapid recovery from desensitization at a single synaptic release site. J Neurosci. 2007;27:5448–5460. doi: 10.1523/JNEUROSCI.1186-07.2007. [DOI] [PMC free article] [PubMed] [Google Scholar]
- DiGregorio DA, Rothman JS, Nielsen TA, Silver RA. Desensitization properties of AMPA receptors at the cerebellar mossy fiber granule cell synapse. J Neurosci. 2007;27:8344–8357. doi: 10.1523/JNEUROSCI.2399-07.2007. [DOI] [PMC free article] [PubMed] [Google Scholar]
- Dittman JS, Regehr WG. Calcium dependence and recovery kinetics of presynaptic depression at the climbing fiber to Purkinje cell synapse. J Neurosci. 1998;18:6147–6162. doi: 10.1523/JNEUROSCI.18-16-06147.1998. [DOI] [PMC free article] [PubMed] [Google Scholar]
- Dittman JS, Kreitzer AC, Regehr WG. Interplay between facilitation, depression, and residual calcium at three presynaptic terminals. J Neurosci. 2000;20:1374–1385. doi: 10.1523/JNEUROSCI.20-04-01374.2000. [DOI] [PMC free article] [PubMed] [Google Scholar]
- Doussau F, Humeau Y, Benfenati F, Poulain B. A novel form of presynaptic plasticity based on the fast reactivation of release sites switched off during low-frequency depression. J Neurosci. 2010;30:16679–16691. doi: 10.1523/JNEUROSCI.3644-09.2010. [DOI] [PMC free article] [PubMed] [Google Scholar]
- Dugué GP, Dumoulin A, Triller A, Dieudonné S. Target-dependent use of co-released inhibitory transmitters at central synapses. J Neurosci. 2005;25:6490–6498. doi: 10.1523/JNEUROSCI.1500-05.2005. [DOI] [PMC free article] [PubMed] [Google Scholar]
- Efron B, Tibshirani R. An introduction to the bootstrap. London: Chapman and Hall; 1993. [Google Scholar]
- Ekerot CF, Jörntell H. Parallel fibre receptive fields of Purkinje cells and interneurons are climbing fibre-specific. Eur J Neurosci. 2001;13:1303–1310. doi: 10.1046/j.0953-816x.2001.01499.x. [DOI] [PubMed] [Google Scholar]
- Foster KA, Crowley JJ, Regehr WG. The influence of multivesicular release and postsynaptic receptor saturation on transmission at granule cell to Purkinje cell synapses. J Neurosci. 2005;25:11655–11665. doi: 10.1523/JNEUROSCI.4029-05.2005. [DOI] [PMC free article] [PubMed] [Google Scholar]
- Hansel C, Linden DJ, D'Angelo E. Beyond parallel fiber LTD: the diversity of synaptic and non-synaptic plasticity in the cerebellum. Nat Neurosci. 2001;4:467–475. doi: 10.1038/87419. [DOI] [PubMed] [Google Scholar]
- Humeau Y, Vitale N, Chasserot-Golaz S, Dupont JL, Du G, Frohman MA, Bader MF, Poulain B. A role for phospholipase D1 in neurotransmitter release. Proc Natl Acad Sci USA. 2001;98:15300–15305. doi: 10.1073/pnas.261358698. [DOI] [PMC free article] [PubMed] [Google Scholar]
- Humeau Y, Popoff MR, Kojima H, Doussau F, Poulain B. Rac GTPase plays an essential role in exocytosis by controlling the fusion competence of release sites. J Neurosci. 2002;22:7968–7981. doi: 10.1523/JNEUROSCI.22-18-07968.2002. [DOI] [PMC free article] [PubMed] [Google Scholar]
- Humeau Y, Doussau F, Popoff MR, Benfenati F, Poulain B. Fast changes in the functional status of release sites during short-term plasticity: involvement of a frequency-dependent bypass of Rac at Aplysia synapses. J Physiol. 2007;583:983–1004. doi: 10.1113/jphysiol.2007.139899. [DOI] [PMC free article] [PubMed] [Google Scholar]
- Isope P, Barbour B. Properties of unitary granule cell→Purkinje cell synapses in adult rat cerebellar slices. J Neurosci. 2002;22:9668–9678. doi: 10.1523/JNEUROSCI.22-22-09668.2002. [DOI] [PMC free article] [PubMed] [Google Scholar]
- Ito M. Cerebellar circuitry as a neuronal machine. Prog Neurobiol. 2006;78:272–303. doi: 10.1016/j.pneurobio.2006.02.006. [DOI] [PubMed] [Google Scholar]
- Jörntell H, Ekerot CF. Reciprocal bidirectional plasticity of parallel fiber receptive fields in cerebellar Purkinje cells and their afferent interneurons. Neuron. 2002;34:797–806. doi: 10.1016/s0896-6273(02)00713-4. [DOI] [PubMed] [Google Scholar]
- Jörntell H, Ekerot CF. Properties of somatosensory synaptic integration in cerebellar granule cells in vivo. J Neurosci. 2006;26:11786–11797. doi: 10.1523/JNEUROSCI.2939-06.2006. [DOI] [PMC free article] [PubMed] [Google Scholar]
- Kim J, Alger BE. Random response fluctuations lead to spurious paired-pulse facilitation. J Neurosci. 2001;21:9608–9618. doi: 10.1523/JNEUROSCI.21-24-09608.2001. [DOI] [PMC free article] [PubMed] [Google Scholar]
- Larkman A, Stratford K, Jack J. Quantal analysis of excitatory synaptic action and depression in hippocampal slices. Nature. 1991;350:344–347. doi: 10.1038/350344a0. [DOI] [PubMed] [Google Scholar]
- Lev-Ram V, Wong ST, Storm DR, Tsien RY. A new form of cerebellar long-term potentiation is postsynaptic and depends on nitric oxide but not cAMP. Proc Natl Acad Sci USA. 2002;99:8389–8393. doi: 10.1073/pnas.122206399. [DOI] [PMC free article] [PubMed] [Google Scholar]
- Markram H, Lübke J, Frotscher M, Roth A, Sakmann B. Physiology and anatomy of synaptic connections between thick tufted pyramidal neurones in the developing rat neocortex. J Physiol. 1997;500:409–440. doi: 10.1113/jphysiol.1997.sp022031. [DOI] [PMC free article] [PubMed] [Google Scholar]
- Matsukawa H, Wolf AM, Matsushita S, Joho RH, Knöpfel T. Motor dysfunction and altered synaptic transmission at the parallel fiber-Purkinje cell synapse in mice lacking potassium channels Kv3.1 and Kv3.3. J Neurosci. 2003;23:7677–7684. doi: 10.1523/JNEUROSCI.23-20-07677.2003. [DOI] [PMC free article] [PubMed] [Google Scholar]
- Mintz IM, Sabatini BL, Regehr WG. Calcium control of transmitter release at a cerebellar synapse. Neuron. 1995;15:675–688. doi: 10.1016/0896-6273(95)90155-8. [DOI] [PubMed] [Google Scholar]
- Neher E. A comparison between exocytic control mechanisms in adrenal chromaffin cells and a glutamatergic synapse. Pflugers Arch. 2006;453:261–268. doi: 10.1007/s00424-006-0143-9. [DOI] [PubMed] [Google Scholar]
- Oleskevich S, Clements J, Walmsley B. Release probability modulates short-term plasticity at a rat giant terminal. J Physiol. 2000;524:513–523. doi: 10.1111/j.1469-7793.2000.00513.x. [DOI] [PMC free article] [PubMed] [Google Scholar]
- Perkel DJ, Hestrin S, Sah P, Nicoll RA. Excitatory synaptic currents in Purkinje cells. Proc Biol Sci. 1990;241:116–121. doi: 10.1098/rspb.1990.0074. [DOI] [PubMed] [Google Scholar]
- Pyle JL, Kavalali ET, Piedras-Rentería ES, Tsien RW. Rapid reuse of readily releasable pool vesicles at hippocampal synapses. Neuron. 2000;28:221–231. doi: 10.1016/s0896-6273(00)00098-2. [DOI] [PubMed] [Google Scholar]
- Rancz EA, Ishikawa T, Duguid I, Chadderton P, Mahon S, Häusser M. High-fidelity transmission of sensory information by single cerebellar mossy fibre boutons. Nature. 2007;450:1245–1248. doi: 10.1038/nature05995. [DOI] [PMC free article] [PubMed] [Google Scholar]
- Reid CA, Clements JD. Postsynaptic expression of long-term potentiation in the rat dentate gyrus demonstrated by variance–mean analysis. J Physiol. 1999;518:121–130. doi: 10.1111/j.1469-7793.1999.0121r.x. [DOI] [PMC free article] [PubMed] [Google Scholar]
- Roth A, Häusser M. Compartmental models of rat cerebellar Purkinje cells based on simultaneous somatic and dendritic patch-clamp recordings. J Physiol. 2001;535:445–472. doi: 10.1111/j.1469-7793.2001.00445.x. [DOI] [PMC free article] [PubMed] [Google Scholar]
- Sakaba T, Neher E. Quantitative relationship between transmitter release and calcium current at the calyx of held synapse. J Neurosci. 2001;21:462–476. doi: 10.1523/JNEUROSCI.21-02-00462.2001. [DOI] [PMC free article] [PubMed] [Google Scholar]
- Salin PA, Malenka RC, Nicoll RA. Cyclic AMP mediates a presynaptic form of LTP at cerebellar parallel fiber synapses. Neuron. 1996;16:797–803. doi: 10.1016/s0896-6273(00)80099-9. [DOI] [PubMed] [Google Scholar]
- Saviane C, Silver RA. Fast vesicle reloading and a large pool sustain high bandwidth transmission at a central synapse. Nature. 2006;439:983–987. doi: 10.1038/nature04509. [DOI] [PubMed] [Google Scholar]
- Saviane C, Silver RA. Estimation of quantal parameters with multiple-probability fluctuation analysis. Methods Mol Biol. 2007;403:303–317. doi: 10.1007/978-1-59745-529-9_19. [DOI] [PMC free article] [PubMed] [Google Scholar]
- Schneggenburger R, Meyer AC, Neher E. Released fraction and total size of a pool of immediately available transmitter quanta at a calyx synapse. Neuron. 1999;23:399–409. doi: 10.1016/s0896-6273(00)80789-8. [DOI] [PubMed] [Google Scholar]
- Schneggenburger R, Sakaba T, Neher E. Vesicle pools and short-term synaptic depression: lessons from a large synapse. Trends Neurosci. 2002;25:206–212. doi: 10.1016/s0166-2236(02)02139-2. [DOI] [PubMed] [Google Scholar]
- Silver IA, Erecińska M. Intracellular and extracellular changes of [Ca2+] in hypoxia and ischemia in rat brain in vivo. J Gen Physiol. 1990;95:837–866. doi: 10.1085/jgp.95.5.837. [DOI] [PMC free article] [PubMed] [Google Scholar]
- Silver RA. Estimation of nonuniform quantal parameters with multiple-probability fluctuation analysis: theory, application and limitations. J Neurosci Methods. 2003;130:127–141. doi: 10.1016/j.jneumeth.2003.09.030. [DOI] [PubMed] [Google Scholar]
- Silver RA, Cull-Candy SG, Takahashi T. Non-NMDA glutamate receptor occupancy and open probability at a rat cerebellar synapse with single and multiple release sites. J Physiol. 1996;494:231–250. doi: 10.1113/jphysiol.1996.sp021487. [DOI] [PMC free article] [PubMed] [Google Scholar]
- Silver RA, Momiyama A, Cull-Candy SG. Locus of frequency-dependent depression identified with multiple-probability fluctuation analysis at rat climbing fibre-Purkinje cell synapses. J Physiol. 1998;510:881–902. doi: 10.1111/j.1469-7793.1998.881bj.x. [DOI] [PMC free article] [PubMed] [Google Scholar]
- Silver RA, Lubke J, Sakmann B, Feldmeyer D. High-probability uniquantal transmission at excitatory synapses in barrel cortex. Science. 2003;302:1981–1984. doi: 10.1126/science.1087160. [DOI] [PubMed] [Google Scholar]
- Sims RE, Hartell NA. Differences in transmission properties and susceptibility to long-term depression reveal functional specialization of ascending axon and parallel fiber synapses to Purkinje cells. J Neurosci. 2005;25:3246–3257. doi: 10.1523/JNEUROSCI.0073-05.2005. [DOI] [PMC free article] [PubMed] [Google Scholar]
- Sims RE, Hartell NA. Differential susceptibility to synaptic plasticity reveals a functional specialization of ascending axon and parallel fiber synapses to cerebellar Purkinje cells. J Neurosci. 2006;26:5153–5159. doi: 10.1523/JNEUROSCI.4121-05.2006. [DOI] [PMC free article] [PubMed] [Google Scholar]
- Xu-Friedman MA, Harris KM, Regehr WG. Three-dimensional comparison of ultrastructural characteristics at depressing and facilitating synapses onto cerebellar Purkinje cells. J Neurosci. 2001;21:6666–6672. doi: 10.1523/JNEUROSCI.21-17-06666.2001. [DOI] [PMC free article] [PubMed] [Google Scholar]