

Abstract
Inhibitory synapses display a great diversity through varying combinations of presynaptic GABA and glycine release and postsynaptic expression of GABA and glycine receptor subtypes. We hypothesized that increased flexibility offered by this dual transmitter system might serve to tune the inhibitory phenotype to the properties of afferent excitatory synaptic inputs in individual cells. Vestibulocerebellar unipolar brush cells (UBC) receive a single glutamatergic synapse from a mossy fiber (MF), which makes them an ideal model to study excitatory–inhibitory interactions. We examined the functional phenotypes of mixed inhibitory synapses formed by Golgi interneurons onto UBCs in rat slices. We show that glycinergic IPSCs are present in all cells. An additional GABAergic component of large amplitude is only detected in a subpopulation of UBCs. This GABAergic phenotype is strictly anti-correlated with the expression of type II, but not type I, metabotropic glutamate receptors (mGluRs) at the MF synapse. Immunohistochemical stainings and agonist applications show that global UBC expression of glycine and GABAA receptors matches the pharmacological profile of IPSCs. Paired recordings of Golgi cells and UBCs confirm the postsynaptic origin of the inhibitory phenotype, including the slow kinetics of glycinergic components. These results strongly suggest the presence of a functional coregulation of excitatory and inhibitory phenotypes at the single-cell level. We propose that slow glycinergic IPSCs may provide an inhibitory tone, setting the gain of the MF to UBC relay, whereas large and fast GABAergic IPSCs may in addition control spike timing in mGluRII-negative UBCs.
Introduction
In vertebrates, fast synaptic inhibition is mediated by two neurotransmitters, GABA and glycine. The majority of inhibitory cells of the hindbrain express both neurotransmitters (Ottersen et al., 1988; Todd and Sullivan, 1990), which are accumulated in synaptic vesicles by the same transporter, VIAAT (vesicular inhibitory amino acid transporter) (McIntire et al., 1997; Sagné et al., 1997), and coreleased (Jonas et al., 1998; O'Brien and Berger, 1999). Mixed circuits undergo complex developmental maturation, whereby GABAergic inhibition dominates in young synapses whereas glycinergic inhibition appears later (Smith et al., 2000; Keller et al., 2001; Awatramani et al., 2005). This switch may be caused by either a presynaptic (Nabekura et al., 2004) or a postsynaptic (Keller et al., 2001; González-Forero and Alvarez, 2005) change. Although maturation of both sides occurs (Awatramani et al., 2005; Muller et al., 2006), eventually creating mismatches (Dugué et al., 2005), corelease persists in the adult. Overall, the parameters controlling the exact balance between glycine and GABA inhibition in mixed inhibitory systems remain unclear.
Inhibitory synapses control neuronal integration. The properties of excitatory and inhibitory synapses are, therefore, likely to be regulated in coordination. Quantitative modulation has been demonstrated (Turrigiano and Nelson, 2004; Gonzalez-Forero et al., 2005), but a qualitative regulation of IPSC properties is not established. The phenotypical diversity of mixed inhibition may offer a substrate for this tuning. GABAA (GABAARs) and glycine (GlyRs) receptors have nearly identical permeability sequences (Bormann et al., 1987). Nevertheless, in the same cell, GABAergic and glycinergic synaptic events always display different decay kinetics (Jonas et al., 1998; Dumoulin et al., 2001; Seal and Edwards, 2006), likely affecting neuronal responses (Russier et al., 2002). GABAARs and GlyRs are also differentially modulated by Zn2+ (Suwa et al., 2001) and intracellular calcium (Diana and Bregestovski, 2005). Finally, GABA activates metabotropic GABAB receptors, whereas glycine is an NMDA receptor coagonist (Ahmadi et al., 2003). However, the demonstration of a coregulation of the phenotypes of mixed inhibitory and excitatory synapses is still lacking.
Unipolar brush cells (UBCs) are small glutamatergic interneurons preferentially located in the vestibulocerebellum (Mugnaini et al., 1997). UBCs display a characteristic morphology with a short dendrite receiving a single excitatory synapse and several inhibitory boutons from Golgi cells (GoCs) (Mugnaini et al., 1997). These properties make UBCs a unique model to study the interaction between excitation and mixed inhibition. UBCs are classified into distinct groups based on the expression of specific markers, such as group I and II metabotropic glutamate receptors (mGluRs) and the calcium buffering protein calretinin (Jaarsma et al., 1998; Nunzi et al., 2002). Here, we examine GABA–glycinergic cotransmission at GoCs–UBCs synapses. We have shown previously that vestibulocerebellar UBCs express GABAARs and GlyRs to different levels (Dugué et al., 2005). In addition, GoCs contain GABA, glycine, or both neurotransmitters (Ottersen et al., 1988; Simat et al., 2007). Hence, both presynaptic and postsynaptic partners can affect the properties of inhibition at GoCs to UBCs synapses. Here we show that the inhibitory phenotype of UBCs is determined postsynaptically and is strictly correlated to the functional phenotype of their excitatory synapse.
Materials and Methods
Preparation of cerebellar slices
Slices (270–300 μm) were prepared from the cerebellum of male Wistar rats, aged 17–21 d. After deep anesthesia, the cerebellum was quickly removed and rapidly dissected in an ice-cold bicarbonate-buffered saline (BBS) containing the following (in mm): 125 NaCl, 2.5 KCl, 1.25 NaH2PO4, 25 NaHCO3, 20 glucose, 2 CaCl2, and 1 MgCl2 (bubbled with 95% O2, 5% CO2). Parasagittal slices of the cerebellar vermis were obtained using a vibrating blade microtome (HM 650V; Microm) in an ice-cold solution containing the following (in mm): 130 K-gluconate, 15 KCl, 2 EGTA, 20 HEPES, 25 glucose, 0.05 d-(−)-2-amino-5-phosphonovaleric acid (d-APV), and minocycline (5 × 10⁻⁸) (Dugué et al., 2009). Slices were then transiently immersed in a modified BBS containing the following (in mm): 225 d-mannitol, 2.5 KCl, 1.25 NaH2PO4, 25 NaHCO3, 25 glucose, 0.8 CaCl2, and 8 MgCl2 (25°C, bubbled with 95% O2, 5% CO2) and finally transferred to warm BBS (34°C) supplemented with minocycline (50 nm), in which they were stored for up to 6 h. For electrophysiological recordings, slices were moved to a recording chamber mounted on an upright microscope (Axioscope; Carl Zeiss) and continuously perfused with bubbled BBS (2–3 ml/min; 33–35°C) with minocycline throughout the experiment.
Electrophysiological recordings
Voltage-clamp recordings of UBCs.
Slices were visualized using oblique light contrast with deep red light (750 ± 25 nm). Neurons were recorded exclusively in the ventral part of the cerebellar lobule X. Patch pipettes (3–4 MΩ) were pulled from borosilicate glass capillaries (Hilgenberg) with a vertical puller. For UBC recordings, pipettes were filled with an intracellular solution containing the following (in mm): 142.5 KCl, 10 HEPES, 4.6 MgCl2, 0.05 EGTA, 4 ATP-Na2, 0.4 GTP-Na, and 10 phosphocreatine-K2, pH 7.3. Alexa Fluor-488 (20 μm; Invitrogen) was routinely added to allow online visualization of cell morphology in fluorescence. During whole-cell recordings, the holding potential of voltage-clamped UBCs was −70 mV unless otherwise stated. Junction potential was not corrected.
All recordings were performed using an EPC10 double amplifier (HEKA), controlled by a personal computer running the Patchmaster software (HEKA). Signals were typically filtered at 3–5 kHz and sampled at 10 kHz.
GoC–UBC paired recordings.
In the experiments of Figure 7, postsynaptic UBCs were voltage clamped while presynaptic spiking activity of GoCs was recorded in the loose cell-attached (LCA) configuration. Loose seal resistances ranged from 10 to 100 MΩ, using patch electrodes (5–10 MΩ) filled with HBSS containing the following (in mm): 141 NaCl, 2.5 KCl, 1.25 NaH2PO4, 10 HEPES, 2 CaCl2, and 1 MgCl2, pH 7.4. GoCs were identified by the size of their somata and by the excitatory effect of kainate. In a subset of experiments, after the end of the LCA recording period, GoCs were repatched with a new pipette containing Alexa Fluor-488 to confirm morphologically the nature of the neuron in the whole-cell configuration. During LCA recordings, undesired electrical access to the interior of the cell could be identified by abrupt changes in spike waveforms, characterized by the appearance of a late positive component (peak at 10–15 ms) reflecting spike AHP, which was generally accompanied by a change in firing frequency. The peak of this late positive wave was quantified, and the analysis was stopped when the first value above 2 SD was reached. GoC–UBC pairs were considered connected when a short-latency (1.2 ± 0.19 ms, n = 8) IPSC (Dugué et al., 2005) with an amplitude more than four times the SD of baseline noise was apparent in the spike-triggered average.
Figure 7.

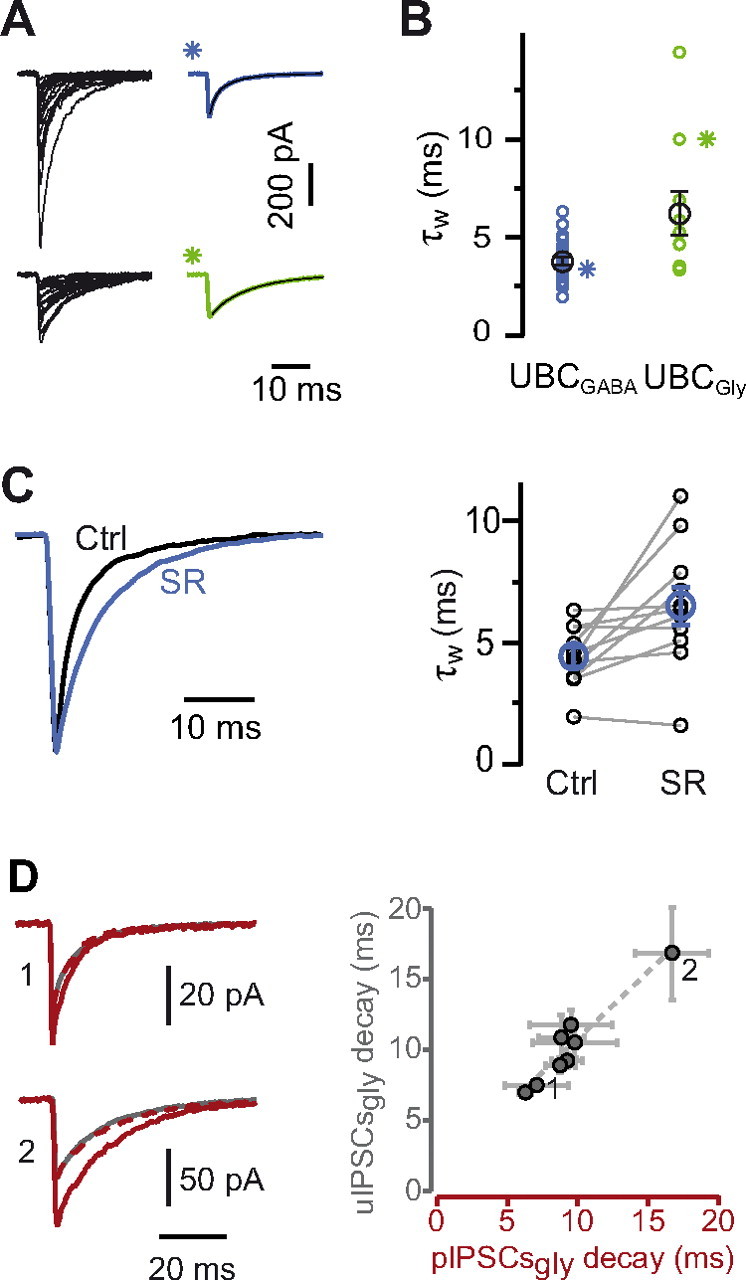
The properties of inhibitory synapses are homogeneous in individual UBCs. A, Schematic illustration of the experimental conditions. Paired recordings were performed between a presynaptic GoC, recorded in LCA and a patch-clamped postsynaptic UBC. Kainate was present in the bath. B, Excerpt from a paired recording between a GoC (top trace) and a UBC (bottom trace). The pIPSCs originating from the recorded presynaptic GoC are highlighted in red in the UBC trace. C, Averages of presynaptic spikes (top trace) and postsynaptic pIPSCs from one recording. Notice the homogeneity of pIPSC latencies in the inset. D, Effect of bath application of SR95531 (SR) and strychnine (Stry) on the normalized cumulative activity of pIPSCs (red) and uIPSCs (gray) in one experiment. E, The pharmacological profile of pIPSCs is plotted versus that of uIPSCs in eight UBCs. The gray square refers to the experiment illustrated in B–D. GCL, Granule cell layer.
Perforated patch and GoCs stimulations.
Perforated patch-clamp experiments were performed by adding gramicidin (267 μg/ml) to the KCl-based intracellular solution described previously. The tip of the pipette was filled with a gramicidin-free solution before backfilling the pipette with the gramicidin-containing solution. A small calibrated positive pressure was applied when approaching targeted UBCs. Electrical access was monitored by applying small voltage pulses. Perforation appeared after ∼10–20 min, and recordings were started when the access resistance was <100 MΩ (77 ± 24 MΩ) and remained stable. The gramicidin patch solution was supplemented with Alexa Fluor-488, and the fluorescence signal was regularly monitored. In cases when the seal ruptured, Alexa Fluor-488 rapidly filled the recorded UBCs and cells were discarded. After all recordings, the nature of the cell was confirmed by breaking into the cell and examining the morphology. Access resistance was compensated (80%). The membrane holding potential was corrected offline for the remaining access resistance.
Measurements of kinetics with low chloride concentrations.
To measure accurately the amplitude and kinetics of synaptic currents, UBCs were voltage clamped at −50 mV, presynaptic GoC axons were stimulated with extracellular electrodes, and averages were obtained from >100 stimulations (see Fig. 9). The pipette was filled with an intracellular solution containing the following (in mm): 135 KMeSO4, 3 NaCl, 1 MgCl2, 0.1 EGTA, 10 phosphocreatine-K2, 10 HEPES, 4 ATP-Mg, and 0.4 GTP-Na2.
Figure 9.
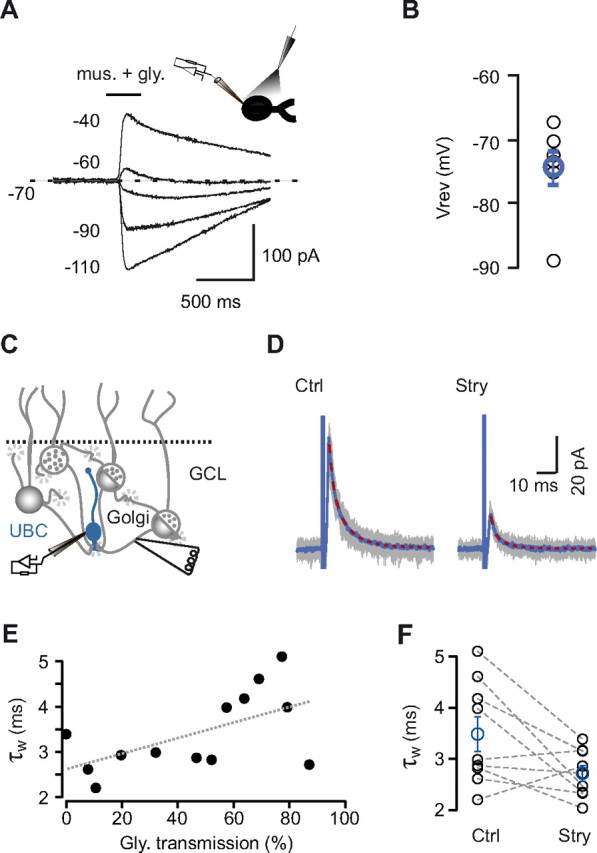
Mixed inhibitory KAIPSCs decay kinetics in low intracellular chloride concentration. A, UBC responses to pressure application (see inset) of both muscimol (mus.) and glycine during voltage command steps. In these experiments, UBCs were recorded in the gramicidin-based perforated patch configuration. B, Reversal potentials of GABA and glycine conductances obtained in seven UBCs (blue, average). C, Schematic representation of the experimental configuration: UBCs were recorded with a low intracellular chloride concentration, whereas afferent GoCs were extracellularly stimulated. D, Superposition of 100 individual events (gray traces) recorded before (Ctrl) and after (Stry) bath application of strychnine. Averaged sweeps are depicted in blue, and the superimposed red dotted lines represent the exponential fit of the averages. E, The percentage of glycinergic transmission and the decay kinetics of eIPSCs are positively correlated. F, In mixed UBCs, bath application of strychnine decreased the decay time constant of eIPSCs. Blue circles are averages from all experiments. Bars represent SE.
Pharmacological treatments
Drugs were bath applied, unless specified otherwise. Full drug effects were usually obtained within 2–3 min after application. Kainate (300 nm) was routinely added to the bath solution to increase the frequency of spontaneous IPSCs because of its selective activation of GoCs (Dugué et al., 2009). The GABAergic and glycinergic components of IPSCs were blocked using either SR95531 [6-imino-3-(4-methoxyphenyl)-1(6H)-pyridazinebutanoic acid hydrobromide; 5 μm] or strychnine (500 nm), respectively. The functional expression of mGluRII in UBCs was examined by bath applying the specific agonist DCG-IV [(2S,2′R,3′R)-2-(2′,3′-dicarboxycyclopropyl)glycine; 1 μm] and antagonist LY341495 [(2S)-2-amino-2-[(1S,2S)-2-carboxycycloprop-1-yl]-3-(xan th-9-yl) propanoic acid; 500 nm]. mGluRII activates GIRK inwardly rectifying potassium channels in UBCs (Knoflach and Kemp, 1998; Russo et al., 2008). In our experiments, GIRK currents were identified by subtracting I–V curves (between −140 and −50 mV with 10 mV step increases) recorded in the presence of DCG-IV from control curves obtained in the presence of the antagonist LY341495. In mGluRII-expressing UBCs, subtracted currents displayed an inward rectification and a reversal potential similar to that predicted for potassium ions.
Local drug applications
In the experiments of Figure 4, the GABAergic and glycinergic agonists muscimol and glycine, respectively, were pressure applied to cells via pulled glass capillaries. Application pipettes were positioned close to recorded UBCs, and pressure was applied using a Picospritzer II (General Valve Corporation). Saturating concentrations of glycine (1 mm) and muscimol (20 μm) were applied to allow full activation of receptors. Currents of several nanoamperes, which could not be clamped, were generally obtained. The currents were therefore reduced by including in the bath and application pipette solutions either strychnine (1 μm) or SR95531 (2 μm) for glycine and muscimol application experiments, respectively.
Figure 4.

Pressure-applied agonists reveal a correlation between the GABAergic synaptic component and the total amount of GABAARs expressed at the membrane of UBCs. A, B, Currents induced by pressure-applied glycine in a glycinergic (A) and GABAergic (B) UBC. Notice that, in these experiments, both glycine and the glycinergic receptor antagonist strychnine were applied. Strychnine (Stry) was also constantly present in the bath solution, together with the GABAAR blocker SR95531 (SR). Agonist and antagonist coapplication aimed at decreasing the amplitudes of the responses, thus reducing voltage-clamp errors deriving from the large currents induced without blocker. In both A and B, the first two traces on the top show excerpts of recordings of spontaneous inhibitory activity in control conditions (top) and after application of SR95531 (middle). The lowest traces show the currents induced by pressure application of glycine. C, D, The amplitude of the response to glycine is plotted as a function of the relative glycinergic contribution to inhibitory synaptic transmission (C) and to the averaged amplitude of glycinergic KAIPSCs (D). Notice the lack of correlation between the glycine-induced currents and the glycinergic component of inhibition. E, F, Responses to pressure-applied muscimol (Mus) in a GABAergic (E) and a glycinergic (F) UBC. Notice that, similarly to the experiments depicted in A and B, both the GABAAR agonist muscimol and the blocker SR95531 were pressure applied to reduce current amplitudes and voltage-clamp errors. SR95531 was applied in the bath solution with strychnine. In both E and F, the top two traces illustrate extracts of recordings of spontaneous inhibitory activity in control conditions (top) and after application of strychnine (middle). G, H, Plot of the amplitude of the responses to locally applied muscimol as a function of the GABAergic contribution to inhibitory transmission (G) and of the average amplitude of GABAergic KAIPSCs (H). In both plots, the correlation is highly significant. Ctrl, Control.
Electrophysiological data analysis
Data were analyzed with IGOR Pro (Wavemetrics). Spontaneous activity was studied using SpAcAn, a custom-made threshold-detection algorithm (Dugué et al., 2005) (available at http://www.spacan.net/). The ratio of the two components of inhibition (GABA vs glycine) was determined as the ratio between the cumulative activity (the product of the frequency by the amplitude) after a blocker versus the activity after reaching the steady effect of kainate application. Two minutes after drug application, the cumulative activity was measured on 2 s bins over a period of 2 min. Recordings were considered steady if the regression of cumulative activity as a function of time did not yield a significant slope. Otherwise, cells were not retained for additional analysis.
For paired recordings, all IPSCs were detected simultaneously using the SpAcAn software. Paired IPSCs were then separated based on their fixed latency to the extracellular spikes recorded in the GoC. Thus, the detection threshold sensitivity was the same for paired (pIPSCs) and unpaired (uIPSCs) IPSCs, thereby avoiding detection artifacts.
The kinetics of synaptic events were measured as the weighted sum (τw) of two exponential components fitted to the decay of the average. Only events that were temporally isolated by more than three times the slow decay time constant were selected for decay time course analysis. For paired recordings, the bootstrap statistical method was used to determine the variability of kinetics inside the population of events of single cells. Briefly, selected events were resampled randomly with replacement. The new event sample was then averaged, and the average event was fitted. This operation was performed >1000 times, and the statistics of this population provided the SD of the kinetics of the original average event.
Combined electrophysiological recordings and immunohistochemistry
UBCs were filled through the patch pipette with Neurobiotin (4 mg/ml; Vector Laboratories) (Dugué et al., 2005). After recordings, slices were fixed overnight in 4% paraformaldehyde and processed for immunochemistry as described previously (Dumoulin et al., 2001). Neurobiotin was revealed with FITC-coupled streptavidin and rabbit anti-mGluR1α subunit (1:200; Millipore Bioscience Research Reagents) was used before incubating with Cy3-coupled secondary antibodies (Jackson ImmunoResearch) to visualize mGluRI-positive UBCs.
Immunohistochemistry
Tissue fixation.
All experiments were performed following protocols approved by the Northwestern University Animal Care and Use Committee, by the National Institutes of Health, and the Society for Neuroscience. Briefly, two male Wistar rats (aged 17–21 d) were deeply anesthetized with intraperitoneal injections of sodium pentobarbital (60 mg/kg body weight) and perfused through the ascending aorta with PBS, followed by 50 ml of 4% freshly depolymerized paraformaldehyde in 0.1 m PBS, pH 7.4, at 4°C. Brains were then dissected and postfixed in 4% paraformaldehyde overnight at 4°C, before embedding in paraffin.
Tissue preparation and labeling.
Sagittal and coronal sections were cut on a microtome at a thickness of 7 μm and mounted on positively charged glass slides. After removing paraffin with xylene and rehydration in a graded series of ethanol (100, 95, 75, 50%), sections were processed in a decloaking chamber (Biocare Medical) using a citrate-buffer-based antigen retrieval medium (Biocare Medical) for 20 min at 110–115°C. They were then processed in PBS with 15% methanol and 0.3% H2O2 to block the endogenous peroxidase activity. Aldehyde groups were removed by incubating the sections in sodium borohydride (1%) in PBS. After these treatments, the slices were incubated in a blocking PBS-based solution containing cold-water fish-skin gelatin (0.1%) and 0.1% Triton X-100. Tissue was then incubated overnight at 4°C with the following primary antibodies: rabbit anti-mGluRII (1:400; from Dr. R. Shigemoto, Division of Cerebral Structure, National Institute for Physiological Sciences, Okazaki, Japan), mouse anti-GlyR (1:1000; Synaptic Systems), and guinea pig anti-VIAAT (1:1500; Synaptic Systems). Primary antibodies were revealed by incubation for 2 h with secondary antibodies coupled to either Alexa Fluor-488 (Invitrogen) or DyLight 488, DyLight 549, and DyLight 649 (Jackson ImmunoResearch). Sections were mounted using Prolong Gold Antifade Reagent (Invitrogen). For all experiments, control sections were incubated without primary antibodies.
Image acquisition and analysis.
Image stacks were acquired using a confocal microscope (Leica SP2) with a 63× oil-immersion objective. Glomeruli were selected in image stacks as regions of interest (ROIs), and the integral of mGluRII and VIAAT fluorescence labeling was measured within these ROIs. Background staining was measured over nonlabeled areas and subtracted. The mGluRII/VIAAT ratio was computed for GlyR-positive glomeruli, containing a UBC brush (Dugué et al., 2005) and control, GlyR-negative, glomeruli.
For image deconvolution, point-spread functions (PSFs) for multiple wavelengths were measured on subresolution (175 nm) beads (PS-Speck; Invitrogen), embedded in 7.5% gelatin, and mounted in Prolong Gold. Bead images were then extracted from image stacks using a custom routine in ImageJ (Wayne Rasband, National Institutes of Health, Bethesda, MD) and averaged. Image stacks of the selected glomeruli were then deconvolved using the Iterative Deconvolve 3D ImageJ plugin (R. Dougherty, http://www.optinav.com/imagej.html), and particles were subsequently analyzed using a custom version of the threshold-based Object Counter 3D ImageJ plugin (F. Cordelières, J. Jackson, http://rsbweb.nih.gov/ij/plugins/track/objects.html). Results were then further processed using GNU R (R Development Core Team, 2011; http://www.r-project.org/) and custom routines. Briefly, distances were calculated between each particle and its nearest and most distant neighbors in the glomerulus. These distances were averaged and used as an indication of particle density and glomerulus size, respectively. Total fluorescence was calculated as the integral of fluorescence of all the selected particles (i.e., the sum of all the voxels).
Statistical analysis
Statistical analysis was performed using GNU R. Results are represented as mean ± SD unless otherwise specified. Statistical tests were performed using unpaired or paired Wilcoxon's tests whenever applicable, as well as linear regression. For immunostaining analysis, two-way ANOVA was used after ensuring the normality of the data with a Shapiro–Wilk test. For all tests, significance was assumed if p < 0.05.
Drugs
Stocks of APV, kainate, SR95531, DCG-IV, muscimol, TTX (Tocris Cookson and Ascent Scientific), strychnine, glycine, and minocycline (Sigma) were prepared in water and stored at − 20°C. LY341495 (Tocris Cookson) was prepared in DMSO and stored at −20°C.
Gramicidin (Sigma) was dissolved in DMSO at the beginning of each experimental day and stored in the dark until use. A new gramicidin-containing intracellular solution (267 μg/ml) was prepared by adding the required amount of gramicidin stock solution to the KCl-based intracellular solution before each recording.
Results
Kainate excitation of GoCs increases the IPSC frequency in UBCs
IPSCs originating from presynaptic GoCs were recorded in UBCs of vermal lobule X held at −70 mV and filled with a high-chloride internal solution (Fig. 1A). We have shown previously that the level of spontaneous GoC activity in slices is low (Dugué et al., 2009). sIPSCs recorded in UBCs, which were mostly TTX-dependent (data not shown), occurred at a frequency of 2.5 ± 3.1 Hz (range, 0–14.1 Hz; n = 36 cells). To obtain a better sampling of the IPSCs, GoCs were selectively depolarized by bath application of 300 nm kainate, which increases their firing rate (Fig. 1B) (Dugué et al., 2009). Kainate significantly increased both the average IPSC (KAIPSC) frequency to 30.6 ± 16.8 Hz (range, 4.3–68.7; n = 36; p < 0.001; Fig. 1C) and amplitude from 61.8 ± 48.4 pA (range, 20.5–219; n = 31; Fig. 1C) to 100.3 ± 47.8 pA (range, 26.2–214.2; n = 31; p = 0.002). Overall, the average cumulative activity (the product of the mean amplitude and the mean frequency of IPSCs) was increased from 184 ± 370 pA/s (range, 0–2095; n = 36) to 2925 ± 2090 pA/s (range, 105–7610; n = 36; p < 0.001). The experiments described in the following were all performed in the presence of 300 nm kainate in the perfusion medium, unless otherwise stated.
Figure 1.
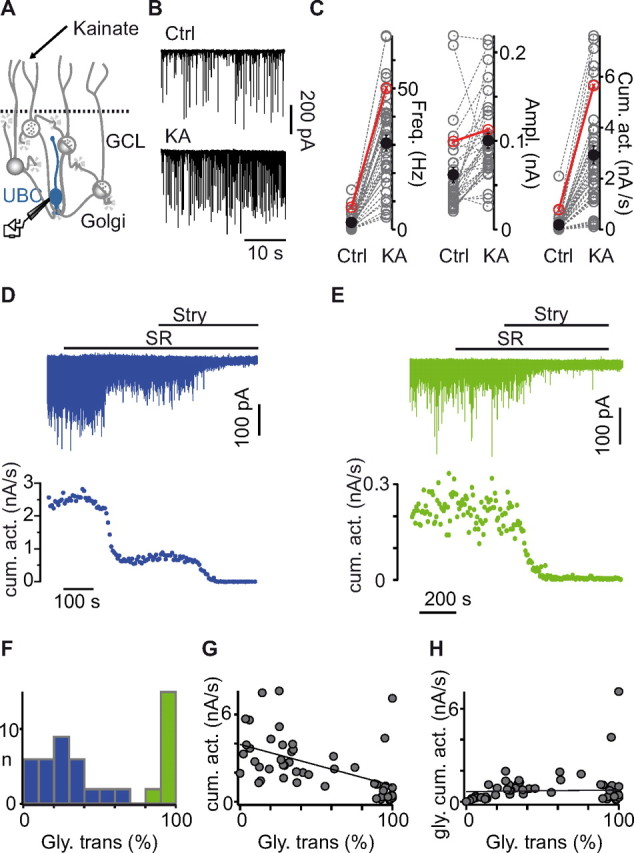
Analysis of the GABA/glycinergic profile of afferent inhibition in UBCs. A, Schematic illustration of the synaptic circuit formed by GoCs, granule cells, and UBCs in the cerebellar granule cell layer (GCL). Kainate (KA) specifically depolarizes GoCs. Ctrl, Control. B, IPSCs recorded in a UBC before (sIPSCs; top trace) and after (KAIPSCs; bottom trace) bath application of kainate. C, Kainate increases the frequency, the averaged amplitude, and the cumulative activity of sIPSCs in UBCs (black circles, mean ± SE; red circles, cell shown in B). D, E, Extracts of recordings (top traces) and KAIPSC cumulative amplitudes in time (bottom graph) showing the effect of the application of SR95531 (SR) and strychnine (Stry) on inhibitory activity in a UBC receiving mixed inhibition (D) and in a UBC receiving purely glycinergic inhibition (E). F, Number of recorded UBCs as a function of the glycinergic component of the cumulative amplitude. Blue, Cells with dominant GABAergic/mixed inhibition. Green, Cells with prevalent glycinergic inhibition. G, The cumulative amplitude of KAIPSCs and the percentage of glycinergic transmission are significantly correlated. H, No correlation was observed between the percentage of glycinergic transmission and the cumulative activity of the pharmacologically isolated glycinergic component.
UBCs receive different proportions of GABAergic and glycinergic inhibition from GoCs
To quantify the relative contribution of GABAergic and glycinergic transmission to the inhibition of UBCs, the GABAAR and GlyR antagonists SR95531 (5 μm) and strychnine (500 nm) were sequentially bath applied after the effect of kainate reached a steady state (Fig. 1D,E). Coapplication of both antagonists blocked all KAIPSCs. In rare cases (<2% of the cells), glutamatergic sEPSCs, showing the characteristic slow decay kinetics of EPSCs originating from afferent mossy fibers (MFs), were recorded (Rossi et al., 1995; Diana et al., 2007). These cells were discarded from this study.
On average, strychnine blocked 50.6 ± 36.1% of the cumulative KAIPSC activity, consistent with previous observations on sIPSCs (Dugué et al., 2005). The analysis of individual cells revealed that the pharmacological profile of KAIPSCs varied significantly among UBCs and displayed a bimodal distribution (Fig. 1F). In one group of cells, representing 34% of UBCs (n = 17 of 50 cells), KAIPSCs were almost exclusively glycinergic (strychnine block, 96.7 ± 3.7%; range, 89.5–100; Fig. 1E). The remaining UBCs (n = 33) displayed a substantial, albeit variable, GABAergic component. In this latter group, the glycinergic contribution accounted for only 26.8 ± 16.7% of the total transmission, ranging from 2.2% to a maximum of 61.9% (Fig. 1D). Hence, UBCs can be divided in two groups based on the presence of a GABAergic component of inhibition.
Strikingly, a strong negative correlation was observed between the cumulative activity of KAIPSCs and the proportion of glycinergic IPSCs in synaptic transmission (i.e., a positive correlation with GABA IPSCs), with a slope of 28.3 pA/s per percent (n = 48; p < 0.001; Fig. 1G). In contrast, the cumulative activity of isolated glycinergic IPSCs did not show a significant correlation with the pharmacological profile of the cell (n = 46; p = 0.61; Fig. 1H). These results suggest that mixed inhibition results primarily from the addition of a GABAergic component on top of an ubiquitous, although variable, glycinergic component.
Group I mGluR-positive UBCs do not correlate with the inhibitory phenotype
Each UBC receives a giant excitatory synapse from a single MF, at which various ionotropic and metabotropic glutamate receptors are expressed (Rossi et al., 1995; Jaarsma et al., 1998; Nunzi et al., 2001, 2002). UBCs can be grouped into distinct subfamilies by examining the molecular constitution of the MF synapse. We therefore investigated whether the properties of the glutamatergic MF synapse was correlated with the inhibitory phenotype of UBCs.
mGluRI-positive UBCs and UBCs expressing the calcium buffer protein calretinin form two complementary sets of neurons (Nunzi et al., 2002). mGluRI activation depolarizes UBCs by opening nonspecific cation channels (M.A.D., unpublished data). However, in our whole-cell recording conditions, the functional identification of mGluRI-expressing UBCs was found to be ambiguous because the current triggered by pharmacological activation of the receptors shows a fast rundown. We thus identified mGluRI-positive UBCs using immunohistochemical procedures (see Materials and Methods; Fig. 2). UBCs were voltage clamped with a solution containing Neurobiotin, and the profile of incoming inhibition was characterized pharmacologically. After slice fixation, the morphology of the recorded cell was recovered, and the tissue was processed for mGluRI immunoreactivity. We successfully performed the protocol in a total of 28 cells, 14 of which were found to express mGluRI. The glycinergic component of inhibition was similar in both mGluRI-positive (80.2 ± 26.7%) and mGluRI-negative (78.4 ± 28.8%) neurons, and cells receiving pure glycinergic or mixed IPSCs were found in the two immunohistochemical populations (Fig. 2C). There is thus no link between the presence of mGluRIs at the excitatory synapse and the inhibitory profile of UBCs.
Figure 2.

Relationship between mGluR1 expression and the pharmacological profile of inhibitory synaptic transmission. A, B, mGluR1 immunostaining (red) in an mGluR1-positive (A) and mGluR1-negative (B) UBC (arrowheads indicate the brush of the cell). UBCs were filled with biocytin during recording. C, Histogram of the relative percentage of glycinergic sIPSCs (assessed by the cumulative amplitude) as a function of inhibitory synaptic transmission in mGluR1-negative (gray) and mGluR1-positive (red) UBCs. Notice the overlap between the two graphs.
Group II mGluR-positive UBCs receive a predominantly glycinergic inhibition
mGluRII are also expressed heterogeneously in UBCs, and the family of mGluRII-positive UBCs straddles the groups of calretinin- and mGluRI-positive UBCs. mGluRII are positively coupled to inwardly rectifying potassium channels belonging to the GIRK family (Knoflach and Kemp, 1998; Russo et al., 2008). In our experiments, bath application of the mGluRII-specific agonist DCG-IV (1 μm) produced an outward current of variable amplitude in a subset of UBCs (Fig. 3A). This current was reversed by the specific antagonist LY341495 (250 nm). To identify unambiguously mGluRII-positive UBCs, voltage command steps were made to potentials between −140 and −50 mV (in 10 mV steps) during application of DCG-IV and after application of LY341495 (Fig. 3B), and mGluRII-evoked currents were obtained by subtraction (Fig. 3B). The amplitude distribution of GIRK currents, measured for each cell as the difference between currents obtained at −110 and −60 mV (Fig. 3H), was bimodal. We thus applied the k-means clustering algorithm to separate two clusters of cells. The two cell populations, defined by the algorithm-set threshold, are then referred to as mGluRII-positive and -negative UBCs. In mGluRII-positive cells (10 of 23; 43%), DCG-IV-generated currents showed the characteristic features of GIRK-type conductances, i.e., inward rectification, absence of inactivation, and hyperpolarized reversal potential (Fig. 3C,G). DCG-IV-induced outward currents averaged 64 ± 37 pA at −50 mV, whereas the average interpolated reversal potential was −87 ± 10 mV, thus close to the theoretical reversal potential of potassium (−100 mV). In the remaining mGluRII-negative UBCs, application of DCG-IV triggered no detectable current (−3 ± 19 pA at −50 mV; n = 13; Fig. 3E,G).
Figure 3.

Correlation between group II mGluR expression and prevailing glycinergic afferent inhibition in UBCs. A, At a holding potential of −70 mV, the mGluRII agonist DCG-IV activates an outward current in UBCs, which is blocked by the antagonist LY341495 (LY). B, Currents induced by DCG-IV (left) and after application of LY341495 (middle) during voltage command steps from −140 to −50 mV in a mGluRII-positive UBC. The difference (Diff) between the two sets of traces is shown on the right. Only four voltage steps are depicted for clarity. C, E, I–V curves in an mGluRII-positive (C) and mGluRII-negative (E) UBC. D, F, Synaptic profile of the UBCs shown in C and E, respectively. G, Averaged I–V curves of the mGluRII-activated currents for all mGluRII-negative (gray) and mGluRII-positive (red) UBCs. Notice the hyperpolarized reversal potential and the slightly inwardly rectifying behavior of the red trace, reminiscent of the properties of GIRK potassium conductances. H, Plot of the current amplitude in response to DCG-IV as a function of the profile of synaptic inhibition of UBCs. As above, mGluRII-negative UBCs are represented in gray, and mGluRII-positive neurons are in red. Notice the correlation of these two groups of cells with those defined by the phenotype of synaptic inhibition, depicted by bars on the x-axis following the color code used in Figure 1. The green bar identifies predominantly glycinergic cells. The blue bar highlights either mixed or mainly GABAergic neurons. SR, SR95531; Stry, strychnine.
In mGluRII-expressing UBCs, strychnine reduced the cumulative amplitude of KAIPSCs on average by 89.9 ± 20.2% (range, 33.8–99.9; n = 10). The block by strychnine was >90% in 8 of these 10 cells. In contrast, suppression by strychnine block was dramatically smaller in mGluRII-negative UBCs, amounting to only 18.4 ± 15.9% (range, 2.3–62.9; n = 13; p < 0.001; Fig. 3H). Hence, the inhibitory component of glutamatergic transmission mediated by mGluRII and the GABAergic component of inhibition are mutually exclusive in UBCs. To our knowledge, this is the first time that a link between the inhibitory and the glutamatergic phenotypes is established within an heterogeneous population of central neurons.
Postsynaptic expression of GABA receptors controls the phenotype of inhibitory transmission
A given mixed inhibitory phenotype may be obtained by selection of the presynaptic partners releasing the appropriate ratio of neurotransmitters or by regulated synaptic clustering of the postsynaptic receptors. In this latter case, surface expression of GABAARs and GlyRs in the entire UBC might be correlated with the synaptic profile of inhibition. To examine this hypothesis, we performed local applications of muscimol or glycine and compared the evoked currents with the inhibitory components of KAIPSCs.
The two inhibitory components of KAIPSCs were first pharmacologically isolated and quantified. Then, after bath application of TTX (200 nm) to block spontaneous synaptic activity, saturating concentrations of either the GABAergic agonist muscimol (20 μm) or glycine (1 mm) were pressure applied from a pipette placed close to the recorded cell in the presence of strychnine (500 nm) or SR95531 (5 μm) to block nonspecific activation of GlyRs or GABAARs, respectively. High concentrations of agonists are required to produce fast and reliable responses and to mitigate the impact of slow desensitization. In preliminary experiments, applications of each agonist evoked currents amounting to several nanoamperes, which could not be properly clamped. Local applications of muscimol and glycine were thus performed in the presence of the competitive antagonists SR95531 (2 μm; Fig. 4A,B) and strychnine (1 μm; Fig. 4E,F), respectively, in both the application pipette and the bath. In these conditions, currents evoked by muscimol and glycine had an amplitude of 215 ± 176 pA (range, 0–521; n = 12; Fig. 4G,H) and 1193 ± 555 pA (range, 411–1957; n = 8; Fig. 4C,D), respectively.
No correlation was found between agonist-evoked glycinergic currents and either the percentage (mean, 39 ± 30%; range, 5–97%; p = 0.94; n = 8) or the mean amplitude of the glycinergic component of KAIPSCs (mean, 45 ± 19 pA; range, 24–83 pA; p = 0.80; n = 8; Fig. 4C,D). In contrast, the responses to muscimol applications were correlated to both the percentage contribution of GABAergic transmission to the inhibitory phenotype (mean, 23 ± 24%; range, 0–63%; n = 12; p = 0.0016) and the mean amplitude of the GABAergic component of synaptic events (mean, 38 ± 30 pA; range, 11–116 pA; n = 12; p = 0.0037; Fig. 4G,H). We conclude that the level of expression of GABAARs by UBCs quantitatively determines the amount of GABAergic transmission at GoC synapses.
Immunohistochemical analysis of GlyR clustering on UBCs
The uptake of glycine by GlyT1 and GlyT2 transporters in the glomeruli is very effective (S.D., unpublished observation). Moreover, glycine binds to the receptors with high cooperativity (De Saint Jan et al., 2001). These two factors might be potential sources of variability in the amplitude of the currents evoked by local pressure application onto UBCs. To obtain an independent evaluation of the distribution of GlyRs in glomeruli formed by mGluRII-positive and -negative UBCs, we have investigated the spatial distribution of GlyRs using immunohistochemical labeling and confocal microscopy. In agreement with previous results (Dugué et al., 2005), GlyR clusters were present on all UBCs in the granular layer of vestibular lobules, whereas very little immunolabeling was detectable in the other cerebellar subdivisions (Fig. 5A,B).
Figure 5.
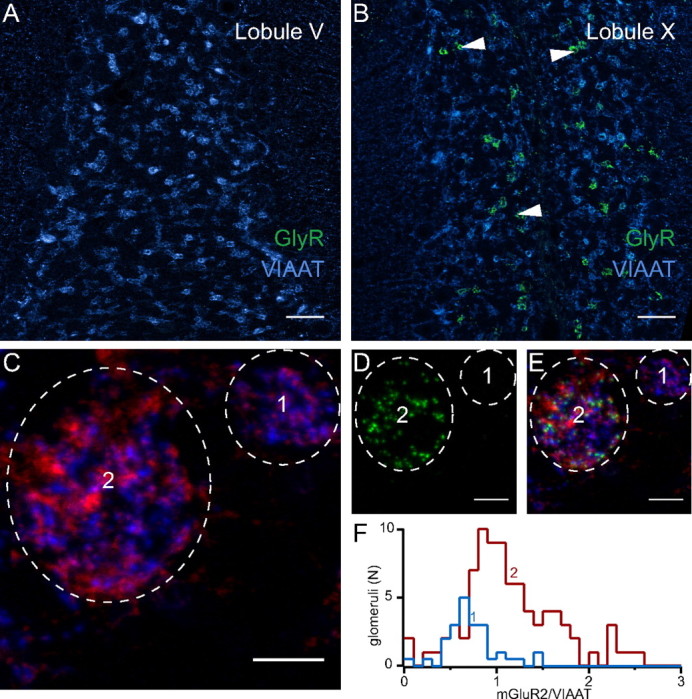
Immunohistochemical analysis of group II mGluR expression in UBCs. A, B, GlyR (green) and VIAAT (blue) immunolabeling in cerebellar lobules V (A) and X (B). Scale bar, 50 μm. Arrowheads in B indicate some UBC brushes. C–E, Images of two nearby glomeruli, one containing GlyRs, and thus the brush of a UBC (2), and the second showing no labeling for GlyRs, therefore not including UBCs (1). Scale bar, 5 μm. In C, the signals for both VIAAT (blue) and mGluRII (red) are shown. In D, only GlyRs are depicted (green). In E, the three channels are superimposed. F, Histogram representing the number of glomeruli not containing GlyRs (blue) as a function of the ratio between the fluorescence integrals of the mGluRII and VIAAT signals, scaled to the corresponding histogram for the glomeruli expressing GlyRs. Similar histogram for GlyR-containing glomeruli is shown in red. The partial overlap of the two graphs provides an estimation of the number of glomeruli formed by mGluRII-negative UBCs.
Both GoC axons and UBCs express mGluRII inside glomeruli (Jaarsma et al., 1998; Watanabe and Nakanishi, 2003; Simat et al., 2007). To estimate the contribution of UBCs, the signal from mGluRII was thus compared with the one originating from VIAAT, which reflects the quantity of GoC presynaptic terminals in glomeruli. In GlyR-negative glomeruli, thus containing only granule cells, the ratio of the signals from mGluRII and VIAAT showed a narrow distribution that was likely to represent the expression of mGluRII in GoCs axons (0.7 ± 0.3, n = 41; Fig. 5C–F). In contrast, the mGluRII/VIAAT ratio was larger and more broadly distributed in GlyR-positive glomeruli that contained UBCs (mean, 1.2 ± 0.5; range, 0.02–2.6; n = 85). Glomeruli with a ratio <1, similar to granule cell glomeruli, were thus assumed to contain mGluRII-negative UBCs. In contrast, glomeruli with ratios >1.5 (the highest ratio obtained in GlyR-negative glomeruli) were considered to be formed by mGluRII-positive UBCs (20 of 85; Fig. 5F).
Confocal image stacks were deconvolved using a measured PSF (see Materials and Methods) to better identify and separate GlyR clusters (Fig. 6A–D). The clusters were segmented using a threshold-based method, and their individual properties and relative distributions were analyzed. No difference could be observed between mGluRII-positive and -negative UBCs in either the glomerular volume (F(1,29) = 0.47; p = 0.56) or the number of GlyR clusters per glomerulus (F(1,29) = 1.86; p = 0.31) (Fig. 6E). The ratio between the total fluorescence of GlyR clusters and the volume of the corresponding glomerulus was also similar in the two populations of UBCs (F(1,29) = 4.71; p = 0.16), which implies that the density of labeling does not differ (Fig. 6E). Nevertheless, the mean distance from the closest neighbor, which is representative of the local density of glycine clusters, was slightly greater for mGluRII-positive UBCs (F(1,29) = 52.38; p = 0.019; two-way ANOVA), suggesting a more compact organization of the synapses on the brush (Fig. 6E).
Figure 6.

Comparison of GlyR clusters on group II mGluR-positive and -negative UBCs. A–C, mGluRII (red, A), GlyR (green, B), and VIAAT (blue, C) labeling in mGluRII-negative (left) and mGluRII-positive (right) glomeruli. Scale bar, 10 μm. D, Overlap of all channels. E, The plots illustrate the number of particles per glomerulus (first from the left), the glomerular volume (second), the local density of GlyR clusters (third), and the integral of the fluorescence normalized by the glomerular volume (fourth) in mGluRII-positive and -negative UBCs. Pairs of points represent averages obtained from several glomeruli acquired with identical parameters on the same slide preparation, and error bars illustrate the SE. A.U., Arbitrary units.
Overall, these data confirm our previous observations on glycinergic synaptic currents (Fig. 1H) and the results of local glycine application experiments (Fig. 4A–D), whereby GlyRs expression is variable but uncorrelated to the mGluRII phenotype of UBCs.
Contribution of individual GoCs to the variability of the inhibitory phenotype in UBCs
GoCs are remarkably heterogeneous in terms of the relative content of neurotransmitters GABA and glycine (Ottersen et al., 1987, 1988). Moreover, the expression of the relevant proteins for transmitter synthesis and accumulation, GAD and GlyT2, defines subpopulations that correlate with other functional markers (Simat et al., 2007). To evaluate the contribution of presynaptic GoCs to the heterogeneity of inhibition in UBCs, we performed paired recordings between GoCs recorded in the cell-attached configuration and voltage-clamped UBCs.
On average, the spontaneous firing frequency of GoCs was 0.9 ± 3.4 Hz (range, 0–19.4; n = 33). In agreement with a previous report (Dugué et al., 2009), only a minority of cells (9 of 33) fired consistently in time, with mean frequencies ranging from 0.2 to 19.4 Hz. The majority of cells either showed scarce and irregular firing (7 of 33) or were totally silent (17 of 33). In 27 of 30 (90%) long-lasting recordings, the firing rate increased significantly during kainate application to 6.3 ± 4.9 Hz (range, 0.1–21.6; n = 27; p < 0.001) (Dugué et al., 2009). Cross-correlations between presynaptic and postsynaptic traces allowed unequivocal detection of pIPSCs arising from the recorded GoC (Fig. 7B,C; see Materials and Methods). Mixed synaptic connections were identified in 12 of 33 attempted pairs, and eight of these were sufficiently stable in time to allow complete analysis. pIPSCs followed presynaptic action potentials with an average latency of 1.2 ± 0.2 ms (n = 8). The mean amplitude of pIPSCs amounted at 119.1 ± 95.9 pA (range, 41.4–329; n = 8), with a mean synaptic failure rate of 15.4 ± 23.4% (range, 0–69.2). Assuming that there is no correlation between the kainate-induced firing rate of a GoC and its probability to contact a UBC and that all IPSCs are spike triggered (G.P.D., unpublished observation), we can estimate that approximately six presynaptic GoCs (G) establish functional synapses onto a single UBC in our slice preparation. Indeed, given the fraction of GoCs that do not fire (S0) and the fraction of failures in pairs (F), the mean frequency of detected KAIPSCs in UBCs (I) and the mean firing frequency (S) of GoCs after kainate application allowed us to calculate G from I/[S × (1 − F)]/(1 − S0), yielding a value of 6.3.
To test whether the GoC neurotransmitter content determines the phenotype of inhibition at the synapses onto UBCs, we compared the block of pIPSCs and of uIPSCs by SR95531 (Fig. 7D). No correlation was found between the mean amplitude of pIPSCs and that of uIPSCs (p = 0.13; n = 8), confirming the presence of multiple presynaptic partners with different synaptic weights. The SR95531-resistant (glycinergic) component accounted for similar fractions of the cumulative activity of pIPSCs (17 ± 9.5%; n = 8) and uIPSCs (21.4 ± 11.8%; n = 8; p = 0.55). Moreover, we never found a pure glycinergic or a pure GABAergic paired connection in a background of mixed uIPSCs, as should occur if some GoCs released only one neurotransmitter. However, the contributions of glycine transmission to pIPSCs and uIPSCs in the same cell were not significantly correlated (Fig. 7E; n = 8; p = 0.31). Thus, the presynaptic neurotransmitter content may affect the proportion of postsynaptic GABAARs and GlyRs activated but is not the main determinant.
IPSC decay kinetics and GABA/glycinergic inhibitory profile
GABAergic and glycinergic synaptic currents display distinct kinetic properties in most brain regions in which cotransmission has been demonstrated (Dieudonné and Diana, 2009). This difference in temporal profiles has been proposed to explain the functional benefit of cotransmission (Russier et al., 2002; Lu et al., 2008; Balakrishnan et al., 2009; Kuo et al., 2009). We thus quantified the kinetics of IPSCs in UBCs. We computed a weighted time constant (τw) based on the biexponential fit of the decay of averaged KAIPSCs.
The value of τw (3.8 ± 1 ms; range, 1.9–6.3; n = 31) in the population of UBCs exhibiting mixed GABA/glycinergic IPSCs (>25% of GABAergic transmission) was significantly faster than in UBCs receiving mostly glycinergic inputs (6.2 ± 3.6 ms; range, 3.3–14.5; n = 10; p = 0.008; Fig. 8B). Bath application of SR95531 to mixed UBCs slowed the decay of the IPSCs from a τw of 4.4 ± 1.2 to 6.5 ± 2.6 ms (p = 0.007; Fig. 8C; 11 cells with >20% of residual glycinergic IPSCs after application of SR95531), a value similar to the decay of IPSCs in glycinergic UBCs (p = 0.38). Finally, the isolated GABAergic component of mixed KAIPSCs in the presence of strychnine decayed with a τw of 4.1 ± 2.4 ms, significantly faster than the glycinergic component (p = 0.003).
Figure 8.
The decay kinetics of KAIPSCs is correlated with the inhibitory phenotype of UBCs. A, Individual (black traces) and average (colored traces) KAIPSCs from a GABAergic (top) and a glycinergic (bottom) UBC. B, The graph illustrates the weighted time courses of the two exponential decay components of averaged events from 31 GABA/mixed UBCs (blue, left) and 10 glycinergic UBCs (green, right). The decay time course difference is significant. Stars represent cells shown in A. C, The decay time of synaptic KAIPSCs is significantly increased after application of SR95531 (SR). Averaged events from one experiment are shown, with the black trace illustrating control conditions and the blue one the period after application of SR95531. The amplitude of the blue trace was scaled with respect to the black one. Right, Changes in the decays of 11 mixed UBCs after block of GABAARs. Ctrl, Control. D, Comparison between the decay time constants of the glycinergic component of pIPSCs and uIPSCs in all cells. Error bars represent the SD obtained from bootstrapping procedures. The numbers in the graph relate to the experiments from which the traces depicted on the left were obtained.
Hence, the activation of synaptic GABAARs adds a faster-decaying component to mixed IPSCs, showing that GABAergic and glycinergic inhibition have a different time course at GoC synapses onto UBCs.
We found the glycinergic IPSCs decay kinetics to be highly variable between cells. This variability may be underestimated because spontaneous activity samples multiple presynaptic partners, potentially with different IPSC kinetics. Indeed, synaptically released GABA is known to generate fast-decaying glycinergic IPSCs (Lu et al., 2008) caused by the low-affinity binding and rapid unbinding of GABA at the agonist site on GlyRs. If the variability of kinetics is determined by the ratio of GABA and glycine released by GoCs, pIPSC and uIPSC kinetics should vary independently. We thus compared the kinetics of the glycinergic component of inhibition between pIPSCs and uIPSCs in GoC to UBC pairs. Although the decay time course of the glycinergic component of pIPSCs (range, 6.3–16.7 ms; n = 8) and uIPSCs (range, 7–16.9 ms; n = 8) varied considerably among cells (Fig. 8D), in the same cell the kinetics of pIPSCs (9.5 ± 3.1 ms) and uIPSCs (10.3 ± 3.1 ms) were very strongly correlated (p < 0.001). Experimental errors of the estimate of the kinetics, obtained by bootstrap simulations (see Materials and Methods), are shown in Figure 8D (pIPSCs SD = 1.9 ms; uIPSCs SD = 1.1 ms). These results indicate that glycinergic IPSCs kinetics are determined by postsynaptic UBCs and are similar at all synapses.
GABAergic IPSCs remain faster than glycinergic IPSCs at nearly physiological concentrations of intracellular chloride
The experiments described above were performed using a high chloride-based intracellular solution to optimize the signal-to-noise ratio. However, recent reports show that low intracellular chloride concentrations may differentially accelerate the decay time course of both GABA and glycine conductances (Pitt et al., 2008; Houston et al., 2009). We thus examined the decay kinetics of IPSCs with a nearly physiological internal chloride concentration.
We measured the physiological concentration of chloride in UBCs by performing voltage-clamp recordings in the perforated patch configuration, using a gramicidin-containing recording solution. Gramicidin gives electrical access to cells by introducing anion-impermeant pores into membranes, thus leaving intracellular levels of chloride unmodified (Kyrozis and Reichling, 1995). After reaching stationary access conditions (see Materials and Methods), saturating concentrations of both muscimol (20 μm), and glycine (1 mm) were coapplied via pipettes, using pressure ejection, to UBCs, at different holding potentials (Fig. 9A). Membrane potentials were corrected for the series resistance of the perforated access. At a holding potential of −50 mV, local applications evoked outward currents in UBCs, amounting on average at 79.5 ± 18.6 pA. Application-induced currents reversed at −74.2 ± 6.7 mV (n = 7; Fig. 9B), corresponding to a chloride concentration of 7.7 mm inside the cell. This value could represent an overestimation of the true concentration of chloride inside UBCs. Indeed, if one takes into account the permeability of the membrane of intact cells to bicarbonate ions (Bormann et al., 1987), the physiological intracellular chloride concentration may reach values as low as 4.6 mm.
We then recorded UBCs in the whole-cell configuration with a low chloride-based intracellular solution while electrically stimulating the afferent GoC axons (Fig. 9C; see Materials and Methods). In these conditions, the amplitude of evoked IPSCs (eIPSCs) was 18 ± 14 pA (range, 6–58 pA; n = 13; Fig. 9D). As predicted, the decay time course was significantly faster and much less variable (τw = 3.4 ± 0.9 ms; n = 13) than the τw of KAIPSCs recorded with high internal chloride (4.3 ± 2 ms; n = 48; p = 0.048). Similarly to high chloride conditions, the proportion of IPSCs blocked by strychnine was widely variable (46.4 ± 29.6%; minimum, 0%; maximum, 87.1%; Fig. 9D,E). Interestingly, a significant correlation was found between the proportion of the glycinergic component and the decay time constant of the eIPSCs (the extrapolated intercepts of τw were 2.6 and 4.3 ms at 0 and 100%, respectively; p = 0.038; Fig. 9E). In the group of UBCs showing mixed inhibitory profile (in which the block by strychnine was comprised between 25 and 75%), application of strychnine led to an acceleration of the IPSC decay kinetics, from 3.5 ± 1 ms (n = 9) to 2.7 ± 0.5 ms (p = 0.055; Fig. 9F). Overall, these data show that, in the presence of physiological intracellular concentrations of chloride, GABAergic IPSCs decay in average 1.7 times faster than glycinergic IPSCs. Different IPSC kinetics may endow the cells with distinct computational properties.
Discussion
The corelease of GABA and glycine at central inhibitory synapses is well established (Jonas et al., 1998; Dieudonné and Diana, 2009), but its functional relevance remains uncertain. A unified view of this apparently redundant synaptic modality is still lacking, partly because of the variety of strategies implemented at inhibitory synapses (Dieudonné and Diana, 2009). UBCs, by virtue of their simple morphology and synaptic connectivity, represent an exceptional model system to analyze the cell-specific adaptation of mixed synapses. In this study, we show that both the GABA/glycinergic profile and the kinetics of the synaptic responses are heterogeneous among UBCs and that both properties are primarily determined postsynaptically. Furthermore, we demonstrated that the GABAergic contribution to mixed inhibition is tightly linked to the molecular phenotype of the single glutamatergic synapse received by UBCs.
Heterogeneity of inhibitory synapses onto UBCs
The systematic pharmacological analysis of IPSCs in UBCs reveals two groups of cells: a first set receives exclusively or predominantly GlyR-mediated inhibition, whereas the remaining neurons also display large GABAAR-mediated IPSCs. In other structures, GABAergic inhibition may predominate in young synapses of mixed inhibitory networks, whereas glycinergic components prevail at more mature stages (Kotak et al., 1998; Keller et al., 2001; Nabekura et al., 2004). This is unlikely to be the source of the heterogeneity reported here, because experiments were performed in 17- to 22-d-old rats, when the morphological maturation of the UBC brush is almost finished (Morin et al., 2001), and GABAergic transmission persists in adults (C.V.R., S.D., M.A.D., unpublished results). Moreover, at this time, mixed synapses are nearly mature in posterior structures (Keller et al., 2001; Awatramani et al., 2005).
The developmental switch of mixed inhibition has been attributed to either postsynaptic (Keller et al., 2001; González-Forero and Alvarez, 2005) or presynaptic (Nabekura et al., 2004) mechanisms or to a reorganization of both specializations (Awatramani et al., 2005; Muller et al., 2006). Presynaptic GoCs are characterized by different contents of GABA and glycine (Ottersen et al., 1988; Simat et al., 2007). In our study, we have examined the contribution of presynaptic heterogeneity to the variability of mixed inhibition. In paired recordings between GoCs and UBCs (Fig. 7), the profiles of inhibitory currents of both paired and unpaired connections were similar, and their decay time course was highly correlated (Fig. 8). Moreover, whereas glycine or GABA alone mediate most of the inhibition in ∼60% of the UBCs, GABA/glycine-coexpressing GoCs (Ottersen et al., 1988; Simat et al., 2007) and synaptic terminals (Dugué et al., 2005) represent ≥70% of the overall population. It, thus, appears likely that the phenotype is primarily determined by postsynaptic UBCs. Nevertheless, we cannot totally exclude that developmental processes may select a specific GoCs subgroup as presynaptic partner of a given UBC.
Different dynamic properties of the GABA and glycine components
At all mixed synapses studied so far, GABAergic and glycinergic components display distinct decay kinetics. The glycinergic component is typically faster than the GABAergic component in caudal areas (Russier et al., 2002; Nabekura et al., 2004; Awatramani et al., 2005; González-Forero and Alvarez, 2005) and slower in cerebellar-like structures (Dumoulin et al., 2001; Balakrishnan and Trussell, 2008). This difference has been evoked to justify GABA and glycine coexistence (Russier et al., 2002). Large and fast conductances would temporally constrain spike timing, whereas slower hyperpolarizations would tune neuronal gain on longer timescales (Mitchell and Silver, 2000).
However, previous studies examining mixed inhibition were performed either with high intracellular chloride concentrations, at depolarized potentials, or at room temperatures (Dieudonné and Diana, 2009). These recording conditions cause an increase in the IPSC decay time course (Legendre, 1999; Pitt et al., 2008; Houston et al., 2009) and lead to the amplification of the kinetic differences between GABA and glycine IPSCs. Our study is, to our knowledge, the first report of mixed GABA/glycinergic kinetics in near-physiological conditions. We have found that the glycinergic kinetics are much less variable in physiological conditions but remain slower than that of the GABAergic component. The physiological kinetic differences between the two inhibitory components may thus lead to distinct integrative properties in UBCs.
Another benefit of mixed inhibition might derive from the different gating mechanisms of GABAARs and GlyRs (Dieudonné and Diana, 2009), allowing neurons to tune IPSC kinetics rapidly. GABAARs are assembled from a wide combination of subunits displaying very diverse affinities (Moss and Smart, 2001), and deactivation kinetics appear related to the affinity for GABA, and thus subunit composition (Jones et al., 1998, 2001), and not to the concentration of GABA in the cleft (Galarreta and Hestrin, 1997; Nusser et al., 2001). The homogeneous value of the fast decay of GABAergic conductances (Fig. 8) argues for the existence of a single GABAAR subunit composition in UBCs.
Conversely, GlyRs are assembled from only five subunits (Moss and Smart, 2001), yet glycinergic time course displays many-fold variability (Dieudonné and Diana, 2009). This can be partly explained by differences in the main α subunit forming the receptors (Malosio et al., 1991; Takahashi et al., 1992). However, the binding of glycine molecules to the receptor displays a strong cooperativity (Legendre, 2001; Burzomato et al., 2004), whereby IPSC kinetics are likely related to the magnitude of the glycine transient in the cleft and to allosteric modulation of the receptor (Fucile et al., 2000; Suwa et al., 2001). In addition, the kinetics of glycinergic currents depend on the receptor membrane density (Taleb and Betz, 1994; De Saint Jan et al., 2001; Legendre et al., 2002), so that glycinergic kinetics could be rapidly modified via the activity-dependent modulation of the density of postsynaptic GlyR (Lévi et al., 2008; Dumoulin et al., 2009). Immunohistochemical data and paired recordings suggest that such a regulation of GlyR density, rather than the variability in presynaptic transmitter content, might occur in UBCs and cause kinetics variability.
Physiological significance of the correlation between the excitatory and inhibitory phenotypes of UBCs
Synaptic excitation and inhibition are closely interdependent modalities, which are carefully tuned to optimize neuronal integration (Maffei et al., 2006; Dorrn et al., 2010). Here we show that excitatory and inhibitory profiles are coregulated in vestibulocerebellar UBCs. This is to our knowledge the first demonstration that the phenotypical diversity of mixed inhibitory synapses can be correlated to the phenotype of glutamatergic inputs. Although additional studies will be required to identify the mechanisms leading to the selection of postsynaptic inhibitory phenotypes, several hypothesis can be proposed regarding their role in the integration of vestibular information.
UBCs relay primary and secondary vestibular sensory inputs. A peculiarity of vestibular sensory encoding resides in the regular firing rate of primary sensory neurons at rest, which is increased or decreased according to the direction of head movement (Goldberg, 1991). UBCs are thought to enrich this vestibular information and participate in the generation of complex activity patterns recorded in vivo in the vestibulocerebellum (Simpson et al., 2005; Barmack and Yakhnitsa, 2008). The long decay times of AMPA (Rossi et al., 1995; Diana et al., 2007) and metabotropic glutamate MF responses in UBCs (M.A.D. and S.D., unpublished results) suggests that these cells operate mostly as integrators and/or temporal filters. Distinct integrative modalities of UBCs are likely to be determined by the heterogeneous expression of receptors at the MF synapse (Mugnaini et al., 2011). Preliminary experiments (M.A.D. and S.D., unpublished data) show that MF stimulations lead to spike inhibition in mGluRII-expressing UBCs (Knoflach and Kemp, 1998; Russo et al., 2008; this study) (Fig. 3). Hence, mGluRII-expressing UBCs will behave as OFF cells and fire when their MF afferent is less active, whereas mGluRII-negative cells will discharge in-phase with their excitatory input. These two modes of discharge may require a different inhibitory control by GoCs to optimize their integration within the global granular layer activity.
GoCs control the precise timing of granule cell spikes (D'Angelo, 2008; Kanichay and Silver, 2008) through their fast (Kaneda et al., 1995) components of inhibition, which creates intervals of decreased granule cell excitability. Matching the kinetics and amplitude of GABAergic inhibition in UBCs and granule cells may optimize the efficacy of UBCs, by ensuring that they fire at a time when granule cells are receptive. This is crucial for mGluRII-negative UBCs which will fire in-phase with sensory MFs and compete with them for GoCs and granule cells timing. Furthermore, large GABAergic events may be necessary to counteract fast AMPA events in mGluRII-negative UBCs, which fire in-phase with their inputs.
GoCs also control the gain of the granule cell layer (Hamann et al., 2002) through a distinct slow component of inhibition (Rossi et al., 2003). Slower and smaller glycinergic IPSCs may play this gain control role in both types of UBCs. Overall, differential tuning of GABAergic and glycinergic inhibition may optimize UBC spike timing and spike rate within the context of ongoing granular layer activity.
Notes
Supplemental material for this article is available at http://www.biologie.ens.fr/neuroinh/spip.php?article8. Movie of a three-dimensional reconstruction of the image stack in Figure 6D. This material has not been peer reviewed.
Footnotes
This work was funded by Région Île de France and Fondation pour la Recherche Médicale fellowships (C.V.R.), CNRS, Inserm, French Research Ministry, and Agence Nationale de la Recherche Grant Vesticode 07BSYS010. We thank Dr. E. Schwartz and Dr. B. Barbour for careful reading of this manuscript, Prof. R. Shigemoto for the generous gift of the antibodies against group II mGluR, J. Tellier for help with image acquisition, and Dr. V. Zampini for help with control experiments.
The authors declare no conflict of interest.
References
- Ahmadi S, Muth-Selbach U, Lauterbach A, Lipfert P, Neuhuber WL, Zeilhofer HU. Facilitation of spinal NMDA receptor currents by spillover of synaptically released glycine. Science. 2003;300:2094–2097. doi: 10.1126/science.1083970. [DOI] [PubMed] [Google Scholar]
- Awatramani GB, Turecek R, Trussell LO. Staggered development of GABAergic and glycinergic transmission in the MNTB. J Neurophysiol. 2005;93:819–828. doi: 10.1152/jn.00798.2004. [DOI] [PubMed] [Google Scholar]
- Balakrishnan V, Trussell LO. Synaptic inputs to granule cells of the dorsal cochlear nucleus. J Neurophysiol. 2008;99:208–219. doi: 10.1152/jn.00971.2007. [DOI] [PubMed] [Google Scholar]
- Balakrishnan V, Kuo SP, Roberts PD, Trussell LO. Slow glycinergic transmission mediated by transmitter pooling. Nat Neurosci. 2009;12:286–294. doi: 10.1038/nn.2265. [DOI] [PMC free article] [PubMed] [Google Scholar]
- Barmack NH, Yakhnitsa V. Functions of interneurons in mouse cerebellum. J Neurosci. 2008;28:1140–1152. doi: 10.1523/JNEUROSCI.3942-07.2008. [DOI] [PMC free article] [PubMed] [Google Scholar]
- Bormann J, Hamill OP, Sakmann B. Mechanism of anion permeation through channels gated by glycine and gamma-aminobutyric acid in mouse cultured spinal neurones. J Physiol. 1987;385:243–286. doi: 10.1113/jphysiol.1987.sp016493. [DOI] [PMC free article] [PubMed] [Google Scholar]
- Burzomato V, Beato M, Groot-Kormelink PJ, Colquhoun D, Sivilotti LG. Single-channel behavior of heteromeric α1β glycine receptors: an attempt to detect a conformational change before the channel opens. J Neurosci. 2004;24:10924–10940. doi: 10.1523/JNEUROSCI.3424-04.2004. [DOI] [PMC free article] [PubMed] [Google Scholar]
- D'Angelo E. The critical role of Golgi cells in regulating spatio-temporal integration and plasticity at the cerebellum input stage. Front Neurosci. 2008;2:35–46. doi: 10.3389/neuro.01.008.2008. [DOI] [PMC free article] [PubMed] [Google Scholar]
- De Saint Jan D, David-Watine B, Korn H, Bregestovski P. Activation of human alpha1 and alpha2 homomeric glycine receptors by taurine and GABA. J Physiol. 2001;535:741–755. doi: 10.1111/j.1469-7793.2001.t01-1-00741.x. [DOI] [PMC free article] [PubMed] [Google Scholar]
- Diana MA, Bregestovski P. Calcium and endocannabinoids in the modulation of inhibitory synaptic transmission. Cell Calcium. 2005;37:497–505. doi: 10.1016/j.ceca.2005.01.020. [DOI] [PubMed] [Google Scholar]
- Diana MA, Otsu Y, Maton G, Collin T, Chat M, Dieudonné S. T-type and L-type Ca2+ conductances define and encode the bimodal firing pattern of vestibulocerebellar unipolar brush cells. J Neurosci. 2007;27:3823–3838. doi: 10.1523/JNEUROSCI.4719-06.2007. [DOI] [PMC free article] [PubMed] [Google Scholar]
- Dieudonné S, Diana MA. Postsynaptic determinants of inhibitory transmission at mixed GABAergic/glycinergic synapses. In: Gutierrez R, editor. Co-existence and co-release of classical neurotransmitters. Berlin: Springer Science; 2009. pp. 99–125. [Google Scholar]
- Dorrn AL, Yuan K, Barker AJ, Schreiner CE, Froemke RC. Developmental sensory experience balances cortical excitation and inhibition. Nature. 2010;465:932–936. doi: 10.1038/nature09119. [DOI] [PMC free article] [PubMed] [Google Scholar]
- Dugué GP, Dumoulin A, Triller A, Dieudonné S. Target-dependent use of co-released inhibitory transmitters at central synapses. J Neurosci. 2005;25:6490–6498. doi: 10.1523/JNEUROSCI.1500-05.2005. [DOI] [PMC free article] [PubMed] [Google Scholar]
- Dugué GP, Brunel N, Hakim V, Schwartz E, Chat M, Lévesque M, Courtemanche R, Léna C, Dieudonné S. Electrical coupling mediates tunable low-frequency oscillations and resonance in the cerebellar Golgi cell network. Neuron. 2009;61:126–139. doi: 10.1016/j.neuron.2008.11.028. [DOI] [PubMed] [Google Scholar]
- Dumoulin A, Triller A, Dieudonné S. IPSC kinetics at identified GABAergic and mixed GABAergic and glycinergic synapses onto cerebellar Golgi cells. J Neurosci. 2001;21:6045–6057. doi: 10.1523/JNEUROSCI.21-16-06045.2001. [DOI] [PMC free article] [PubMed] [Google Scholar]
- Dumoulin A, Triller A, Kneussel M. Cellular transport and membrane dynamics of the glycine receptor. Front Mol Neurosci. 2009;2:28. doi: 10.3389/neuro.02.028.2009. [DOI] [PMC free article] [PubMed] [Google Scholar]
- Fucile S, De Saint Jan D, de Carvalho LP, Bregestovski P. Fast potentiation of glycine receptor channels of intracellular calcium in neurons and transfected cells. Neuron. 2000;28:571–583. doi: 10.1016/s0896-6273(00)00134-3. [DOI] [PubMed] [Google Scholar]
- Galarreta M, Hestrin S. Properties of GABAA receptors underlying inhibitory synaptic currents in neocortical pyramidal neurons. J Neurosci. 1997;17:7220–7227. doi: 10.1523/JNEUROSCI.17-19-07220.1997. [DOI] [PMC free article] [PubMed] [Google Scholar]
- Goldberg JM. The vestibular end organs: morphological and physiological diversity of afferents. Curr Opin Neurobiol. 1991;1:229–235. doi: 10.1016/0959-4388(91)90083-j. [DOI] [PubMed] [Google Scholar]
- González-Forero D, Alvarez FJ. Differential postnatal maturation of GABAA, glycine receptor, and mixed synaptic currents in Renshaw cells and ventral spinal interneurons. J Neurosci. 2005;25:2010–2023. doi: 10.1523/JNEUROSCI.2383-04.2005. [DOI] [PMC free article] [PubMed] [Google Scholar]
- Gonzalez-Forero D, Pastor AM, Geiman EJ, Benítez-Temiño B, Alvarez FJ. Regulation of gephyrin cluster size and inhibitory synaptic currents on Renshaw cells by motor axon excitatory inputs. J Neurosci. 2005;25:417–429. doi: 10.1523/JNEUROSCI.3725-04.2005. [DOI] [PMC free article] [PubMed] [Google Scholar]
- Hamann M, Rossi DJ, Attwell D. Tonic and spillover inhibition of granule cells control information flow through cerebellar cortex. Neuron. 2002;33:625–633. doi: 10.1016/s0896-6273(02)00593-7. [DOI] [PubMed] [Google Scholar]
- Houston CM, Bright DP, Sivilotti LG, Beato M, Smart TG. Intracellular chloride ions regulate the time course of GABA-mediated inhibitory synaptic transmission. J Neurosci. 2009;29:10416–10423. doi: 10.1523/JNEUROSCI.1670-09.2009. [DOI] [PMC free article] [PubMed] [Google Scholar]
- Jaarsma D, Diño MR, Ohishi H, Shigemoto R, Mugnaini E. Metabotropic glutamate receptors are associated with non-synaptic appendages of unipolar brush cells in rat cerebellar cortex and cochlear nuclear complex. J Neurocytol. 1998;27:303–327. doi: 10.1023/a:1006982023657. [DOI] [PubMed] [Google Scholar]
- Jonas P, Bischofberger J, Sandkühler J. Corelease of two fast neurotransmitters at a central synapse. Science. 1998;281:419–424. doi: 10.1126/science.281.5375.419. [DOI] [PubMed] [Google Scholar]
- Jones MV, Sahara Y, Dzubay JA, Westbrook GL. Defining affinity with the GABAA receptor. J Neurosci. 1998;18:8590–8604. doi: 10.1523/JNEUROSCI.18-21-08590.1998. [DOI] [PMC free article] [PubMed] [Google Scholar]
- Jones MV, Jonas P, Sahara Y, Westbrook GL. Microscopic kinetics and energetics distinguish GABA(A) receptor agonists from antagonists. Biophys J. 2001;81:2660–2670. doi: 10.1016/S0006-3495(01)75909-7. [DOI] [PMC free article] [PubMed] [Google Scholar]
- Kaneda M, Farrant M, Cull-Candy SG. Whole-cell and single-channel currents activated by GABA and glycine in granule cells of the rat cerebellum. J Physiol. 1995;485:419–435. doi: 10.1113/jphysiol.1995.sp020739. [DOI] [PMC free article] [PubMed] [Google Scholar]
- Kanichay RT, Silver RA. Synaptic and cellular properties of the feedforward inhibitory circuit within the input layer of the cerebellar cortex. J Neurosci. 2008;28:8955–8967. doi: 10.1523/JNEUROSCI.5469-07.2008. [DOI] [PMC free article] [PubMed] [Google Scholar]
- Keller AF, Coull JA, Chery N, Poisbeau P, De Koninck Y. Region-specific developmental specialization of GABA–glycine cosynapses in laminas I–II of the rat spinal dorsal horn. J Neurosci. 2001;21:7871–7880. doi: 10.1523/JNEUROSCI.21-20-07871.2001. [DOI] [PMC free article] [PubMed] [Google Scholar]
- Knoflach F, Kemp JA. Metabotropic glutamate group II receptors activate a G protein-coupled inwardly rectifying K+ current in neurones of the rat cerebellum. J Physiol. 1998;509:347–354. doi: 10.1111/j.1469-7793.1998.347bn.x. [DOI] [PMC free article] [PubMed] [Google Scholar]
- Kotak VC, Korada S, Schwartz IR, Sanes DH. A developmental shift from GABAergic to glycinergic transmission in the central auditory system. J Neurosci. 1998;18:4646–4655. doi: 10.1523/JNEUROSCI.18-12-04646.1998. [DOI] [PMC free article] [PubMed] [Google Scholar]
- Kuo SP, Bradley LA, Trussell LO. Heterogeneous kinetics and pharmacology of synaptic inhibition in the chick auditory brainstem. J Neurosci. 2009;29:9625–9634. doi: 10.1523/JNEUROSCI.0103-09.2009. [DOI] [PMC free article] [PubMed] [Google Scholar]
- Kyrozis A, Reichling DB. Perforated-patch recording with gramicidin avoids artifactual changes in intracellular chloride concentration. J Neurosci Methods. 1995;57:27–35. doi: 10.1016/0165-0270(94)00116-x. [DOI] [PubMed] [Google Scholar]
- Legendre P. Voltage dependence of the glycine receptor-channel kinetics in the zebrafish hindbrain. J Neurophysiol. 1999;82:2120–2129. doi: 10.1152/jn.1999.82.5.2120. [DOI] [PubMed] [Google Scholar]
- Legendre P. The glycinergic inhibitory synapse. Cell Mol Life Sci. 2001;58:760–793. doi: 10.1007/PL00000899. [DOI] [PMC free article] [PubMed] [Google Scholar]
- Legendre P, Muller E, Badiu CI, Meier J, Vannier C, Triller A. Desensitization of homomeric alpha1 glycine receptor increases with receptor density. Mol Pharmacol. 2002;62:817–827. doi: 10.1124/mol.62.4.817. [DOI] [PubMed] [Google Scholar]
- Lévi S, Schweizer C, Bannai H, Pascual O, Charrier C, Triller A. Homeostatic regulation of synaptic GlyR numbers driven by lateral diffusion. Neuron. 2008;59:261–273. doi: 10.1016/j.neuron.2008.05.030. [DOI] [PubMed] [Google Scholar]
- Lu T, Rubio ME, Trussell LO. Glycinergic transmission shaped by the corelease of GABA in a mammalian auditory synapse. Neuron. 2008;57:524–535. doi: 10.1016/j.neuron.2007.12.010. [DOI] [PubMed] [Google Scholar]
- Maffei A, Nataraj K, Nelson SB, Turrigiano GG. Potentiation of cortical inhibition by visual deprivation. Nature. 2006;443:81–84. doi: 10.1038/nature05079. [DOI] [PubMed] [Google Scholar]
- Malosio ML, Marquèze-Pouey B, Kuhse J, Betz H. Widespread expression of glycine receptor subunit mRNAs in the adult and developing rat brain. EMBO J. 1991;10:2401–2409. doi: 10.1002/j.1460-2075.1991.tb07779.x. [DOI] [PMC free article] [PubMed] [Google Scholar]
- McIntire SL, Reimer RJ, Schuske K, Edwards RH, Jorgensen EM. Identification and characterization of the vesicular GABA transporter. Nature. 1997;389:870–876. doi: 10.1038/39908. [DOI] [PubMed] [Google Scholar]
- Mitchell SJ, Silver RA. GABA spillover from single inhibitory axons suppresses low-frequency excitatory transmission at the cerebellar glomerulus. J Neurosci. 2000;20:8651–8658. doi: 10.1523/JNEUROSCI.20-23-08651.2000. [DOI] [PMC free article] [PubMed] [Google Scholar]
- Morin F, Diño MR, Mugnaini E. Postnatal differentiation of unipolar brush cells and mossy fiber-unipolar brush cell synapses in rat cerebellum. Neuroscience. 2001;104:1127–1139. doi: 10.1016/s0306-4522(01)00144-0. [DOI] [PubMed] [Google Scholar]
- Moss SJ, Smart TG. Constructing inhibitory synapses. Nat Rev Neurosci. 2001;2:240–250. doi: 10.1038/35067500. [DOI] [PubMed] [Google Scholar]
- Mugnaini E, Diño MR, Jaarsma D. The unipolar brush cells of the mammalian cerebellum and cochlear nucleus: cytology and microcircuitry. Prog Brain Res. 1997;114:131–150. doi: 10.1016/s0079-6123(08)63362-2. [DOI] [PubMed] [Google Scholar]
- Mugnaini E, Sekerková G, Martina M. The unipolar brush cell: a remarkable neuron finally receiving deserved attention. Brain Res Rev. 2011;66:220–245. doi: 10.1016/j.brainresrev.2010.10.001. [DOI] [PMC free article] [PubMed] [Google Scholar]
- Muller E, Le Corronc H, Triller A, Legendre P. Developmental dissociation of presynaptic inhibitory neurotransmitter and postsynaptic receptor clustering in the hypoglossal nucleus. Mol Cell Neurosci. 2006;32:254–273. doi: 10.1016/j.mcn.2006.04.007. [DOI] [PubMed] [Google Scholar]
- Nabekura J, Katsurabayashi S, Kakazu Y, Shibata S, Matsubara A, Jinno S, Mizoguchi Y, Sasaki A, Ishibashi H. Developmental switch from GABA to glycine release in single central synaptic terminals. Nat Neurosci. 2004;7:17–23. doi: 10.1038/nn1170. [DOI] [PubMed] [Google Scholar]
- Nunzi MG, Birnstiel S, Bhattacharyya BJ, Slater NT, Mugnaini E. Unipolar brush cells form a glutamatergic projection system within the mouse cerebellar cortex. J Comp Neurol. 2001;434:329–341. doi: 10.1002/cne.1180. [DOI] [PubMed] [Google Scholar]
- Nunzi MG, Shigemoto R, Mugnaini E. Differential expression of calretinin and metabotropic glutamate receptor mGluR1alpha defines subsets of unipolar brush cells in mouse cerebellum. J Comp Neurol. 2002;451:189–199. doi: 10.1002/cne.10344. [DOI] [PubMed] [Google Scholar]
- Nusser Z, Naylor D, Mody I. Synapse-specific contribution of the variation of transmitter concentration to the decay of inhibitory postsynaptic currents. Biophys J. 2001;80:1251–1261. doi: 10.1016/S0006-3495(01)76101-2. [DOI] [PMC free article] [PubMed] [Google Scholar]
- O'Brien JA, Berger AJ. Cotransmission of GABA and glycine to brain stem motoneurons. J Neurophysiol. 1999;82:1638–1641. doi: 10.1152/jn.1999.82.3.1638. [DOI] [PubMed] [Google Scholar]
- Ottersen OP, Davanger S, Storm-Mathisen J. Glycine-like immunoreactivity in the cerebellum of rat and Senegalese baboon, Papio papio: a comparison with the distribution of GABA-like immunoreactivity and with [3H]glycine and [3H]GABA uptake. Exp Brain Res. 1987;66:211–221. doi: 10.1007/BF00236216. [DOI] [PubMed] [Google Scholar]
- Ottersen OP, Storm-Mathisen J, Somogyi P. Colocalization of glycine-like and GABA-like immunoreactivities in Golgi cell terminals in the rat cerebellum: a postembedding light and electron microscopic study. Brain Res. 1988;450:342–353. doi: 10.1016/0006-8993(88)91573-9. [DOI] [PubMed] [Google Scholar]
- Pitt SJ, Sivilotti LG, Beato M. High intracellular chloride slows the decay of glycinergic currents. J Neurosci. 2008;28:11454–11467. doi: 10.1523/JNEUROSCI.3890-08.2008. [DOI] [PMC free article] [PubMed] [Google Scholar]
- Rossi DJ, Alford S, Mugnaini E, Slater NT. Properties of transmission at a giant glutamatergic synapse in cerebellum: the mossy fiber-unipolar brush cell synapse. J Neurophysiol. 1995;74:24–42. doi: 10.1152/jn.1995.74.1.24. [DOI] [PubMed] [Google Scholar]
- Rossi DJ, Hamann M, Attwell D. Multiple modes of GABAergic inhibition of rat cerebellar granule cells. J Physiol. 2003;548:97–110. doi: 10.1113/jphysiol.2002.036459. [DOI] [PMC free article] [PubMed] [Google Scholar]
- Russier M, Kopysova IL, Ankri N, Ferrand N, Debanne D. GABA and glycine co-release optimizes functional inhibition in rat brainstem motoneurons in vitro. J Physiol. 2002;541:123–137. doi: 10.1113/jphysiol.2001.016063. [DOI] [PMC free article] [PubMed] [Google Scholar]
- Russo MJ, Yau HJ, Nunzi MG, Mugnaini E, Martina M. Dynamic metabotropic control of intrinsic firing in cerebellar unipolar brush cells. J Neurophysiol. 2008;100:3351–3360. doi: 10.1152/jn.90533.2008. [DOI] [PMC free article] [PubMed] [Google Scholar]
- Sagné C, El Mestikawy S, Isambert MF, Hamon M, Henry JP, Giros B, Gasnier B. Cloning of a functional vesicular GABA and glycine transporter by screening of genome databases. FEBS Lett. 1997;417:177–183. doi: 10.1016/s0014-5793(97)01279-9. [DOI] [PubMed] [Google Scholar]
- Seal RP, Edwards RH. Functional implications of neurotransmitter co-release: glutamate and GABA share the load. Curr Opin Pharmacol. 2006;6:114–119. doi: 10.1016/j.coph.2005.12.001. [DOI] [PubMed] [Google Scholar]
- Simat M, Parpan F, Fritschy JM. Heterogeneity of glycinergic and gabaergic interneurons in the granule cell layer of mouse cerebellum. J Comp Neurol. 2007;500:71–83. doi: 10.1002/cne.21142. [DOI] [PubMed] [Google Scholar]
- Simpson JI, Hulscher HC, Sabel-Goedknegt E, Ruigrok TJ. Between in and out: linking morphology and physiology of cerebellar cortical interneurons. Prog Brain Res. 2005;148:329–340. doi: 10.1016/S0079-6123(04)48026-1. [DOI] [PubMed] [Google Scholar]
- Smith AJ, Owens S, Forsythe ID. Characterisation of inhibitory and excitatory postsynaptic currents of the rat medial superior olive. J Physiol. 2000;529:681–698. doi: 10.1111/j.1469-7793.2000.00681.x. [DOI] [PMC free article] [PubMed] [Google Scholar]
- Suwa H, Saint-Amant L, Triller A, Drapeau P, Legendre P. High-affinity zinc potentiation of inhibitory postsynaptic glycinergic currents in the zebrafish hindbrain. J Neurophysiol. 2001;85:912–925. doi: 10.1152/jn.2001.85.2.912. [DOI] [PubMed] [Google Scholar]
- Takahashi T, Momiyama A, Hirai K, Hishinuma F, Akagi H. Functional correlation of fetal and adult forms of glycine receptors with developmental changes in inhibitory synaptic receptor channels. Neuron. 1992;9:1155–1161. doi: 10.1016/0896-6273(92)90073-m. [DOI] [PubMed] [Google Scholar]
- Taleb O, Betz H. Expression of the human glycine receptor alpha 1 subunit in Xenopus oocytes: apparent affinities of agonists increase at high receptor density. EMBO J. 1994;13:1318–1324. doi: 10.1002/j.1460-2075.1994.tb06384.x. [DOI] [PMC free article] [PubMed] [Google Scholar]
- Todd AJ, Sullivan AC. Light microscope study of the coexistence of GABA-like and glycine-like immunoreactivities in the spinal cord of the rat. J Comp Neurol. 1990;296:496–505. doi: 10.1002/cne.902960312. [DOI] [PubMed] [Google Scholar]
- Turrigiano GG, Nelson SB. Homeostatic plasticity in the developing nervous system. Nat Rev Neurosci. 2004;5:97–107. doi: 10.1038/nrn1327. [DOI] [PubMed] [Google Scholar]
- Watanabe D, Nakanishi S. mGluR2 postsynaptically senses granule cell inputs at Golgi cell synapses. Neuron. 2003;39:821–829. doi: 10.1016/s0896-6273(03)00530-0. [DOI] [PubMed] [Google Scholar]