

Abstract
Many mammals rely on pheromones for mediating social interactions. Recent studies indicate that both the main olfactory system (MOS) and accessory olfactory system (AOS) detect and process pheromonal stimuli, yet the functional difference between these two chemosensory systems remains unclear. We hypothesized that the main functional distinction between the MOS and AOS is the type of sensory information processing performed by each system. Here we compared the electrophysiological responses of mitral cells recorded from the accessory olfactory bulb (AOB) and main olfactory bulb (MOB) in acute mouse brain slices to various stimuli and found them markedly different. The response of MOB mitral cells to brief (0.1 ms, 1–100 V) stimulation of their sensory afferents remained transient regardless of stimulus strength, whereas sufficiently strong stimuli evoked sustained firing in AOB mitral cells lasting up to several minutes. Using EPSC-like current injections (10–100 pA, 10 ms rise time constant, 5 s decay time constant) in the presence of various synaptic blockers (picrotoxin, CGP55845, APV, DNQX, E4CPG, and MSPG), we demonstrated that this difference is attributable to distinct intrinsic properties of the two neuronal populations. The AOB sustained responses were found to be mediated by calcium-activated nonselective cationic current induced by transient intense firing. This current was found to be at least partially mediated by TRPM4 channels activated by calcium influx. We hypothesize that the sustained activity of the AOS induces a new sensory state in the animal, reflecting its social context.
Introduction
Mammals rely heavily on molecular communication in mediating social interactions, such as mating, aggression, and kin relationships (Keverne, 2002; Brennan and Kendrick, 2006; Shah, 2006). This molecular communication is mediated by semiochemicals, such as pheromones, which convey social information between conspecifics. Semiochemicals are detected by a number of olfactory subsystems in the nasal cavity (Munger et al., 2009), of which the best studied are the main olfactory system (MOS) and the accessory olfactory system (AOS), also known as the vomeronasal system (Dulac and Torello, 2003).
Sensory input to the MOS and AOS originates from sensory neurons that reside in the main olfactory epithelium and the vomeronasal organ, respectively, and projects on to the main olfactory bulb (MOB) and the accessory olfactory bulb (AOB), respectively. The sensory terminals synapse on the principal neurons of the bulbs, the mitral and tufted cells, which are their only outputs (Mori et al., 1999).
In contrast to the traditional view of the AOS as the primary system mediating the detection of pheromones, recent studies have directly implicated the MOS (Stowers and Marton, 2005). Both systems are now known to detect at least partially overlapping sets of stimuli (Spehr et al., 2006). Thus, the functional difference between these two chemosensory systems is now unclear.
We previously hypothesized that the main functional distinction between the MOS and AOS is the type of sensory information processing performed by each system (Dulac and Wagner, 2006). It has been difficult to test this hypothesis because there are only limited data on information processing in the AOB. Several years ago, however, using in vivo extracellular recordings from behaving mice, Lou et al. (2003) showed that AOB mitral cells respond with a prolonged excitation to natural stimuli. Surprisingly, the cells maintained their high firing rate for 10–30 s after termination of physical contact with the stimulus.
Persistent firing in response to transient stimuli has been observed in several other brain structures, such as the entorhinal cortex (Egorov et al., 2002) and subiculum (Yoshida and Hasselmo, 2009). In most of these cases, a flufenamic acid (FFA)-sensitive, calcium-activated nonselective cationic current, termed Ican, appears to be involved (Ghamari-Langroudi and Bourque, 2002; Fransén et al., 2006; Tahvildari et al., 2008).
In the present study, we compared the responses of MOB and AOB mitral cells in acute mouse brain slices to similar stimuli. We found that, unlike MOB mitral cells, AOB neurons respond to sufficiently strong stimulation of afferent sensory fibers (SFs) with sustained firing lasting up to several minutes. We also demonstrated that AOB persistent firing responses are mediated by the Ican current, at least partially carried by TRPM4 channels. We revealed that the biophysical mechanism underlying this response involves prolonged activation of Ican via calcium influx stimulated by transient intensive neuronal activity. We conclude that the intrinsic properties of MOB and AOB mitral cells are tuned to different types of information processing. We hypothesize that the AOB sustained activity allows the AOS to induce a new sensory state in the animal according to its social context.
Materials and Methods
Animals.
C57BL/6J male mice (Harlan Laboratories) were maintained in the SPF mice facilities of the Hebrew University of Jerusalem and the University of Haifa under veterinary supervision, according to National Institutes of Health standards, with food and water ad libitum and lights on from 7:00 A.M. to 7:00 P.M. Eight- to 20-week-old mice (25–35 g) were held in groups of 5–10 mice per cage. All experiments were approved by the Animal Care and Use Committees of the Hebrew University and the University of Haifa.
Slice preparation.
Mice were anesthetized (isoflurane; Abbott Laboratories) and killed by cervical dislocation. Olfactory bulb slices, 300–400 μm thick, were prepared as described previously (Wagner et al., 2006). Coronal, sagittal, or horizontal planes were used for MOB slices and semi-coronal (Del Punta et al., 2002) or sagittal planes for AOB slices, with no differences in the results. Most experiments were performed with semi-coronal AOB and horizontal MOB slices. In some experiments (for example, see Fig. 4), recordings were made from both MOB and AOB in the same sagittal slice.
Figure 4.

The different MOB and AOB responses to SF stimulation were preserved by EPSC-like current injections. A, B, Membrane potential responses (top panels) to injections of low (red) and high (blue) EPSC-like depolarizing currents (bottom panels). The MOB cells showed little variation in response duration (A), whereas AOB cell responses changed from a transient to a sustained firing (B). Both cells were recorded from the same sagittal OB slice. C, D, PSTHs from responses to four amplitudes of EPSC-like current injections for the MOB (C) and AOB (D) neurons. Note the almost constant duration of the MOB response and the prolonged, stimulus-dependent duration of the AOB response. Inset gives level of injected current. Note the different scales of y-axes between C and D. E, Mean PSTHs for 20 MOB (red, 16 animals) and 43 AOB (blue, 29 animals) mitral cells, each represented by three consecutive responses to the same stimulus. MOB neurons showed a much higher instantaneous firing frequency, which also terminated more quickly than the prolonged firing of the AOB cells. F, Mean trajectories of the membrane potential underlying the responses in E for MOB (red) and AOB (blue) mitral cells. The trajectories were normalized and superimposed on the normalized injected current trace (gray) showing their different dynamics. The MOB trajectory generally followed the injected current, whereas the AOB trajectory showed a prolonged overshoot decaying with a much slower time constant than the injected current. Holding current (pA): MOB, −70.0 ± 51.0; AOB, −6.4 ± 12.4. EPSC-like current amplitude (pA): MOB, 78.4 ± 26.7; AOB, 52.9 ± 27.6.
Slices were equilibrated for 1–5 h in physiological solution containing the following: 125 mm NaCl, 25 mm NaHCO3, 15 mm glucose, 3 mm KCl, 2 mm CaCl2, 1.3 mm NaH2PO4, and 1 mm MgCl2, oxygenated by bubbling through a 95% O2 and 5% CO2 mixture, pH 7.4. For electrophysiological recordings, slices were submerged in oxygenated physiological solution at room temperature in a recording chamber and perfused at a constant rate of 1–3 ml/min. In most experiments, gabazine (5 μm; Tocris Bioscience) or picrotoxin (50 μm; Sigma) were applied to the bath solution to block GABAA receptors. In experiments in which all synaptic receptors were blocked, the recording chamber was perfused with a blocker blend comprising the following: GABAA receptor antagonist picrotoxin (50 μm), GABAB receptor antagonist CGP55845 [(2S)-3-[(15)-1-(3,4-dichlorophenyl)ethyl]amino-2-hydroxypropyl)(phenylmethyl)phosphinic acid] (2.5 μm; Tocris Bioscience), NMDA receptor antagonist APV (50 μm; Tocris Bioscience), AMPA receptor antagonist DNQX (25 μm; Tocris Bioscience), group I/group II metabotropic glutamate receptor antagonist E4CPG (RS-a-ethyl-4-carboxyphenylglycin) (500 μm; Tocris Bioscience), and group III metabotropic glutamate receptor antagonist MSOP [(RS)-α-methylserine-O-phosphate] (100 μm; Tocris Bioscience). For blocking voltage-activated calcium channels (VACCs), slices were incubated for 30 min before recording in physiological solution with 1 μm ω-conotoxin GVIA and 100 nm SNX 482 (both from Alomone Labs) added. To block spiking activity, we used 1 μm tetrodotoxin (TTX) (Alomone Labs), whereas 50 μm FFA (Sigma) was used to block Ican. For depletion of intracellular calcium stores, thapsigargin (2 μm; Alomone Labs) was added to the bath solution. (RS)-3,5-Dihydroxyphenylglycine (DHPG) (Sigma) was delivered locally by pressure pulses(2-s-long) via a glass pipette containing 200 μm DHPG dissolved in physiological solution.
Electrophysiology.
For electrophysiological recordings, we used the following setups: (1) Olympus BX51WIF equipped with motorized stage and manipulators (Scientifica), recording chamber (RC-26G; Warner Instruments), pulse generator (Master 8; A.M.P.I.) and isolated stimulator (ISOFlex; A.M.P.I.), and MultiClamp 700B amplifier (Molecular Devices); and (2) Olympus BX61WIF equipped with motorized stage and manipulators (Luigs & Neumann), homemade recording chamber, pulse generator (Master 8; A.M.P.I.), and AxoClamp 2B and AxoPatch 1D amplifiers (Molecular Devices).
SFs in the olfactory or vomeronasal nerve layer were electrically stimulated (0.1 ms, 1–100 V) via a concentric bipolar platinum/iridium electrode (FHC). Mitral cells were visualized using infrared differential interference contrast video microscopy via a 40× water-immersion objective. Mitral neurons were identified by the location of the cell body, for MOB neurons strictly in the MOB mitral cell layer and for AOB mitral cells on the ventral side of the external plexiform layer of the AOB.
Activity was recorded extracellularly with borosilicate pipettes (Warner Instruments) filled with physiological solution. Recordings were made in the loose-patch configuration and voltage-clamp mode. Electrical signals were amplified and filtered (low-pass, 5 kHz) via an Axopatch 1D amplifier. Single-unit activity in MOB and AOB mitral cells appeared as a biphasic wave 1.2 ± 0.4 ms peak-to-peak. SF stimuli were delivered at 30 s interstimulus interval (ISI). Whole-cell recordings were performed using borosilicate pipettes filled with standard intracellular recording solution containing the following (mm): 120 K-gluconate, 14 KCl, 10 Na-gluconate, 10 HEPES, 3 MgATP, 0.5 NaGTP, and 10 phosphocreatine (5–12 MΩ). When BAPTA was used, BAPTA–tetrapotassium (Invitrogen) was dissolved in this solution to a final concentration of 5 mm. Seal resistance was at least 2 GΩ and typically 5–10 GΩ. For current-clamp and hybrid-clamp recordings, electrical signals were amplified using MultiClamp 700B and Axoclamp 2B amplifiers (Molecular Devices), respectively. For EPSC-like current injections, current amplitude was selected to evoke maximal depolarization (of voltage trajectory) of 15–20 mV, using 10 pA steps. All EPSC-like currents had a 10 ms rise time constant and a 5 s decay time constant. In the hybrid-clamp procedure, membrane potential was clamped to −80 mV throughout the experiment, excluding 4 s periods during which the amplifier was switched to current-clamp mode to deliver a train of current pulses (rate, 20 Hz; amplitude, 300 pA; width, 10 ms). To obtain I–V curves, we imposed a set of voltage ramps (from −85 to −50 mV and back, 4 s duration, separated by 1 s). Two ramps were given before the spike train and seven ramps after it. All amplified signals were digitized at 2–10 kHz using a National Instruments board and analyzed using home-made software written in LabVIEW (National Instruments). All SF stimuli during whole-cell recordings and EPSC-like current injections were applied at 30–180 s ISI.
Data analysis.
Peristimulus time histogram (PSTH) analysis was performed as follows: (1) all spikes recorded during responses to three to five identical stimuli were represented by their peak times; (2) spike times were pulled and sorted according to their values; (3) sorted spike times were distributed to time bins; and (4) the firing frequency was calculated by dividing the number of spikes in each bin by its duration and dividing the result by the number of identical stimuli included in the analysis. In all cases, the category label denotes the lower boundary of the bin. Voltage trajectories were calculated by clipping the spikes from three to five responses to identical stimuli, averaging them, and smoothing the averaged trace by a moving average. Threshold stimulus was defined as a stimulation level yielding response in approximately half of the stimuli, whereas just-suprathreshold stimulus was defined as the minimal level of stimulus required for consistent response.
RNA preparation and qPCR.
After decapitation, brains were frozen at −80°C for several hours, embedded in OCT compounds (Sakura), and sectioned (500 μm). The AOB and the MOB were punched using 1 mm puncher. Punches were frozen in −80°C for 2–3 d. Punches from two to three mice were used for each RNA sample, and the experiment was repeated four times. RNA extraction was performed using TRI Reagent (Sigma) according to the instructions of the manufacturer. RNA concentration was quantified using nanodrop (ND-1000; Thermo Fisher Scientific). RNA (60 ng) was reverse transcribed to cDNA using the High Capacity RNA to cDNA kit (Applied Biosystems) according to the instructions of the manufacturer. cDNA samples were either used immediately or frozen in −20°C for 1–3 d before real-time qPCR was performed. qPCR was performed in triplicates using fast SYBR green master mix and a STEP-One Plus PCR system (Applied Biosystems). The hypoxanthine-guanine phosphoribosyltransferase gene was used as an endogenous control, and the results were verified using a second endogenous control gene: TATA binding protein. cDNA equivalent to 20 ng of total RNA (for examined genes and 10 ng for endogenous controls) was added to a 10 μl total reaction mixture with sequence specific primers at final concentration of 330 nm. Primers were used at a final concentration of 300 nm in a 10 μl final reaction volume. Thermocycling conditions were as follows: 95°C for 20 s, followed by 40 cycles of 95°C for 3 s and annealing at 60°C for 30 s. The specificity of the amplification products was verified by melting curve. The efficiency of each set of primers was validated using calibration curves. Only primers with amplification efficiencies of 90–110% were used. Quantification cycle (Cq) analysis was done using the automatic algorithm of the qPCR software (STEP-One version 2.1; Applied Biosystems). A negative template control and RNA transcribed without reverse transcriptase were used as negative controls. The difference between the negative controls and the target genes examined was never less than five cycles.
Immunohistochemistry.
After anesthesia and cervical dislocation, mice (8–10 weeks of age) were perfused with ice-cold PBS, followed by 4% paraformaldehyde (PFA). Brains were removed and kept in 1% PFA and 30% sucrose overnight at 4°C. The brains were frozen at −80°C for several hours, embedded in OCT compounds, and then sectioned (35–40 μm thickness). The samples were washed three times for 5 min with PBS and incubated with a blocking solution (20% NGS and 0.5% Triton X-100 in PBS) for 2 h, and then incubated overnight at room temperature in blocking solution (2% NGS in PBS) with primary antibody (1:100, 1:200) (Alomone Labs). Three PBS washes were followed by 1.5 h of incubation with the second antibody in the dark (GFP-conjugated anti-rabbit, 1:200; Invitrogen). The slices were washed three times for 5 min with PBS and then incubated for 1 min with Hoechst (1:5000). Slices were mounted on slides, dried for 30 min, and covered with Antifade (Invitrogen) and a coverslip. Pictures were taken using a confocal microscope (Eclipse C1; Nikon) and adjusted with the NIS-elements software (Nikon).
Statistics.
Unless mentioned otherwise, all statistical differences were calculated using t test after checking for normal distribution (Kolmogorov–Smirnov test). z-Score analysis was calculated in time bins of 0.5 s for each of spontaneously active AOB mitral cells by calculating (Fi − Fps)/SDps, where Fi is the mean (of five repetitions) firing frequency at the ith bin, Fps is the mean prestimulus firing frequency and SDps is the SD of prestimulus firing frequency.
Results
MOB and AOB mitral cells respond differently to SF stimulation
Extracellular recordings from mitral cells in acute slices of the olfactory bulb revealed that MOB cells typically respond to a brief (0.1 ms) SF stimulation with high-frequency burst, lasting for 1–3 s (Fig. 1A), whereas the response of AOB neurons was characterized with a prolonged low-frequency firing (Fig. 1B). It should be noted that only 44% of MOB mitral cells recorded extracellularly in the acute brain slices fired spontaneously (0.4 ± 1.2 Hz, n = 15), whereas 94% of AOB mitral cells were usually spontaneously active (1.4 ± 1.9 Hz, n = 18).
Figure 1.
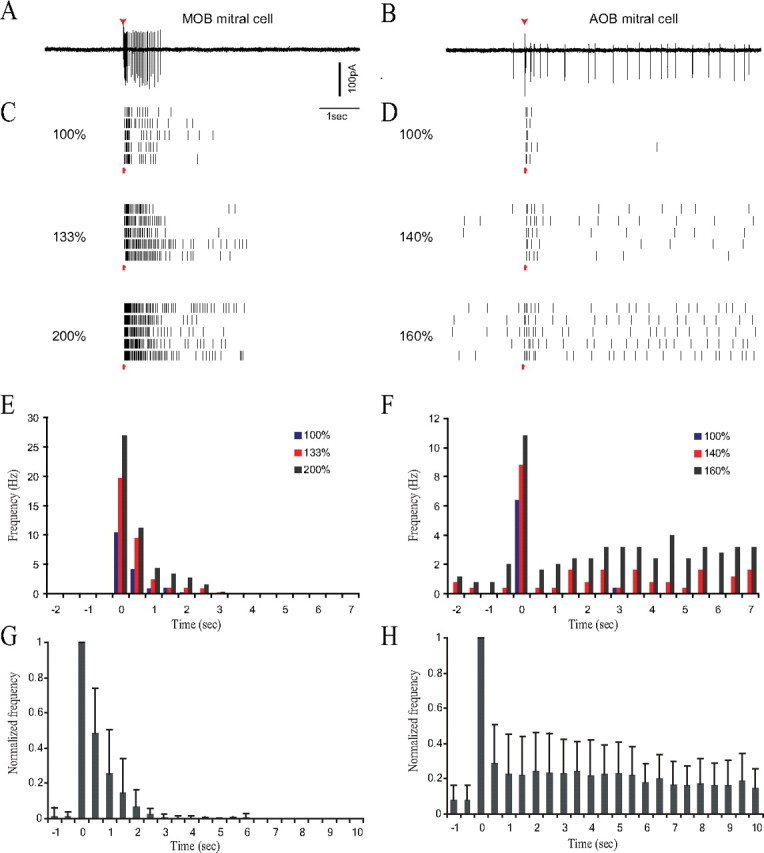
MOB and AOB mitral cells respond differently to SF stimulation. A, B, Extracellularly recorded current traces of the response of MOB (A) and AOB (B) mitral cells to SF stimulation. Red arrows mark stimuli. C, D, Raster plots of the spiking events for three stimulus intensities labeled as percentages of just-suprathreshold stimulus strength for MOB (C) and AOB (D) responses. Each plot comprises five lines representing the responses to five identical stimuli, given 30 s apart. Red arrows mark stimulus times. Note the spike accumulation in the middle (140%) and bottom (160%) panels of D despite the 30 s ISI, indicating that response duration is longer than 30 s. E, F, PSTHs of the responses in C and D, respectively. Note the different scales of y-axes. Bin duration, −0.5 s. G, H, Averaged PSTHs, respectively, for MOB (n = 15, 6 animals) and AOB (n = 13, 9 animals) mitral cells. Data for each cell were normalized to its maximal response before averaging.
Figure 1, C and D, shows the responses of MOB and AOB cells to different stimulus intensities (expressed as percentage of just-suprathreshold level). The firing frequency of MOB neurons increased with stimulus intensity, whereas response duration was only slightly affected (maximal duration, 3.6 ± 1.4 s; n = 15). In the AOB cells, weak stimuli elicited a short response of up to 1 s and consisting of only few spikes at low frequency (Fig. 1D, top raster plot). The frequency of this initial response, which increased monotonically with stimulus intensity, saturated at ∼40 Hz. Beyond a certain stimulus strength, however, the initial response was followed by a remarkably prolonged increase in firing rate (10–30 s at >50% above baseline; Fig. 1D). These differences can be seen in individual PSTHs in Figure 1, E and F.
The significance of the difference in the duration between the two types of responses is summarized in Figure 1, G and H, which shows the normalized averaged responses of MOB and AOB mitral cells to saturating SF stimuli. Whereas the poststimulus spiking activity of MOB cells is consistently higher than the baseline for only ∼3 s (80% of cells completely ceased firing at 4 s), AOB mitral cells show persistent activity that is higher than baseline (>50%) for at least 10 s after stimulation. A z-score analysis show that AOB mitral cells retain a mean z-score of >10 for at least 10 s after stimulation.
This sustained response of AOB cells was observed in 72% of the recorded cells (13 of 18). In the remainder, the initial 0.5–1 s excitatory response was followed by a prolonged inhibitory phase, manifested as an abrupt termination of firing (Fig. 2B; F, black bars) or a decrease in firing rate below the spontaneous level (data not shown). Here an inhibitory process may have curtailed the response. Blocking GABAA receptors by gabazine (a specific blocker of GABAA receptors) revealed the sustained excitatory response characteristic of the other AOB cells (Fig. 2D,F, gray bars, n = 3 of 3). Thus, the induction of the prolonged response of AOB mitral cells to SF input appears to be controlled by the local GABAergic network of the AOB.
Figure 2.

Selective block of AOB sustained responses was mediated via GABAA receptors. A, C, Extracellularly recorded current traces of the responses of MOB mitral cells to SF stimulation before (A) and during (C) application of 2.5 μm gabazine to the recording chamber. B, D, Same for AOB mitral cell before (B) and during (D) application of 2.5 μm gabazine. E, PSTHs (each averaging 5 responses to identical stimuli) of the responses of the MOB mitral cell shown in A and C before (black) and during (gray) gabazine application. The MOB response remained transient after blockade of GABAA receptors. Stimulus strength was 1000% of just-suprathreshold level. Bin duration, −0.5 s. F, PSTHs of the responses of the AOB mitral cell shown in B and D before (black) and during (gray) gabazine application. This AOB neuron belonged to the 28% of AOB neurons displaying prolonged inhibition after the initial transient firing response. The excitatory response was sustained after blockade of GABAA receptors. Stimulus strength was 250% of just-suprathreshold level. Note the different scales of y-axes between E and F.
In contrast, blocking GABAA neurotransmission in the MOB (Fig. 2A,C,F) caused a twofold increase in the intensity of the responses to SF stimulation (to 233 ± 59% of the control response, n = 3 of 3) without prolonging response duration beyond 3–4 s (3.0 ± 0.5 s). Thus, the rather restricted duration of MOB responses is independent of GABAA-mediated neurotransmission. To prevent any effect of GABAA-mediated neurotransmission, all additional experiments were performed in the presence of GABAA blockers (gabazine or picrotoxin).
Intracellular recordings from MOB and AOB mitral cells using the whole-cell configuration confirmed these response differences. The typical response of MOB mitral cells to SF stimulation comprised a burst of spikes superimposed on an extended depolarization (Fig. 3A,C,E). Even for threshold stimuli, MOB cells responded with an all-or-nothing high-frequency burst of spikes (Fig. 3A) that terminated considerably before the end of the protracted EPSP (Fig. 3C,E). In contrast, the response of AOB mitral cells consisted of an initial brief response appearing at low stimulus intensities (Fig. 3B,D), followed by a prolonged depolarization, which was activated above a certain threshold and supported an elevated firing rate (Fig. 3F). These differences are summarized in the PSTHs in Figure 3, G and H.
Figure 3.

Differences between MOB and AOB responses to SF stimulation were preserved in whole-cell recordings. A, B, Whole-cell recordings of the responses of MOB (A) and AOB (B) mitral cells to threshold stimuli. Subthreshold (black) and suprathreshold (green) responses are superimposed. The typical burst response of MOB cells was evident even for low-intensity stimulation. Note the voltage ramp underlying the MOB response. The baseline membrane potential is indicated for each trace. C, E, Responses of the MOB cell in A to just-suprathreshold (C) and high (E) stimulation levels, labeled as percentages of just-suprathreshold stimulus strength. Firing terminated abruptly well before the decline of the underlying voltage ramp. Spikes are trimmed at 0 mV. D, F, Responses of the AOB cell in B to just-suprathreshold (D) and higher (F) stimulation strengths. The responses changed from a transient response in D to sustained firing in F. Spikes are trimmed at 0 mV. G, PSTH of the responses in A, C, and E. The response duration remained relatively constant, contrasting with the highly dynamic range of the peak firing rate. H, PSTH of the responses in B, D, and F. The sustained response strengthened with increasing stimulus intensity. Note the different scales of y-axes between G and H.
The different MOB and AOB mitral cell responses result from different intrinsic properties
The differences between the responses of AOB and MOB mitral cells to SF stimulation may have resulted from differences in either their synaptic input or their intrinsic properties. To distinguish between these two possibilities, we measured the responses of these cells to intracellularly injected depolarizing currents that mimicked their prolonged evoked EPSCs. We then examined the responses to this current in the presence of synaptic blockers.
EPSC-like current injections preserve the different response types of MOB and AOB mitral cells
Several studies exploring the synaptic response in MOB mitral cells evoked by SF stimulation have reported a prolonged excitatory component, ranging from 200 ms to 5 s (Chen and Shepherd, 1997; Aroniadou-Anderjaska et al., 1999; Isaacson, 1999; Salin et al., 2001; Christie and Westbrook, 2006; Ennis et al., 2006; De Saint Jan and Westbrook, 2007). Our preliminary voltage-clamp recordings confirmed the existence of a similarly prolonged component of the evoked EPSCs in both MOB and AOB mitral cells (data not shown). We therefore injected current pulses shaped to mimic this EPSC: a fast rise time of 10 ms, followed by slow decay over 5 s, varying only the peak amplitude.
The typical responses of MOB and AOB mitral cells, recorded in the same slice, to weak and strong EPSC-like currents are shown in Figure 4. These responses resembled the mitral cell responses to SF stimulation. MOB cells responded with robust transient firing superimposed on a prolonged voltage ramp (Fig. 4A). The frequency of the firing response increased with current intensity, but the duration of the response was limited to only few seconds (Fig. 4C). In contrast, in the AOB cells, low-amplitude EPSC-like current elicited a transient firing response, whereas a stronger current elicited firing lasting at least 15 s (Fig. 4B,D).
The responses to EPSC-like currents (peak amplitude selected to elicit maximal voltage responses of 15–20 mV) were measured in 43 AOB neurons (29 preparations) and 20 MOB neurons (16 preparations). Figure 4, E and F, shows their averaged PSTHs and mean voltage trajectories (see Materials and Methods). The average PSTH for MOB mitral cells revealed that firing frequency reached a maximal mean rate of ∼35 Hz and decayed rapidly. AOB mitral cells fired at approximately half this maximal rate, but their firing showed a much longer decay. The normalized trajectory of the mean membrane potential underlying the firing response of MOB mitral cells generally followed the time course of the injected current (Fig. 4E). In contrast, the trajectory of the response recorded from AOB neurons showed a prolonged overshoot, relative to the injected current, with a much slower decay.
The quantitative parameters summarized in Table 1 were used for statistical comparison of the responses of the two neuronal types to EPSC-like currents. The amplitude of the EPSC-like currents injected into MOB mitral cells to elicit peak voltage response was just 40% higher than required in AOB neurons despite the latter having approximately three times higher input resistance. This was to be expected considering the higher excitability of MOB mitral cells (Zibman et al., 2011), which was also reflected in their approximately two times higher maximal firing response. MOB and AOB mitral cells differed markedly in the time constant of the decay in firing rate and the duration of firing (Table 1), with the AOB mitral cells having an approximately four times longer time constant of decay and duration of firing than MOB mitral cells.
Table 1.
Statistical analysis (unpaired t test) of electrophysiological parameters characterizing the responses of MOB and AOB mitral cells to EPSC-like current injections
| Parameter | MOB | AOB | Significance |
|---|---|---|---|
| Baseline membrane potential (mV) | −61.65 ± 2.7 | −59.6 ± 5.16 | t(63) = 1.8, p = 0.08 |
| Input resistance (MΩ) | 240 ± 110 | 880 ± 430 | t(63) = 6.9, p < 0.001 |
| Maximal voltage response (mV) | 17.8 ± 3.9 | 17.5 ± 4.5 | t(63) = 0.8, p = 0.39 |
| Maximal firing rate (Hz) | 50.6 ± 16.8 | 24.6 ± 7.6 | t(63) = 8.03, p < 0.001 |
| Time constant of the decay in firing rate (s) | 1.23 ± 0.6 | 5.0 ± 1.3 | t(63) = 13.08, p < 0.001 |
| Duration of the firing response (s) | 4.0 ± 1.5 | 17.1 ± 4.2 | t(63) = 14.96, p < 0.001 |
Baseline membrane potential, Averaged over 0.5 s before stimulation; Input resistance, the slope of the I–V curve; Maximal voltage response, maximal value of the voltage trajectory; Maximal firing rate, calculated from the PSTH using 100 ms bins; Time constant of the decay in firing rate, calculated by fitting an exponent to the PSTH (1 s bins) starting at maximal value; Duration of the firing response, poststimulus time of the last spike, which was not preceded by >3 s without spikes.
The responses of MOB and AOB mitral cells to EPSC-like currents were unaffected by blocking GABA and glutamate receptors
MOB and AOB mitral cells have been shown previously to be capable of activating their own glutamate receptors by depolarization-induced release of glutamate from their reciprocal synapses with GABAergic granule cells (Aroniadou-Anderjaska et al., 1999; Isaacson, 1999; Salin et al., 2001; Castro and Urban, 2009). It is thus possible that stimulating a single mitral cell activated the local network. We therefore studied the responses of these cells to EPSC-like currents in the presence of synaptic blockers (see Materials and Methods) that block the GABAB, AMPA, NMDA, and metabotropic glutamate receptors, in addition to the GABAA receptor that is blocked anyway. As exemplified in Figure 5, the synaptic blockers did not affect the responses of either MOB (Fig. 5A,B) or AOB (Fig. 5E,F) mitral cells. The same conclusion is drawn from a comparison of the PSTHs (Fig. 5C,G) and voltage trajectories (Fig. 5D,H) of the two neuronal populations before and during application of the synaptic blockers. Statistical analysis of the parameters detailed in Table 1 confirms that there is no significant change in the responses of MOB and AOB mitral cells to EPSC-like currents during application of the synaptic blockers.
Figure 5.

Blocking GABA and glutamate receptors did not affect the responses of MOB and AOB mitral cells to EPSC-like current injection. A, B, Typical voltage responses of MOB mitral cells to injection of EPSC-like currents (shown below) before (A) and during (B) addition of the blend of GABA and glutamate receptor blockers to the bath solution. C, Mean PSTHs of the responses of four MOB cells (3 animals) recorded before (red) and during (blue) addition of the blocker blend to the bath solution. D, Mean voltage trajectories of the responses analyzed in C. E, F, Typical voltage responses of AOB mitral cells to injection of EPSC-like currents (shown below) before (E) and during (F) addition of the blocker blend to the bath solution. G, Mean PSTHs of the responses of six AOB cells (5 animals) recorded before (light blue) and during (light green) adding the blocker blend to the bath solution. Note the different scales of y-axes between C and G. H, Mean voltage trajectories of the responses analyzed in G. Holding current (pA): MOB control, −31.4 ± 14.1; MOB blockers, −34.3 ± 6.6; AOB control, −5.6 ± 10.4; AOB blockers, −3.2 ± 4.0. EPSC-like current amplitude (pA): MOB control and blockers, 85.0 ± 19.2; AOB control and blockers, 40.0 ± 12.6.
That is, EPSC-like currents elicited different responses in MOB and AOB mitral cells resembling their responses to SF stimulation, even when GABA and glutamate receptors were blocked. We concluded that the differences in response profiles of the two neuronal types were mainly attributable to their different cellular properties rather than dissimilar network properties.
The biophysical mechanism that generates prolonged firing in AOB mitral cells
The prolonged response of AOB mitral cells depends on intracellular free calcium
The involvement of free intracellular calcium ions in the generation of mitral neuron responses was examined using 5 mm BAPTA in the patch pipette to reduce the level of free calcium in the recorded neuron. Figure 6, A and B, shows the similarity between the responses of MOB mitral cells to EPSC-like currents with and without BAPTA. Moreover, the magnitude and dynamics of the responses of these cells, i.e., their PSTHs and their response trajectories, were unaffected by the presence of BAPTA (Fig. 6C,D). Indeed, of all the parameters used for statistical analysis (Table 1), only the maximal voltage response was significantly higher with BAPTA, probably because of the lower activation of calcium-dependent potassium channels.
Figure 6.

The response of AOB, but not MOB, mitral cells to EPSC-like current injection depended on free intracellular calcium level. A, B, Typical voltage responses of MOB mitral cells to injection of EPSC-like currents (shown below) in the absence (A) and presence (B) of BAPTA (5 mm) in the intracellular solution. C, Mean PSTHs of the responses of 10 MOB cells recorded without BAPTA (red) and eight MOB cells recorded with BAPTA in the intracellular solution (blue). Recordings were made from the same slices (9 animals) in both conditions. D, Mean voltage trajectories of the responses analyzed in C. Note the similar PSTHs and trajectories in both conditions. E, F, Typical voltage responses of AOB mitral cells to injection of EPSC-like currents (shown below) in the absence (E) and presence (F) of BAPTA (5 mm) in the intracellular solution. G, Mean PSTHs of the responses of 10 AOB cells recorded without BAPTA (light blue) and nine AOB cells recorded with BAPTA in the intracellular solution (light green). Recordings were made from the same slices (10 animals) in both conditions. Firing duration was significantly reduced in the presence of BAPTA. Note the different scales of y-axes between C and G. H, Mean voltage trajectories of the responses analyzed in G. The trajectory fell significantly faster in the presence of BAPTA. Holding current (pA): MOB control, −99.6 ± 49.5; MOB blockers, −102.4 ± 46.9; AOB control, −4.9 ± 8.4; AOB blockers, −25.3 ± 19.6. EPSC-like current amplitude (pA): MOB control, 95 ± 2; MOB blockers, 98 ± 2; AOB control, 52 ± 2; AOB blockers, 66 ± 3.
In contrast, in AOB mitral cells, the presence of BAPTA significantly shortened both the firing duration (from 15.0 ± 3.6 to 5.5 ± 1.9 s, t(18) = 7.25, p < 0.001) and the time constant of the decay in firing rate (from 4.8 ± 1.3 to 3.0 ± 1.0 s, t(18) = 3.56, p < 0.005; Fig. 6E--G). Moreover, the superimposed normalized trajectories of the AOB responses in both conditions (Fig. 6H) showed a markedly faster fall of the voltage response in the presence of BAPTA. We therefore concluded that free intracellular calcium concentration plays a major role in the prolonged response of AOB mitral cells.
The prolonged response of AOB mitral cells is FFA sensitive
Calcium-dependent sustained responses have been reported in several areas of the brain and in most cases were found to depend on an FFA-sensitive calcium-activated nonselective cationic current known as Ican (for review, see Major and Tank, 2004). FFA (50 μm) was added to the bath, and the responses of AOB and MOB mitral neurons to EPSC-like currents were examined. As shown in Figure 7, there is a striking resemblance between the results obtained with FFA and those obtained with BAPTA (Fig. 6). As exemplified in their typical responses (Fig. 7A,B) and analyzed in their PSTHs (Fig. 7C) and voltage trajectories (Fig. 7D), there is almost no significant effect of FFA on MOB mitral cells, besides a slight increase in their maximal voltage response (from 17.66 ± 3.2 to 23.94 ± 8.0 mV) and in the duration of their firing responses (from 2.42 ± 1.3 to 4.48 ± 2.3 s). In contrast, AOB mitral cells exhibit a significant reversible shortening of their response (Fig. 7E,F), also clearly manifested by their PSTHs (Fig. 7G) and voltage trajectories (Fig. 7H), in the presence of FFA. Indeed, we found a statistically significant decrease in both the firing duration (from 18.8 ± 15.1 to 8.3 ± 2.8 s, t(18) = 2.46, p < 0.05) and the time constant of the decay in firing rate (from 6.1 ± 2.4 to 3.5 ± 0.8 s, t(18) = 2.91, p < 0.001) of AOB neurons in the presence of FFA. Thus, an FFA-sensitive, calcium-dependent current, most likely Ican, appears to underlie the prolonged responses of AOB mitral cells to EPSC-like currents.
Figure 7.

The response of AOB, but not MOB, mitral cells to EPSC-like current injection was sensitive to the presence of FFA. A, B, Typical voltage responses of MOB mitral cell to injection of EPSC-like current (shown below) before (A) and during (B) FFA (50 μm) presence in the bath solution. C, Mean PSTHs of the responses of seven MOB cells (4 animals) recorded before (red) and during (blue) FFA (50 μm) application. D, Mean voltage trajectories of the responses analyzed in C are similar in both conditions. E, F, Typical voltage responses of AOB mitral cells to injection of EPSC-like current (shown below) before (E) and during (F) FFA (50 μm) presence in the bath solution. G, Mean PSTHs of the responses of nine AOB cells (8 animals) recorded before (light blue) and during (light green) FFA (50 μm) addition. Firing duration decreased significantly in the presence of FFA. Note the different scales of y-axes between C and G. H, Mean voltage trajectories of the responses of analyzed in G. The trajectory fell significantly faster in the presence of FFA. Holding current (pA): MOB control, −98.8 ± 68.9; MOB blockers, −111.6 ± 74.4; AOB control, −8.6 ± 6.8; AOB blockers, −11.2 ± 9.8. EPSC-like current amplitude (pA): MOB control and blockers, 8.6 ± 32.9; AOB control and blockers, 46.7 ± 20.6.
Relationships between firing activity and inward current along the prolonged response of AOB mitral cells
To examine the role of firing of the AOB neurons in inducing and maintaining their prolonged depolarization, we recorded the responses of AOB mitral cells to EPSC-like currents before and during application of TTX (1 μm). TTX almost completely blocked the prolonged depolarization induced by EPSC-like current injection (Fig. 8A,B). Thus, it is mainly the spiking activity that triggers the prolonged depolarization. To study the contribution of the low-frequency firing characterizing most of the prolonged depolarization, hyperpolarizing current steps were used to prevent firing for various durations (Fig. 8C--F), starting 1 s after stimulus onset. Using this paradigm, we could prevent firing along most of the response, without interfering with the consequences of the intense firing characterizing its early stage. As manifested in the PSTHs shown in Figure 8G–J, although the hyperpolarizations effectively silenced the cell, there was no decrease in response duration. Moreover, after the silencing periods, the firing rate returned back to its expected value. Thus, the initial firing was apparently sufficient to induce the prolonged depolarization.
Figure 8.

The persistent firing response of AOB mitral cells to EPSC-like current injection depends on the initial firing phase. A, Superimposed traces of the voltage response of an AOB mitral cell to EPSP-like current injection (gray) before (blue) and during (red) addition of 1 μm TTX to the bath solution. The peak of the voltage trajectory was higher in the presence of TTX, probably because of the lower input resistance of neurons during intensive firing. B, Mean normalized trajectories of the responses before (blue) and during (red) TTX application superimposed on the injected current trace (gray). The voltage response decayed much faster in the presence of TTX, reflecting the lack of Ican activation in the complete absence of firing activity. C–F, Voltage traces of the responses of an AOB mitral cell to EPSC-like current injections (gray traces below) without (A) and with (B–D) hyperpolarizing current steps that blocked firing during time windows of 3 s (B), 7 s (C), and 12 s (D), starting 1 s after stimulus onset. G–J, PSTHs for the responses shown in C–F, respectively.
The inward current underlying the prolonged depolarization was measured using hybrid-clamp methodology, which enables instantaneous switching between current- and voltage-clamp modes. The prolonged response in AOB neurons was triggered by a train of spikes in current-clamp mode, and the following current was measured in voltage-clamp mode (holding potential, −80 mV). Such an experiment is shown in Figure 9A. A train of action potentials (4 s, 20 Hz) elicited a slowly rising prolonged inward current in the recorded cell. This current, ranging from 5 to 20 pA, could last for >120 s.
Figure 9.

Analysis of Ican induction after a spike train in AOB mitral cells. A, The hybrid-clamp protocol. A burst of spikes was elicited in current-clamp mode by a depolarizing current pulse train (duration, 4 s; rate, 20 Hz; amplitude, 300 pA; width, 10 ms), followed by a switch to voltage-clamp mode. The hybrid-clamp modes are indicated in the bar above. The dashed line gives the baseline current. The stimulus train induced a transient outward current followed by a slow prolonged inward current of ∼10 pA. B, The protocol for measuring the reversal potential of the prolonged current. Several voltage ramps were given before and after the spike train (marked by a green bar). C, I–V curves before and after the pulse train, using the ramps color coded in B. The conductance was calculated from the change in slope between the curves, and the reversal potential was calculated from the intersection of their extrapolated linear fits. D, The averaged current after the pulse train (green bar) to AOB mitral cells in the control condition (dotted line, 9 cells) and in slices incubated with blockers of N- and R-type VACCs (continuous line, 9 cells). E, The inverse of the charge transferred in the prolonged current from 2 to 34 s after spike train (left) in control conditions (green, 8 cells) and after intracellular calcium stores depletion by thapsigargin (magenta, 3 cells) or after a DHPG puff (right) in the same conditions (control, 10 cells; thapsigargin, 6 cells). Bars and error bars represent mean ± SEM; Mann–Whitney U test, *p < 0.05.
The associated change in conductance was calculated to further characterize the prolonged current. Membrane voltage was clamped with voltage ramps (from −85 to −50 mV and back during 4 s) before and at various times during the prolonged response (Fig. 9B), and the current was measured. An I--V curve was then plotted for each ramp (Fig. 9C). The change in membrane conductance was calculated from the slopes of the curves before and 10 s after the spike train, and the reversal potential of the current response was estimated from their intersection (Fig. 9C). An average increase of 12 ± 6% (n = 6) in membrane conductance was found in all the experiments. The reversal potential averaged −36 ± 10 mV, ranging from −47 to −25 mV. This reversal potential suggested a nonselective cationic current and fitted the reversal potential of Ican measured in other brain areas (Aoyagi et al., 2002; Teruyama and Armstrong, 2007).
The calcium dependence of the prolonged inward current was examined in slices incubated with blockers of N- and R-type VACC blockers (1 μm ω-conotoxin GVIA, 100 nm SNX 482). These channels have been shown previously to mediate ∼95% of firing-activated calcium influx in AOB mitral cells (Dong et al., 2009). Figure 9D shows the average results from nine cells incubated with the blockers (continuous line) and nine control cells (dotted line). Although cells in the control condition responded to the spike train with the characteristic prolonged inward current, cells incubated with calcium channel blockers showed a transient outward current. These responses were quantified by calculating the integral of the current from 2–34 s after the spike train separately for each cell (data not shown). These calculations showed a highly significant difference (Mann–Whitney U test, p < 0.01) between the control cells (−0.15 ± 0.02 nC, n = 9) and those recorded after incubation with VACC blockers (0.04 ± 0.06 nC, n = 9). To examine the potential role of intracellular calcium stores in the prolonged current response, we depleted these stores using thapsigargin (2 μm). As depicted in Figure 9E (left), there is no significant difference between the mean integral of the current induced by a spike train in the absence (green) and presence (magenta) of thapsigargin. In contrast, when a puff of the mGluR1 agonist DHPG was used to stimulate the cells (right), thapsigargin induced a significant reduction in the prolonged current induced by DHPG.
We conclude that the prolonged responses of AOB mitral cells were caused by Ican activation, triggered by calcium influx that was induced by intensive but transient firing in these cells.
TRPM4 channels are involved in the prolonged responses of AOB mitral cells
The identity of the channel mediating Ican in the mammalian brain is controversial, and several TRP channels, mainly from the TRPC and TRPM subfamilies, were implicated in various brain regions (Yan et al., 2009; Teruyama et al., 2011; Zhang et al., 2011). To identify which TRP channel is involved in the responses of AOB mitral cells, we combined molecular, immunohistochemical, and electrophysiological methods, the results of which are summarized in Figure 10. First, we have screened the Allen Brain Atlas (http://mouse.brain-map.org) and revealed nine TRPC and TRPM candidates expressed in the AOB mitral cells (TRPC1, TRPC3, TRPC5, TRPC6, TRPC7, TRPM2, TRPM4, TRPM5, and TRPM7). Of them, we have chosen, based on their expression pattern and previous works, five genes for expression analysis using qPCR. As depicted in Figure 10A, qPCR analysis of mRNA levels shows that, of the five candidate TRP channels, the most significant difference between the AOB and MOB was found in the expression of the TRPM4 gene. Immunohistochemical staining for the TRPC5, TRPC6, TRPM4, and TRPM5 channels also revealed a qualitative difference between the MOB and AOB only in the case of TRPM4. As displayed in Figure 10B, whereas in both bulbs mitral cells express TRPM4 in their soma (yellow arrows), only AOB mitral cells extensively express the channel in their dendritic tufts, located in the glomerular layer (red arrows). Therefore, we focused our analysis on the TRPM4 channel, using electrophysiological recordings in the absence and presence of 9-phenanthrol (100 μm), a specific blocker of TRPM4 (Grand et al., 2008). As shown in Figure 10, C and D, the duration of the typical prolonged response of an AOB neuron to EPSC-like current was drastically reduced in the presence of the blocker. This result was confirmed in population analysis of eight cells, showing that both the firing response (Fig. 10E) and the underlying voltage trajectory (Fig. 10F) are significantly shortened by blocking the TRPM4 channel. Statistical analysis revealed that both the response duration (t(7) = 3.71, p < 0.01) and firing decay time (t(7) = 2.66, p < 0.05) are significantly reduced by the presence of 9-phenanthrol. These effects are similar to the effects of BAPTA (Fig. 6) and FFA (Fig. 7) on the AOB prolonged responses. Thus, we suggest that TRPM4 is involved in mediating the prolonged Ican-mediated response in AOB mitral cells.
Figure 10.

The persistent firing response of AOB mitral cells involves TRPM4 channels. A, The ratio between AOB and MOB mRNA levels of five TRP candidate genes. TRPM4 shows the most significant difference with approximately twofold higher mRNA level in the AOB. Results average three independent experiments, each done in triplicate. B, Immunohistochemical staining of AOB (left) and MOB (right) slices to TRPM4. Although both structures show TRPM4 expression in the soma of their mitral cells (yellow arrows, higher magnification below), only the AOB shows intense signal in the glomerular layer (red arrows), most likely because of TRPM4 expression in the dendritic tufts of the mitral cells. C, D, Typical voltage responses of an AOB mitral cell to injection of EPSC-like currents (80 pA) in the absence (C) and presence (D) of 9-phenanthrol (100 μm) in the intracellular solution. E, Mean PSTHs of the responses of eight AOB cells (7 animals) recorded before (blue) and during (red) the presence of 9-phenanthrol (100 μm) in the bath solution. The TRPM4 blocker significantly reduces the prolonged firing response of the cells. F, Mean voltage trajectories of the responses analyzed in E in both conditions. The trajectory fell significantly faster in the presence of 9-phenanthrol.
Discussion
We demonstrated that MOB and AOB mitral cells recorded from acute brain slices differ markedly in their responses to brief electrical stimulation of afferent SFs. Whereas MOB mitral cells respond with a robust but always transient firing, AOB mitral cells display milder responses but might respond with persistent firing when strongly stimulated. Using injections of EPSC-like currents, we showed that the different behaviors displayed by MOB and AOB mitral cells in response to similar stimuli are caused by their distinct intrinsic properties. Moreover, we found that the sustained responses of AOB mitral cells are mediated by FFA-sensitive calcium-activated nonselective cationic current (Ican). This current seems to be at least partially conducted via TRPM4 channels.
Prolonged responses of AOB mitral cells
In vivo studies demonstrated that, whereas the response of MOB mitral cells is locked to the time of stimulation (Cang and Isaacson, 2003; Davison and Katz, 2007), the firing rate of AOB mitral cells remained above the base level for 10–30 s (Luo et al., 2003). It was suggested that a peripheral mechanism involving slow ligand clearance from the VNO lumen underlies the AOB extended responses (Luo et al., 2003). It was also shown that VNO sensory neurons may respond to stimuli with persistent firing (Ukhanov et al., 2007). Nonetheless, our results suggest that the prolonged firing of AOB mitral cells at least partially reflects their specific electrophysiological properties. We further propose that a short train of spikes causes a massive calcium influx into AOB mitral cells, which in turn induces a prolonged inward current that depolarizes the cell for an extended period. The slow dynamics of this inward current remain unexplained. We excluded the possibility that it is attributable to a positive feedback loop between firing activity, calcium influx, and inward current. Other possible mechanisms are the biophysical properties of the underlying conductance, the dynamics of free intracellular calcium, or the dynamics of a possible biochemical pathway that link the elevated calcium to the activation of the inward current.
The biophysical mechanism underlying persistent firing in AOB mitral cells
Our conclusion that Ican is involved in the prolonged response of AOB mitral cells is based on three findings. First, a significant reduction in the persistent activity was observed in the presence of BAPTA, suggesting calcium dependence. Second, the estimated reversal potential of the conductance change ranged from −20 and −40 mV, suggesting a nonselective cationic current (Teruyama and Armstrong, 2007). Third, FFA, a well known blocker of Ican (Partridge and Valenzuela, 2000), blocked the prolonged firing. FFA is not a very specific Ican blocker and has been reported to affect other currents, as well (Wang et al., 2006). However, the low effective concentration (50 μm) we used strongly supports the involvement of Ican. The identity of the channel mediating Ican is controversial, and several TRP channels are candidates in various neuronal systems (Hofmann et al., 2003; Demion et al., 2007; Mironov, 2008; Wang et al., 2011). Especially, TRPC5 and TRPC6 were found to mediate carbachol-induced Ican in the cerebral cortex (Yan et al., 2009), whereas TRPM4 and TRPM5 were implicated in the supraoptic nucleus (SON) (Armstrong et al., 2010). Here we provided electrophysiological evidence for the involvement of TRPM4 in the Ican-mediated responses of AOB mitral cells. It should be noted that our results does not exclude the possibility that other TRP channels also participate in these responses.
The involvement of TRPM4 is also supported by several lines of similarity between our data and the results reported for vasopressinergic SON neurons. First, the reversal potential of the prolonged inward current measured by us is similar to the Ican reversal potential in SON neurons (Teruyama and Armstrong, 2007). In contrast, in other brain areas, such as the entorhinal cortex, in which TRPC5 or TRPC6 seem to dominate, a more depolarized reversal potential was measured (Gee et al., 2003; Zhang et al., 2011). Second, unlike the self-sustained firing found to be mediated by TRPC channels in the entorhinal cortex, both the AOB and SON neurons produce persistent firing activity that is spontaneously terminated after several tens of seconds. This difference may be related to the high calcium conductance of TRPC as opposed to TRPM channels (Venkatachalam and Montell, 2007; Birnbaumer, 2009). Third, Ican involvement in sustained neuronal activity in the cortex has been associated with the activation of metabotropic receptors, such as the M1 muscarinic or mGluR1 metabotropic glutamate receptors (Gee et al., 2003; Yoshida et al., 2008; Zhang and Séguéla, 2010; Rahman and Berger, 2011). In the AOB and the SON, in contrast, Ican is readily activated in the absence of metabotropic receptor agonists. Nevertheless, because application of mGluR1 agonist (DHPG) caused Ican induction in AOB mitral cells (Fig. 9F), it is possible that in vivo mGluR1 activation facilitates the generation of prolonged firing when AOB mitral cells are stimulated by synaptic inputs.
Regulation of Ican induction
Persistent activity in the AOB appears closely regulated by synaptic transmitters, such as GABA. In 25–30% of the AOB neurons, the initial transient excitatory phase was followed by a prolonged GABAA-mediated inhibition. In these cells, blocking GABAA receptors exposed the typical sustained response of the AOB mitral cells. Thus, activity of the local GABAergic network appears capable of preventing the transition of AOB mitral cells from the transient to the sustained mode of response. This may serve to avoid sustained activity in the presence of certain combinations of pheromones, which may be related to specific social contexts or individuals. Moreover, acetylcholine, known to regulate Ican-dependent persistent activity in various brain areas (Fransén et al., 2006; Zhang and Séguéla, 2010; Rahman and Berger, 2011), was shown recently to affect the excitability of AOB mitral cells (Smith and Araneda, 2010). It is therefore tempting to hypothesize that Ican activity is a highly regulated central element of AOB physiology on which multiple neuromodulatory pathways converge to determine the behavioral and endocrine effects of AOS activity.
Differences between AOB and MOB mitral cells
The differences in the intrinsic properties of the two mitral cell populations suggest that they operate in different modes. The short burst of intense firing closely related to the input seen in the MOB mitral cells indicates that MOB neurons analyze the components of a processed semiochemical blend. In contrast, the long-lasting lower-frequency firing of AOB neurons suggests that AOB neurons integrate these components to perceive the social context.
This hypothesis is further supported by the very different circuitry in the MOBs and AOBs. Through its single dendritic tuft that innervates a single glomerulus, each MOB mitral cell receives direct excitatory sensory information from only one receptor type (Chen and Shepherd, 2005; Lledo et al., 2005; Wilson and Mainen, 2006). In contrast, we showed previously (Wagner et al., 2006) that AOB mitral cells, with their multiple dendritic tufts, receive input from several glomeruli innervated by various types of VNO receptor neurons. Based on these differences in neuronal responses and circuitry, we suggest (Dulac and Wagner, 2006) that the MOB is best suited for dissecting a pheromonal blend into its individual components and analyzing them separately, whereas the AOB is more suited for an integrative processing of the pheromonal information.
In summary, we describe for the first time persistent activity in AOB mitral cells after brief SF stimulation. This activity is associated with a specific ionic conductance under strict neuronal control. We hypothesize that this activity induces a certain sensory state in the olfactory system that encodes the social context of the animal.
Footnotes
This work was supported by Israel Science Foundation Grant 1082/07 and National Institute for Psychobiology in Israel Grant 237-07-08. We thank Dr. Niva Shraga-Heled for her excellent technical assistance.
References
- Aoyagi T, Kang Y, Terada N, Kaneko T, Fukai T. The role of Ca2+-dependent cationic current in generating gamma frequency rhythmic bursts: modeling study. Neuroscience. 2002;115:1127–1138. doi: 10.1016/s0306-4522(02)00537-7. [DOI] [PubMed] [Google Scholar]
- Armstrong WE, Wang L, Li C, Teruyama R. Performance, properties and plasticity of identified oxytocin and vasopressin neurones in vitro. J Neuroendocrinol. 2010;22:330–342. doi: 10.1111/j.1365-2826.2010.01989.x. [DOI] [PMC free article] [PubMed] [Google Scholar]
- Aroniadou-Anderjaska V, Ennis M, Shipley MT. Dendrodendritic recurrent excitation in mitral cells of the rat olfactory bulb. J Neurophysiol. 1999;82:489–494. doi: 10.1152/jn.1999.82.1.489. [DOI] [PubMed] [Google Scholar]
- Birnbaumer L. The TRPC class of ion channels: a critical review of their roles in slow, sustained increases in intracellular Ca2+ concentrations. Annu Rev Pharmacol Toxicol. 2009;49:395–426. doi: 10.1146/annurev.pharmtox.48.113006.094928. [DOI] [PubMed] [Google Scholar]
- Brennan PA, Kendrick KM. Mammalian social odours: attraction and individual recognition. Philos Trans R Soc Lond B Biol Sci. 2006;361:2061–2078. doi: 10.1098/rstb.2006.1931. [DOI] [PMC free article] [PubMed] [Google Scholar]
- Cang J, Isaacson JS. In vivo whole-cell recording of odor-evoked synaptic transmission in the rat olfactory bulb. J Neurosci. 2003;23:4108–4116. doi: 10.1523/JNEUROSCI.23-10-04108.2003. [DOI] [PMC free article] [PubMed] [Google Scholar]
- Castro JB, Urban NN. Subthreshold glutamate release from mitral cell dendrites. J Neurosci. 2009;29:7023–7030. doi: 10.1523/JNEUROSCI.5606-08.2009. [DOI] [PMC free article] [PubMed] [Google Scholar]
- Chen WR, Shepherd GM. Membrane and synaptic properties of mitral cells in slices of rat olfactory bulb. Brain Res. 1997;745:189–196. doi: 10.1016/s0006-8993(96)01150-x. [DOI] [PubMed] [Google Scholar]
- Chen WR, Shepherd GM. The olfactory glomerulus: a cortical module with specific functions. J Neurocytol. 2005;34:353–360. doi: 10.1007/s11068-005-8362-0. [DOI] [PubMed] [Google Scholar]
- Christie JM, Westbrook GL. Lateral excitation within the olfactory bulb. J Neurosci. 2006;26:2269–2277. doi: 10.1523/JNEUROSCI.4791-05.2006. [DOI] [PMC free article] [PubMed] [Google Scholar]
- Davison IG, Katz LC. Sparse and selective odor coding by mitral/tufted neurons in the main olfactory bulb. J Neurosci. 2007;27:2091–2101. doi: 10.1523/JNEUROSCI.3779-06.2007. [DOI] [PMC free article] [PubMed] [Google Scholar]
- De Saint Jan D, Westbrook GL. Disynaptic amplification of metabotropic glutamate receptor 1 responses in the olfactory bulb. J Neurosci. 2007;27:132–140. doi: 10.1523/JNEUROSCI.2439-06.2007. [DOI] [PMC free article] [PubMed] [Google Scholar]
- Del Punta K, Puche A, Adams NC, Rodriguez I, Mombaerts P. A divergent pattern of sensory axonal projections is rendered convergent by second-order neurons in the accessory olfactory bulb. Neuron. 2002;35:1057–1066. doi: 10.1016/s0896-6273(02)00904-2. [DOI] [PubMed] [Google Scholar]
- Demion M, Bois P, Launay P, Guinamard R. TRPM4, a Ca2+-activated nonselective cation channel in mouse sino-atrial node cells. Cardiovasc Res. 2007;73:531–538. doi: 10.1016/j.cardiores.2006.11.023. [DOI] [PubMed] [Google Scholar]
- Dong C, Godwin DW, Brennan PA, Hegde AN. Protein kinase Calpha mediates a novel form of plasticity in the accessory olfactory bulb. Neuroscience. 2009;163:811–824. doi: 10.1016/j.neuroscience.2009.06.069. [DOI] [PMC free article] [PubMed] [Google Scholar]
- Dulac C, Torello AT. Molecular detection of pheromone signals in mammals: from genes to behaviour. Nat Rev Neurosci. 2003;4:551–562. doi: 10.1038/nrn1140. [DOI] [PubMed] [Google Scholar]
- Dulac C, Wagner S. Genetic analysis of brain circuits underlying pheromone signaling. Annu Rev Genet. 2006;40:449–467. doi: 10.1146/annurev.genet.39.073003.093937. [DOI] [PubMed] [Google Scholar]
- Egorov AV, Hamam BN, Fransén E, Hasselmo ME, Alonso AA. Graded persistent activity in entorhinal cortex neurons. Nature. 2002;420:173–178. doi: 10.1038/nature01171. [DOI] [PubMed] [Google Scholar]
- Ennis M, Zhu M, Heinbockel T, Hayar A. Olfactory nerve-evoked, metabotropic glutamate receptor-mediated synaptic responses in rat olfactory bulb mitral cells. J Neurophysiol. 2006;95:2233–2241. doi: 10.1152/jn.01150.2005. [DOI] [PMC free article] [PubMed] [Google Scholar]
- Fransén E, Tahvildari B, Egorov AV, Hasselmo ME, Alonso AA. Mechanism of graded persistent cellular activity of entorhinal cortex layer v neurons. Neuron. 2006;49:735–746. doi: 10.1016/j.neuron.2006.01.036. [DOI] [PubMed] [Google Scholar]
- Gee CE, Benquet P, Gerber U. Group I metabotropic glutamate receptors activate a calcium-sensitive transient receptor potential-like conductance in rat hippocampus. J Physiol. 2003;546:655–664. doi: 10.1113/jphysiol.2002.032961. [DOI] [PMC free article] [PubMed] [Google Scholar]
- Ghamari-Langroudi M, Bourque CW. Flufenamic acid blocks depolarizing afterpotentials and phasic firing in rat supraoptic neurones. J Physiol. 2002;545:537–542. doi: 10.1113/jphysiol.2002.033589. [DOI] [PMC free article] [PubMed] [Google Scholar]
- Grand T, Demion M, Norez C, Mettey Y, Launay P, Becq F, Bois P, Guinamard R. 9-phenanthrol inhibits human TRPM4 but not TRPM5 cationic channels. Br J Pharmacol. 2008;153:1697–1705. doi: 10.1038/bjp.2008.38. [DOI] [PMC free article] [PubMed] [Google Scholar]
- Hofmann T, Chubanov V, Gudermann T, Montell C. TRPM5 is a voltage-modulated and Ca2+-activated monovalent selective cation channel. Curr Biol. 2003;13:1153–1158. doi: 10.1016/s0960-9822(03)00431-7. [DOI] [PubMed] [Google Scholar]
- Isaacson JS. Glutamate spillover mediates excitatory transmission in the rat olfactory bulb. Neuron. 1999;23:377–384. doi: 10.1016/s0896-6273(00)80787-4. [DOI] [PubMed] [Google Scholar]
- Keverne EB. Mammalian pheromones: from genes to behaviour. Curr Biol. 2002;12:R807–R809. doi: 10.1016/s0960-9822(02)01314-3. [DOI] [PubMed] [Google Scholar]
- Lledo PM, Gheusi G, Vincent JD. Information processing in the mammalian olfactory system. Physiol Rev. 2005;85:281–317. doi: 10.1152/physrev.00008.2004. [DOI] [PubMed] [Google Scholar]
- Luo M, Fee MS, Katz LC. Encoding pheromonal signals in the accessory olfactory bulb of behaving mice. Science. 2003;299:1196–1201. doi: 10.1126/science.1082133. [DOI] [PubMed] [Google Scholar]
- Major G, Tank D. Persistent neural activity: prevalence and mechanisms. Curr Opin Neurobiol. 2004;14:675–684. doi: 10.1016/j.conb.2004.10.017. [DOI] [PubMed] [Google Scholar]
- Mironov SL. Metabotropic glutamate receptors activate dendritic calcium waves and TRPM channels which drive rhythmic respiratory patterns in mice. J Physiol. 2008;586:2277–2291. doi: 10.1113/jphysiol.2007.149021. [DOI] [PMC free article] [PubMed] [Google Scholar]
- Mori K, Nagao H, Yoshihara Y. The olfactory bulb: coding and processing of odor molecule information. Science. 1999;286:711–715. doi: 10.1126/science.286.5440.711. [DOI] [PubMed] [Google Scholar]
- Munger SD, Leinders-Zufall T, Zufall F. Subsystem organization of the mammalian sense of smell. Annu Rev Physiol. 2009;71:115–140. doi: 10.1146/annurev.physiol.70.113006.100608. [DOI] [PubMed] [Google Scholar]
- Partridge LD, Valenzuela CF. Block of hippocampal CAN channels by flufenamate. Brain Res. 2000;867:143–148. doi: 10.1016/s0006-8993(00)02275-7. [DOI] [PubMed] [Google Scholar]
- Rahman J, Berger T. Persistent activity in layer 5 pyramidal neurons following cholinergic activation of mouse primary cortices. Eur J Neurosci. 2011;34:22–30. doi: 10.1111/j.1460-9568.2011.07736.x. [DOI] [PubMed] [Google Scholar]
- Salin PA, Lledo PM, Vincent JD, Charpak S. Dendritic glutamate autoreceptors modulate signal processing in rat mitral cells. J Neurophysiol. 2001;85:1275–1282. doi: 10.1152/jn.2001.85.3.1275. [DOI] [PubMed] [Google Scholar]
- Shah NM. Nursing behavior: remembrance of things past. Curr Biol. 2006;16:R842–R844. doi: 10.1016/j.cub.2006.09.001. [DOI] [PubMed] [Google Scholar]
- Smith RS, Araneda RC. Cholinergic modulation of neuronal excitability in the accessory olfactory bulb. J Neurophysiol. 2010;104:2963–2974. doi: 10.1152/jn.00446.2010. [DOI] [PMC free article] [PubMed] [Google Scholar]
- Spehr M, Spehr J, Ukhanov K, Kelliher KR, Leinders-Zufall T, Zufall F. Parallel processing of social signals by the mammalian main and accessory olfactory systems. Cell Mol Life Sci. 2006;63:1476–1484. doi: 10.1007/s00018-006-6109-4. [DOI] [PMC free article] [PubMed] [Google Scholar]
- Stowers L, Marton TF. What is a pheromone? Mammalian pheromones reconsidered. Neuron. 2005;46:699–702. doi: 10.1016/j.neuron.2005.04.032. [DOI] [PubMed] [Google Scholar]
- Tahvildari B, Alonso AA, Bourque CW. Ionic basis of ON and OFF persistent activity in layer III lateral entorhinal cortical principal neurons. J Neurophysiol. 2008;99:2006–2011. doi: 10.1152/jn.00911.2007. [DOI] [PubMed] [Google Scholar]
- Teruyama R, Armstrong WE. Calcium-dependent fast depolarizing afterpotentials in vasopressin neurons in the rat supraoptic nucleus. J Neurophysiol. 2007;98:2612–2621. doi: 10.1152/jn.00599.2007. [DOI] [PubMed] [Google Scholar]
- Teruyama R, Sakuraba M, Kurotaki H, Armstrong WE. Transient receptor potential channel m4 and m5 in magnocellular cells in rat supraoptic and paraventricular nuclei. J Neuroendocrinol. 2011;23:1204–1213. doi: 10.1111/j.1365-2826.2011.02211.x. [DOI] [PMC free article] [PubMed] [Google Scholar]
- Ukhanov K, Leinders-Zufall T, Zufall F. Patch-clamp analysis of gene-targeted vomeronasal neurons expressing a defined V1r or V2r receptor: ionic mechanisms underlying persistent firing. J Neurophysiol. 2007;98:2357–2369. doi: 10.1152/jn.00642.2007. [DOI] [PubMed] [Google Scholar]
- Venkatachalam K, Montell C. TRP channels. Annu Rev Biochem. 2007;76:387–417. doi: 10.1146/annurev.biochem.75.103004.142819. [DOI] [PMC free article] [PubMed] [Google Scholar]
- Wagner S, Gresser AL, Torello AT, Dulac C. A multireceptor genetic approach uncovers an ordered integration of VNO sensory inputs in the accessory olfactory bulb. Neuron. 2006;50:697–709. doi: 10.1016/j.neuron.2006.04.033. [DOI] [PubMed] [Google Scholar]
- Wang D, Grillner S, Wallén P. Effects of flufenamic acid on fictive locomotion, plateau potentials, calcium channels and NMDA receptors in the lamprey spinal cord. Neuropharmacology. 2006;51:1038–1046. doi: 10.1016/j.neuropharm.2006.06.012. [DOI] [PubMed] [Google Scholar]
- Wang S, Zhang AP, Kurada L, Matsui T, Lei S. Cholecystokinin facilitates neuronal excitability in the entorhinal cortex via activation of TRPC-like channels. J Neurophysiol. 2011;106:1515–1524. doi: 10.1152/jn.00025.2011. [DOI] [PMC free article] [PubMed] [Google Scholar]
- Wilson RI, Mainen ZF. Early events in olfactory processing. Annu Rev Neurosci. 2006;29:163–201. doi: 10.1146/annurev.neuro.29.051605.112950. [DOI] [PubMed] [Google Scholar]
- Yan HD, Villalobos C, Andrade R. TRPC channels mediate a muscarinic receptor-induced afterdepolarization in cerebral cortex. J Neurosci. 2009;29:10038–10046. doi: 10.1523/JNEUROSCI.1042-09.2009. [DOI] [PMC free article] [PubMed] [Google Scholar]
- Yoshida M, Hasselmo ME. Persistent firing supported by an intrinsic cellular mechanism in a component of the head direction system. J Neurosci. 2009;29:4945–4952. doi: 10.1523/JNEUROSCI.5154-08.2009. [DOI] [PMC free article] [PubMed] [Google Scholar]
- Yoshida M, Fransén E, Hasselmo ME. mGluR-dependent persistent firing in entorhinal cortex layer III neurons. Eur J Neurosci. 2008;28:1116–1126. doi: 10.1111/j.1460-9568.2008.06409.x. [DOI] [PMC free article] [PubMed] [Google Scholar]
- Zhang Z, Séguéla P. Metabotropic induction of persistent activity in layers II/III of anterior cingulate cortex. Cereb Cortex. 2010;20:2948–2957. doi: 10.1093/cercor/bhq043. [DOI] [PubMed] [Google Scholar]
- Zhang Z, Reboreda A, Alonso A, Barker PA, Séguéla P. TRPC channels underlie cholinergic plateau potentials and persistent activity in entorhinal cortex. Hippocampus. 2011;21:386–397. doi: 10.1002/hipo.20755. [DOI] [PubMed] [Google Scholar]
- Zibman S, Shpak G, Wagner S. Distinct intrinsic membrane properties determine differential information processing between main and accessory olfactory bulb mitral cells. Neuroscience. 2011;189:51–67. doi: 10.1016/j.neuroscience.2011.05.039. [DOI] [PubMed] [Google Scholar]