

Abstract
Hypothesis:
Vocal fold vibration may physically raise intravascular pressure to levels high enough to damage capillaries and result in leakage of erythrocytes. This type of injury is commonly seen in benign vocal fold lesions and is not well explained.
Study Design:
Theoretical, retrospective.
Methods:
The relationship of intravascular pressure to vibration frequency and amplitude is derived and confirmed with a physical blood vessel model, then applied to published human measurements to estimate human intravascular pressures.
Results:
Vocal fold intravascular pressure is predicted to have a quadratic dependence on both frequency and amplitude. During speaking, the pressure may rise to over 20 cmH2O, and may reach levels far higher for screaming and singing. Such pressure magnitudes are known to trigger inflammatory cascades and can lead to fluid leakage. They also have the potential for pharmacologic control with β-agonists.
Conclusions:
Intravascular pressure likely rises significantly during vocal fold vibration and may lead to the type of injury seen in benign vocal fold lesions. The results support voice therapy aimed at reducing vibratory amplitude. More vibratory amplitude measurements need to be performed in a wider range of subjects before the full range of human vocal fold vascular pressures can be estimated.
Keywords: Benign vocal fold lesions, fluid dynamics, intravascular pressure, vibratory amplitude
INTRODUCTION
Several histologically-related benign vocal fold lesions—nodules, polyps, and Reinke’s edema—are widely believed to be the result of voice-related trauma since they occur frequently in individuals who use their voice professionally, excessively, or incorrectly.1,2 Increased collision forces3 and increased Bernoulli separation forces4 are thought to be the underlying mechanisms for the formation of these lesions based on their location and associated histologic findings5; however, it is difficult to separate the damage that may have led to the lesions from the damage caused by the lesions. All three of the lesions display blood vessel disruption with leakage of erythrocytes,6–8 and this is thought to lead to edema, scarring, and excessive vessel proliferation.6 Current treatment assumes that physical trauma leads to vessel damage,9–11 although attempts at reproducing phonotrauma through excessive voice use during in vivo canine studies lead to only slightly similar patterns of injury, with comparable lesions occurring only where vessel damage may have previously been present.12
The stress experienced by the vocal fold vasculature is unique due to the flow of incompressible fluid within the vessels. The acceleration from vocal fold vibration leads to a movement of fluid toward the midpoint of the vocal folds13 and may create a buildup of intravascular pressure. Studies performed on rabbit lungs and frog intestinal capillaries show that pressures between 40 and 80 cmH2O, respectively, can lead to capillary failure and leakage of erythrocytes.14,15 Even small rises in pressure can trigger inflammatory pathways through Ca2+ dependent intracellular signaling.16 The pressure inside the vocal fold capillary network during phonation is unknown and may be dependent on various phonotary parameters. In this study, we derive a mathematical theory for the acceleration-induced rise in pressure in small vessels and confirm it experimentally using a physical vibrating-tube model. To get a sense of the magnitude of this effect in the human vocal folds, we then apply this theory to published measurements of normal human phonation.
MATERIALS AND METHODS
Theoretical Model
In this study we focus on the small blood vessels in the lamina propria of the vocal folds. These vessels run parallel to the glottic edge in the anterior-posterior axis,17 and we assume that they oscillate sinusoidally with the rest of the tissue.18 We will isolate one such vessel that is within the middle lamina propria layers away from the mucosal wave and oscillates in only one plane (Fig. 1). The lateral motion y(x, t) of a point in this vessel can be described by a sine function oscillating in time multiplied by an amplitude function a(x).
| (1) |
where f is the fundamental frequency, t is time, and x is the anterior-posterior axis coordinate. Taking the derivative twice and multiplying by mass gives the lateral force Fy(x, t) necessary to maintain this vibration:
| (2) |
The mass is given by the density ρ of the liquid in the vessel and a small volume V. Notice that this expression contains equation one multiplied by negative constants, i.e., the direction of the force on the fluid is always opposite the position. Therefore, the inertia of the fluid always points away from the y-axis and will lead to fluid movement toward the most lateral tube location, which would usually be at the midpoint of the membranous vocal folds. Integrating the force component in the direction along the vessel, from a fixed endpoint, amplitude 0, to the midpoint, with maximum amplitude A, gives the pressure from the forces along the vessel:
| (3) |
This is the pressure in the entire segment of the vessel. Each point also experiences a force perpendicular to the vessel surface, which is maximal at the point with the greatest lateral displacement or amplitude. For small vessels, the additional pressure from this force is much smaller than from the additive forces summed in equation three, however, it raises the stress at this location.
Fig. 1.
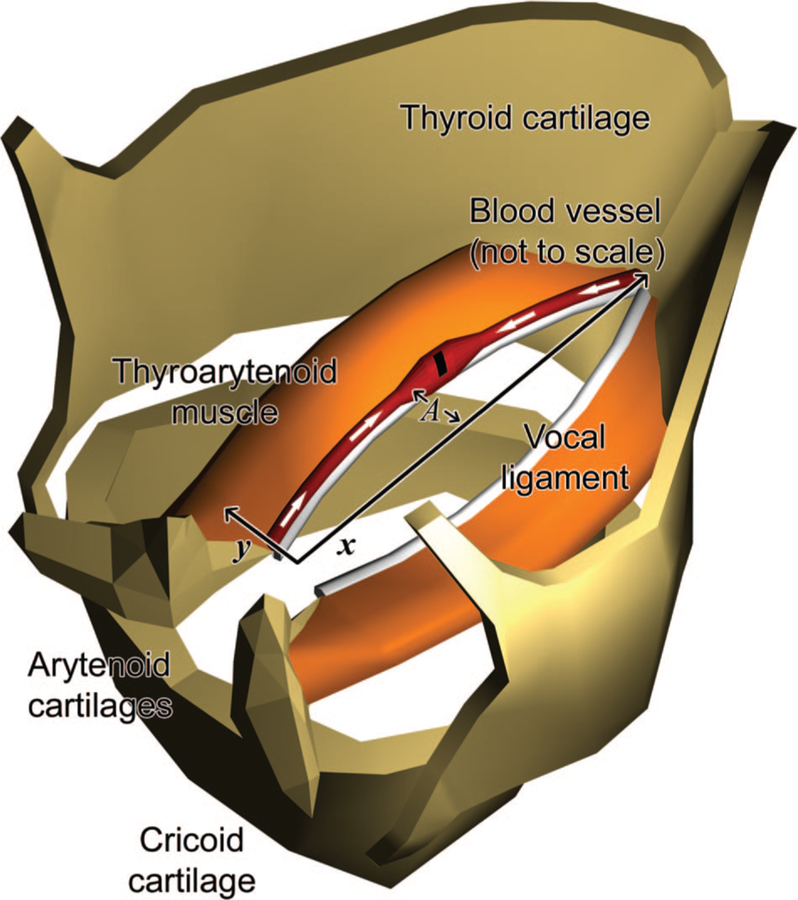
Diagram of a swollen damaged vocal fold blood vessel (not to scale) in relation to the vocal ligament, thyroarytenoid muscle, and laryngeal cartilages. We simplified vessel vibration to lateral motion along the y-direction. The white arrows show the compression of fluid within the vessel from the inertial forces. A indicates the maximum amplitude.
Physical Model
The physical model (Fig. 2) consisted of a latex tube held rigidly in place on both ends and suspended above an electromagnetic coil powered by a square wave generator. Two small doughnut-shaped neodymium magnets positioned 3 cm apart in the middle of the tube coupled the tube to the electromagnet. One end of the tube was sealed, and the other end was connected to a water-filled container elevated 5 cm above the level of the tube. The vacuum pressure in the air space above the water in the container was measured using a vacuum gauge.
Fig. 2.
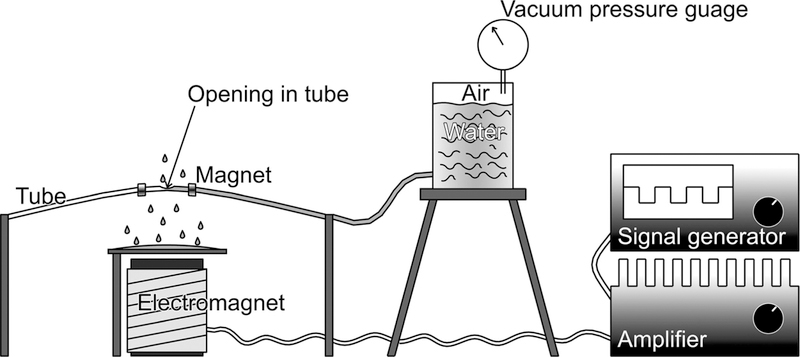
Physical model simulating the vocal fold vessels with a latex tube driven by an electromagnet.
A small hole was cut either halfway, one-third, or one-sixth down the length of the tube. These three different positions served to confirm that the span of the vessel in the vocal folds has no consequence on the buildup of pressure. Two different inner tube diameters, 1.6 mm and 3.2 mm, and several different lengths, 14.5 to 23 cm, were also used to exclude the influence of vessel diameter and vocal fold length on the pressure.
Each experimental trial began by first allowing the water to drain through the tube while it was at rest until the vacuum pressure in the container became equivalent to the elevation of the water above the tube opening. Then the tube was driven into single-mode oscillation near its fundamental frequency with the electromagnet. The frequency was increased in increments of 0.5 Hz and the pressure was recorded. A long-exposure digital photograph was taken at each measurement. The amplitude of vibration increased with increasing frequency until the tube abruptly stopped vibrating. The pressure was then allowed to equilibrate to the new water level.
During data analysis, the influence of gravity on the pressure measurements was subtracted using the initial and final stationary measurements. The photographs were calibrated with a ruler placed near the tube. The amplitudes were determined from the photographs using CAD (computer-aided design) software.
Human Vibratory Parameters
The frequency range of human phonation is easily measured and ranges from 100 Hz to 250 Hz while speaking, reaching over 1,000 Hz while singing.19 Vibratory amplitude is much more difficult to measure accurately, as fiber optic and rigid laryngo-scopes are difficult to calibrate. This problem can be overcome by shining a low-energy parallel laser beam of known spacing onto structures within the viewing field. Figure 3A shows the results of measurement taken by Schuster et al. in the only published data set using this method.20
Fig. 3.

(A) Laser calibrated amplitude and frequency measurements of 13 female and 9 male volunteers with no signs, symptoms, or history of voice disorders, taken from a study by Schuster et al.20 (B) Estimated peak pressure values with respect to frequency when the measurements from (A) are plugged into equation three with sin2= 1. The fluid density of capillary blood was used for ρ, 1040 kg/m3. The mean and standard deviation of the amplitudes in (A) were used to plot the mean and standard deviation of the estimated peak pressure values in (B).
RESULTS
Theoretical Model
The theoretical model predicts that fluid pressure rises in vibrating vessels in proportion to frequency and amplitude squared. This pressure oscillates during the vibratory cycle. The average and peak pressure can be determined by substituting the maximum and average of sin2, 1, and 0.5 into equation three. The other constants simplify to 0.0002 cmH2O/mm2 Hz2 using the average density of blood. Multiplying this value by fundamental frequency and vibratory amplitude squared provides an estimate for the peak capillary pressure in vocal fold vessels.
Physical Model
The vibrating tube model pumped water through the tube until the magnitude of the vacuum pressure generated in the water container stopped the flow. Table I shows the results of each trial. The slope column corresponds to Figure 4, which is a plot of the pressure versus the amplitude and frequency squared for each trial. The theoretical slope was obtained from the constants in equation three using the density of water for ρ and 0.5 for the average of sin2. The tube diameter, length, and hole position did not show any predictable effect on pressure. During the experiment, the amplitude showed a linear correlation with the frequency as the latter was raised. To examine whether amplitude and frequency independently affected the pressure, the amplitude was kept constant in trial 1 by adjusting the length of the tube. This tuned the tension to match the rises in frequency. The results demonstrate excellent linear correlation coefficients to equation three and an error of about 10% for the predicted slope (Table I).
TABLE I.
Linear Regression Analysis of Pressure vs. Frequency and Amplitude Squared for the Physical Model.
| Trial | Tube Diameter (mm) | Length (cm) | Hole Location on Tube* | Slope (cmH2O s2/m2) | X-Intercept (cmH2O) | Standard Error | R Value |
|---|---|---|---|---|---|---|---|
| 1 | 1.6 | 14.5–16 | Midpoint | 84.2 | −0.27 | 2.32 | 0.984 |
| 2 | 1.6 | 14.7 | Midpoint | 92.9 | 0.24 | 1.72 | 0.998 |
| 3 | 1.6 | 19 | Midpoint | 93.6 | 0.71 | 1.55 | 0.999 |
| 4 | 1.6 | 23 | Midpoint | 84.8 | −0.45 | 1.43 | 0.993 |
| 5 | 1.6 | 15.9 | Midpoint | 79.9 | 0.83 | 2.20 | 0.989 |
| 6 | 1.6 | 15.9 | One-third point | 79.8 | 0.68 | 2.43 | 0.976 |
| 7 | 1.6 | 15.9 | One-sixth point | 107.6 | −0.06 | 5.35 | 0.976 |
| 8 | 3.2 | 21.8 | Midpoint | 96.8 | 0.30 | 3.50 | 0.991 |
| All data | 89.4 | 0.00 (set) | 0.92 | 0.983 | |||
| Theoretical average† | 100.75 | ||||||
| Theoretical peak‡ | 201.5 | ||||||
Relative to end connected to water container;
Sine = 0.5 in equation three;
Sine = 1 in equation three.
Fig. 4.

Pressure plotted with respect to frequency squared and amplitude squared for each trial of the vibrating tube experiment. The trial numbers, linear regression, and theoretical average correspond to Table I. The inset enlarges the boxed area in the main graph.
Human Intravascular Pressure Estimate
The human amplitude and frequency data from Schuster et al. were applied to equation three to estimate the peak pressure magnitude in the blood vessels of speaking adults. The results predict that peak pressures range between 0 to 20 cmH2O in healthy volunteers speaking with fundamental frequencies between 119 Hz to 555 Hz (Fig. 3B). To examine how this may change for frequencies higher than 550 Hz, the mean and SD of the available amplitudes were extrapolated to higher frequencies. This demonstrates that at amplitudes approaching 1 mm, fundamental frequencies greater then 600 Hz rapidly raise peak intravascular pressures to 50 cmH2O and higher.
DISCUSSION
This study used a mathematical and physical model to demonstrate that fluid within a vibrating vessel moves toward the point in the vessel with the highest vibratory amplitude. In sealed vessels, this leads to a rise in the pressure within the vessel proportional to frequency and amplitude squared. The mathematical model provides a quantitative description of this behavior and shows that it is a consequence of the forces necessary to keep the fluid vibrating along with the vessel. Since this is a physical phenomenon, it can be applied to any similarly oscillating fluid filled vessel.
This theory was applied to human vocal fold vessels using frequency and amplitude measurements of healthy speaking adults. It predicted an additional 0 to 20 cmH2O of intravascular pressure during phonation, far lower than the 40 to 80 cmH20 of pressure observed to rupture other microvessels.14–15 Therefore, this effect has probably minimal negative consequences in the general population. However, when the amplitude range of speaking adults is extended to the frequencies of soprano singers, the intravascular pressures rises dramatically. Although vibratory amplitude is expected to decrease at high vibration frequencies due to a rise in tension, we observed the reverse in our physical model. Similarly, many untrained singers inadvertently raise their pitch when singing louder.19 This occurs with large amplitudes of vibration, which lead to increased length, tension, and fundamental frequency.21 These situations could lead to severe vessel damage.
Our physical model differs in some aspects from human vessels. Vocal fold blood vessels are embedded in soft tissue, therefore, a small amount of damping probably exists between the motion of the glottic edge and the motion of the vasculature. Also, the forces demonstrated in this study will pull blood away from the venous capillaries back into the vocal folds. Indirect studies measuring the flow of blood to the vocal folds have shown mixed results.22,23 and did not examine the change in blood flow under different phonotary conditions. There may be valves or local control mechanisms that keep blood flowing in the proper direction and possibly regulate the pressure, although, this phenomenon will undoubtedly exist to some degree.
One clear application of this theory is to the pathophysiology of benign vocal fold lesions, due to the similarities of their histologic findings6–8 to studies of microvessels subjected to high intravascular pressures.14,15 Unfortunately, accurate frequency and amplitude parameters are not known for individuals susceptible to benign vocal fold lesions. Our study suggests that these individuals will have higher than average fundamental frequencies and amplitudes. Singers are more susceptible to nodules1,2 and occasionally perform at high fundamental frequencies, although, as already discussed, it is difficult to predict their vibratory amplitudes. Women also have higher fundamental frequencies, and are more frequently diagnosed and treated for nodules and Reinke’s edema.1,2 Female sex hormones in general have beneficial effects on arterial vessels; however, they promote angiogenesis,24 a key factor in nodule formation.6 For women who smoke, the additional adverse effects of nicotine on vascular permeability and capillary fragility25 may make this population more susceptible to even moderately elevated vocal fold capillary pressures. Some studies show that even small rises in capillary pressure can trigger Ca2+ -dependent endothelial contraction and increases in vascular permeability.16 Furthermore, mechanically stretched endothelial cells trigger inflammatory cascades that persist long after the increased stress has subsided.16
These results support voice therapy aimed at reducing glottic amplitudes at high frequencies, which can be accomplished by decreasing sound intensity. One very exciting aspect of this theory is the possibility for future pharmacologic therapy. β-adrenergic agonists26 and calcium channel blockers27 decrease pressure and inflammation-induced rises in hydraulic permeability. The relationship of these medications to benign vocal lesions has not been studied, and topical means of drug delivery may need to be developed to overcome side effects,28,29 however, they may greatly augment non-surgical treatment of these lesions.
CONCLUSION
This study predicts that intravascular pressure rises during vocal fold vibration near a magnitude that would cause concern for vessel damage and extravasation of erythrocytes. Further amplitude and frequency measurements need to be performed before the full range of pressures in the vasculature and the impact they have on pathology can be deduced. These measurements should include patients who push phonation to the extreme, such as singers and patients with recurrent benign vocal fold lesions.
Acknowledgments
This work was supported by NIH grant 1-R01DC0552207, 1-RO1DC006019, and 1-RO1DC05522 from the National Institute of Deafness and other Communication Disorders.
BIBLIOGRAPHY
- 1.Herrington-Hall B, Lee L, Stemple J, Niemi K, McHone M. Description of laryngeal pathologies by age, gender, and occupation in a treatment seeking sample. J Speech Hear Disord 1988;53:57–64. [DOI] [PubMed] [Google Scholar]
- 2.Coyle S, Weinrich B, Stemple J. Shifts in relative prevalence of laryngeal pathology in a treatment-seeking population. J Voice 2001;15:424–440. [DOI] [PubMed] [Google Scholar]
- 3.Jiang J, Titze I. Measurement of vocal fold intraglottal pressure and impact stress. J Voice 1994;8:132–144. [DOI] [PubMed] [Google Scholar]
- 4.Dikkers F, Nikkels P. Benign lesions of the vocal folds: histopathology and phonotrauma. Ann Otol Rhinol Laryngol 1995;104:698–703. [DOI] [PubMed] [Google Scholar]
- 5.Courey M, Shohet J, Scott M, Ossoff R. Immunohistochemical characterization of benign laryngeal lesions. Ann Otol Rhinol Laryngol 1996;105:525–531. [DOI] [PubMed] [Google Scholar]
- 6.Kleinsasser O Pathogenesis of vocal cord polyps. Ann Otol Rhinol Laryngol 1982;92:378–381. [DOI] [PubMed] [Google Scholar]
- 7.Kotby M, Nassar A, Seif E, Helal E, Saleh M. Ultrastructural features of vocal fold nodules and polyps. Acta Otolaryngol 1988;105:477–482. [DOI] [PubMed] [Google Scholar]
- 8.Sato K, Hirano M, Nakashima T. Electron microscopic and immunohistochemical investigation of Reinke’s edema. Ann Oto Rhinol Laryngol 1999;108:1068–1072. [DOI] [PubMed] [Google Scholar]
- 9.Titze I Mechanical Stress in Phonation. J Voice 1994;8: 99–105. [DOI] [PubMed] [Google Scholar]
- 10.Jiang J, Diaz C, Hanson D. Finite element modeling of vocal fold vibration in normal phonation and hyperfunctional dysphonia: implications for the pathogenesis of vocal nodules. Ann Otol Rhinol Laryngol 1998;107:603–610. [DOI] [PubMed] [Google Scholar]
- 11.Gunter H Modeling mechanical stresses as a factor in the etiology of benign vocal fold lesions. J Biomech 2004;37: 1119–1124. [DOI] [PubMed] [Google Scholar]
- 12.Gray S, Titze I. Histologic investigation of hyperphonated canine vocal cords. Ann Otol Rhinol Laryngol 1988;97: 381–388. [DOI] [PubMed] [Google Scholar]
- 13.Jiang J A methodological study of hemilaryngeal phonation and the measurement of vocal fold intraglottal pressure and impact stress [dissertation] Iowa City, IA: University of Iowa; 1991. [Google Scholar]
- 14.Neal C, Michel C. Openings in frog microvascular endothelium induced by high intravascular pressures. J Physiol 1996;492:39–52. [DOI] [PMC free article] [PubMed] [Google Scholar]
- 15.West J, Tsukimoto K, Mathieu-Costello, Prediletto R. Stress failure in pulmonary capillaries. J Appl Physiol 1991;70: 1731–1742. [DOI] [PubMed] [Google Scholar]
- 16.Kuebler W, Huppe H. Capillary pressure-induced lung injury: fact or fiction? Curr Opin Anaesthesiol 2002;15: 57–64. [DOI] [PubMed] [Google Scholar]
- 17.Hirano M Structure of the vocal fold in normal and disease states anatomical and physical studies. ASHA Reports 1981;11:11–30. [Google Scholar]
- 18.Titze I The physics of small-amplitude oscillation of the vocal folds. J Acoust Soc Am 1988;83:1536–1552. [DOI] [PubMed] [Google Scholar]
- 19.Titze I Principles of Voice Production Upper Saddle River, NJ: Princeton-Hall; 1994. [Google Scholar]
- 20.Schuster M, Lohscheller J, Kummer P, Eysholdt, Hoppe U. Laser projection in high-speed glottography for high-precision measurements of laryngeal dimensions and dynamics. Eur Arch Otorhinolaryngol 2005;262:447–481. [DOI] [PubMed] [Google Scholar]
- 21.Titze I On the relation between subglottal pressure and fundamental frequency in phonation. J Acoust Soc Am 1989;85:901–906. [DOI] [PubMed] [Google Scholar]
- 22.Matsuo K, Masamichi O, Tomita M, Maehara N, Umezaki T, Shin T. An experimental study of the circulation of the vocal fold on phonation. Arch Otolaryngol Head Neck Surg 1987;113:414–417. [DOI] [PubMed] [Google Scholar]
- 23.Arnstein D, Berke G, Trapp T, Bell T, Natividad M. Regional blood flow of the canine vocal cord: the microsphere surface technique. Otolaryngol Head Neck Surg 1990;103:371–376. [DOI] [PubMed] [Google Scholar]
- 24.Teede J Sex hormones and the cardiovascular system: effects on arterial function in women. Clin Exp Pharmacol Physio 2007;34:672–676. [DOI] [PubMed] [Google Scholar]
- 25.Bercovici B, Davis E. The effect of smoking and menopause on the small blood vessels. Microcirc Endothelium Lymphatics 1991;7:51–6. [PubMed] [Google Scholar]
- 26.Parker J, Ivey C. Isoproterenol attenuates high vascular pressure-induced permeability increases in isolated rat lungs. J Appl Physiol 1997;83:1962–1967. [DOI] [PubMed] [Google Scholar]
- 27.Mayhan W, Joyner W. The effect of altering the external calcium concentration and a calcium channel blocker, verapamil, on microvascular leaky sites and dextran clearance in the hamster cheek pouch. Microvasc Res 1984;28: 159–179. [DOI] [PubMed] [Google Scholar]
- 28.Brantigan C, Brantigan T, Joseph N. Effect of beta blockade and beta stimulation on stage fright. Am J Med 1982;72: 88–94. [DOI] [PubMed] [Google Scholar]
- 29.Gates G, Saegert J, Wilson N, Johnson L, Shepherd A, Hearne E. Effect of beta blockade on singing performance. Ann Otol Rhinol Laryngol 1985;94:570–574. [DOI] [PubMed] [Google Scholar]