

Abstract
Objectives
Hypoxia is an important factor in many aspects of stem‐cell biology including their viability, proliferation, differentiation and migration. We evaluated whether low oxygen level (2%) affected human adipose tissue mesenchymal stem‐cell (hAT‐MSC) phenotype, population growth, viability, apoptosis, necrosis and their adipogenic and osteogenic differentiation potential.
Materials and methods
hAT‐MSCs from four human donors were cultured in growth medium under either normoxic or hypoxic conditions for 7 days and were then transferred to normoxic conditions to study their differentiation potential.
Results
Hypoxia enhanced hAT‐MSC expansion and viability, whereas expression of mesenchymal markers such as CD90, CD73 and endothelial progenitor cell marker CD34, remained unchanged. We also found that pre‐culturing hAT‐MSCs under hypoxia resulted in their enhanced ability to differentiate into adipocytes and osteocytes.
Conclusions
This protocol could be useful for maximizing hAT‐MSC potential to differentiate in vitro into the adipogenic and osteogenic lineages, for use in plastic and reconstructive surgery, and in tissue engineering strategies.
Introduction
Mesenchymal stem cells (MSCs), from bone marrow or subcutaneous adipose tissue, have been explored well in terms of use for regenerative medicine. Both types of MSC have equal potential to differentiate into cells and tissues of mesodermal origin such as adipocytes, cartilage, bone and skeletal muscle 1. For regenerative therapies, adipose tissue‐derived mesenchymal cells (AT‐MSCs) have advantages due to ease of access to subcutaneous adipose tissue and simple isolation procedures.
Physiological oxygen tension in adipose tissue is typically <3%, thus AT‐MSCs reside in anatomical sites that are relatively oxygen‐deficient 2. Low‐oxygen tension is an important component of the stem‐cell microenvironment (the stem‐cell niche) and provides signals conducive to maintenance of stem‐cell function 3. Despite low‐oxygen concentration in the stem‐cell microenvironment, stem cells in the laboratory are usually cultured under normoxic conditions corresponding to atmospheric oxygen (21%). Culturing AT‐MSCs under more physiologically relevant conditions of low‐oxygen tension may uniquely benefit their expansion, differentiation, adhesion, growth factor secretion and regenerative potential. Several recent studies have investigated effects of reduced oxygen tension on human AT‐MSCs with remarkably contrasting results. Low oxygen levels (2%) seem to reduce chondrogenic and osteogenic differentiation of murine AT‐MSCs 4 and to reduce osteogenic and adipogenic differentiation of human AT‐MSCs 5, whereas moderate hypoxia (5%) has reportedly lowered proliferation rates, but enhanced chondrogenic potential of human AT‐MSCs 6.
Recently, we developed a method to expand murine bone marrow and adipose tissue‐derived MSCs by culturing them under hypoxic conditions. We found that prior exposure of murine MSCs to hypoxia led to significant reduction in ex vivo expansion time, with significantly increased numbers of cells expressing stem‐cell marker Sca‐1+ as well as combined Sca‐1+/CD44+ expression. Moreover, murine AT‐MSCs pre‐exposed to hypoxia when switched to normoxic conditions exhibited significantly higher adipogenic differentiation capacity compared to their pre‐exposed normoxic‐cultured counterparts 7. Here, we have investigated the effect of hypoxia on human AT‐MSC behaviour and specifically, we have tested effects of hypoxic conditions (2%) on culture of four different individual human AT‐MSC populations, to examine phenotype, population growth capacity, survival and their adipogenic and osteogenic differentiation potentials following re‐exposure to normoxic culture conditions.
Materials and methods
Cell culture
Adipose tissue was harvested from the lower abdomen of four female donors (20, 23, 29 and 30‐year olds), with informed consent. Curetting during suction was performed under moderate negative pressure, using a 50‐ml disposable syringe connected to a 2‐holed 4.0 mm blunt cannula. Lipoaspirates were washed in sterile phosphate buffered saline (PBS; Invitrogen, Carlsbad, CA, USA) to remove contaminating debris and red blood cells, then treated with 0.075% type A collagenase (Roche, Mannheim, Germany) in PBS with Ca2+ and Mg2+ (EuroClone, Milano, Italy), for 30 min at 37 °C, with gentle agitation. Collagenase was inactivated using an equal volume of Dulbecco's modified Eagle's medium‐low glucose (DMEM‐LG) (Lonza, Wokingham, UK) supplemented with 20% foetal bovine serum (FBS) (Biochrom AG, Source BioScience, Nottingham, UK). The suspension was centrifuged at 200 g for 10 min. Whole pellets with the stromal vascular fraction were plated overnight in normoxia in fresh complete/growth medium (GM): DMEM‐LG (Lonza)/10% FBS (Biochrom AG) which was further supplemented with 100 IU/ml penicillin and 100 μg/ml streptomycin (Invitrogen), after which non‐adherent cells were removed 8. Adherent cells were cultured at 1 × 10⁴ cells/cm2 in GM up to 7 days, in parallel in either normoxia (21% O2) or hypoxia (2% O2) at 37 °C, in humidified 5% CO2 atmosphere. Hypoxic conditions were created using an Invivo2 1000 hypoxia workstation (Ruskinn Technology, Pencoed, UK) according to the manufacturer's instructions and half volumes of complete medium were replaced every 2 days. The adherent fraction was detached by trypsinization at 70–80% confluence using Accutase (Chemicon Europe, Hampshire, UK) and re‐plated at 1 × 10⁴ cells/cm2.
Flow cytometric analysis
The phenotypes of cultured hAT‐MSCs were analysed by flow cytometry using a BD FACSAria analyser fitted with BD FACSDiva software. The following mouse anti‐human IgG1κ monoclonal antibodies were used for positive selection: fluorescein isothiocyanate (FITC)‐conjugated CD90 (Thy‐1), phycoerythrin (PE)‐conjugated CD73 (Ecto‐5′‐nucleotidase), allophycocyanin (APC)‐conjugated CD34; and for negative selection, BD Horizon™ V450 conjugated mouse anti‐human CD45 (Leukocyte Common Antigen) was used. As controls, cells were stained with FITC, PE, APC and BD Horizon™ V450‐labelled mouse IgG1k isotypes (BD Biosciences Pharmingen, Palo Alto, CA, USA). Compensation was performed using single colour controls. At day 7 of culture, samples were analysed to compare negative selection antibody against CD90‐FITC, CD73‐PE or CD34‐APC. Gating was performed for cells negative for CD45, and cells were then gated to show percentage of CD34‐positive cells, those double‐positive for CD73/CD90 and percentage of CD73/CD90/CD34‐positive cells. Also, BD CompBead Plus anti‐mouse Ig, k polystyrene‐particle compensation beads and BD CompBead Plus Negative control particles were used to establish fluorescence compensation settings for multicolour flow cytometric analyses, and were found to be more accurate than manually setting the compensation matrix with cells (BD Biosciences Pharmingen).
Growth curve study
Human AT‐MSCs from one donor were cultured in GM in normoxic and hypoxic conditions in total for 14 days and at day 6 passage 1 (P1), cells were detached and seeded in four 12.5 cm2 flasks (n = 4) for selected times, at 3 × 10³/cm2 density [3.75 × 10⁴ cells per flask], to evaluate cell population expansion. On days 8, 10, 12 and 14, cells were detached and counted using a haemocytometer.
Viability/apoptosis/necrosis analysis
After 7 days culture, either in normoxia or in hypoxia, hAT‐MSCs from the four different donors were detached by trysinization using Accutase (Chemicon Europe), and FACS analyses were performed.
Cells were resuspended in 200 μl of calcium rich annexin V buffer (BD Biosciences, Oxford, UK) and incubated for 15 min at RT with 15 μl of annexin V‐AlexaFluor‐647 (Invitrogen). Propidium iodide (PI) (5 μg/ml) was added and samples were analysed on a Becton Dickinson LSRII cytometer, using 660/20 nm channel of the red laser for annexin V‐AlexaFluor‐647 detection, and 576/26 nm channel of the argon laser was used to detect PI (10,000 events were collected). No compensation controls were required as PI and AlexaFluor‐647 did not spectrally overlap. Quadrant gating was used to detect live cells (annexinVneg/PIneg), apoptotic cells (annexinVpos/PIneg) and necrotic cells (annexinVneg/PIpos and annexinVpos/PIpos).
Cell cycle analysis
Flow cytometric analysis of ploidy distribution was performed to further confirm apoptosis. Briefly, annexin V‐labelled hAT‐MSCs were fixed in 70% ice‐cold ethanol, spin‐washed in PBS and incubated in 100 μg/ml RNAse (Sigma‐Aldrich, St. Louis, MO, USA) at 37 °C for 15 min and resuspended in 50 μg/ml PI in PBS. Then, samples were analysed (10 000 events collected) on a Becton Dickinson LSRII cytometer using the 610/10 nm channel from the argon laser to detect PI in a linear manner, with width parameter used to exclude doublets of cells. A DNA profile representing cells in G1, S‐phase and G2/M was observed with apoptotic cells being represented by a sub‐G1 population seen to the left of the G1 peak.
In vitro hAT‐MSC adipogenic differentiation
Normoxic and hypoxic GM‐cultured hAT‐MSCs were transferred to normoxia (passage P2) and plated at 2–3 × 10⁴ cells/cm2 (4–5 × 10⁴ cells/well) in four‐well plates up to 80–90% confluence. Then, GM was replaced with adipogenic differentiation medium (DM) (PT‐3004; Lonza) and change of media was performed three times per week. All cultures contained the same number of cells when differentiation was attempted. Adipogenic differentiation was induced using differentiation medium (DM) (PT‐3004; Lonza), following specific procedural instructions of Lonza adipogenic differentiation media kits. Each cycle, consisting of feeding hAT‐MSCs with complete adipogenic induction medium [170 ml adipogenic induction medium supplemented with 2 ml rh‐insulin (recombinant human), 4 ml l‐glutamine, 20 ml Mesenchymal Cell Growth Supplement (MCGS), 1 ml dexamethasone, 0.4 ml indomethacin, 0.2 ml 3‐isobuty‐l‐methyl‐xanthine (IBMX), 0.2 ml aqueous solution gentamycin sulphate and amphotericin‐B (GA‐1000)], for 3 days. This was followed by 1–3 days culture in supplemented adipogenic maintenance medium (170 ml of adipogenic maintenance medium supplemented with 2 ml rh‐insulin, 4 ml L‐glutamine, 20 ml MCGS, 0.2 ml GA‐1000) (Lonza). This cycle was repeated for 3 weeks. Cultures were fixed in 4% PFA in PBS, incubated in 60% iso‐propyl‐alcohol (IPA) and stained with 1% Oil Red O (Raymond Lamb, Eastbourne, UK) in IPA for 15 min and further in IPA to remove background staining 9, 10, 11. Nuclei were stained with half‐strength Harris’ haematoxylin for 30 s, and then mounted in Glycergel.
In vitro hAT‐MSC osteogenic differentiation
Osteogenic differentiation was assessed in both monolayer and pellet cultures. Briefly, normoxic and hypoxic GM‐cultured hAT‐MSCs were transferred to normoxia and either plated at 3 × 10³/cm2 cell density (5–6 × 10³ cells/well) in four‐well plates or seeded at density of 2.5 × 10⁵ cells/tube in 15 ml polypropylene sterile tubes, for monolayer and pellet cultures, respectively. Osteogenic DM (PT‐3002; Lonza) was prepared with osteogenic basal medium, 170 ml with added supplements and growth factors: 1 ml dexamethasone, 1 ml ascorbate, 20 ml MCGS, 4 ml L‐glutamine, 2 ml penicillin/streptomycin and 2 ml ß‐glycerophosphate, following specific procedural instructions of Lonza osteogenic differentiation media kit (Lonza). Osteogenic differentiation of hAT‐MSCs in monolayer culture was assessed up to 34 days. For pellet cultures, the human AT‐MSCs were differentiated for 22 days.
Monolayer and pellet cultured cells were fixed in 4% PFA in PBS and osteogenesis was assessed with von Kossa's staining to quantify mineralization 12 and with Alizarin red S to detect calcium deposits 13.
In vitro hAT‐MSC chondrogenic differentiation
To assess whether pre‐hypoxia exposure affected hAT‐MSC differentiation towards the chondrogenic lineage, monolayer and pellet cultures of hAT‐MSCs were performed. Cells were grown first in monolayer for 7 days under hypoxic or normoxic conditions to expand cell numbers, then transferred to normoxia to grow in chondrogenic differentiation medium for 19 and 27 days respectively.
For monolayer cultures, normoxic and hypoxic GM cultured cells were seeded to grow at 2.2 × 10⁴ cells/cm2 (4.2 × 10⁴ cells/well) in four‐well plates and were fed after 1 day by completely replacing GM until, in 1–2 days, cultures reached 80–90% confluence for optimal chondrogenic differentiation. To induce chondrogenic differentiation, cells were cultured in DM (CC‐3225, Lonza) with 250 ml chondrocyte differentiation basal medium (CDBM), (CC‐3226, Lonza) and using SingleQuots kit (CC‐4408, Lonza) containing 1.25 ml TGFβ1, 0.5 ml human recombinant analogue of insulin‐like growth factor‐I with substitution of Arg for Glu at position 3 (R3‐IGF‐1), 0.5 ml insulin, 0.5 ml transferrin, 12.5 ml FBS and 0.25 ml gentamycin/amphotericin‐B. In addition, we included ascorbic acid (260 μl of ascorbic acid to 260 ml of CDBM; CC‐4398, Lonza), necessary for maturation and deposition of all types of collagen. Change of medium was performed 3 times per week.
For pellet 3D hAT‐MSC differentiation cultures, cells were seeded at density of 2.5 × 10⁵ cells/tube in 15 ml polypropylene sterile tubes, and after 1 day, GM was completely replaced with DM, change of medium being performed three times per week.
Immunohistochemical staining
Following osteogenic differentiation, cells were embedded in paraffin wax (Fibrowax; VWR BDH Prolabo, East Grinstead, West Sussex, UK) and sectioned at 4 μm, tissue sections being collected on charged microscope slides (Thermo Fisher Scientific Shandon, Loughborough, Leicestershire, UK). Samples were de‐waxed in xylene and dehydrated by passage through graded alcohols. Sections were permeabilized with 0.2% Triton X‐100 (Sigma‐Aldrich), washed, and endogenous peroxidases quenched by incubation with 0.6% H2O2 in methanol, in the dark for 15 min. After blocking non‐specific binding sites with goat serum (Vektor Lab, Orton Southgate, Peterbourough,UK), samples were incubated in rabbit polyclonal anti‐osteocalcin antibody at 1:100 dilution (sc‐30044; Santa Cruz Biotechnology, Santa Cruz, CA, USA). Sections were then incubated in goat anti‐rabbit biotinylated secondary antibody diluted 1:200 (BA 1000; Vektor Lab) followed by HRP‐streptavidin incubation (Vectastain Elite ABC Kit Standard;Vektor Lab). Immunoreactivity was visualized by treatment for 5 min in 0.5 mg/ml 3‐diaminobenzidine (DAB) containing 0.02% H2O2 (Amresco, Solon, OH, USA). Finally, sections were dehydrated in ethanol, clarified in xylene and mounted with DPX mountant (Fluka, Buchs, Switzerland). Sections of human new bone were used as positive and negative controls for IHC staining.
Statistical analysis
Results are presented as mean ± SE. Statistical significance between two measurements was evaluated using Student's t‐test, with probability value of P < 0.05 being considered significant.
Results
Four lines of hAT‐MSCs were expanded from lipoaspirates from the four patients. Equal numbers of the cells were grown under normoxic and hypoxic conditions. In both culture conditions, their morphology was fibroblast‐like and there were no differences between the cultures from each of the four patients (Fig. 1).
Figure 1.
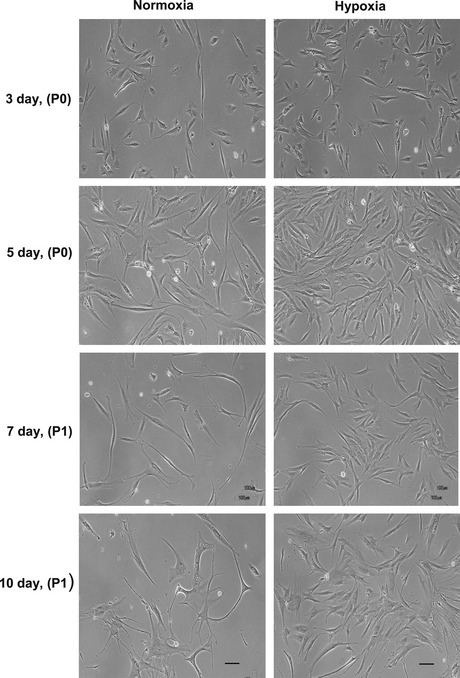
Normoxic and hypoxic cultured h AT ‐ MSC s. hAT‐MSCs were cultured in growth medium under either normoxic (21% oxygen) or hypoxic (2% oxygen) conditions. Hypoxia did not modify hAT‐MSC morphology, but density of cells was markedly increased under hypoxia in comparison to normoxic culture. Cells were photographed by phase contrast microscopy after 3 days, at passage 0 (P0), after 5 days (P0), after 7 days (P1) re‐plated at 1 × 10⁴ cells/cm2 and after 10 days (P1). Bar = 100 μm.
Expression of cell surface markers CD90 and CD73, commonly expressed by AT‐MSCs 1 was monitored over the course of culture. We also evaluated expression of CD34, which identifies the endothelial progenitor cell population, within the AT‐MSC fraction 14, 15; we used this marker as it has previously been shown to identify human adipose tissue stem cells 15, 16.
All cell lines exhibited similar expression patterns in normoxic and in hypoxic culture conditions. Specifically, at day 7 of culture, most cells positively expressed CD90 and CD73, while a subpopulation of CD90+/CD73+ cells also expressed CD34 (Fig. 2). Notably, a trend of reduction in frequency of CD34 positive and CD73/CD90/CD34 positive cells, although not statistically significant, occurred in hypoxic conditions. Importantly, cells did not express the haematopoietic lineage marker CD45 (data not shown).
Figure 2.
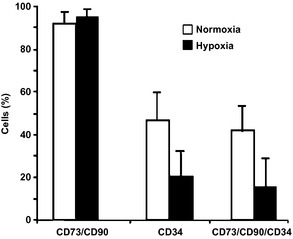
Effect of hypoxia on expression of stem‐cell markers CD 73, CD 90 (Thy‐1) and CD 34 in h AT ‐ MSC . Bar charts of flow cytometric analysis of normoxic and hypoxic cultured hAT‐MSCs at day 7, passage 1, (n = 3). At day 7 of culture, 92 ± 3% and 95 ± 3.5% (of the total hAT‐MSCs/CD45− population) of normoxic and hypoxic cells, respectively, co‐expressed CD90 and CD73. A subpopulation of CD90+/CD73+ cells also expressed CD34. Percentages of CD34+ and CD90+/CD73+/CD34+ cells decreased in hypoxia. Although this difference was not statistically significant, probably as a consequence of variability among donors, reduction in CD34+ and CD90+/CD73+/CD34+ cells occurred in all three samples analysed.
To measure population growth in normoxic and hypoxic cultures, cell numbers was measured every 2 days, from day 8 to day 14. Hypoxic cells displayed greater cell population expansion compared to their normoxic counterparts (Fig. 3). Specifically, at day 14 hypoxic cultures had a 5‐fold greater cell number compared to normoxic cultures. There was higher cell viability under hypoxic conditions (Fig. 4a,b). Annexin V and propidium iodide (PI) staining showed that hypoxia protected AT‐MSCs from cell death. At day 7, numbers of apoptotic (Fig. 4a,c) and necrotic cells (Fig. 4a,d) were higher in normoxic cultured hAT‐MSCs compared to their hypoxic counterparts (P < 0.05).
Figure 3.
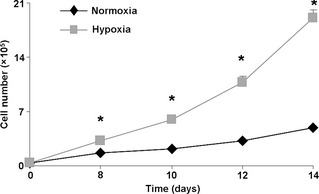
Effect of hypoxia on h AT ‐MSC cell number. Growth curves of normoxic and hypoxic hAT‐MSCs (n = 4, P < 0.001 versus normoxic counterpart). Hypoxic culture conditions markedly enhanced hAT‐MSC expansion. Note that at day 14, hypoxic cells were 80–90% confluent avoiding any contact inhibition.
Figure 4.
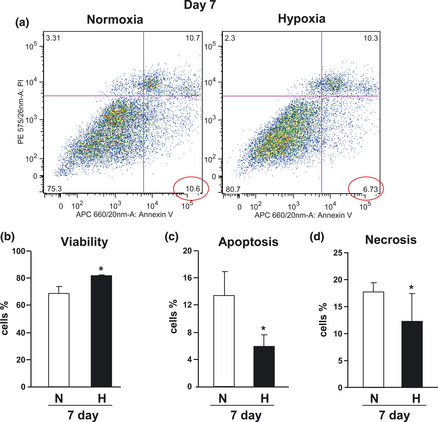
Effect of hypoxia on h AT ‐ MSC cell survival. (a) Representative dot plots of annexin V and PI‐labelled AT‐MSCs after 7 days culture either in normoxia or in hypoxia. Data representative of four independent experiments. Cell viability (b), apoptosis (c) and necrosis (d) of PI‐labelled hAT‐MSCs (n = 4, *P < 0.05).
In short, in agreement with previous data 17, 18 and with our results obtained in a previous study with murine AT‐MSCs 7, we found that hAT‐MSCs incubated under hypoxia had accelerated growth with superior viability, over normoxic cultured cells. Differences in apoptotic cell frequency were also confirmed by DNA ploidy analysis (Fig. S3).
hAT‐MSCs from three different donors that were cultured for 7 days in growth medium either under hypoxic or normoxic conditions were then analysed for their ability to undergo either adipogenic or osteogenic differentiation, after culture in normoxia, in the presence of specific differentiation media. Oil‐Red O‐positive colonies containing fat vacuoles were detected in both pre‐hypoxic and pre‐normoxic cultured cells (Fig. 5). Notably, their numbers appeared greatly enhanced when AT‐MSCs had been pre‐exposed to hypoxia (Fig. 5c). We quantified numbers of cells that differentiated into adipocytes, by phase contrast microscopy. For each patient sample (Fig. 5f), we found significantly more adipocytes in the previously hypoxic cultures (P < 0.001), although there was high inter‐patient variability. Pre‐hypoxia exposure also enhanced osteogenic differentiation of hAT‐MSCs under normoxia. von Kossa's staining, performed both in monolayer cultures after 34 days (Fig. S1) and in pellet cultures after 22 days differentiation (Fig. 6) of cells from three different donors, showed that bone nodule formation increased in previously hypoxic cells compared to their normoxic counterparts (Fig. 6). In similar culture conditions, calcium deposition, evaluated by Alizarin red S staining, was also enhanced in previously hypoxic cells (Fig. S2 and Fig. 7). Osteocalcin immunoreactivity was more abundant in hAT‐MSCs pre‐cultured in hypoxia, compared to their normoxic counterparts (Fig. 8).
Figure 5.
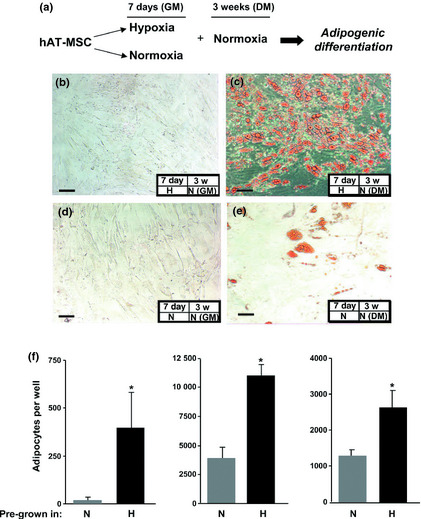
Effect of pre‐hypoxia exposure on adipogenic differentiation of h AT ‐ MSC s. (a) Experimental plan. AT‐MSCs were pre‐cultured in control growth medium (GM) for 7 days in either hypoxia (b, c) or normoxia (d, e). Cells were then cultured under normoxia for a period of 3 weeks either in differentiation cocktail medium (DM) (c, e,) or GM (b, d). Oil Red O staining was performed to detect adipogenic differentiation, and showed lipid vacuoles accumulated to a greater extent in pre‐hypoxic AT‐MSCs exposed to normoxic conditions under DM (c) compared to pre‐normoxic AT‐MSCs cultured in DM (e). Bars = 100 μm. (f) Histograms showing phase contrast microscopic quantification of adipocyte numbers from hAT‐MSCs cultured from three donors. For each donor, four different cultures were performed and in each case, number of adipocytes was significantly greater (*P < 0.001) in cultures pre‐grown in hypoxic (H) conditions compared to those pre‐grown in normoxic (N) conditions.
Figure 6.
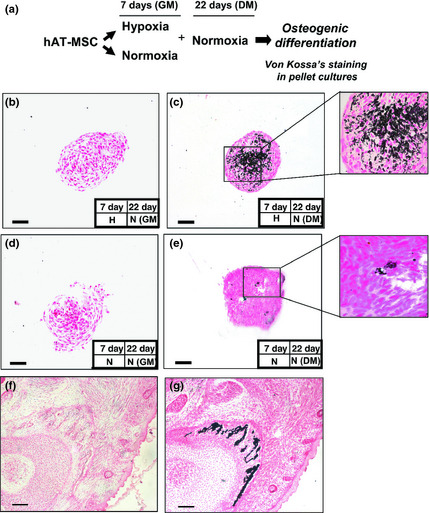
Effect of pre‐hypoxia exposure on osteogenic differentiation of h AT ‐ MSC s. von Kossa's staining in pellet cultures. (a) Experimental plan. hAT‐MSCs were cultured as a monolayer under hypoxia in complete growth control medium (GM) for 7 days, and transferred to normoxia, and cultured as a pellet in the presence of GM (b), or osteogenic differentiation cocktail medium (DM) (c) for a period of 22 days. As controls, hAT‐MSCs were cultured in normoxia and then exposed for the same time either to GM (d) or DM (e). von Kossa's staining was performed to quantify mineralization. High magnification view (400×) of (c) and (e) in the insets is shown. von Kossa's staining controls: (f) negative and (g) positive (mouse E 18.5) are shown illustrating embryonic bone. Bars = 100 μm.
Figure 7.
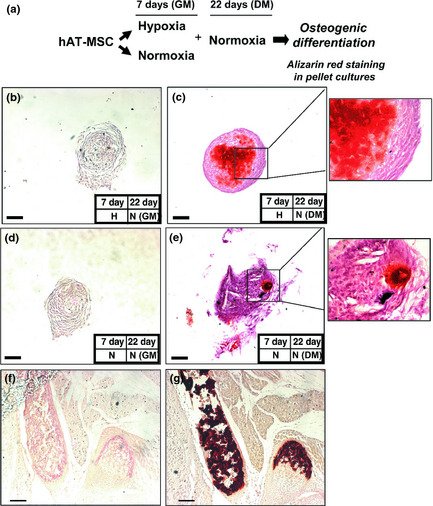
Effect of pre‐hypoxia exposure on osteogenic differentiation of h AT ‐MSCs. Alizarin red S staining of pellet cultures. (a) Experimental plan as described in legend of Fig. 6. Note more intense staining of pellet cultures of MSCs previously exposed to hypoxia.
Figure 8.
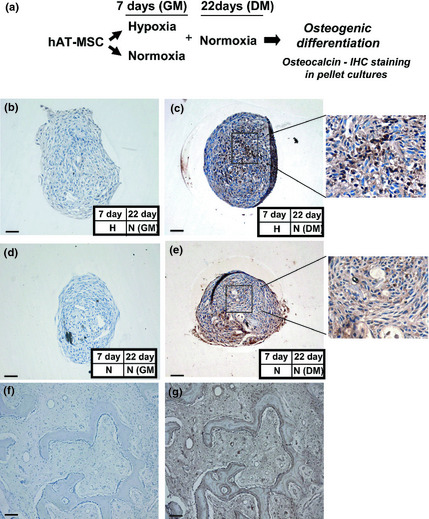
Effect of pre‐hypoxia exposure on osteogenic differentiation of h AT ‐ MSC s. Immunohistochemical staining of hAT‐MSC pellet cultures. (a) Experimental plan as described in legend of Fig. 6. Immunohistochemical staining using rabbit polyclonal antibody to osteocalcin. Immunohistochemical staining controls using rabbit polyclonal antibody to osteocalcin (f) negative and (g) positive (human new bone) are shown. Bars (f–g) = 100 μm. Bars (b–e) = 50 μm. Note more intense widespread osteocalcin immunoreactivity in pellet cultures of MSCs previously exposed to hypoxia.
Chondrogenic differentiation was performed both in monolayer and in pellet cultures and preliminary observations suggested that pre‐hypoxia exposure enhanced sulphated proteoglycan and glycosaminoglycan (GAG) production, in differentiating cells. hAT‐MSC chondrogenesis was determined using alcian blue staining on monolayer cultures to visualize sulphated proteoglycans (Fig. S4). Toluidine blue staining was also performed on pellet cultures to detect presence of proteoglycans (Fig. S5), and safranin O staining to detect sulphated glycosaminoglycans (Fig. S6). Masson's trichrome staining, performed on pellets to assess collagen content (Fig. S7), displayed evidence of enhanced collagen deposition of pre‐hypoxia exposed cells.
Interestingly, we also observed that micromasses of cells pre‐grown under 2% O2 conditions had a smaller diameter than those pre‐cultured in 21% O2. Malladi et al. 4 attempted chondrogenic differentiation of murine AT‐MSCs under both hypoxia (2% O2) and normoxia (21% O2), also finding that increase in differentiation was associated with reduction in cell pellet diameter.
Discussion
In this report, we demonstrate that MSCs from human adipose tissue can be expanded in vitro under hypoxic conditions. In agreement with previous data 17, 18, we found that hAT‐MSCs incubated under hypoxia had increased population growth rate and superior survival. Under these culture conditions, expression of the MSC markers CD90 and CD73 remained unchanged. As previously reported, endothelial progenitor cells expressing CD34 were also identified within the hAT‐MSC fraction 15, 16, 19. Traktuev and colleagues 16 have shown that the stromal‐vascular fraction isolated from adipose tissue contains many CD34+ cells widely distributed among adipocytes, predominantly associated with vascular structures. They found that most of these CD34+ cells were pericytes. These CD34+ cells did not express CD45, distinguishing them from cells of the haematopoietic lineage. Other studies have used CD34 as a marker of adipose‐derived stem/stromal/progenitor cells 15, suggesting that CD34 expression in hAT‐MSCs may correlate with replicative capacity, differentiation potential, expression profiles of angiogenesis‐related genes and immaturity or stemness of the cells 15. A trend towards decrease in CD34+ cell frequency was observed in hypoxic cultured hAT‐MSCs (Fig. 2), suggesting that loss of CD34 expression may be a physiological process consistent with their commitment and/or differentiation 15. We also observed that a proportion of these cells are CD90+/CD73+/CD34+, a combination already described for human adipose tissue‐derived stromal/stem cells 20.
Although we and others have shown that under hypoxia, AT‐MSCs had reduced adipogenic differentiation capacity 7 or did not differentiate into adipocytes 21, pre‐exposure to hypoxia markedly enhanced their adipogenic potential when switched to normoxic conditions, compared to normoxic pre‐cultured AT‐MSCs (Fig. 5) 7, 22. Variation in differentiation potential of hAT‐MSCs from 3 different donors is most likely due to differences between patients (donor‐dependent) as all were from patients of similar age (20, 23, 30‐year old women respectively) and were exposed to an identical differentiation protocol.
On the other hand, contrasting results have been reported concerning the ability of AT‐MSCs to undergo osteogenic differentiation under hypoxia 4, 23, 24, 25; however, Xu et al. have previously reported that exposure of pre‐hypoxic cultured mAT‐MSCs to 21% oxygen resulted in partial reversion of the hypoxia‐mediated inhibitory effect 26. Here we have demonstrated that normoxic conditions not only restore but markedly enhance ability of hAT‐MSCs to undergo osteogenic and chondrogenic differentiation.
Beneficial effects of hypoxic culture on proliferation and in vitro and in vivo differentiation potentials of human MSCs have been suggested by several groups. Hung et al. 27 demonstrated that human bone marrow‐derived MSCs (hBM‐MSCs) cultured under hypoxia with 1% O2 had increased proliferation, with enhanced expression of stemness genes OCT4, NANOG, SALL4 and KLF4. Differentiation of MSCs under hypoxia favoured osteogenesis, while adipogenesis was inhibited. Tamama et al. 22 found that hypoxic conditions promoted hBM‐MSC self‐renewal through preserving colony formation in early progenitors, while maintaining undifferentiated phenotypes. Hypoxic conditions reversibly decreased osteogenic and adipogenic differentiation and increased secretion of vascular endothelial growth factor (VEGF), hepatocyte growth factor (HGF) and basic fibroblast growth factor (bFGF), in a hypoxia inducible factor (HIF)‐dependent manner 22. For regeneration of intervertebral discs, Müller et al. 28 have used cell‐based approaches using hBM‐MSCs, examining the influence of hypoxia (4% O2) during expansion and chondrogenic differentiation. Differentiation was performed in in situ solidifying gelatin hydrogels, representing a suitable 3D matrix for delivering and anchoring cells within the disc tissue. They observed that quality of chondrogenic differentiation was improved by hypoxia, also noting that best results were obtained when the entire in vitro process, expansion and differentiation, was performed under hypoxic conditions 28.
Thus, the beneficial effects of MSC pre‐exposure to hypoxic conditions have been demonstrated, and likewise, temporary hypoxic preconditioning has enhanced MSC‐mediated skeletal and cardiac muscle regeneration, angiogenesis and engraftment in vivo, into a variety of tissues 24, 29, 30, achieved largely by MSCs releasing growth factors, which in turn protect them from cell death and stimulate resident stem cells. In attempts to identify molecular mechanisms involved in hypoxia‐mediated effects on survival, growth and differentiation of AT‐MSCs, it has been suggested that the PI3K/Akt and HIF pathways play a key role. Rosova et al. 29 showed that pre‐culture of MSCs in hypoxia activated the Akt signalling pathway, while maintaining cell viability and cell cycle rates. Under low‐oxygen conditions, cells develop an adaptive program that leads to induction of several genes, which are transcriptionally regulated by HIF‐1α a transcription factor essential for cellular responses to low oxygen levels. Stabilization of HIF‐1α also appears to depend on a hypoxia‐induced increase in phosphorylated Akt and p38 mitogen‐activated protein kinase (p38MAPK) 31. Recently, it has been shown that by upregulating HIF‐1α, there was increased CXCR4/CXCR7 expression in MSCs, mediated by the PI3K/Akt pathway, thus resulting in enhanced cell migration and survival 32. On the other hand, activation of HIF‐1α at low‐oxygen tension is associated with inhibition of adipogenesis 21 and osteogenesis 22. Accordingly, Lin et al. showed that when HIF‐1α was repressed, pre‐adipocytes were able to undergo adipogenic differentiation in the presence of a hypoxic mimetic compound 21. Notably, stabilized HIF‐1α translocates to the nucleus, allowing it to dimerize with HIF‐1β, so it can bind to promoter regions of hypoxia‐responsive genes 33. Among them are the stem‐cell‐associated gene OCT‐4, which is required to maintain both embryonic and adult stem cells in their undifferentiated state 18, 34, 35, 36, 37 as well as VEGF 34. The latter, together with other growth factors released by hypoxic cultured cells, accounts for hypoxic‐mediated autocrine effects on in vitro‐cultured AT‐MSCs. Screening with microarrays has demonstrated that many genes, including VEGF and placental growth factor (PGF), were upregulated when rat BM‐MSCs were cultured in 1% O2 38. Similarly, VEGF, HGF and IGF‐1 were detected in hypoxic BM and AT‐MSC culture media 29, 39, 40. Together, this evidence suggests that growth factors released by MSCs under hypoxia may positively affect their proliferation and survival.
Exposure to elevated levels of O2 may induce cell death by generation of reactive oxygen species, resulting in activated pro‐apoptotic Bcl‐2 proteins, Bax or Bak, which eventually lead to mitochondrial membrane permeabilization and cell death 41. These events could be inhibited under hypoxic conditions, and VEGF seems to play a role in this process. Accordingly, conditioned medium from hypoxic‐cultured MSCs protected these cells from apoptosis induced by ischaemia/reperfusion, by stabilizing mitochondrial membrane potential, upregulating anti‐apoptotic protein Bcl‐2 as well as increasing VEGF expression, through extracellular signal‐regulated kinase (ERK) and Akt phosphorylation 42.
AT‐MSCs are considered to be a more plastic source of stem cells than mature adipocytes, as they are not differentiated and committed to a specific cell type 43, 44. Therefore, AT‐MSCs could be exploited in cases where more adipocytes are needed for experimental or possibly clinical purposes. For cell therapy approaches, both cell senescence and genomic stability of in vitro‐expanded cells represent two important issues. The protective effect of hypoxia on cell senescence has been reported previously with hBM‐MSC 45 and, in contrast to that which occurs in senescent cultures, we have shown greater cell population expansion of hypoxic‐cultured hAT‐MSCs and mAT‐MSCs, compared to their normoxic counterparts 7. Tsai and colleagues have described that combining low‐density and hypoxic culture provides an efficient method for rapid expansion of hMSCs, preserving their stem‐cell status and bypassing senescence. This was achieved through direct downregulation of E2A‐p21CIP1 by the hypoxia‐inducible factor‐1α (HIF‐1α)‐TWIST axis 45. Importantly, we used cells at passage P1, avoiding the risk of genetic instability, which occurs on culturing cells for many passages [as shown with murine AT‐MSCs 46], while hypoxia prevents the risk of karyotypic abnormalities developing over a prolonged time in culture, in several stem‐cell types including MSCs 47, 48, 49.
At present, adipose tissue is used as an autologous filler for soft tissue defects, although clinical results are variable and there is often a low rate of graft survival, possibly due to relative deficiency of progenitor cells in the graft materials. It has been reported that aspirated fat tissue has a significantly lower progenitor/mature cell ratio than purified or cultured AT‐MSCs (from 200 ml of aspirated fat tissue only around 10% of nucleated cells are AT‐MSCs), and this low AT‐MSC/adipocyte ratio may be the reason for atrophy of transplanted adipose tissue in the long‐term 50. Several studies have demonstrated that supplementation with adipose tissue progenitor cells enhances volume or/and weight of surviving adipose tissue 51, 52, 53, 54; therefore, it is important to amplify AT‐MSCs within the adipose fraction. In cell‐assisted lipotransfer (CAL), a new methodology using autologous transplantation of progenitor‐supplemented adipose tissue, freshly isolated stromal vascular fraction (SVF) cells containing AT‐MSCs are attached to aspirated fat, with the fat tissue acting as a living bioscaffold 50, 54. In the CAL strategy, progenitor deficit in graft material was compensated by supplementation with AT‐MSCs isolated from a separate volume of aspirated fat tissue, with overall clinical results being very satisfactory 50, 53, 54. In this context, pre‐hypoxia exposure may represent a strategy to increase not only AT‐MSC number but also their adipogenic differentiation potential, and preliminary qualitative observations have suggested that pre‐hypoxia exposure also enhanced hAT‐MSC osteogenic and chondrogenic differentiation, suggesting that these culture conditions may also represent a way to enhance these differentiation pathways.
Conclusions
In this study, we have demonstrated distinct beneficial effects for potential regenerative medicine, by pre‐exposure of hAT‐MSCs to hypoxic conditions. We have grown the cells for 7 days, from four different human donors, in either normoxic (21% O2) or in hypoxic (2% O2) conditions, finding increased hAT‐MSC expansion and viability in hypoxia exposed cells, with less apoptosis and necrosis in these cultures. Finally, we found that pre‐culturing hAT‐MSCs for 7 days under hypoxia, when transferred to normoxic environment with the appropriate media, resulted in enhanced ability to differentiate.
Ethical conduct of research
The authors state that they have followed the principles outlined in the Declaration of Helsinki for all human experimental investigations. In addition, informed consent was obtained from the participants involved.
Supporting information
Fig. S1 Effect of pre‐hypoxia exposure on the osteogenic differentiation of h AT ‐ MSC s. Von Kossa's staining in monolayer cultures. (a) Experimental plan. hAT‐MSCs were cultured in monolayer under hypoxia in complete growth control medium (GM) for 7 days and transferred to normoxia in the presence of GM (b) or the osteogenic differentiation cocktail medium (DM) (c) for a period of 34 days. Alternatively, hAT‐MSCs were cultured in normoxia and then exposed for the same time either to GM (d) or DM (e). Von Kossa's staining was performed to quantify mineralization. Von Kossa's staining controls: (f) negative and (g) positive (mouse E18.5) are shown illustrating embryonic bone. Bar = 100 μm.
Fig. S2 Effect of pre‐hypoxia exposure on the osteogenic differentiation of h AT ‐ MSC s. Alizarin red S staining in monolayer cultures. (a) Experimental plan. hAT‐MSCs were cultured in monolayer under hypoxia in complete growth control medium (GM) for 7 days and transferred to normoxia in the presence of GM (b) or the osteogenic differentiation cocktail medium (DM) (c) for a period of 34 days. As controls, hAT‐MSCs were cultured in normoxia and then exposed for the same time either to GM (d) or DM (e). Alizarin red S staining was performed to quantify calcium depositions. Alizarin red S staining controls: (f) negative and (g) positive (mouse E 18.5) are shown illustrating embryonic bone. Bars = 100 μm.
Fig. S3 Effect of hypoxia on the DNA distribution. (a, b) Cell cycle distribution and percent (c) of PI‐labelled hAT‐MSCs in different phases of the cell cycle after 7 days culture either in normoxia or in hypoxia (n = 3). The percentage of sub‐G1 cells (apoptotic bodies) was lower in hypoxia compared to the normoxic counterpart.
Fig. S4 Effect of pre‐hypoxia exposure on chondrogenic differentiation of h AT ‐ MSC s: Alcian blue staining in monolayer cultures. (a) Experimental plan. hAT‐MSCs were pre‐cultured in monolayer under hypoxia in control growth medium (GM) for 7 days and transferred to normoxia in the presence of GM (b) or the chondrogenic differentiation cocktail medium (DM) (c) for a period of 19 days. As controls, hAT‐MSCs were cultured in normoxia and then exposed for the same time either to GM (d) or DM (e). Chondrogenic differentiation was assessed with Alcian blue staining to visualize sulphated proteoglycan production. Alcian blue control staining: (f) positive control (adult mouse large intestine illustrating positive goblet cells) is shown. Bars = 100 μm.
Fig. S5 Effect of pre‐hypoxia exposure on chondrogenic differentiation of h AT ‐ MSC s: Toluidine blue staining in pellet cultures. Toluidine blue staining was performed to detect the presence of cartilage‐typical glycosaminoglycans. (a) Experimental plan. hAT‐MSCs were pre‐cultured in monolayer under hypoxia in control growth medium (GM) for 7 days and transferred to normoxia, in pellet cultures, in the presence of GM (b) or the chondrogenic differentiation cocktail medium (DM) (c) for a period of 27 days. As controls, hAT‐MSCs were cultured in normoxia and then exposed for the same time either to GM (d) or DM (e). A high magnification view (400×) of c and e in the insets, are shown. Toluidine positive staining control (mouse adult lung) is shown illustrating bronchial cartilage. Bars = 100 μm.
Fig. S6 Effect of pre‐hypoxia exposure on chondrogenic differentiation of h AT ‐ MSC : Safranin O staining in pellet cultures. Safranin O staining was performed to detect cartilage. (a) Experimental plan. hAT‐MSCs were pre‐cultured in monolayer under hypoxia in control growth medium (GM) for 7 days and transferred to normoxia, in pellet cultures, in the presence of GM (b) or the chondrogenic differentiation cocktail medium (DM) (c) for a period of 27 days. As controls, hAT‐MSCs were cultured in normoxia and then exposed for the same time either to GM (d) or DM (e). A high magnification view (400×) of c and e in the insets, are shown. Safranin O positive staining control (mouse E18.5) is shown illustrating embryonic cartilage. Bars = 100 μm.
Fig. S7 Effect of pre‐hypoxia exposure on chondrogenic differentiation of h AT ‐ MSC : Masson's Trichrome staining in pellet cultures. Masson's Trichrome staining was performed to visualise collagen fibres. (a) Experimental plan. hAT‐MSCs were pre‐cultured in monolayer under hypoxia in control growth medium (GM) for 7 days and transferred to normoxia, in pellet cultures, in the presence of GM (b) or the chondrogenic differentiation cocktail medium (DM) (c) for a period of 27 days. As controls, hAT‐MSCs were cultured in normoxia and then exposed for the same time either to GM (d) or DM (e). A high magnification view (400×) of c and e in the insets, are shown. Human tongue was used as a Masson's Trichrome positive staining control for collagen. Bars = 100 μm.
Acknowledgements
This study was supported by grants from Fondazione Livio Patrizi and Bios S.p.A., Rome, Italy and from the International PhD programme of Queen Mary University of London/University Campus BioMedico, Rome, Italy. The authors thank Dr Gary Warnes, manager of Flow Cytometry Core Facility in the Blizard Institute, for his excellent assistance and Luke Gammon, from Centre for Cutaneus Research, for the Invivo2 1000 hypoxia workstation helpful technical assistance.
References
- 1. Schaffler A, Buchler C (2007) Concise review: adipose tissue‐derived stromal cells–basic and clinical implications for novel cell‐based therapies. Stem Cells 25, 818–827. [DOI] [PubMed] [Google Scholar]
- 2. Chung HM, Won CH, Sung JH (2009) Responses of adipose‐derived stem cells during hypoxia: enhanced skin‐regenerative potential. Expert Opin. Biol. Ther. 9, 1499–1508. [DOI] [PubMed] [Google Scholar]
- 3. Mohyeldin A, Garzon‐Muvdi T, Quinones‐Hinojosa A (2010) Oxygen in stem cell biology: a critical component of the stem cell niche. Cell 7, 150–161. [DOI] [PubMed] [Google Scholar]
- 4. Malladi P, Xu Y, Chiou M, Giaccia AJ, Longaker MT (2006) Effect of reduced oxygen tension on chondrogenesis and osteogenesis in adipose‐derived mesenchymal cells. Am. J. Physiol. Cell Physiol. 290, C1139–C1146. [DOI] [PubMed] [Google Scholar]
- 5. Lee JH, Kemp DM (2006) Human adipose‐derived stem cells display myogenic potential and perturbed function in hypoxic conditions. Biochem. Biophys. Res. Commun. 341, 882–888. [DOI] [PubMed] [Google Scholar]
- 6. Wang DW, Fermor B, Gimble JM, Awad HA, Guilak F (2005) Influence of oxygen on the proliferation and metabolism of adipose derived adult stem cells. J. Cell. Physiol. 204, 184–191. [DOI] [PubMed] [Google Scholar]
- 7. Valorani MG, Germani A, Otto WR, Harper L, Biddle A, Khoo CP et al (2010) Hypoxia increases Sca‐1/CD44 co‐expression in murine mesenchymal stem cells and enhances their adipogenic differentiation potential. Cell 341, 111–120. [DOI] [PubMed] [Google Scholar]
- 8. Lo Cicero V, Montelatici E, Cantarella G, Mazzola R, Sambataro G, Rebulla P et al (2008) Do mesenchymal stem cells play a role in vocal fold fat graft survival? Cell Prolif. 41, 460–473. [DOI] [PMC free article] [PubMed] [Google Scholar]
- 9. Pittenger MF, Mackay AM, Beck SC, Jaiswal RK, Douglas R, Mosca JD et al (1999) Multilineage potential of adult human mesenchymal stem cells. Science 284, 143–147. [DOI] [PubMed] [Google Scholar]
- 10. Sekiya I, Larson BL, Smith JR, Pochampally R, Cui JG, Prockop DJ (2002) Expansion of human adult stem cells from bone marrow stroma: conditions that maximize the yields of early progenitors and evaluate their quality. Stem Cells 20, 530–541. [DOI] [PubMed] [Google Scholar]
- 11. Zuk PA, Zhu M, Mizuno H, Huang J, Futrell JW, Katz AJ et al (2001) Multilineage cells from human adipose tissue: implications for cell‐based therapies. Tissue Eng. 7, 211–228. [DOI] [PubMed] [Google Scholar]
- 12. Nefussi JR, Ollivier A, Oboeuf M, Forest N (1997) Rapid nodule evaluation computer‐aided image analysis procedure for bone nodule quantification. Bone 20, 5–16. [DOI] [PubMed] [Google Scholar]
- 13. Bancroft JD, Gamble M (2002) Theory and Practice of Histological Techniques, 5th edn London: Churchill Livingstone. [Google Scholar]
- 14. De Francesco F, Tirino V, Desiderio V, Ferraro G, D'Andrea F, Giuliano M et al (2009) Human CD34/CD90 ASCs are capable of growing as sphere clusters, producing high levels of VEGF and forming capillaries. PLoS ONE 4, e6537. [DOI] [PMC free article] [PubMed] [Google Scholar]
- 15. Suga H, Matsumoto D, Eto H, Inoue K, Aoi N, Kato H, et al (2009) Functional implications of CD34 expression in human adipose‐derived stem/progenitor cells. Stem Cells Dev. 18, 1201–1210. [DOI] [PubMed] [Google Scholar]
- 16. Traktuev DO, Merfeld‐Clauss S, Li J, Kolonin M, Arap W, Pasqualini R et al (2008) A population of multipotent CD34‐positive adipose stromal cells share pericyte and mesenchymal surface markers, reside in a periendothelial location, and stabilize endothelial networks. Circ. Res. 102, 77–85. [DOI] [PubMed] [Google Scholar]
- 17. Buravkova LB, Grinakovskaia OS, Andreeva EP, Zhambalova AP, Kozionova MP (2009) [Characteristics of human lipoaspirate‐isolated mesenchymal stromal cells cultivated under a lower oxygen tension]. Tsitologiia 51, 5–11. [PubMed] [Google Scholar]
- 18. Grayson WL, Zhao F, Bunnell B, Ma T (2007) Hypoxia enhances proliferation and tissue formation of human mesenchymal stem cells. Biochem. Biophys. Res. Commun. 358, 948–953. [DOI] [PubMed] [Google Scholar]
- 19. Planat‐Benard V, Silvestre JS, Cousin B, Andre M, Nibbelink M, Tamarat R et al (2004) Plasticity of human adipose lineage cells toward endothelial cells: physiological and therapeutic perspectives. Circulation 109, 656–663. [DOI] [PubMed] [Google Scholar]
- 20. Yu G, Wu X, Dietrich MA, Polk P, Scott LK, Ptitsyn AA et al (2010) Yield and characterization of subcutaneous human adipose‐derived stem cells by flow cytometric and adipogenic mRNA analyzes. Cytotherapy 12, 538–546. [DOI] [PMC free article] [PubMed] [Google Scholar]
- 21. Lin Q, Lee YJ, Yun Z (2006) Differentiation arrest by hypoxia. J. Biol. Chem. 281, 30678–30683. [DOI] [PubMed] [Google Scholar]
- 22. Tamama K, Kawasaki H, Kerpedjieva SS, Guan J, Ganju RK, Sen CK (2011) Differential roles of hypoxia inducible factor subunits in multipotential stromal cells under hypoxic condition. J. Cell. Biochem. 112, 804–817. [DOI] [PMC free article] [PubMed] [Google Scholar]
- 23. D'Ippolito G, Diabira S, Howard GA, Roos BA, Schiller PC (2006) Low oxygen tension inhibits osteogenic differentiation and enhances stemness of human MIAMI cells. Bone 39, 513–522. [DOI] [PubMed] [Google Scholar]
- 24. Hung SC, Pochampally RR, Hsu SC, Sanchez C, Chen SC, Spees J et al (2007) Short‐term exposure of multipotent stromal cells to low oxygen increases their expression of CX3CR1 and CXCR4 and their engraftment in vivo. PLoS ONE 2, e416. [DOI] [PMC free article] [PubMed] [Google Scholar]
- 25. Park JH, Park BH, Kim HK, Park TS, Baek HS (2002) Hypoxia decreases Runx2/Cbfa1 expression in human osteoblast‐like cells. Mol. Cell. Endocrinol. 192, 197–203. [DOI] [PubMed] [Google Scholar]
- 26. Xu Y, Malladi P, Chiou M, Bekerman E, Giaccia AJ, Longaker MT (2007) In vitro expansion of adipose‐derived adult stromal cells in hypoxia enhances early chondrogenesis. Tissue Eng. 13, 2981–2993. [DOI] [PubMed] [Google Scholar]
- 27. Hung SP, Ho JH, Shih YR, Lo T, Lee OK (2012) Hypoxia promotes proliferation and osteogenic differentiation potentials of human mesenchymal stem cells. J. Orthop. Res. 30, 260–266. [DOI] [PubMed] [Google Scholar]
- 28. Muller J, Benz K, Ahlers M, Gaissmaier C, Mollenhauer J (2011) Hypoxic conditions during expansion culture prime human mesenchymal stromal precursor cells for chondrogenic differentiation in three‐dimensional cultures. Cell Transplant. 20, 1589–1602. [DOI] [PubMed] [Google Scholar]
- 29. Rosova I, Dao M, Capoccia B, Link D, Nolta JA (2008) Hypoxic preconditioning results in increased motility and improved therapeutic potential of human mesenchymal stem cells. Stem Cells 26, 2173–2182. [DOI] [PMC free article] [PubMed] [Google Scholar]
- 30. Leroux L, Descamps B, Tojais NF, Seguy B, Oses P, Moreau C et al (2010) Hypoxia preconditioned mesenchymal stem cells improve vascular and skeletal muscle fiber regeneration after ischemia through a Wnt4‐dependent pathway. Mol. Ther. 18, 1545–1552. [DOI] [PMC free article] [PubMed] [Google Scholar]
- 31. Kanichai M, Ferguson D, Prendergast PJ, Campbell VA (2008) Hypoxia promotes chondrogenesis in rat mesenchymal stem cells: a role for AKT and hypoxia‐inducible factor (HIF)‐1alpha. J. Cell. Physiol. 216, 708–715. [DOI] [PubMed] [Google Scholar]
- 32. Liu H, Xue W, Ge G, Luo X, Li Y, Xiang H et al (2010) Hypoxic preconditioning advances CXCR4 and CXCR7 expression by activating HIF‐1alpha in MSCs. Biochem Biophys Res Commun. 401, 509–515. [DOI] [PubMed] [Google Scholar]
- 33. Lord‐Dufour S, Copland IB, Levros LC Jr, Post M, Das A, Khosla C et al (2009) Evidence for transcriptional regulation of the glucose‐6‐phosphate transporter by HIF‐1alpha: targeting G6PT with mumbaistatin analogs in hypoxic mesenchymal stromal cells. Stem Cells 27, 489–497. [DOI] [PMC free article] [PubMed] [Google Scholar]
- 34. Covello KL, Kehler J, Yu H, Gordan JD, Arsham AM, Hu CJ et al (2006) HIF‐2alpha regulates Oct‐4: effects of hypoxia on stem cell function, embryonic development, and tumor growth. Genes Dev. 20, 557–570. [DOI] [PMC free article] [PubMed] [Google Scholar]
- 35. Ji L, Liu YX, Yang C, Yue W, Shi SS, Bai CX et al (2009) Self‐renewal and pluripotency is maintained in human embryonic stem cells by co‐culture with human fetal liver stromal cells expressing hypoxia inducible factor 1alpha. J. Cell. Physiol. 221, 54–66. [DOI] [PubMed] [Google Scholar]
- 36. Fink T, Abildtrup L, Fogd K, Abdallah BM, Kassem M, Ebbesen P et al (2004) Induction of adipocyte‐like phenotype in human mesenchymal stem cells by hypoxia. Stem Cells 22, 1346–1355. [DOI] [PubMed] [Google Scholar]
- 37. Grayson WL, Zhao F, Izadpanah R, Bunnell B, Ma T (2006) Effects of hypoxia on human mesenchymal stem cell expansion and plasticity in 3D constructs. J. Cell. Physiol. 207, 331–339. [DOI] [PubMed] [Google Scholar]
- 38. Ohnishi S, Yasuda T, Kitamura S, Nagaya N (2007) Effect of hypoxia on gene expression of bone marrow‐derived mesenchymal stem cells and mononuclear cells. Stem Cells 25, 1166–1177. [DOI] [PubMed] [Google Scholar]
- 39. Gnecchi M, He H, Noiseux N, Liang OD, Zhang L, Morello F et al (2006) Evidence supporting paracrine hypothesis for Akt‐modified mesenchymal stem cell‐mediated cardiac protection and functional improvement. FASEB J. 20, 661–669. [DOI] [PubMed] [Google Scholar]
- 40. Sadat S, Gehmert S, Song YH, Yen Y, Bai X, Gaiser S et al (2007) The cardioprotective effect of mesenchymal stem cells is mediated by IGF‐I and VEGF. Biochem. Biophys. Res. Commun. 363, 674–679. [DOI] [PubMed] [Google Scholar]
- 41. Chandel NS, Budinger GR (2007) The cellular basis for diverse responses to oxygen. Free Radic. Biol. Med. 42, 165–174. [DOI] [PubMed] [Google Scholar]
- 42. Wang JA, Chen TL, Jiang J, Shi H, Gui C, Luo RH et al (2008) Hypoxic preconditioning attenuates hypoxia/reoxygenation‐induced apoptosis in mesenchymal stem cells. Acta Pharmacol. Sin. 29, 74–82. [DOI] [PubMed] [Google Scholar]
- 43. Sterodimas A, De Faria J, Correa WE, Pitanguy I (2009) Tissue engineering in plastic surgery: an up‐to‐date review of the current literature. Ann. Plast. Surg. 62, 97–103. [DOI] [PubMed] [Google Scholar]
- 44. Gomillion CT, Burg KJ (2006) Stem cells and adipose tissue engineering. Biomaterials 27, 6052–6063. [DOI] [PubMed] [Google Scholar]
- 45. Tsai CC, Chen YJ, Yew TL, Chen LL, Wang JY, Chiu CH, Hung SC (2011) Hypoxia inhibits senescence and maintains mesenchymal stem cell properties through down‐regulation of E2A‐p21 by HIF‐TWIST. Blood 117, 459–469. [DOI] [PubMed] [Google Scholar]
- 46. Qin Y, Ji H, Wu Y, Liu H (2009) Chromosomal instability of murine adipose tissue derived MSCs in long‐term cultureand development of clonal embryo. Cloning Stem Cells 11, 445–452. [DOI] [PubMed] [Google Scholar]
- 47. Forsyth NR, Musio A, Vezzoni P, Simpson AH, Noble BS, McWhir J (2006) Physiologic oxygen enhances human embryonic stem cell clonal recovery and reduces chromosomal abnormalities. Cloning Stem Cells 8, 16–23. [DOI] [PubMed] [Google Scholar]
- 48. Nekanti U, Dastidar S, Venugopal P, Totey S, Ta M (2010) Increased proliferation and analysis of differential gene expression in human Wharton's jelly‐derived mesenchymal stromal cells under hypoxia. Int. J. Biol. Sci. 6, 499–512. [DOI] [PMC free article] [PubMed] [Google Scholar]
- 49. Lim HJ, Han J, Woo DH, Kim SE, Kim SK, Kang HG, Kim JH (2011) Biochemical and morphological effects of hypoxic environment on human embryonic stem cells in long‐term culture and differentiating embryoid bodies. Mol. Cells 31, 123–132. [DOI] [PMC free article] [PubMed] [Google Scholar]
- 50. Yoshimura K, Suga H, Eto H (2009) Adipose‐derived stem/progenitor cells: roles in adipose tissue remodeling and potential use for soft tissue augmentation. Regen. Med. 4, 265–273. [DOI] [PubMed] [Google Scholar]
- 51. Masuda T, Furue M, Matsuda T (2004) Novel strategy for soft tissue augmentation based on transplantation of fragmented omentum and preadipocytes. Tissue Eng. 10, 1672–1683. [DOI] [PubMed] [Google Scholar]
- 52. Moseley TA, Zhu M, Hedrick MH (2006) Adipose‐derived stem and progenitor cells as fillers in plastic and reconstructive surgery. Plast. Reconstr. Surg. 118, 121S–128S. [DOI] [PubMed] [Google Scholar]
- 53. Matsumoto D, Sato K, Gonda K, Takaki Y, Shigeura T, Sato T et al (2006) Cell‐assisted lipotransfer: supportive use of human adipose‐derived cells for soft tissue augmentation with lipoinjection. Tissue Eng. 12, 3375–3382. [DOI] [PubMed] [Google Scholar]
- 54. Yoshimura K, Asano Y, Aoi N, Kurita M, Oshima Y, Sato K et al (2009) Progenitor‐enriched adipose tissue transplantation as rescue for breast implant complications. Breast J. 16, 169–175. [DOI] [PubMed] [Google Scholar]
Associated Data
This section collects any data citations, data availability statements, or supplementary materials included in this article.
Supplementary Materials
Fig. S1 Effect of pre‐hypoxia exposure on the osteogenic differentiation of h AT ‐ MSC s. Von Kossa's staining in monolayer cultures. (a) Experimental plan. hAT‐MSCs were cultured in monolayer under hypoxia in complete growth control medium (GM) for 7 days and transferred to normoxia in the presence of GM (b) or the osteogenic differentiation cocktail medium (DM) (c) for a period of 34 days. Alternatively, hAT‐MSCs were cultured in normoxia and then exposed for the same time either to GM (d) or DM (e). Von Kossa's staining was performed to quantify mineralization. Von Kossa's staining controls: (f) negative and (g) positive (mouse E18.5) are shown illustrating embryonic bone. Bar = 100 μm.
Fig. S2 Effect of pre‐hypoxia exposure on the osteogenic differentiation of h AT ‐ MSC s. Alizarin red S staining in monolayer cultures. (a) Experimental plan. hAT‐MSCs were cultured in monolayer under hypoxia in complete growth control medium (GM) for 7 days and transferred to normoxia in the presence of GM (b) or the osteogenic differentiation cocktail medium (DM) (c) for a period of 34 days. As controls, hAT‐MSCs were cultured in normoxia and then exposed for the same time either to GM (d) or DM (e). Alizarin red S staining was performed to quantify calcium depositions. Alizarin red S staining controls: (f) negative and (g) positive (mouse E 18.5) are shown illustrating embryonic bone. Bars = 100 μm.
Fig. S3 Effect of hypoxia on the DNA distribution. (a, b) Cell cycle distribution and percent (c) of PI‐labelled hAT‐MSCs in different phases of the cell cycle after 7 days culture either in normoxia or in hypoxia (n = 3). The percentage of sub‐G1 cells (apoptotic bodies) was lower in hypoxia compared to the normoxic counterpart.
Fig. S4 Effect of pre‐hypoxia exposure on chondrogenic differentiation of h AT ‐ MSC s: Alcian blue staining in monolayer cultures. (a) Experimental plan. hAT‐MSCs were pre‐cultured in monolayer under hypoxia in control growth medium (GM) for 7 days and transferred to normoxia in the presence of GM (b) or the chondrogenic differentiation cocktail medium (DM) (c) for a period of 19 days. As controls, hAT‐MSCs were cultured in normoxia and then exposed for the same time either to GM (d) or DM (e). Chondrogenic differentiation was assessed with Alcian blue staining to visualize sulphated proteoglycan production. Alcian blue control staining: (f) positive control (adult mouse large intestine illustrating positive goblet cells) is shown. Bars = 100 μm.
Fig. S5 Effect of pre‐hypoxia exposure on chondrogenic differentiation of h AT ‐ MSC s: Toluidine blue staining in pellet cultures. Toluidine blue staining was performed to detect the presence of cartilage‐typical glycosaminoglycans. (a) Experimental plan. hAT‐MSCs were pre‐cultured in monolayer under hypoxia in control growth medium (GM) for 7 days and transferred to normoxia, in pellet cultures, in the presence of GM (b) or the chondrogenic differentiation cocktail medium (DM) (c) for a period of 27 days. As controls, hAT‐MSCs were cultured in normoxia and then exposed for the same time either to GM (d) or DM (e). A high magnification view (400×) of c and e in the insets, are shown. Toluidine positive staining control (mouse adult lung) is shown illustrating bronchial cartilage. Bars = 100 μm.
Fig. S6 Effect of pre‐hypoxia exposure on chondrogenic differentiation of h AT ‐ MSC : Safranin O staining in pellet cultures. Safranin O staining was performed to detect cartilage. (a) Experimental plan. hAT‐MSCs were pre‐cultured in monolayer under hypoxia in control growth medium (GM) for 7 days and transferred to normoxia, in pellet cultures, in the presence of GM (b) or the chondrogenic differentiation cocktail medium (DM) (c) for a period of 27 days. As controls, hAT‐MSCs were cultured in normoxia and then exposed for the same time either to GM (d) or DM (e). A high magnification view (400×) of c and e in the insets, are shown. Safranin O positive staining control (mouse E18.5) is shown illustrating embryonic cartilage. Bars = 100 μm.
Fig. S7 Effect of pre‐hypoxia exposure on chondrogenic differentiation of h AT ‐ MSC : Masson's Trichrome staining in pellet cultures. Masson's Trichrome staining was performed to visualise collagen fibres. (a) Experimental plan. hAT‐MSCs were pre‐cultured in monolayer under hypoxia in control growth medium (GM) for 7 days and transferred to normoxia, in pellet cultures, in the presence of GM (b) or the chondrogenic differentiation cocktail medium (DM) (c) for a period of 27 days. As controls, hAT‐MSCs were cultured in normoxia and then exposed for the same time either to GM (d) or DM (e). A high magnification view (400×) of c and e in the insets, are shown. Human tongue was used as a Masson's Trichrome positive staining control for collagen. Bars = 100 μm.