

Abstract
Objectives
Often, non‐small cell lung cancers (NSCLC) respond only poorly to the tyrosine kinase inhibitor (TKI) gefitinib, which targets the epidermal growth factor receptor (EGFR), these poor responders EGFRs lacking activating mutations. In this study, we have attempted to improve TKI response of NSCLC cell lines (A549 and H1299) devoid of EGFR mutations, by combination of gefitinib and 5‐ALA/photodynamic therapy (PDT).
Materials and methods
Cells of the two lines were incubated with gefitinib (from 0.5 to 50 mm, for 48 h) then irradiated at doses ranging from 4 to 20 J/cm2; 5‐ALA concentration and incubation time were kept constant (1 mm for 3 h). We analysed cell viability, colony‐forming efficiency, cell cycle parameters, proteasome and NF‐κB activity and expression patterns of specific proteins, after individual or combined treatments.
Results
Effects (antagonistic, additive or synergistic) of combination treatment were evaluated using a predictive model (combination index) for expected interactive effects and results are consistent with mutual potentiation exceeding simple additivity. Investigation of molecular mechanisms underlying cytotoxic effects indicated that combination treatment impaired proteasome function, inhibited NF‐κB transcriptional activity and hampered AKT pro‐survival signalling.
Conclusions
The results of this study show that poor response of cells devoid of EGFR activating mutations to TKIs, can be overcome by combining gefitinib with 5‐ALA/photodynamic therapy (PDT).
Introduction
Lung cancer is a leading cause of cancer‐related mortality worldwide and successful treatment needs to take advantage of innovative strategies. Non‐small cell lung cancers (NSCLC), including adenocarcinoma, squamous cell carcinoma and large‐cell carcinoma, account for approximately 80% of all lung tumours 1. Currently, major advances in the understanding of cancer biology have identified new potential targets for novel therapies, and amongst these, metabolic processes and components of signalling pathways which represent the hallmarks of this cancer phenotype 2, are of major interest.
It is conceivable that combining cancer therapies that exploit cooperative effects of distinct pharmacological and/or physical remedies, administered together or in close sequence, could result in significant advantage such as reducing dosages and, thus toxicity of individual therapeutic components; moreover, non‐toxic chemical priming of cancer cells can make them succumb to otherwise ineffective physical intervention.
Epidermal growth factor receptor (EGFR), a tyrosine kinase receptor, is expressed in many NSCLC cells, and is a key actor in tumour cell proliferation, invasion, angiogenesis and survival 3, 4. Increased EGFR expression has been observed in a wide range of human malignancies, including 40–80% of NSCLC cells 5, 6; thus, EGFR inhibition has become one of the approaches to abate cancer cell proliferation 7. Two highly selective EGFR‐tyrosine kinase inhibitors (EGFR‐TKIs), the quinazoline‐derivatives gefitinib and erlotinib, have been evaluated in NSCLC patients; however, benefit from treatment with these agents has not been encouraging 8. Retrospective analyses of trials involving use EGFR‐TKIs in NSCLC patients suggest that presence of activating mutations in the tyrosine kinase domain of the EGFR gene and/or increased EGFR gene expression result(s) in improved clinical compliance 9, 10, 11.
In photodynamic therapy (PDT), a non‐toxic molecule (the photo‐sensitizer) accumulates preferentially in cancer cells and generates cytotoxic reactive oxygen species when excited by light of suitable wavelength and energy. Severe tumour cell damage ensues and micro‐vascular occlusion and late activation of host immune response 12, 13. PDT has been used to treat or relieve symptoms of NSCLC and many other types of malignant disorder 14, 15, 16.
One serious limitation of PDT is low penetration of light (specially when of less than 600 nm) in biological tissues; thus, energy decreases as it passes through cell layers, losing its cytotoxic potential. Although (through advanced fibre optic devices) light can be delivered to the inside of large tumours, the use of such devices is very invasive. This negates one of the main advantages of PDT – its potential for limited invasiveness.
An alternative means of easing limitation of light penetration could be to make cells more sensitive to low energy light levels, by pharmacological pre‐sensitization. Several preclinical studies and some clinical trials have shown that PDT, used in combination with conventional as well as newly developed treatments 17, offers promising outcomes and opens new therapeutic perspectives.
5‐aminolevulinic acid (5‐ALA) does not have any intrinsic photosensitizing effect, but when inside a cell generates the potent photo‐sensitizer protoporphyrin IX (PpIX); cells preloaded with PpIX are promptly killed when exposed to light 18. 5‐ALA conversion into PpIX occurs in almost every type of nucleate cell, but it occurs faster in rapidly proliferating cells 19. Rate of 5‐ALA conversion into PpIX, and accumulation of the latter, is up to 10 times higher in malignant cells than in their normal counterparts 20; thus, cancer cells are preferentially subject to light‐induced destruction 21.
In this study, we have explored the effects of combining two therapeutic approaches that have been used individually to treat NSCLCs, namely gefitinib, the first selective inhibitor of EGFR tyrosine kinase domain, and 5‐ALA/PDT. Our in vitro experimental model uses two NSCLC cell lines, H1299 and A549. These cells were chosen as they are known to be poor responders to gefitinib alone [both cell lines express normal numbers of functional EGF receptors devoid of activating mutations 22, 23]. As such, their response to the combination regimen might be magnified.
Materials and methods
Cell cultures
NSCLC cell lines H1299 (p53−/−) and A549 (p53+/+) were obtained from ATCC (Rockville, MD, USA). Saline solutions, media and serum were all obtained from Sigma (Sigma Aldrich, St Louis, MO, USA). H1299s were cultured in RPMI 1640, 2 mm l‐glutamine, 10 mmol/l HEPES, 1 mm sodium pyruvate, 2.5 g/l glucose, 1.5 g/l sodium bicarbonate and 10% FCS; A549s were cultured in F12K, 2 mm l‐glutamine and 10% FCS.
Gefitinib and 5‐ALA
Gefitinib (Iressa, Astra Zeneca) was kindly provided by Professor G. Tortora (University Federico II, Naples, Italy). Stock solution (50 mm) was obtained by dissolving the dry powder in 100% DMSO. 5‐aminolevulinic acid (Sigma Aldrich) stock solution (300 mm) was prepared in water and stored at −20 °C prior to use.
Light source
Cells were irradiated using the PTLPenta apparatus (Teclas, Sorengo, Switzerland) consisting of a halogen lamp (Osram 250 W – 24 V, Munich, Germany) equipped with a band pass filter with >80% transmittance. Light (~630 nm) was delivered through an 8‐mm bundle of optical fibre placed at such a distance from the cell plates to ensure uniform illumination of the entire cell monolayer.
Trypan blue exclusion assay after individual or combined treatment
We were aware from preliminary observations that H1299 cells are less sensitive than A549s to gefitinib and PDT. To collect more detailed information on cell response to individual or combined treatments, we performed viability dose–response curves of both cell lines used in this study.
Cells (5 × 10⁴) were seeded in 35‐mm plates and exposed, 24 h later, to individual or combined treatments (triplicate samples) as follows:
Gefitinib: H1299 and A549 cells were treated with 0–50 and 0–25 μm, respectively, for 48 h at 37 °C. After incubation, cells were washed and released into drug‐free medium.
PDT: both cell lines were treated with 1 mm 5‐ALA for 3 h in serum‐free medium, washed and irradiated with light doses from 0 to 12 J/cm2 for A549 and 0 to 20 J/cm2 for H1299 in Hank's solution. Following irradiation, cells were released into fresh culture medium.
Combination treatments: cells were first incubated for 48 h in increasing concentrations (0–10 μm) of gefitinib, then with 5‐ALA 1 mm for 3 h. Photodynamic treatments were performed using different light fluences, 0, 2, 4, 6 and 8 J/cm2 for H1299 and 0, 2, 4 and 6 J/cm2 for A549 cells. Following treatment cells were released into fresh medium.
Cell viability was evaluated by trypan blue exclusion assay (Sigma Aldrich) 24 h after single or combined treatments. Residual viability was expressed as percentage of stain‐negative cells versus control. Each point represents mean of triplicate measurements (±SD).
Combination index (CI)
Effects of combined treatments were evaluated using Chou‐Talalay's combination index method 24, applying the following formula for mutually exclusive agents that have independent modes of action:
where D 1 and D 2 are doses required for each treatment to produce x% effect when used in combination; (Dx)1 and (Dx)2 are doses required for each treatment to produce x% effect when used individually. According to this method, CI < 1 indicates synergy, CI = 1 additive effect, and CI > 1 antagonism.
The parameter used as ‘effect’ to calculate the combination index was percentage of cells surviving single treatments, or combined treatments, as determined by trypan blue exclusion assay.
XTT assay
Routinely, 1.5 × 10³ cells/well were seeded in 96‐well plates and used 24 h later. Metabolic activity was assessed in cells subjected to three concentrations of gefitinib (2, 5 and 10 μm for H1299 or 0.5, 1 and 2 μm for A549 cells) or two light fluences (6 and 12 J/cm2 for H1299 or 4 and 8 J/cm2 for A549 cells) using the Cell Proliferation Kit II (Roche, Penzberg, Germany).
Measurements were taken 1, 6 and 24 h after treatment. Incubation with XTT reagent was performed for 2 h at 37 °C. Absorbance at 490 nm (ELISA plate reader; BioRad, Milan, Italy) was measured in triplicate samples and data were normalized for protein content of cells still attached after treatment [measured in cell lysed in 0.1m NaOH according to Bradford 25].
Residual cell metabolic activity was expressed as percentage of that of untreated cells. Each point represents the mean of triplicate assessments (±SD).
Clonogenic assay
Clonogenic assay is a survival test based on the ability of an initial single cell to proliferate into a colony. Cells (2 × 10³) were seeded into 35‐mm plates and treated as described above for the monotherapy regimen. For combination treatments, cells were exposed for 48 h to different concentrations of gefitinib, incubated with 1 mm 5ALA for 3 h and irradiated thereafter. Combination treatments for H1299 cells were: 2 μm gefitinib + 8 J/cm2, 5 μm gefitinib + 6 J/cm2 and 10 μm gefitinib + 2 J/cm2. Combination treatments for A549 cells were: 0.5 μm gefitinib + 6 J/cm2, 1 μm gefitinib + 4 J/cm2 and 2 μm gefitinib + 2 J/cm2. After 10 days, colonies were stained for 2 h with 1% methylene blue in ethanol/PBS (1:1), photographed and counted (only colonies containing ≥50 cells were included).
Senescence‐associated (SA)‐β‐galactosidase assay
β‐galactosidase staining was assayed in triplicate samples by seeding 2 × 10³ cells in 35‐mm dishes, subjected to PDT only, as detailed in the previous scheme. Staining for SA‐β‐galactosidase was performed according to Dimri et al. 26 7 days after photosensitization. Adherent, SA‐β‐galactosidase‐positive cells were searched in random fields using bright field microscopy.
Cell cycle parameters
H1299 or A549 cells (1.2 × 10⁵) were seeded in 60 mm dishes. Twenty‐four hours later, cells were exposed to single or combined treatments as described above (clonogenic assay). Cells were detached by trypsinization 6 h after treatment, washed in phosphate‐buffered saline (PBS), and fixed in 70% ethanol. Before analysis, cells were washed in PBS, resuspended in 400 μl PBS containing 1 μg RNase (Roche) and 20 μg propidium iodide (Sigma Aldrich) and stored in the dark for 20 min at room temperature. Fluorescence was detected using the 488 nm laser line with a CyAn ADP Flow Cytometer (DAKO Cytomation, Milan, Italy). In the order of 20 000 events (≥15 000 cells) were recorded for each sample (in triplicate). Cell cycle profiles were analysed using ModFit/LT 3.2 version (Verity Software, Topsham, ME, USA). Data were obtained from three independent experiments and expressed as mean ± SD.
Proteasome activity assay
Assays were carried out using Proteasome‐Glo™ Chymotrypsin‐Like, Trypsin‐Like and Caspase‐Like Cell‐Based Assays (Promega, Promega Italia, Milan, Italy USA) according to manufacturer's instructions. Cells (1.5 × 10³) were seeded into 96‐well plates and twenty‐four hours later were exposed to single or combined treatments as indicated above. Proteasome activity was evaluated 1 and 6 h later by measuring chemiluminescence (triplicate samples) in a Promega luminometer. Positive controls for proteasome inhibition were cells exposed to 2.5 nm Bortezomib for 4 h 27. Proteasome activities were measured in three independent experiments and reported as percentage of activity (±SD) of control cells.
NF‐κB activity – luciferase assay
To monitor transcriptional activity of NF‐κB, we used a reporter plasmid (kindly provided by Professor A. Leonardi, University Federico II, Naples, Italy) in which the promoter contained a NF‐κB responsive element to drive expression of a firefly luciferase. As internal control, we used a vector coding for Renilla luciferase that was simultaneously co‐transfected. Transfection mix was then constituted by 5 μl of Lipofectamine2000™ (Invitrogen, Monza, Italy) containing 2 μg of plasmidic DNA (ratio NF‐κB luciferase/Renilla luciferase 9:1 w/w) and the mix was added to H1299 and A549 cells 24 h after seeding (6 × 10⁴/35‐mm plate). The transfection mix was removed from cells 6 h later and treated (single or combined treatments) as outlined above. TNFα (2U/μl for 6 h) was used as positive control.
Dual light luciferase assay (Promega) was performed according to manufacturer's instructions. Assays, repeated three times with triplicate samples, were performed 6 and 12 h after each treatment. Results are reported as percentage of control and are expressed as the mean ± SD.
Western blot analysis
Appropriate quantities of protein extracts were obtained from 2.0 × 10⁵ H1299 or A549 cells seeded in 100‐mm plates, and exposed to single or combined treatment as detailed below:
Gefitinib alone: H1299 cells were incubated with 5 and A549 cells with 1 μm gefitinib for 48 h, then washed and released into drug‐free medium;
PDT alone: H1299 and A549 cells were incubated with 1 mm 5‐ALA for 3 h in serum‐free medium, washed and irradiated with light fluences of 6 J/cm2 and 4 J/cm2, respectively.
Combination treatment: H1299 cells were treated with 5 μm gefitinib and a light fluence of 6 J/cm2 for H1299 cells, whereas A549 were treated with 1 μm gefitinib and a light fluence of 4 J/cm2.
Following treatments, cells were harvested by trypsinization 6 or 12 h later, washed in PBS and collected by centrifugation. Total cell protein extracts were obtained as described previously 27. Protein concentration was measured according to the Bradford method 25.
Polyacrylamide gels were prepared essentially as described by Laemmli 28. Molecular weight standards were from Fermentas LifeSciences (distributed by M‐Medical, Milan, Italy).
Proteins separated on polyacrylamide gels were blotted on to nitrocellulose filters (Hybond‐C pure; GE Healthcare, Naples, Italy). Filters were washed in TBS‐T 0.1%, blocked in 5% non‐fat dry milk in TBS‐T 0.1%, incubated with specific primary antibodies and then with secondary antibodies conjugated to horseradish peroxidase (BioRad). Filters were developed using an electro‐chemiluminescent western blotting detection reagent (Roche) and profiles were collected using Discover Pharmacia scanner equipped with a Sun Spark Classic Workstation.
Anti‐PARP, ‐AKTP‐Ser473 and anti‐tubulin antibodies were from Santa Cruz Biotechnology (Santa Cruz, CA, USA) and anti‐AKT and anti‐caspase 9 antibodies were from Cell Signaling (Danvers, MA, USA); anti‐LC3B (ab5152) antibody was from Abcam (Cambridge, UK).
Statistical analysis
Significance was assessed using Student's t test for comparison between two means (P values: *<0.1; **<0.01; ***<0.001).
Results
5‐ALA/PDT reduced both H1299 and A549 cell viability
Dark toxicity was assessed by performing the trypan blue exclusion test, colony‐forming and XTT assays of cells incubated for 3 h with increasing concentrations of 5‐ALA (0.5, 1.0 and 2.0 mm). As none of the above measurements was appreciably affected (data not shown), we concluded that 5‐ALA was not toxic to our cells per se. Thus, all photodynamic treatments performed were carried out on cells incubated with 1 mm 5‐ALA for 3 h in serum‐free medium, following established procedures 29, 30. Dose–response curves were obtained by irradiating cells with increasing light doses and measuring residual cell viability (trypan blue), clonogenicity (colony‐forming assay) and metabolic activity (XTT).
Trypan blue data reported in Fig. 1 (panels a and d) show that the photodynamic effect had high impact on cell viability; they also show that H1299 cells were substantially more resistant than A549 cells. ICs50 were: ~12 and ~6 J/cm2 for H1299 and A549, respectively.
Figure 1.
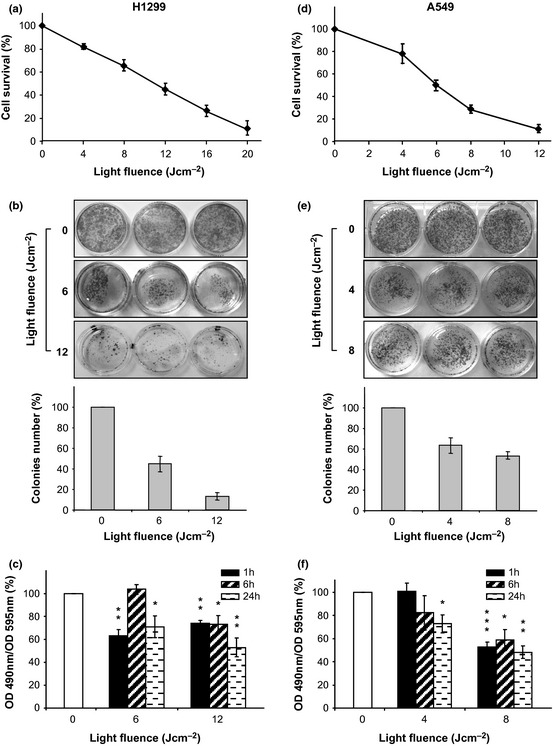
5‐ ALA / PDT reduced cell viability. Cells were incubated with 5‐ALA for 3 h and irradiated at 630 nm with increasing light fluences. (a and d) The number of live cells was measured 24 h after irradiation by trypan blue assay and expressed as% of controls (diamonds). Each point represents the average of triplicate measures (±SD). (b and e) Colony‐forming assay 10 days after irradiation. Colony counting and pictures of cells are reported as a function of the light fluence. Each bar represents the average of triplicate measures (±SD). (c and f) Residual cell metabolic activity (% of controls) after PDT as measured by XTT assay. Measurements were performed 1, 6 and 24 h after irradiation as indicated. Each bar represents the average of triplicate measures (±SD). Statistical significance (in respect to control): P values: *<0.1; **<0.01; ***<0.001.
Colony‐forming assays (Fig. 1, panels b and e) indicated clear reduction in colony number and size for both cell lines, with cytotoxic effects becoming more evident with increasing light fluences. The trend, clearly visible by observing the stained plates, were also measured quantitatively by colony counting. This assay provided additional information as it showed that not all cells that appeared still to be alive 24 h after PDT, could form new colonies. Premature senescence, as a cause for such impairment, has been be ruled out as neither changes in cell morphology (senescent cells would be enlarged and flattened) nor increased activity of SA‐β‐galactosidase, both considered hallmarks of premature senescence 26, were detected (data not shown).
Figure 1 (panels c and f) depicts results of XTT assays performed on cells irradiated with light doses as described above, and subsequently incubated in fresh complete culture medium for 1, 6 or 24 h. Data reported were normalized for total protein content to account for reduction in live cells and/or stress‐induced impairment of mitochondrial activity. Cells that survived PDT were unable to regain their original metabolic activity, specially when higher fluences were used. Findings obtained by evaluation of mitochondrial activity (grossly representing general conditions of cells), strengthen conclusions of the colony‐forming experiments and possibly suggest an explanation for them.
Gefitinib affected both H1299 and A549 cell proliferation
Panels a and d of Fig. 2 show that gefitinib (up to 25 μm for A549 and up to 50 μm for H1299) caused dose‐dependent reduction in viability of both cell lines, as assessed by trypan blue exclusion assays, performed 24 h after drug removal. ICs50 for gefitinib were ~20 μm and ~4 μm for H1299 and A549, respectively.
Figure 2.
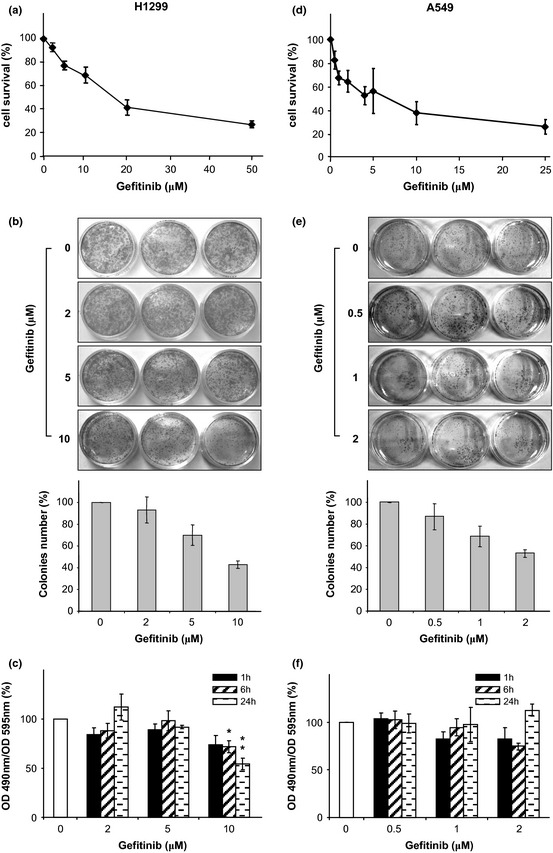
Gefitinib reduced cell proliferation. Cells were incubated with increasing concentrations of gefitinib for 48 h. (a and d) The number of live cells was measured 24 h after drug removal by trypan blue exclusion assay and expressed as % of controls (diamonds). Each point represents the average of triplicate measures (±SD). (b and e) Colony‐forming assay 10 days after drug removal. Colony counting and pictures of cells are reported as a function of Gefitinib concentrations. Each bar represents the average of triplicate measures (±SD). (c and f) Residual cell metabolic activity (% of controls) as measured by XTT assay. Measurements were performed 1, 6 and 24 h after drug removal as indicated. Each bar represents the average of triplicate measures (±SD). Statistical significance (in respect to control): P values: *<0.1; **<0.01; ***<0.001.
Different sensitivities of the two cell lines, to gefitinib, has been already described 31, 32, 33; also, it has been reported that effects of Gefitinib on proliferation are reversible 33. These findings prompted us to test whether after drug removal, clonogenic potential of surviving cells would be re‐established. Clonogenic assays were carried out on cells exposed for 48 h to increasing concentrations of gefitinib (0.5, 1 and 2 μm for A549; 2, 5 and 10 μm for H1299). As shown in Fig. 2 (panels b and e) qualitatively (images) and quantitatively (bar plot), clonogenic assays performed 10 days after drug removal demonstrated that for both cell lines studied, proliferation resumed and numbers of new colonies were roughly proportional to numbers of cells that survived treatment.
Effects of gefitinib on metabolic activity of cells exposed for 48 h to increasing concentrations of the drug, were also investigated; XTT assays were performed 1, 6 and 24 h after drug removal. When data were normalized for total proteins, as discussed above, it became apparent that metabolic activity was reversibly affected (Fig. 2 panels c and f) as it was fully restored over time. Substantial impairment of metabolic activity of H1299 cells, suggestive of true cytotoxic effects of the drug, was observed only at gefitinib concentration of ≥10 μm. It appears that, within the concentration ranges used, gefitinib predominantly exerted a cytostatic effect. Decline in rates of proliferation appeared to last only for a short time after drug removal, and even so, findings obtained by evaluation of mitochondrial activity were in accord with conclusions obtained form the colony‐forming experiments, confirming gefitinib's cytostatic effects.
Effect on cell viability of combining gefitinib with 5‐ALA/PDT
To evaluate combined effects of gefitinib and 5‐ALA/PDT, cells were pre‐treated for 48 h with increasing concentrations of gefitinib, then exposed to 1 mm 5‐ALA, and subsequently irradiated at different light fluences; cell viability was assessed by trypan blue exclusion. Figure 3 depicts dose‐dependent survival curves of cells exposed to increasing concentrations of gefitinib and irradiated at different light fluences (each curve refers to the same light fluence, as indicated). Combination indices (CI) were calculated according to the Chou‐Talalay method 24 and are reported as numerical values next to each experimental point (Fig. 3). It is to be noted that the majority of CI values are <1.0, suggesting that combined treatments seemed to generate a synergistic effect.
Figure 3.
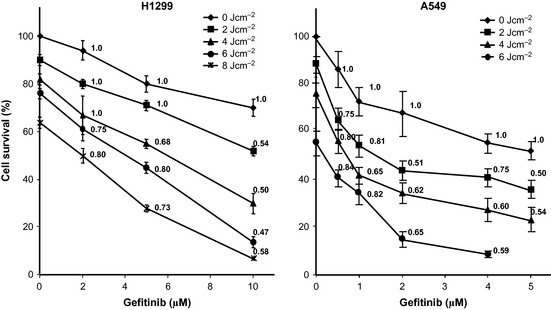
Effect of combining gefitinib with 5‐ ALA / PDT on cell viability and calculation of CI . Dose–response curves of combination regimens in which cell viability (trypan blue exclusion assay) is reported as a function of gefitinib concentrations at increasing established light fluences (diamonds, squares, triangles, dots and stars represent light fluences of 0, 2, 4, 6 and 8 J/cm2, respectively). Tests were performed 24 h after any treatment. Points represent the average of triplicates (±SD) and are expressed as per cent of control. Numerical data reported next to the experimental points, are the CIs of the specific combinations.
We studied early (6 h) and late (10 days) effects. Early effects were evaluated by analysing cell cycle profiles; late effects were evaluated by colony‐forming assay.
Cell cycle profiles were analysed for cells treated with either gefitinib alone or in combination with PDT and results of three independent experiments are reported in Fig. 4 (panel a, refers to H1299, panel b to A549 cells). For both cell lines, gefitinib promoted dose‐dependent G1 accumulation. Similar results have been reported on a variety of NSCLC cell lines 32; PDT alone had different effects on the two cell lines investigated here. Thus, H1299 cells had light dose‐dependent accumulation in S phase, whereas A549 cells exhibited no significant response. This divergent behaviour (which is currently under further investigation) could reflect different responses between cells of different genetic backgrounds, to cell stress.
Figure 4.
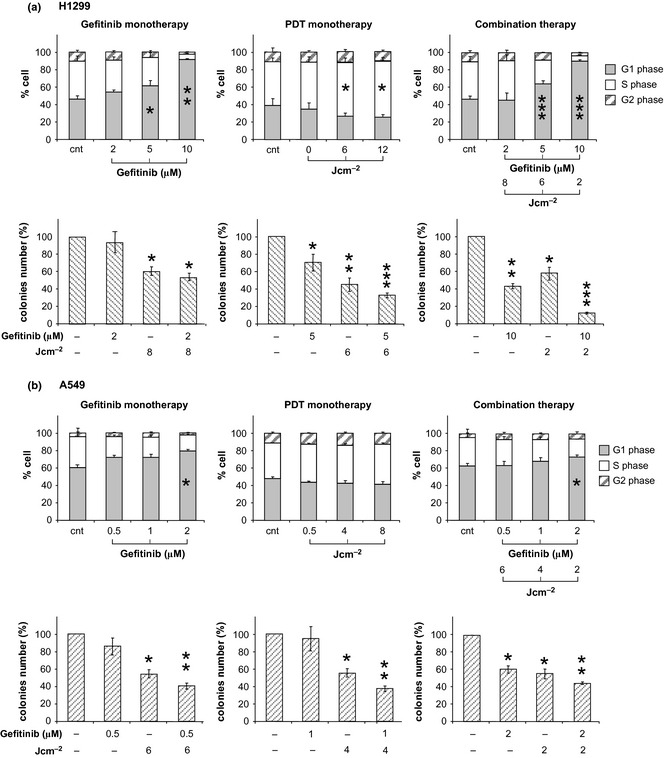
Effects of mono‐ and combined therapy cells on cycle profiles and colony‐forming capability. The panels a and b are referred to H1299 and A549 cells, respectively. Cell cycle profiles were collected 6 h after each individual or combined treatment. Each bar represents the per cent cell distributions within each phase. The bars represent the average of three independent experiments (±SD). Colony counting was performed at day 10 of culture in fresh medium after the specified (individual or combined) treatments. Data from triplicate experiments (±SD) have been expressed as per cent of the number of colonies counted in the respective controls. Statistical significance (in respect to control): P values: *<0.1; **<0.01; ***<0.001.
Combined treatments were performed with 3 combinations of gefitinib concentration and light fluence, which caused 40% survival in A549 cells and 50% survival in H1299 cells; these were characterized by combination indices of <<1. Prevalent effects of combined treatments, in both cell lines, was accumulation in G1. This can be attributed primarily, to gefitinib, as the result was more evident at higher concentrations of the drug.
Clonogenic assays were performed in parallel on cells that survived combined treatments. Colony counting showed effectiveness of combination treatments as the ability of cells exposed to combination regimens to form colonies appeared to be significantly reduced, not only in comparison to controls but also with individual treatments (Fig. 4). Consistent with data of Fig. 1, reduction of clonogenic potential could be attributed to impairment of cell metabolic activity caused by PDT. This interpretation is supported by comparative analysis of data of both colony‐forming assays and XTT after single treatments. Thus it appeared that while gefitinib (at concentrations used) mostly exerted transient cytostasis, effects of PDT were sustained over long periods.
5‐ALA/PDT or/and gefitinib affected proteasome function and NF‐κB transcriptional activity
ALA/PDT inhibited proteasomal activity in both A549 and H1299 cells (Fig. 5, panels a and b). As is the case for Photofrin/PDT 27, proteasomal inhibition observed after ALA/PDT was reversible, as release of irradiated cells in fresh medium resulted in time‐dependent recovery of proteasomal activity (up to 75% at 6 h). Gefitinib, albeit to a lesser extent, inhibited the proteasome; however, this inhibition faded within an hour after drug removal. Combining the two treatments caused slightly more pronounced (relative to individual treatments), but still reversible, impairment of proteasomal activity.
Figure 5.
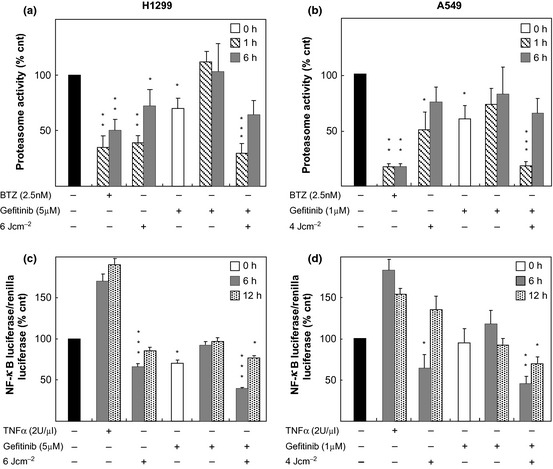
5‐ ALA / PDT and/or gefitinib affected proteasome and NF ‐κB activities. (a and b) Proteasome activities were measured after treatments (as indicated) and expressed as per cent of controls. Each bar represents the average of triplicate measures (±SD) of three independent experiments. (c and d) NF‐κB activities were determined by dual‐luciferase assay after the treatments (as indicated). Bars refer to the ratio of the two chemiluminescent signals of Firefly and Renilla luciferases expressed relatively to controls (%). Each bar represents the average of triplicate measures (±SD) of three independent experiments. Statistical significance (in respect to control): P values: *<0.1; **<0.01; ***<0.001.
Because of the known close relationship between the proteasome and NF‐κB activity, we decided also to monitor also transcriptional activity of NF‐κB. In this regard, transcriptional activity of NF‐κB in our cells before and after treatment with gefitinib and/or 5‐ALA/PDT was evaluated in cells transfected with a reporter vector coding for luciferase, under transcriptional control of a promoter containing NF‐κB responsive elements. Cells harbouring the luciferase gene were exposed to single and/or combined treatments (5 μm Gefitinib‐6 J/cm2, for H1299 and 1 μm Gefitinib‐4 J/cm2, for A549) and analysed 6 and 12 h later.
In line with previous observations that NF‐κB is constitutively activated in several NSCLC cell lines 34 we found high basal activity in both H1299 and A549 cells. Transcriptional activity was reduced in H1299s, and marginally (if any) in A549 cells, after exposure to gefitinib alone. For both cell lines, drug removal from culture media caused full recovery of NF‐κB activity within 6 h (Fig. 5, panels c and d). Greater reduction of NF‐κB activity was observed in cells subjected to 5‐ALA/PDT, even at non‐lethal doses (6 and 4 J/cm2 for H1299 and A549, respectively); moreover, recovery was much slower as it needed in the order of 12 h to complete (Fig. 5, panels c and d). After combined treatment, reduction in NF‐κB activity (at 6 h) was more important, and its recovery was not complete even by 12 h after release into fresh medium.
Reduction in NF‐kB activity in H1299 cells measured at 6 h was statistically significant, not only with respect to controls (P<***) but also with respect to both monotherapies (P<*). Under our conditions, however, reduction in this activity in A549 cells assumed statistical significance, besides controls, only with respect to gefitinib (P<*). When NF‐kB activities were analysed later (after at least twelve hours) for individual or combined treatments, differences were no longer statistically significant except those between controls and combined treatments (P<*).
Cell survival and cell death
Occurrence of apoptosis and/or autophagy in both H1299 and A549 cells was assessed after individual or combined treatments; we attempted to characterize induction of apoptosis by probing one initial and one final step of the process, that is, occurrence of caspase‐9 activation 35 and cleavage of poly‐(ADP‐ribose) polymerase (PARP) 36. Western blot profiles of proteins from extracts obtained from both cell lines treated with 5‐ALA/PDT and gefitinib, used individually or in combination, indicated that none of these treatments produced apoptosis as they did not activate caspase‐9 nor did they modify basal levels of PARP fragmentation (Fig. 6). Such findings are also in line with cell cycle profiles that we obtained under the various conditions, as cell debris and apoptotic cells (that would appear in the SubG1 fraction) did not increase in treated compared to controls, in any condition (data not shown).
Figure 6.
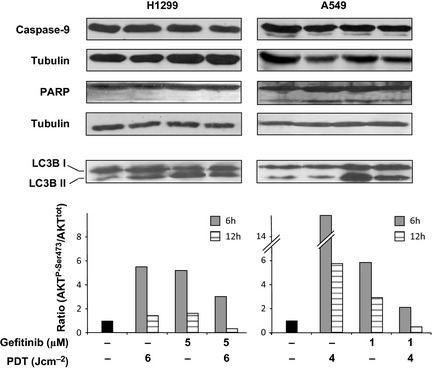
Expression of proteins involved in cell death and survival after individual or combined therapy. Western blots: Typical expression patterns of caspase‐9, PARP and LC3B (I and II) under various conditions (as indicated). Proteins extracts for immunoblottings were obtained 12 h after the indicated treatments. Tubulin was used for loading control. Semiquantitative assessment of AKT activation. This was achieved by scanning immunoblots of AKTP ‐Ser473 and total AKT obtained from cell extracts at 6 and 12 h after each treatment. The bars express the changes in the AKTP ‐Ser473/AKT ratios relatively to the basal condition.
To assess occurrence of autophagy, we measured conversion of LC3B‐I in LC3B‐II 37 twelve hours after treatments. It was observed that 5‐ALA/PDT induced autophagy in H1299 cells, but not in A549s, whereas gefitinib induced autophagy in both cell lines (Fig. 6). Such findings are in accord with recent reports 38; significant LC3B‐I/II conversion was also observed under combination regimens (Fig. 6).
As the PI3/AKT pathway plays a key role in intracellular signalling following EGF‐receptor activation 39, its inhibition is crucial for efficient therapeutic outcomes. For this reason, it seemed important to evaluate whether and how the status of AKT, constitutively active in the majority of NSCLC cells 33, would be affected by individual and combined treatments.
In both cell lines, 6 h after single treatment with either 5‐ALA/PDT or gefitinib, AKT was activated; however, its level (expressed as the ratio of AKTP‐Ser473/AKTtotal) was clearly lower in cells exposed to combined treatments (Fig. 6). This observation suggests that combination treatment elicited a weaker pro‐survival stimulus.
Twelve hours after individual or combined treatments, AKT activation was much less. In particular, after combination treatment, AKT activation abated to below basal levels (Fig. 6). Fading AKT activation is in line with reduction of cell survival that we have observed by trypan blue exclusion and colony‐forming assays (Figs 3 and 4).
Discussion
There are forms of non‐small cell lung cancer (NSCLC) that respond poorly to the tyrosine kinase inhibitor (TKI) gefitinib, which targets the epidermal growth factor receptor (EGFR). This happens particularly in tumours lacking EGFR‐activating mutations, whose presence instead, correlates with a therapeutic response. In this study, we investigated whether resistance of cells devoid of activating mutations could be overcome by combining gefitinib with 5‐ALA/ PDT. The rationale underlying combined therapy is to achieve elimination of neoplastic cells exploiting cooperative effects of two or more components whose individual activity is not sufficient to overcome cancer cell resistance.
As a photosensitizer for PDT, we chose 5‐ALA (rather than ALA methyl ester), as the former in our (as well as in other) in vitro systems 40 provides its more effective conversion into protoporphyrin IX. An additional advantage of combined therapy could be reduction of individual doses of therapeutic partners, and thus their toxic side effects.
In this work, we have analysed effects of combining low concentrations of gefitinib with a low dose of 5‐ALA/PDT, on two NSCLC cell lines which naturally respond poorly to TKIs.
Taken individually, both therapeutic approaches suffer some limitations. For instance, effects of gefitinib alone on cell proliferation are reversible, and assume a appreciable level of cytotoxicity only at high concentrations. Similarly, several factors limit PDT efficacy in a clinical setting. Among these, particularly critical are the low level of effective penetration of light into tissues and heterogeneity of its distribution. This implies that cells closer to the light source are most affected and likely to proceed to necrosis, whereas peripheral cells may undergo only partial photosensitization and less dramatic responses, such as reversible damage. Our observations show that appropriate combination of two approaches results in cooperative effects and warrants consideration for potential clinical application.
Combined cytotoxic effects of gefitinib and PDT are far more pronounced and durable than gefitinib or PDT alone. Thus, when combined with PDT, gefitinib becomes a cell killer also in those that do not express EGF receptors harbouring ‘activating mutations’ 9, 10, 11 – such as both the non‐small‐cell lung cancer cell lines A549 and H1299 22, 23 used here. At variance with individual treatments, combination treatments result in synergistic abatement of cell viability, as indicated by the CI values, showing cooperativity of combined intervention in both cell lines.
Looking closer at cell death, we observed that apoptosis was not the main pathway triggered by combination treatment; rather the pathway was autophagy followed by necrosis. Autophagy has been considered to be a pro‐survival response of damaged cells. However, on the basis of our experimental results and previous observations by others 41, we are keen to believe that when autophagy involves a greater number of cells resistant to apoptosis [resistance to apoptosis in NSCLC cells, such as A549 and H1299, has been reported by Brognard et al. 42], extensive autophagy may lead to necrosis. This appears to be the case here as we have observed massive staining of necrotic A549 and H1299 cells with trypan blue, after combined treatments.
Although 5‐ALA/PDT and to a lesser extent, gefitinib individually impaired proteasomal activity, combined effects of the two agents was far stronger and durable. Proteasome impairment caused disruption of NF‐κB signalling, not only through degradation of phosphorylated and ubiquitinated IκB (43 but also by processing of larger precursors necessary for its final assembly 44. We have shown that gefitinib and PDT combined induced proteasome stalling and significant reduction in NF‐κB transcriptional activity. NF‐κB signalling is strongly involved in lung tumourigenesis 45 and inhibition of its signalling pathway is a legitimate approach for treatment. In accord with previous hypotheses 46, therapeutic efficacy may be reached only when NF‐κB activity is reduced below a certain threshold. In our hands, this threshold was broken combining gefitinib with PDT. It is conceivable that such combination prolonged abatement of NF‐κB signalling for a time interval sufficient to prevent recovery of the affected cells.
Furthermore, we found that mono‐ and combined therapies induced activation of AKT above basal levels, possibly representing a cell pro‐survival response to stress. According to many, AKT activation status may be responsible for resistance to therapy and, in particular, to treatments with EGFR antagonists 39. For this, AKT is considered to be an important target for successful cancer therapy. In this regard, the finding that under combined regimens activation of AKT in both cell lines was reduced with respect to mono‐therapies 6 h after treatment, is noteworthy. At 12 h, combination therapy caused greater inhibition of AKT activation as its level was reduced to basal levels or less.
If PDT should improve therapeutic efficacy of gefitinib in resistant NSCLC cells, it is also true that the drug may potentiate PDT effectiveness. Indeed, it has been reported that gefitinib makes ALA/PDT more effective by reducing efflux of protoporphyrin IX (PpIX) from malignant tumour cells 47, through inhibition of the ATP‐binding cassette transporter ABCG2 48. Undoubtedly, this observation strengthens the argument of potentiation of combined gefitinib/5‐ALA‐PDT, even though, according to previous observations, expression of ABCG2 in freshly cultured A549 and H1299 cells is not constitutively detectable 49, 50.
In conclusion, the present work shows that combining 5‐ALA/PDT and gefitinib resulted in more efficient targeting of resistant NSCLC cells. This is likely to be achieved by interfering with cell machinery at different levels, that play pivotal roles in cancer cell biology. As PDT and EGFR inhibitors are both used in human therapies, data presented here could be considered for potential evaluation in clinical investigations.
Research funding
This work has been funded by the Italian Ministry of University (FIRB/MERIT project, contract E61J10000200001), by the POR Campania Research in Experimental Medicine (CREME) Salute Biotecnologie and, in part, by the Project TUFO (PON 01_02433, Human health and biotechnology).
The funding source was not involved in design, execution or writing of this experimental work.
References
- 1. Visbal AL, Leighl NB, Feld R, Shepherd FA (2005) Adjuvant chemotherapy for early‐stage non‐small cell lung cancer. Chest 128, 2933–2943. [DOI] [PubMed] [Google Scholar]
- 2. Hanahan D, Weinberg RA (2000) The hallmarks of cancer. Cell 100, 57–70. [DOI] [PubMed] [Google Scholar]
- 3. Arteaga CL (2003) ErbB‐targeted therapeutic approaches in human cancer. Exp. Cell Res. 284, 122–130. [DOI] [PubMed] [Google Scholar]
- 4. Zhang X, Chang A (2008) Molecular predictors of EGFR‐TKI sensitivity in advanced non‐small cell lung cancer. Int. J. Med. Sci. 5, 209–217. [DOI] [PMC free article] [PubMed] [Google Scholar]
- 5. Herbst RS, Shin DM (2002) Monoclonal antibodies to target epidermal growth factor receptor‐positive tumors: a new paradigm for cancer therapy. Cancer 94, 1593–1611. [DOI] [PubMed] [Google Scholar]
- 6. Sridhar SS, Seymour L, Shepherd FA (2003) Inhibitors of epidermal‐growth‐factor receptors: a review of clinical research with a focus on non‐small‐cell lung cancer. Lancet Oncol. 4, 397–406. [DOI] [PubMed] [Google Scholar]
- 7. Woodburn JR (1999) The epidermal growth factor receptor and its inhibition in cancer therapy. Pharmacol. Ther. 82, 241–250. [DOI] [PubMed] [Google Scholar]
- 8. Thatcher N, Chang A, Parikh P, Rodrigues Pereira J, Ciuleanu T, von Pawel J et al (2005) Gefitinib plus best supportive care in previously treated patients with refractory advanced non‐small‐cell lung cancer: results from a randomised, placebo‐controlled, multicentre study (Iressa Survival Evaluation in Lung Cancer). Lancet 366, 1527–1537. [DOI] [PubMed] [Google Scholar]
- 9. Lynch TJ, Bell DW, Sordella R, Gurubhagavatula S, Okimoto RA, Brannigan BW et al (2004) Activating mutations in the epidermal growth factor receptor underlying responsiveness of non‐small‐cell lung cancer to Gefitinib. N. Engl. J. Med. 350, 2129–2139. [DOI] [PubMed] [Google Scholar]
- 10. Paez JG, Jänne PA, Lee JC, Tracy S, Greulich H, Gabriel S et al (2004) EGFR mutations in lung cancer: correlation with clinical response to Gefitinib therapy. Science 304, 1497–1500. [DOI] [PubMed] [Google Scholar]
- 11. Hirsch FR, Varella‐Garcia M, Cappuzzo F, McCoy J, Bemis L, Xavier AC et al (2007) Combination of EGFR gene copy number and protein expression predicts outcome for advanced non‐small‐cell lung cancer patients treated with Gefitinib. Ann. Oncol. 18, 752–760. [DOI] [PubMed] [Google Scholar]
- 12. Dolmans DE, Fukumura D, Jain RK (2003) Photodynamic therapy for cancer. Nat. Rev. Cancer 3, 380–387. [DOI] [PubMed] [Google Scholar]
- 13. Dougherty TJ, Gomer CJ, Henderson BW, Jori G, Kessel D, Korbelik M et al (1998) Photodynamic therapy. J. Natl. Cancer Inst. 90, 889–905. [DOI] [PMC free article] [PubMed] [Google Scholar]
- 14. Hur C, Nishioka NS, Gazelle GS (2003) Cost‐effectiveness of photodynamic therapy for treatment of Barrett's esophagus with high grade dysplasia. Dig. Dis. Sci. 48, 1273–1283. [DOI] [PubMed] [Google Scholar]
- 15. Skyrme RJ, French AJ, Datta SN, Allman R, Mason MD, Matthews PN (2005) A phase‐1 study of sequential mitomycin C and 5‐aminolaevulinic acid‐mediated photodynamic therapy in recurrent superficial bladder carcinoma. BJU Int. 95, 1206–1210. [DOI] [PubMed] [Google Scholar]
- 16. Kato H (1998) Photodynamic therapy for lung cancer – a review of 19 years' experience. J. Photochem. Photobiol. B. 42, 96–99. [DOI] [PubMed] [Google Scholar]
- 17. Zuluaga MF, Lange N (2008) Combination of photodynamic therapy with anti‐cancer agents. Curr. Med. Chem. 15, 1655–1673. [DOI] [PubMed] [Google Scholar]
- 18. Kennedy JC, Pottier RH (1992) Endogenous protoporphyrin IX, a clinically useful photosensitizer for photodynamic therapy. J. Photochem. Photobiol. B. 14, 275–292. [DOI] [PubMed] [Google Scholar]
- 19. Uehlinger P, Zellweger M, Wagnieres G, Juillerat‐Jeanneret L, van den Bergh H, Lange N (2000) 5‐aminolevulinic acid and its derivatives: physical chemical properties and protoporphyrin IX formation in cultured cells. J. Photochem. Photobiol. B. 54, 72–80. [DOI] [PubMed] [Google Scholar]
- 20. Datta SN, Loh CS, MacRobert AJ, Whatley SD, Matthews PN (1998) Quantitative studies of the kinetics of 5‐aminolaevulinic acid induced fluorescence in bladder transitional cell carcinoma. Br. J. Cancer 78, 1113–1118. [DOI] [PMC free article] [PubMed] [Google Scholar]
- 21. Peng Q, Warloe T, Berg K, Moan J, Kongshaug M, Giercksky KE et al (1997) 5‐Aminolevulinic acid‐based photodynamic therapy: clinical research and future challenges. Cancer 97, 2282–2308. [DOI] [PubMed] [Google Scholar]
- 22. Nagashima T, Ushikoshi‐Nakayama R, Suenaga A, Ide K, Yumoto N, Naruo Y et al (2009) Mutation of epidermal growth factor receptor is associated with MIG6 expression. FEBS J. 276, 5239–5251. [DOI] [PubMed] [Google Scholar]
- 23. Tracy S, Mukohara T, Hansen M, Meyerson M, Johnson BE, Jänne PA (2004) Gefitinib induces apoptosis in the EGFRL858R non–small‐cell lung cancer cell line H3255. Cancer Res. 64, 7241–7244. [DOI] [PubMed] [Google Scholar]
- 24. Chou TC, Talalay P (1983). Quantitative analysis of dose effect relationship: the combined effects of multiple drugs on enzyme inhibitors In: Wever G, ed. Advances in Enzyme Regulation, pp. 27–55. New York: Pergamon Press. [DOI] [PubMed] [Google Scholar]
- 25. Bradford M (1976) A rapid and sensitive method for the quantitation of microgram quantities of protein utilizing the principle of protein dye binding. Anal. Biochem. 72, 248–254. [DOI] [PubMed] [Google Scholar]
- 26. Dimri GP, Lee X, Basile G, Acosta M, Scott G, Roskelley C et al (1995) A biomarker that identifies senescent human cells in culture and in aging skin in vivo. Proc. Natl. Acad. Sci. USA 92, 9363–9367. [DOI] [PMC free article] [PubMed] [Google Scholar]
- 27. Chiaviello A, Paciello I, Postiglione I, Crescenzi E, Palumbo G (2010) Combination of photodynamic therapy with aspirin in human‐derived lung adenocarcinoma cells affects proteasome activity and induces apoptosis. Cell Prolif. 43, 480–493. [DOI] [PMC free article] [PubMed] [Google Scholar]
- 28. Laemmli UK (1971) Cleavage of structural proteins during the assembly of the head of bacteriophage T4. Nature 227, 680–685. [DOI] [PubMed] [Google Scholar]
- 29. Coupienne I, Piette J, Bontems S (2010) How to monitor NF‐κB activation after photodynamic therapy. Methods Mol. Biol. 635, 79–95. [DOI] [PubMed] [Google Scholar]
- 30. Egli RJ, Di Criscio A, Hempfing A, Schoeniger R, Ganz R, Hofstetter W et al (2008) In vitro resistance of articular chondrocytes to 5‐Aminolevulinic acid based photodynamic therapy. Lasers Surg. Med. 40, 282–290. [DOI] [PubMed] [Google Scholar]
- 31. Rho JK, Choi YJ, Ryoo BY, Na II, Yang SH, Kim CH (2007) p53 enhances gefitinib‐induced growth inhibition and apoptosis by regulation of Fas in non–small cell lung cancer. Cancer Res. 67, 1163–1169. [DOI] [PubMed] [Google Scholar]
- 32. Chang GC, Hsu SL, Tsai JR, Liang FP, Lin SY, Sheu GT et al (2004) Molecular mechanisms of ZD1839‐induced G1‐cell cycle arrest and apoptosis in human lung adenocarcinoma A549 cells. Biochem. Pharmacol. 68, 1453–1464. [DOI] [PubMed] [Google Scholar]
- 33. Janmaat ML, Kruyt FA, Rodriguez JA, Giaccone G (2003) Response to epidermal growth factor receptor inhibitors in non‐small cell lung cancer cells: limited antiproliferative effects and absence of apoptosis associated with persistent activity of extracellular signal‐regulated kinase or AKT kinase pathways. Clin. Cancer Res. 9, 2316–2326. [PubMed] [Google Scholar]
- 34. Baby J, Pickering BF, Vashisht Gopal YN, Van Dyke MW (2007) Constitutive and inducible nuclear factor‐kappaB in immortalized normal human bronchial epithelial and non‐small cell lung cancer cell lines. Cancer Lett. 255, 85–94. [DOI] [PubMed] [Google Scholar]
- 35. Tait SWG, Green DR (2010) Mitochondria and cell death: outer membrane permeabilization and beyond. Nat. Rev. Mol. Cell Biol. 11, 621–32. [DOI] [PubMed] [Google Scholar]
- 36. Oleinick NL, Morris RL, Belichenko I (2002) The role of apoptosis in response to photodynamic therapy: what, where, why, and how. Photochem. Photobiol. Sci. 1, 1–21. [DOI] [PubMed] [Google Scholar]
- 37. Kabeya Y, Mizushima N, Ueno T, Yamamoto A, Kirisako T, Noda T et al (2000) A mammalian homologue of yeast Apg8p, is localized in autophagosome membranes after processing. EMBO J. 19, 5720–5728. [DOI] [PMC free article] [PubMed] [Google Scholar]
- 38. Han W, Pan H, Chen Y, Sun J, Wang Y, Li J et al (2011) EGFR tyrosine kinase inhibitors activate autophagy as a cytoprotective response in human lung cancer cells. PLoS ONE 6, e18691. [DOI] [PMC free article] [PubMed] [Google Scholar]
- 39. Bianco R, Gelardi T, Damiano V, Ciardiello F, Tortora G (2007) Mechanisms of resistance to EGFR inhibitors. Targ. Oncol. 2, 31–37. [Google Scholar]
- 40. Manivasager V, Yee KK, Heng PW, Soo KC, Olivo M (2006) A study comparing endogenous protoporphyrin IX induced by 5‐ALA and ALA‐methyl ester with exogenous PpIX and PpIX dimethyl ester in photodynamic diagnosis of human nasopharyngeal carcinoma xenografts. Int. J. Oncol. 29, 997–1002. [PubMed] [Google Scholar]
- 41. Ullman E, Fan Y, Stawowczyk M, Chen HM, Yue Z, Zong WX (2008) Autophagy promotes necrosis in apoptosis‐deficient cells in response to ER stress. Cell Death Differ. 15, 422–425. [DOI] [PMC free article] [PubMed] [Google Scholar]
- 42. Brognard J, Clark AS, Ni Y, Dennis PA (2001) AKT/protein kinase B is constitutively active in non‐small cell lung cancer cells and promotes cellular survival and resistance to chemotherapy and radiation. Cancer Res. 61, 3986–3997. [PubMed] [Google Scholar]
- 43. Palombella VJ, Rando OJ, Goldberg AL, Maniatis T (1994) The ubiquitin‐proteasome pathway is required for processing the NF‐kappa B1 precursor protein and the activation of NF‐kappa B. Cell 78, 773–785. [DOI] [PubMed] [Google Scholar]
- 44. Chang GC, Yu CT, Tsai CH, Tsai JR, Chen JC, Wu CC et al (2008) An epidermal growth factor inhibitor, Gefitinib, induces apoptosis through a p53‐dependent upregulation of pro‐apoptotic molecules and downregulation of anti‐apoptotic molecules in human lung adenocarcinoma A549 cells. Eur. J. Pharmacol. 600, 37–44. [DOI] [PubMed] [Google Scholar]
- 45. Zhenjian C, Tchou‐Wong KM, Rom WN (2011) NF‐kappaB in Lung Tumorigenesis. Cancers 3, 4258–4268. [DOI] [PMC free article] [PubMed] [Google Scholar]
- 46. An J, Rettig MB (2007) Epidermal growth factor receptor inhibition sensitizes renal cell carcinoma cells to the cytotoxic effects of bortezomib. Mol. Cancer Ther. 6, 61–69. [DOI] [PubMed] [Google Scholar]
- 47. Sun W, Kajimoto Y, Inoue H, Miyatake S, Ishikawa T, Kuroiwa T (2013) Gefitinib enhances the efficacy of photodynamic therapy using 5‐aminolevulinic acid in malignant brain tumor cells. Photodiagnosis Photodyn. Ther. 10, 42–50. [DOI] [PubMed] [Google Scholar]
- 48. An Y, Ongkeko WM (2009) ABCG2: the key to chemoresistance in cancer stem cells? Expert Opin. Drug Metab. Toxicol. 5, 1529–1542. [DOI] [PubMed] [Google Scholar]
- 49. Bram EE, Ifergan I, Grimberg M, Lemke K, Skladanowski A, Assaraf YG (2007) C421 allele‐specific ABCG2 gene amplification confers resistance to the antitumor triazoloacridone C‐1305 in human lung cancer cells. Biochem. Pharmacol. 74, 41–53. [DOI] [PubMed] [Google Scholar]
- 50. Hsieh JL, Lu CS, Huang CL, Shieh GS, Su BH, Su YC et al (2012) Acquisition of an enhanced aggressive phenotype in human lung cancer cells selected by suboptimal doses of cisplatin following cell detachment and reattachment. Cancer Lett. 321, 36–44. [DOI] [PubMed] [Google Scholar]