Abstract
Objective
To develop machine learning models for classifying the severity of opioid overdose events from clinical data.
Materials and Methods
Opioid overdoses were identified by diagnoses codes from the Marshfield Clinic population and assigned a severity score via chart review to form a gold standard set of labels. Three primary feature sets were constructed from disparate data sources surrounding each event and used to train machine learning models for phenotyping.
Results
Random forest and penalized logistic regression models gave the best performance with cross-validated mean areas under the ROC curves (AUCs) for all severity classes of 0.893 and 0.882 respectively. Features derived from a common data model outperformed features collected from disparate data sources for the same cohort of patients (AUCs 0.893 versus 0.837, p value = 0.002). The addition of features extracted from free text to machine learning models also increased AUCs from 0.827 to 0.893 (p value < 0.0001). Key word features extracted using natural language processing (NLP) such as ‘Narcan’ and ‘Endotracheal Tube’ are important for classifying overdose event severity.
Conclusion
Random forest models using features derived from a common data model and free text can be effective for classifying opioid overdose events.
Keywords: machine learning, opioid, phenotype, overdose, electronic health record
Graphical Abstract
1. Introduction
1.1. Background
Opioids are a class of drugs used to treat pain that exert most of their pharmacologic action through agonistic binding to mu opioid receptors located in areas of brain, spinal cord, and peripheral neurons. Common agents include the prototypical opioid morphine, which can be extracted from the opium poppy, derivatives of morphine such as hydrocodone, oxycodone, codeine, and heroin (diacetylmorphine), as well as synthetic opioids including tramadol, methadone, and fentanyl[1]. As with all drugs, the beneficial effect, in this case pain relief, is often also accompanied by a range of side effects. For opioids, many of these are related to its pharmacologic action in the central nervous system (CNS) and include drowsiness, euphoria, and in cases of overdose, a decrease in respiratory drive which can lead to hypoxia and death[2].
The untoward effects of opioids have dramatically impacted society in both the distant past (e.g. the opium wars in China) and with the current opioid epidemic the United States faces[3–5]. Prior to the 1990s, opioids were prescribed frugally by physicians mainly for palliative and acute pain. A mixture of heavy marketing for drugs such as OxyContin, well intentioned groups such as the American Pain Society advocating for undertreated pain, and the adoption of pain as the 5th vital sign by the Joint Commission (the accrediting body for health care organizations), ultimately led to a shift in medical culture and an explosion in opioid prescribing in the first decade of the 21st century[5–7].
This liberal use of opioids has directly correlated with a dramatic rise in overdose events over the last two decades garnering the attention of the medical community, mainstream media, and both federal and state governments. Opioids were involved in 3 out of every 5 overdose deaths in the United States in 2015, with total numbers having quadrupled since 1999[8]. The economic burden of opioid overdose is enormous and amounts to billions of dollars in spending each year. Estimates from 2013 put the total cost of prescription opioid overdose at $78.5 billion with $28.9 billion attributed to increased health care costs and abuse treatment programs[9]. Overdoses associated with illicit drug use are also a significant problem. Heroin overdose deaths have rapidly surpassed prescription overdoses and show no signs of slowing or leveling off. The most recent data from 2016 estimate more than 60,000 deaths related to drug overdose, an increase of 20% in a single year driven by an influx of fentanyl and extremely potent synthetic derivatives such as acetylfentanyl and carfentanyl into the drug supply of heroin users[10–13].
1.2. Prior work
Clearly, development and assessment of strategies to combat the opioid epidemic warrants intense research activity. A large body of work has been devoted to studying fatal overdose events, though common wisdom and evidence suggest that nonfatal overdose events are much more common than fatal ones[14]. In addition, nonfatal events follow a spectrum of severity with corresponding medical treatment that varies in intensity from overnight observation to mechanical ventilation and prolonged hospital stay. Contemporary works on opioid overdose have also relied on using International Classification for Disease (ICD) codes and Current Procedure Terminology (CPT) codes for cohort identification and/or end point analysis, but billing code based strategies alone can be inferior to methods that include combinations of data from the electronic health record(EHR)[15–21].
Current methods for phenotyping, whether rule-based or developed using machine learning, often draw data from a number of disparate sources such as procedures, medication, labs, and terms extracted from text notes using NLP, in addition to diagnosis codes[21,22]. While this additional data often adds a real performance boost to phenotyping metrics, it makes validation and implementation of algorithms more challenging across institutions as all sources of data must first be mapped to a set of common terminologies. Adopting a common data model (CDM) has been recommended as a way to standardize EHR data representations for interoperability[23]. The Observational Medical Outcomes Partnership CDM (OMOP CDM), originally designed to assist in drug safety research, has an extensive ontology that harmonizes data from numerous medical vocabularies including ICD-9, ICD-10, CPT, national drug code (NDC), and many others into standard concepts[24]. Concepts from the mapping include Systematized Nomenclature of Medicine (SNOMED) for condition occurrences, RxNorm for medications, and Logical Observation Identifiers Names and Codes (LOINC) for lab results and clinical observations.
1.3. Contributions
In this work, we explore strategies for phenotyping opioid overdose events on high dimensional data using machine learning and address some of the issues mentioned above. We introduce a severity score for opioid overdose phenotypes based on human expert interpretation of event severity and clinical interventions, allowing for higher granularity in the non-fatal overdose scenario. Data from multiple sources including demographics, diagnoses codes, procedures, observations, medications, and free text are used to compare the performance of machine learning models. We also examine how translation of disparate data sources to the OMOP CDM affects phenotyping accuracy, especially in light of data that includes diagnoses from both the ICD-9 and ICD-10 coding sets[24].
2. Materials and methods
The opioid overdose phenotyping task can be defined as follows:
Given:
- patient data as evidence E from
- Diagnoses codes
- Opioid medications
- Procedures
- Labs
- Observations
- Clinical notes
Do:
Assign phenotype p ∈ {false positive, mild, moderate, severe}
As a prototypical example imagine a fictitious patient, whom we will call CE, recently admitted to the ICU having arrived by ambulance. CE was found unconscious in his home with pinpoint pupils and a respiration rate of 10 breaths per minute by first responders, who were first notified by a 911 call from a family member. Two doses of naloxone were administered in the field and CE was intubated after failing to regain consciousness. This example, which may appear as part of a clinical care note, indicates the event should likely be labeled as a severe case of opioid overdose. The remainder of this section details the workflow utilized to automate label assignment utilizing machine learning.
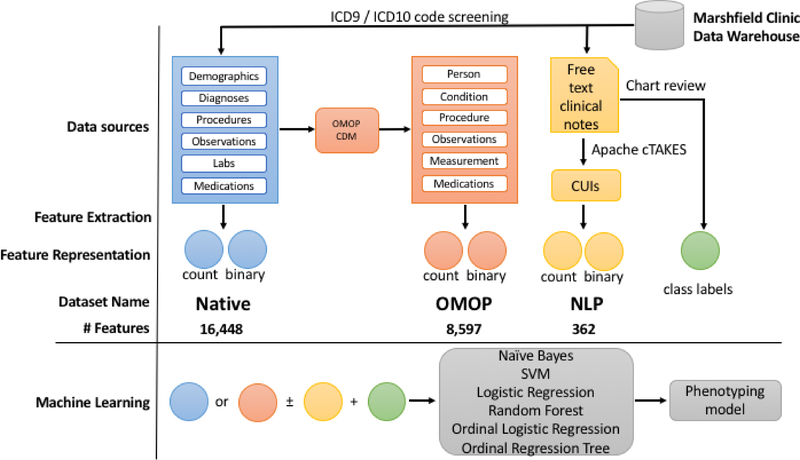
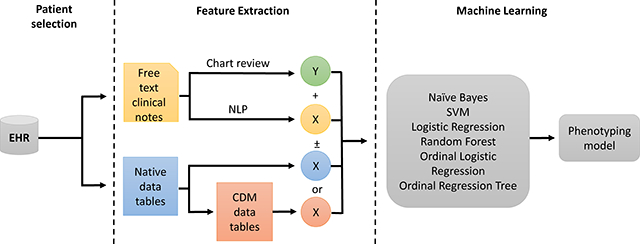
The phenotyping pipeline involves an initial screening for our opioid overdose cohort, then manual chart review for gold standard labeling, followed by feature extraction; it ends with the application of machine learning to produce models for phenotype prediction (Fig. 1). We have three main feature sets we use in the machine learning models. The first feature set, labeled native, consists of feature vectors constructed directly from the primary tables (diagnoses, procedures, labs, etc.) of our data warehouse. The second, labeled OMOP, is constructed from the same cohort of patients, but uses data that has been transformed into the OMOP version 5.2 Common Data Model. Our third data set, which we call NLP, consists of terms extracted from free-text clinical notes. We explored how the use of combinations of these feature sets (native, OMOP, and NLP) and underlying feature representation (counts or binary) affect phenotyping performance with additional details for each step described below.
Fig. 1.
Phenotyping pipeline. Features for each dataset are labeled as native, OMOP, and NLP (blue, salmon, and yellow respectively). For machine learning models, native or OMOP datasets were used with or without NLP and using either counts or binary features for each algorithm tested.
2.1. Patient selection and case review
Patients in the Marshfield Clinic Health System were screened for ICD-9 and ICD-10 codes related to opioid overdose and poisoning (Table A.1) from January of 1999 to June of 2016, yielding 2525 distinct events and 1428 unique individuals. After initial screening the study plan was evaluated by the Institutional Review Board and approved with exemption of informed consent. Events from the initial cohort were then chosen at random, and a manual chart review was conducted by either a pharmacist, JCB, or expert reviewer, AMN, to assign gold standard labels. Of 457 reviewed cases, 149 events had insufficient records for label assignment and 32 events remained unclear even after careful review. In total, this left a final population of 278 individuals, some of whom had multiple events, giving a final total of 298 labeled overdose events.
2.2. Phenotype definitions
We define an opioid overdose event as toxicity due to opioids that leads to profound untoward effects on the CNS with or without respiratory depression. Opioid overdose events were scored based on severity according to the intensity of clinical interventions employed during the health system encounter (Table 1). Common side effects such as constipation, nausea, and mild drowsiness, or lack of any medical intervention other than assessment were counted as false positives. Patients requiring overnight monitoring, activated charcoal, or oxygen were counted as mild cases, events where naloxone was administered and a marked response was noted were designated moderate cases, and finally events where the patient was placed on mechanical ventilation or where the patient expired as a result of opioid overdose were considered severe cases.
Table 1.
Definition of opioid overdose phenotypes
| Severity | Name | Criterion/example cases | Total (n=298) |
|---|---|---|---|
| 0 | False positive | •Side effects (constipation, N/V) | 70 |
| •No medical intervention | |||
| •Inaccurate coding | |||
| 1 | Mild | •Overnight monitoring | 65 |
| •Nasal oxygen | |||
| •Activated charcoal | |||
| •Altered mental status | |||
| 2 | Moderate | •Naloxone administration w/marked response | 117 |
| 3 | Severe | •Acute respiratory failure | 46 |
| •Intubation | |||
| •Death | |||
2.3. Data and feature extraction
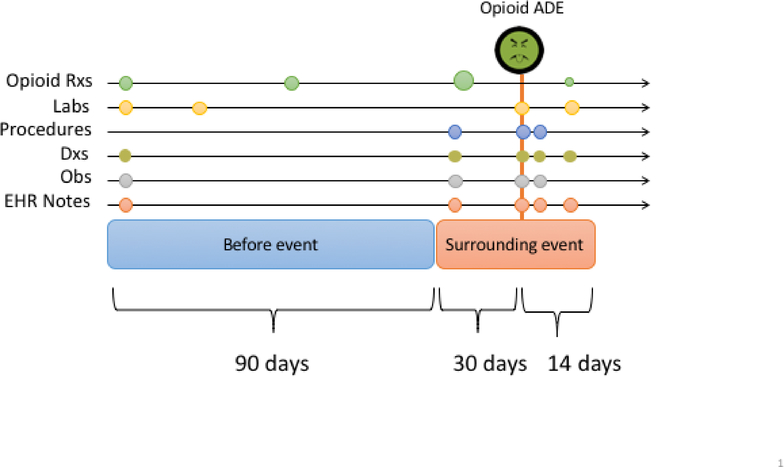
Data of interest were collected from the Marshfield Clinic Research Data Warehouse and included diagnoses, procedures, labs, free text clinical notes, medication lists from the EHR, and prescription claims data. Feature vectors were constructed by concatenating summary data from two discrete time intervals before and surrounding each suspected overdose event (Fig. 2). In the window of time surrounding the event (incident date) we examine the 30 days preceding, and the 14 days following the event. This allows us to capture clinical data points such as an opioid dose change or onset of major illness that may precipitate an overdose event or be associated with overdose severity. We then form a second window further back in time to collect 90 days of additional historical data which, again, may provide information useful to the phenotyping task. Discrete data types such as diagnoses and procedures were aggregated as counts and continuous data points such as lab values were summarized with a combination of min, max, and mean. A binary representation for all count data was also explored in separate models. Using tables directly from our data warehouse, which we call our native dataset, this yielded 16,448 features. To test how the use of a common data model may affect phenotyping performance we constructed a second dataset, OMOP, in identical fashion, but using the Marshfield Clinic implementation of the OMOP CDM. This yielded a vector of OMOP concepts with 8,597 features.
Fig. 2.
Feature construction. For each overdose event, counts for feature were collected in two intervals. A 90 day interval preceding the overdose event, and in a 44 day period surrounding the event date.
For medications, only opioid prescriptions were considered in this study. The presence of opioid active ingredients (oxycodone, hydrocodone, etc.) were recorded as binary features in each interval, and the total morphine milligram equivalent (MME) daily dose for each opioid as well as a grand total for all prescriptions were calculated and included as a continuous features using conversion tables from the CDC[25]. Prescription claims data were used preferentially over med lists when available, in addition to any data on opioid use extracted from clinical notes for models that included natural language processing (NLP) extracted features.
2.4. NLP
A total of 7241 free-text EHR documents were collected from relevant patient intervals and scanned using Apache cTakes 3.2.2 with the default clinical pipeline[26]. In post processing the non-negated terms were matched with Concept Unique Identifiers (CUIs) from the Unified Medical Language System (UMLS) Metathesauras for a total of 8362 unique terms[27]. Keyword searching of the Metathesouras browser was then performed by a domain expert to form a list of overdose related CUIs for a priori feature selection, a strategy that has proven effective in a number of previous studies[28–30]. Some of the common risk factors for opioid overdose include: total opioid dose > 90 MME, concomitant use of alcohol and or benzodiazepines, history of previous overdose, and mood disorders. Terms related to these risk factors, brand and generic names of opioid medications, and pertinent medical interventions such as ‘activated charcoal’, ‘naloxone’, and ‘intubation’ were included in the search. The final curated list, which included 362 CUIs, was then used to filter NLP results and form a bag-of-words feature vector (Table A.2). Similar to the count data, both counts and a binary representation were explored in machine learning models.
2.5. Machine learning hyperparameter tuning and evaluation
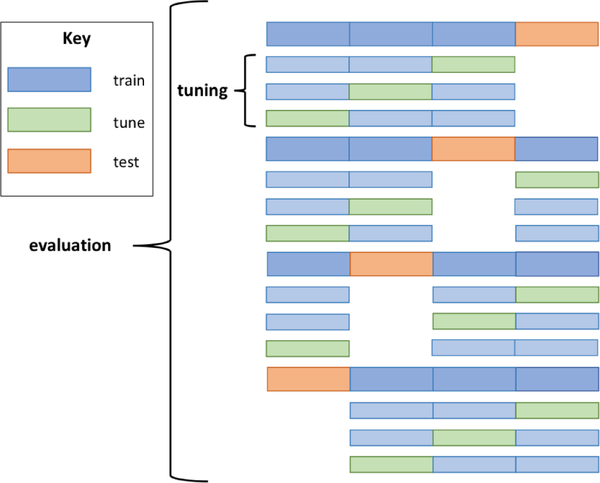
Cross-validation is a common data splitting procedure typically used on small to modest-sized datasets for hyperparameter tuning or evaluation. When used for hyperparameter tuning, cross-validation provides the means to test multiple parameter settings with less risk for overfitting. In the context of method evaluation, cross-validation reduces the variance often seen from a single train/test split by utilizing all examples as test cases exactly once and computing the average performance over all folds. In this work, we utilized nested, stratified cross-validation which allows for simultaneous execution of both tasks[31]. The overall procedure can be seen as a repetition of train-tune-test splitting where inner loops of cross-validation are utilized for selecting optimal hyperparameter settings and the outer loop is utilized for evaluating overall performance (Fig. 3). This setup prevents information used in training from leaking into tuning/testing folds, which can lead to an overly optimistic assessment of performance. Details of the procedure specific to this work are described next.
Fig. 3.
Example of nested cross-validation. Data are split into 4 folds and colored as train data (blue) and held out data (green and orange). Inner cross-validation loops are used for hyperparameter tuning (light blue and light green). The optimal hyperparameter setting(s) from each inner loop is supplied to a model trained in the outer loop (blue) and evaluated on a held-out test set (orange). Expected performance of the method is measured by averaging over all four folds. This procedure is the current methodological gold standard for tuning and evaluation in the field of machine learning.
We initially randomly partition patients into 10 parts, such that any two parts have nearly the same representation of the various classes. We treat each fold of 10-fold cross-validation as a single train-test split, training on nine of the folds and testing on the tenth. We then average the results (AUCs in our case) across the ten folds, thus ensuring that every example (patient) is a test case exactly once (on exactly one fold). The result is a nearly-unbiasted estimate, slightly pessimistic because the training set size is smaller than the full data set, with lower variance than that of an estimate from any single train-test split.
Hyperparameters are tuned on each fold with a further, internal cross-validation that uses only the training set (i.e., nine parts of the data) for that fold. For convenience our internal cross-validation is nine-fold. On each fold, we hold aside one of the nine parts of the training data as a tuning set, train on the other eight with each possible setting of hyperparameters considered, and evaluate (in our case, compute the AUC) on the tuning set. For each considered setting of hyperparameters, we average the AUCs over the nine folds. We then take the best setting of the hyperparameters, train on the full training set (all nine folds), and only then supply this model to the test set fold (tenth fold) of the external cross-validation. Algorithm-specific hyperparameters and settings considered are provided in Section 2.6, where we discuss the specific machine learning algorithms employed.
We applied the preceding tuning and evaluation methodology to each considered machine learning approach. Regarding approach, the severity of opioid overdose, our phenotype of interest, can be modeled as either a multiclass classification problem or a regression problem if one considers the implied ordering in our class labels. We explored both modeling strategies along with combinations of feature sets and feature representation to find the most suitable amalgamation for phenotyping opioid overdose events. From cross-validation we generated receiver operating characteristic (ROC) curves using vertical averaging, and report area under the ROC curve (AUC-ROC). For our best performing model and feature combination we report sensitivity, positive predictive value (PPV), accuracy, and mean absolute error (MAE) in addition to AUCs for each severity class.
2.6. Classification models
Experiments with classifiers included naïve Bayes, support vector machines (SVM), L1 penalized (LASSO) logistic regression, and random forests. For models not supporting multiclass labels out-of-the-box (SVM and logistic regression) we used a one-versus-rest approach and accounted for the heavy skew in our dataset (Table 1) by weighting examples inversely by the proportion of samples in each class.
Naïve Bayes is a fairly straightforward probabilistic model derived from Bayes’s theorem that uses the classification rule , where y is a variable representing each class and xi is a variable representing one of the features in the dataset. This formulation assumes that all features in the dataset are conditionally independent from one another given the class, which is a strong assumption, but often works well in practice. Here we constructed class predictions by combining probabilities from multinomial and Gaussian models using the discrete and continuous portions of our feature vectors respectively. Laplace estimates were used in the multinomial model and no priors were assigned in Gaussian models. Combined class probabilities were calculated by multiplying individual model predictions, dividing by the class probabilities, and normalizing the result to sum to one across all categories.
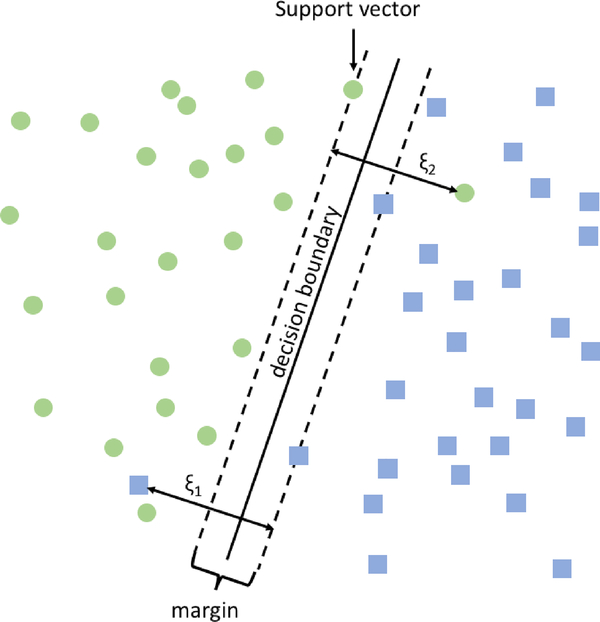
Support vector machines are a non-probabilistic binary classification model where the data points lying near a decision boundary, also known as the support vectors, are used to define the boundary and a “margin” that separates those points from the boundary [32]. Training an SVM requires solving a quadratic optimization problem:
In a simple example (Fig. 4) one might image a two-dimensional plane with a group of circles on the left side and a group of squares on the right; an SVM classifier would find the vertical line that separates circles from squares while making sure that squares and circles near the line are as far away from that line as possible. Using the kernel trick SMVs can be used to efficiently fit lines, polynomials, Gaussians, and other functions. For this work we employed an initial dimensionality reduction followed by SVM using a linear kernel with the default square-hinged loss and l2 penalty. We tuned the number of features, penalty parameter C, and l2 penalty using a grid search in the second, nested layer of 9-fold cross-validation described previously. To tune C, which varies the tradeoff between enlarging the size of the margin and misclassification of training examples, we vary the parameter with 10 values evenly spaced on the log scale from 10−3 to 103. For dimensionality reduction, we used singular value decomposition (SVD) and varied the number of components by sweeping over ten values, evenly spaced from 50 to 500.
Fig. 4.
Visualization of SVM classification. Support vectors are used to form the margin and define the decision boundary. The hyperparameter C is used to balance a tradeoff between the size of the margin and number of misclassified examples (ξ1 and ξ2).
Logistic regression is a generalized linear model of the form logit(y) = β0 + β1x1 + β2x2 … + βnxn that utilizes the logit link function to calculate the log-odds of a binary class variable y given the features in x. Various extensions to the model can be used to allow for fitting more than two classes (multinomial), ordered classes (ordinal logistic regression), and to control model complexity (penalized models). For our logistic regression models we add the L1 or LASSO penalty as a means to simultaneously perform feature selection and reduce the risk of overfitting. As with SVMs, training a logistic regression model involves solving an optimization problem. In the lasso case: . We again, used a second nested layer of 9-fold cross-validation to tune the L1 penalty parameter by sweeping over 10 values evenly spaced from 10−4 to 104.
A decision tree learner recursively divides a dataset on its features, choosing at each split the feature (and split point for a continuous feature) that maximizes the overall gain in class purity as measured by either Gini or Entropy, e.g., in the binary feature case respectively np or − p log(p) − n log(n) where p and n are the fractions of positive and negative examples. At leaf nodes the majority class at the node is predicted. Decision trees can represent complex functions, including highly non-linear functions such as exclusive-or (XOR), but if allowed to grow to maximum depth and purity decision tree learners can suffer from overfitting, so final models are usually pruned. Random forests extend decision trees by creating an ensemble of decision trees that each cast a vote in classification[33]. Diversity in the trees (and hence a low correlation in errors made by different trees) is promoted by bootstrap sampling of examples for learning each tree, as well as random sampling of features to consider at each split. With a large number of trees the ensemble is less apt to chance overfitting that is sometimes seen in single tree models and better at generalizing on previously unseen examples. Random forest models in our experiments were constructed with 500 trees in each forest and the number of features to use at each split was tuned in a nested layer of cross-validation as previously described. We used the default setting of Gini impurity for choosing feature splits and allowed for trees of maximum depth.
2.7. Ordinal models
Penalized ordinal logistic regression was carried out using a cumulative proportional odds model with LASSO penalty similar to our standard logistic regression (section 2.6). Preliminary experiments yielded models overfit to moderate overdose, our majority class, so classes were balanced by upsampling with replacement on the minority classes. Models using the native data set failed to converge after a runtime of 5 days as they contain twice the number of features as OMOP and are not included in the results.
For ordinal regression trees splits were chosen using generalized Gini impurity with misclassification costs equal to the squared difference in scores. The complexity parameter(cp) was tuned with 13 values equally spaced between 10−3 to 10−1. Trees were then pruned, as is standard, to help reduce overfitting using the cp value that minimized cross validation error. Class probabilities were calculated as the number of examples of each class ending on a leaf node over the total number of examples ending on that leaf during training.
To test for significant differences in model performance we use a paired t-test for repeated samples on the AUCs obtained during 10-fold cross-validation for select random forest models.
To probe our trained models for salient features we ran 10 replicates of our best performing models, which were logistic regression and random forest. For logistic regression we calculated the mean coefficients for all 10 runs and ranked the top features by their magnitude. For random forests we use the mean Gini importance of the 10 runs for each feature[34].
3. Results
3.1. Performance Overview
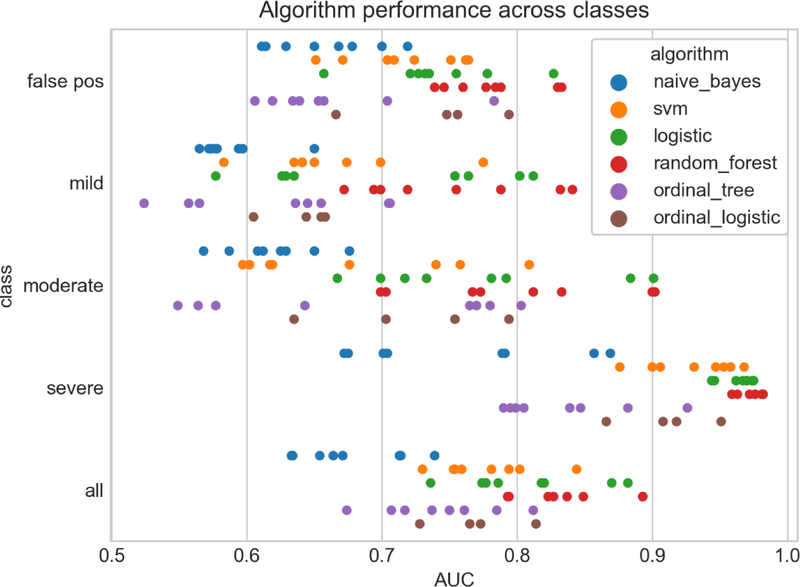
Phenotyping performance was highly variable across algorithms, feature sets, and overdose event severity (Fig. 5). Using the micro-averaged mean AUC from 10-fold cross validation of all classes we saw the best classification performance using random forest, followed closely by logistic regression (0.893 and 0.882 respectively). Performance across feature sets and representation (as indicated by a single colored strip in Fig. 5) were highly variable, with the differences between the best and worst performing feature sets showing a difference in AUC greater than 0.2 in some cases. We also see a rough trend in classification performance based on event severity with the lowest AUCs for phenotyping false positive cases and the highest AUCs for severe cases.
Fig. 5.
Strip plot of algorithm performance across classes. Each point represents the mean AUC after 10-fold cross validation for a given overdose class, algorithm, combination of features, and feature representation. Class ‘all’ is the micro-averaged mean AUC across all classes.
3.2. Effects of feature engineering
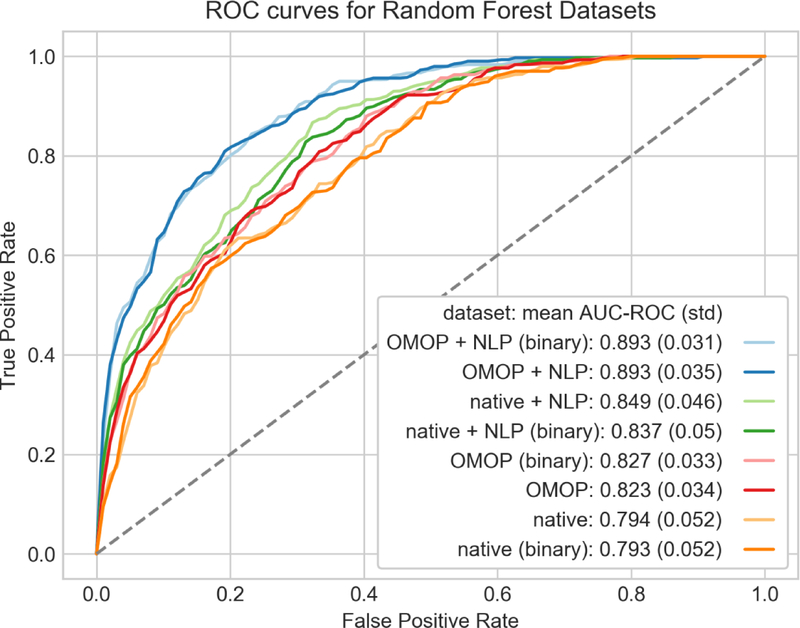
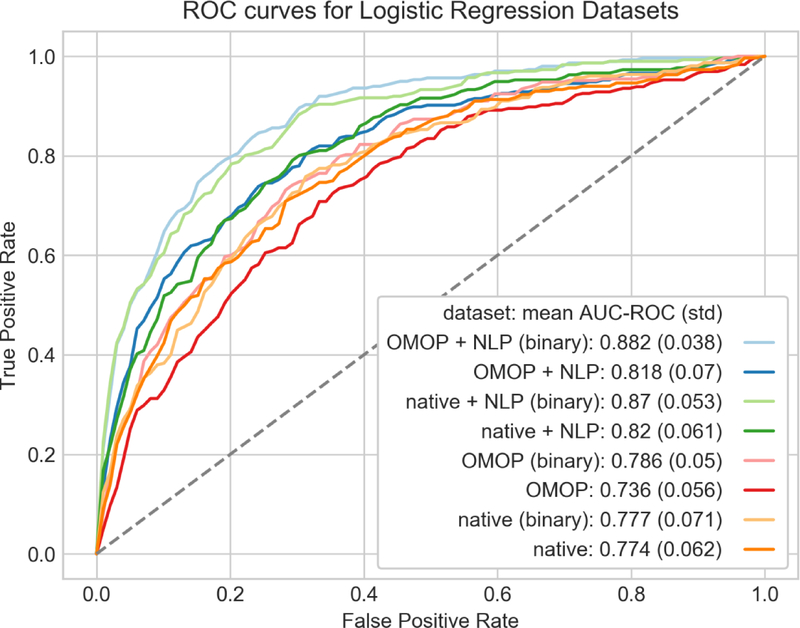
Using our best performing algorithm, random forest, we explored how combinations of features and their underlying representation can affect classification performance (Fig. 6). We found nominal differences in AUC using a binary representation for our discrete features as opposed to counts with random forest. More interesting differences were found in the choice of feature sets. There was a statistically significant difference in AUC using OMOP + NLP binary (AUC 0.893) versus native + NLP binary (AUC 0.837, p value = 0.002) indicating the OMOP CDM provided some advantage in this phenotyping task. The addition of NLP to phenotyping has a more dramatic effect. The binary OMOP features alone had an AUC of 0.827, which rose to 0.893 when adding NLP (p value <0.0001). Logistic regression showed similar benefits with the use of the OMOP dataset and addition of NLP features, but using a binary feature representation had a more dramatic effect on classification performance (Fig. 7).
Fig. 6.
ROC curves of random forest models using combinations of features and feature representation. Each curve was generated using 10 fold-cross validation with micro-averaging across the four severity classes. Feature representations (binary or counts) are paired by color and ordered from lowest to highest mean AUC in the legend.
Fig. 7.
ROC curves of penalized logistic regression models using combinations of features and feature representation. Each curve was generated using 10-fold cross-validation with micro-averaging across the four severity classes. Feature representations (binary or counts) are paired by color.
3.3. Interclass performance
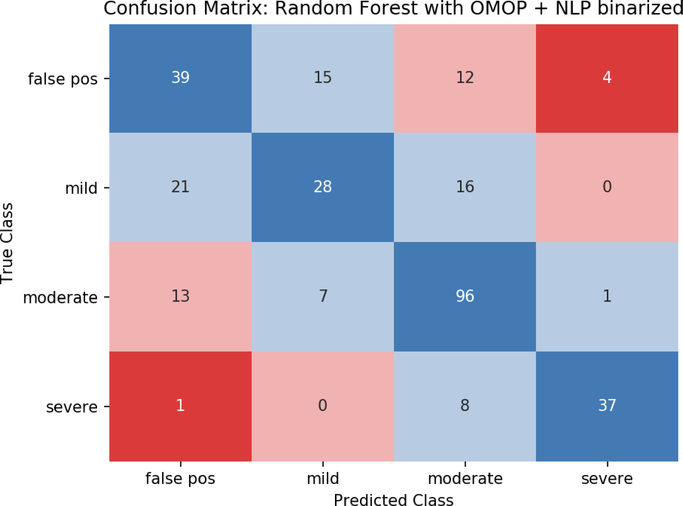
Metrics for the best performing model, random forests with OMOP + NLP binary features, are shown in Table 2. Severe events were identified with sensitivity 0.804 and PPV 0.881. Performance dropped with decreasing severity, especially for the mild and false positive events with both PPVs less than 0.6. The mean absolute error over all classes was 0.446 as most predictions are either correct or within one level of their true severity (Fig. 8). Similar to the other metrics, MAE was lowest for severe and moderate cases, with larger assignment errors made in the false positive and mild classes.
Table 2.
Performance metrics of random forest model using OMOP + NLP datasets with binary features.
| severity | AUC (std. dev.) | PPV (precision) | Sensitivity (recall) | Accuracy | MAE |
|---|---|---|---|---|---|
| false positive | 0.83 (0.08) | 0.527 | 0.557 | 0.779 | 0.729 |
| mild | 0.841 (0.059) | 0.56 | 0.431 | 0.802 | 0.569 |
| moderate | 0.9 (0.064) | 0.727 | 0.821 | 0.809 | 0.291 |
| severe | 0.982 (0.017) | 0.881 | 0.804 | 0.953 | 0.239 |
| all | 0.893 (0.031) | 0.674 | 0.653 | 0.836 | 0.446 |
Fig. 8.
Confusion matrix using random forest with OMOP + NLP binary features. Perfect predictions lie along the diagonal(blue) with increasing errors in class assignment shown in light blue, pink, and red.
3.4. Feature importance
Tables 3 and 4 show the features averaged from ten trained models each of logistic regression and random forest. Both logistic regression and random forest models contain a significant proportion of top ranking features from the NLP dataset (yellow) and tend to be dominated by features indicative of moderate and severe overdose (‘Narcan’, ‘Endotracheal tube’, ‘Ventilator’, etc.). To gain additional insight on features important to classifying false positive and mild cases we also trained separate models using only the false positive and mild overdoses cases (Table A.4). In the two class models the terms ‘drowsiness’, ‘confusion’, ‘suicide’, and ‘LFTs’ (liver function tests) were important features.
Table 3.
Feature importance of the best performing logistic regression model (OMOP + NLP binary). Features are ranked by coefficient magnitude and color coded based on the originating feature set (yellow = NLP, salmon = OMOP).
| false positive | mild | moderate | severe | ||||
|---|---|---|---|---|---|---|---|
| coeff | description | coeff | description | coeff | description | coeff | description |
| −1.257 | Accidental poisoning by heroin | −2.234 | Narcan | 2.407 | Narcan | 2.183 | Endotracheal tube |
| −1.169 | Narcan | 0.896 | Drowsiness | −1.602 | Endotracheal tube | 1.334 | Acute respiratory failure |
| −1.05 | Altered mental status | 0.837 | Poisoning by aromatic analgesic | −0.825 | Continuous invasive mechanical ventilation… | 1.31 | Continuous invasive mechanical ventilation … |
| 0.78 | Emergency department visit for the evaluation and management of a patient… |
0.779 | Dementia | 0.669 | Chronic pain syndrome | 1.275 | Ventilator equipment - respiratory |
| −0.76 | drug overdose | −0.76 | Intubation | 0.603 | Accidental poisoning by heroin | 0.948 | Insertion of nontunneled centrally inserted central venous catheter; age 5 years or older |
| −0.684 | Drowsiness | 0.527 | confusion | −0.53 | Ventilator - respiratory equipment | 0.882 | Cardiac arrest |
| −0.574 | LFTs | −0.524 | Chronic pain | −0.49 | Poisoning by opiate AND/OR related narcotic |
−0.766 | Office or other outpatient visit for the evaluation and management of an established patient… |
| 0.541 | Thromboplastin time, partial; plasma or whole blood | 0.507 | Urine drug screen | −0.437 | suicide | 0.594 | Radiologic examination, chest; single view, frontal |
| 0.536 | Essential hypertension | 0.465 | Suicidal deliberate poisoning | 0.432 | Chronic pain | 0.438 | Intubation, endotracheal, emergency procedure |
| −0.486 | Acute respiratory failure | 0.439 | Alanine aminotransferas e serum/plasma | −0.383 | Age < 25 | 0.318 | Insertion of Endotracheal Airway into Trachea… |
Table 4.
Relative feature importance of the highest performing random forest model (OMOP + NLP binary). OMOP and NLP features are colored in salmon and yellow respectively.
| relative importance | description |
|---|---|
| 0.054 | Narcan |
| 0.038 | Endotracheal tube |
| 0.025 | Acute respiratory failure |
| 0.023 | Ventilator - respiratory equipment |
| 0.021 | Continuous invasive mechanical ventilation for less than 96 consecutive hours |
| 0.016 | Accidental poisoning by heroin |
| 0.015 | Radiologic examination, chest; single view, frontal |
| 0.014 | Intubation |
| 0.013 | Critical care, evaluation and management of the critically ill or critically injured patient; first 30–74 minutes |
| 0.012 | Respiratory failure |
4. Discussion
Well defined phenotypes and methods for accurate cohort identification are vital precursors to observational studies. During our chart review it became clear that a simple definition of overdose using diagnoses codes might lead a researcher to false conclusions. Two patients with identical overdose diagnoses codes often had dramatically different clinical courses. One patient might have sat in the emergency room for four hours under observation (false positive) while the other ended up intubated and on life support (severe overdose). This difference is not surprising as neither the ICD-9 nor ICD-10 coding systems grade overdose events by severity, but is a vital consideration when studying opioid overdose and the primary reason we developed a phenotyping system that stratifies events by severity.
Given the clarity in our clinical descriptions of event severity it is natural to ask why machine learning was employed over simpler rule-based methods. One reason is that Boolean logic can cause misclassification of examples not following a general rule. As an example, ‘administration of naloxone with marked response’ is a class defining feature for moderate overdose cases, but naloxone can and does get administered in multidrug overdose situations even when opioids are not the cause of CNS depression. Another reason is that we do not have a convenient set of features and rules that can be used to identify false positive cases. Many arise out of the need for billable diagnosis codes or in miscoded cases. Machine learning has the potential to correctly classify in both situations by discovering a richer set features that cover both prototypical examples as well as edge cases.
The choice of machine learning algorithm proved to be an important consideration for phenotyping. Our dataset is high dimensional but contains a relatively small number of examples, so we avoided deep learning and non-linear SVMs, and we instead focused on algorithms that are known to be more resilient to over-fitting even when given more features than examples. Ordinal models proved to be inferior to one-vs rest classifiers. Ordinal logistic regression may have performed poorly because key independent variables in the data violate the proportional odds assumption (POA), which assumes independent variables have an identical effect for each dependent level in the model. Of the four one-vs-rest classifiers we examined, random forest and L1 penalized logistic regression gave the best results with AUCs of 0.893 and 0.882 respectively.
Using a binary feature representation gave performance more or less identical to counts for the random forest models and provided a slight benefit with logistic regression. The performance difference in logistic regression models might be attributable to normalization that was applied in count models. We scaled each count feature in the interval [0,1] in count models so as not to let any one feature have more weight than another in the model. As a result, if there is high variability of counts in an important feature, examples with lower counts may be unjustly down-weighted and potentially have a negative effect on the model.
The choice of dataset(s) had a much larger impact on phenotyping performance than the underlying feature representation. We saw significant gains in AUC when adding NLP features to our training models. We believe that some of the important features indicating overdose severity are recorded in free text that do not appear in any coded pieces of the EHR. As an example, the administration of naloxone, which indicates a moderately severe overdose based on our definition, has procedure codes that exist but are seldom used. In addition, during chart review we noted that first responders often administer naloxone in the field. This is recorded in free text as part of the event history, but not included anywhere else in the EHR as it constitutes care outside of the facility.
An examination of the top features in our trained models further supports the importance of free-text and may also partially explain the variability in performance observed across severity classes. The best performing random forest model achieved an AUC over all classes of nearly 0.9, but precision and recall were severely penalized by poor performance on mild and false-positive cases (Table 2). Class skew may be a contributing factor, but it is curious to note that severe overdose, the minority class, yielded the highest AUC (0.982), not the lowest as one would expect from a classifier biased by data skew. The presence of high-quality NLP features in moderate and severe cases provides a possible explanation. The terms ‘Narcan’ (naloxone) and ‘Endotracheal Tube’ can be used almost exclusively to classify an event as moderate or severe, which explains both why they are given so much weight in [dummy_strikeofftext] our trained models and why their inclusion leads to improved precision and recall. In contrast, succinct features indicative of class membership were not observed in the top features identified for mild and false positives classes which suggests that such features are poorly captured in the EHR or that a more complex set of rules is necessary for classifying these cases. Both factors could be contributing to poorer performance on mild and false positive cases.
The adoption of ICD-10 in October of 2015 created a distinct fault line in the EHR of recorded diagnoses. As a result, researchers are now faced with the question of how to conduct research involving data using both ICD-9 and ICD-10 coding sets. The option we explored in this work was using a common data model. The OMOP CDM attempts to map each drug, lab, and diagnosis to an appropriate concept from standardized ontologies such as RxNorm, LOINC, and SNOMED-CT, to provide a unified representation of medical data. In theory, this may distill similar pieces of information, such as ICD-9 and ICD-10 codes, to a single concept. This might explain why we saw a boost in phenotyping performance with the OMOP dataset. Our OMOP dataset has roughly half the number of features as the native dataset, but yielded better classification performance as measured by AUC (0.893 versus 0.837, p = 0.002). As an additional benefit, the OMOP CDM allows for easier transport across institutions and will be useful for any follow up validation on our methods.
There are several important limitations to this work. Our initial screening for opioid overdoses used diagnoses codes as an exclusive means for event discovery, so we are falsely assuming that all potential cases have received proper coding. It is likely this method will underestimate the total number of true cases and some cases will go completely undetected. In our chart review we only used a single reviewer for each case, which could potentially mean there are examples in our dataset that could have resulted in disagreement on label assignment. Also, phenotyping was only conducted on patients that reside within the Marshfield Clinic Health Care System, which makes the external validity of our models unknown. Lastly, our examination of machine learning models was appropriate but by no means exhaustive. Anchor and Learn, XPRESS, and APHRODITE are three methods that perform well on noisy labeled (silver-standard) phenotypes and deep learning approaches that utilize embeddings are an active area of research that would have been interesting to explore [35–37].
There are a number of directions for future work involving opioid overdose worth mentioning. Replication and transportation of our phenotyping model to an outside institution for validation is an important next-step. It is unclear how differences in the distribution of overdose cases, underlying population characteristics, and medical coding will affect phenotyping performance at another institution, but the OMOP CDM has proven useful to phenotyping and should ease implementation on external data sets. In this work we have applied regularization and SVD for dimensionality reduction, but there are other interesting strategies that could be explored. Word embeddings, which project high dimensional data into a lower dimensional feature space via the use of algorithms such as Word2Vec, Glove, and fastText have become commonplace in the NLP community and have recently been applied to tasks in the medical domain [38,39]. Vectors from embeddings provide dense representation, maintain semantic relationships, and help reduce the number of trainable parameters in recurrent neural network architectures, which could prove to be especially useful for future development of a deep learning surveillance system that tracks opioid usage and flags patients at the highest risk for overdose.
Widespread adoption of EHRs has vastly expanded the amount of digitized medical data available for observational research. However, medical data is known to be inherently messy. Diagnosis codes do not necessarily indicate the presence of disease as they are often used for billing out of exclusion, drug lists frequently contain errors, and most importantly data in the EHR are recorded using a mixture of human perspectives to assist with patient care, not research. This is precisely why phenotyping, which can be seen as a data cleaning step, is so important. In this work we provide machine learning models to accomplish this cleaning step for studies related to opioid overdose. Furthermore, we have stratified non-fatal overdose into useful severity categories, providing an opportunity for subgroup analysis in future work.
5. Lessons learned
The EHR can be a useful source of information but is far from complete. Events that happen before a patient reaches the doctor’s office, after they leave, and even during their stay are not necessarily contained in coded data types. We came to this realization in our work noting that naloxone administration was missing in the coded data, but often recorded in clinical notes. The addition of NLP to feature extraction, which has been cited as extremely useful in many contexts, cannot be understated as it provides a means to capture data that is otherwise poorly represented.
The diversity of EHRs and medical coding ontologies pose challenges to both multi-site and single-site informatics studies. In this project we encountered a mixture of ICD-9 and ICD-10 overdose cases and it was unclear as to whether the data should be mapped to a common vocabulary or left intact. With no previous studies to draw on we compared both approaches and showed that converting data to the OMOP CDM improved phenotyping. Transitioning to CDMs may prove useful to improving performance in other phenotyping or disease risk prediction tasks and provides an additional benefit of increased interoperability for multi-site studies.
There are many diseases such as cancer, heart failure, and chronic kidney disease that have an inherent ordering based on progression of disease and severity, but studies of ordinal phenotypes are uncommon. In this work we experimented with ordinal logistic regression and ordinal regression trees to phenotype overdose severity but found that traditional multiclass methods were superior. Future studies involving ordered classes should certainly explore fitting ordinal models, but classifiers such as random forest should not be excluded as this work has shown.
6. Conclusion
Considerable effort has been put forth in recent years to battle the opioid epidemic. Raised awareness, more judicious opioid prescribing guidelines, increased funding, and state based prescription drug monitoring programs are having an impact on prescription related deaths, but both prescription and illicit opioid overdoses continue to take an unprecedented number of lives each year[40]. Health care institutions need effective tools to identify and mitigate overdose risk as well as monitor outcomes of locally deployed strategies.
In this work we have introduced a definition for overdose severity that we hope will be a useful tool for stratifying opioid overdose events into meaningful subgroups. Both penalized logistic regression and random forest are effective for phenotyping overdose events and can yield AUCs of nearly 0.9. Features extracted using NLP are extremely important for this task and can give a useful boost to overall performance.
Supplementary Material
Highlights.
Phenotyping of opioid overdose cases stratified by severity using machine learning.
Random forests were superior to all other methods (AUC = 0.893).
Features derived from the OMOP CDM and NLP boost performance.
Ordinal models were inferior to traditional classification methods
Acknowledgements
We thank Anne M Nikolai, BS for support in data abstraction.
We acknowledge the developers and maintainers of software used in this work. All one-versus-rest learning models were constructed using scikit-learn 0.19.0 in python 3.5. Ordinal models were constructed using R 3.5.0, OrdinalNet 2.4 for penalized logistic regression, and rpartScore 1.0-1 for ordinal regression trees. We also used python Pandas 0.20.3, NumPy 1.13.1, SciPy 0.19.1, Seaborn 0.8, and Matplotlib 2.0.2 packages extensively for data manipulation and visualization.
Funding
The authors gratefully acknowledge support from the NIG NIGMS grant: R01 GM097618, NIH BD2K grant: U54 AI117924, the NLM grant: R01 LM011028, and the NIH CTSA grant 1UL1TR002373.
Footnotes
Declarations of interest: None
Source Code
Python source code used for feature extraction from the OMOP CDM is available on GitHub at https://github.com/jbadger3/ml_4_pheno_ooe for users interested in replicating or improving upon this work.
Publisher's Disclaimer: This is a PDF file of an unedited manuscript that has been accepted for publication. As a service to our customers we are providing this early version of the manuscript. The manuscript will undergo copyediting, typesetting, and review of the resulting proof before it is published in its final citable form. Please note that during the production process errors may be discovered which could affect the content, and all legal disclaimers that apply to the journal pertain.
References
- [1].Volkow ND, McLellan AT, Opioid Abuse in Chronic Pain — Misconceptions and Mitigation Strategies, N. Engl. J. Med 374 (2016) 1253–1263. doi: 10.1056/NEJMra1507771. [DOI] [PubMed] [Google Scholar]
- [2].Boyer EW, Management of Opioid Analgesic Overdose, N. Engl. J. Med 367 (2012) 146–155. doi: 10.1056/NEJMra1202561. [DOI] [PMC free article] [PubMed] [Google Scholar]
- [3].Quinones S, Dreamland: the true tale of America’s opiate epidemic, Paperback edition, Bloomsbury Press, New York, 2016. [Google Scholar]
- [4].Cobaugh DJ, Gainor C, Gaston CL, Kwong TC, Magnani B, McPherson ML, Painter JT, Krenzelok EP, The opioid abuse and misuse epidemic: Implications for pharmacists in hospitals and health systems, Am. J. Health. Syst. Pharm 71 (2014) 1539–1554. doi: 10.2146/ajhp140157. [DOI] [PubMed] [Google Scholar]
- [5].Manchikanti L, Helm S, Fellows B, Janata JW, Pampati V, Grider JS, Boswell MV, Opioid epidemic in the United States, Pain Physician. 15 (2012) ES9–38. [PubMed] [Google Scholar]
- [6].Kanouse AB, Compton P, The Epidemic of Prescription Opioid Abuse, the Subsequent Rising Prevalence of Heroin Use, and the Federal Response, J. Pain Palliat. Care Pharmacother 29 (2015) 102–114. doi: 10.3109/15360288.2015.1037521. [DOI] [PubMed] [Google Scholar]
- [7].Van Zee A, The Promotion and Marketing of OxyContin: Commercial Triumph, Public Health Tragedy, Am. J. Public Health. 99 (2009) 221–227. doi: 10.2105/AJPH.2007.131714. [DOI] [PMC free article] [PubMed] [Google Scholar]
- [8].Rudd RA, Seth P, David F, Scholl L, Increases in Drug and Opioid-Involved Overdose Deaths — United States, 2010–2015, MMWR Morb. Mortal. Wkly. Rep 65 (2016) 1445–1452. doi: 10.15585/mmwr.mm655051e1. [DOI] [PubMed] [Google Scholar]
- [9].Florence CS, Zhou C, Luo F, Xu L, The Economic Burden of Prescription Opioid Overdose, Abuse, and Dependence in the United States, 2013:, Med. Care 54 (2016) 901–906. doi: 10.1097/MLR.0000000000000625. [DOI] [PMC free article] [PubMed] [Google Scholar]
- [10].Dowell D, Noonan RK, Houry D, Underlying Factors in Drug Overdose Deaths, JAMA. 318 (2017) 2295. doi: 10.1001/jama.2017.15971. [DOI] [PMC free article] [PubMed] [Google Scholar]
- [11].O’Donnell JK, Halpin J, Mattson CL, Goldberger BA, Gladden RM, Deaths Involving Fentanyl, Fentanyl Analogs, and U-47700 — 10 States, July–December 2016, MMWR Morb. Mortal. Wkly. Rep 66 (2017) 1197–1202. doi: 10.15585/mmwr.mm6643e1. [DOI] [PMC free article] [PubMed] [Google Scholar]
- [12].O’Donnell JK, Gladden RM, Seth P, Trends in Deaths Involving Heroin and Synthetic Opioids Excluding Methadone, and Law Enforcement Drug Product Reports, by Census Region — United States, 2006–2015, MMWR Morb. Mortal. Wkly. Rep 66 (2017) 897–903. doi: 10.15585/mmwr.mm6634a2. [DOI] [PMC free article] [PubMed] [Google Scholar]
- [13].Vivolo-Kantor AM, Seth P, Gladden RM, Mattson CL, Baldwin GT, Kite-Powell A, Coletta MA, Vital Signs : Trends in Emergency Department Visits for Suspected Opioid Overdoses — United States, July 2016–September 2017, MMWR Morb. Mortal. Wkly. Rep 67 (2018) 279–285. doi: 10.15585/mmwr.mm6709e1. [DOI] [PMC free article] [PubMed] [Google Scholar]
- [14].Elzey MJ, Barden SM, Edwards ES, Patient Characteristics and Outcomes in Unintentional, Non-fatal Prescription Opioid Overdoses: A Systematic Review, Pain Physician. 19 (2016) 215–228. [PubMed] [Google Scholar]
- [15].Yang Z, Wilsey B, Bohm M, Weyrich M, Roy K, Ritley D, Jones C, Melnikow J, Defining Risk of Prescription Opioid Overdose: Pharmacy Shopping and Overlapping Prescriptions Among Long-Term Opioid Users in Medicaid, J. Pain 16 (2015) 445–453. doi: 10.1016/j.jpain.2015.01.475. [DOI] [PubMed] [Google Scholar]
- [16].Zedler B, Xie L, Wang L, Joyce A, Vick C, Brigham J, Kariburyo F, Baser O, Murrelle L, Development of a Risk Index for Serious Prescription Opioid-Induced Respiratory Depression or Overdose in Veterans’ Health Administration Patients, Pain Med. 16 (2015) 1566–1579. doi: 10.1111/pme.12777. [DOI] [PMC free article] [PubMed] [Google Scholar]
- [17].Miller M, Barber CW, Leatherman S, Fonda J, Hermos JA, Cho K, Gagnon DR, Prescription Opioid Duration of Action and the Risk of Unintentional Overdose Among Patients Receiving Opioid Therapy, JAMA Intern. Med 175 (2015) 608. doi: 10.1001/jamainternmed.2014.8071. [DOI] [PubMed] [Google Scholar]
- [18].Garg RK, Fulton-Kehoe D, Franklin GM, Patterns of Opioid Use and Risk of Opioid Overdose Death Among Medicaid Patients:, Med. Care 55 (2017) 661–668. doi: 10.1097/MLR.0000000000000738. [DOI] [PubMed] [Google Scholar]
- [19].Sun EC, Dixit A, Humphreys K, Darnall BD, Baker LC, Mackey S, Association between concurrent use of prescription opioids and benzodiazepines and overdose: retrospective analysis, BMJ. (2017) j760. doi: 10.1136/bmj.j760. [DOI] [PMC free article] [PubMed] [Google Scholar]
- [20].Nadpara PA, Joyce AR, Murrelle EL, Carroll NW, Carroll NV, Barnard M, Zedler BK, Risk Factors for Serious Prescription Opioid-Induced Respiratory Depression or Overdose: Comparison of Commercially Insured and Veterans Health Affairs Populations, Pain Med. (2017). doi: 10.1093/pm/pnx038. [DOI] [PMC free article] [PubMed] [Google Scholar]
- [21].Shivade C, Raghavan P, Fosler-Lussier E, Embi PJ, Elhadad N, Johnson SB, Lai AM, A review of approaches to identifying patient phenotype cohorts using electronic health records, J. Am. Med. Inform. Assoc 21 (2014) 221–230. doi: 10.1136/amiajnl-2013001935. [DOI] [PMC free article] [PubMed] [Google Scholar]
- [22].Richesson RL, Sun J, Pathak J, Kho AN, Denny JC, Clinical phenotyping in selected national networks: demonstrating the need for high-throughput, portable, and computational methods, Artif. Intell. Med. 71 (2016) 57–61. doi: 10.1016/j.artmed.2016.05.005. [DOI] [PMC free article] [PubMed] [Google Scholar]
- [23].Mo H, Thompson WK, Rasmussen LV, Pacheco JA, Jiang G, Kiefer R, Zhu Q, Xu J, Montague E, Carrell DS, Lingren T, Mentch FD, Ni Y, Wehbe FH, Peissig PL, Tromp G, Larson EB, Chute CG, Pathak J, Denny JC, Speltz P, Kho AN, Jarvik GP, Bejan CA, Williams MS, Borthwick K, Kitchner TE, Roden DM, Harris PA, Desiderata for computable representations of electronic health records-driven phenotype algorithms, J. Am. Med. Inform. Assoc (2015) ocv112. doi: 10.1093/jamia/ocv112. [DOI] [PMC free article] [PubMed] [Google Scholar]
- [24].OHDSI – Observational Health Data Sciences and Informatics, (n.d.). https://www.ohdsi.org/ (accessed January 16, 2018).
- [25].National Center for Injury Prevention and Control, CDC compilation of benzodiazepines, muscle relaxants, stimulants, zolpidem, and opioid analgesics with oral morphine milligram equivalent conversion factors, 2016. version., (n.d.). https://www.cdc.gov/drugoverdose/resources/data.html.
- [26].Apache cTAKES™ - clinical Text Analysis Knowledge Extraction System, (n.d.). http://ctakes.apache.org/ (accessed January 16, 2018).
- [27].Unified Medical Language System (UMLS), (n.d.). https://www.nlm.nih.gov/research/umls/ (accessed February 9, 2018).
- [28].Koola JD, Davis SE, Al-Nimri O, Parr SK, Fabbri D, Malin BA, Ho SB, Matheny ME, Development of an automated phenotyping algorithm for hepatorenal syndrome, J. Biomed. Inform 80 (2018) 87–95. doi: 10.1016/j.jbi.2018.03.001. [DOI] [PMC free article] [PubMed] [Google Scholar]
- [29].Peissig PL, Rasmussen LV, Berg RL, Linneman JG, McCarty CA, Waudby C, Chen L, Denny JC, Wilke RA, Pathak J, Carrell D, Kho AN, Starren JB, Importance of multi-modal approaches to effectively identify cataract cases from electronic health records, J. Am. Med. Inform. Assoc 19 (2012) 225–234. doi: 10.1136/amiajnl-2011-000456. [DOI] [PMC free article] [PubMed] [Google Scholar]
- [30].Chen Y, Carroll RJ, Hinz ERM, Shah A, Eyler AE, Denny JC, Xu H, Applying active learning to high-throughput phenotyping algorithms for electronic health records data, J. Am. Med. Inform. Assoc 20 (2013) e253–e259. doi: 10.1136/amiajnl-2013-001945. [DOI] [PMC free article] [PubMed] [Google Scholar]
- [31].Cawley GC, Talbot NLC, On Over-fitting in Model Selection and Subsequent Selection Bias in Performance Evaluation, J Mach Learn Res. 11 (2010) 2079–2107. [Google Scholar]
- [32].Cortes C, Vapnik V, Support-vector networks, Mach. Learn 20 (1995) 273–297. doi: 10.1007/BF00994018. [DOI] [Google Scholar]
- [33].Breiman L, Random forests, Mach. Learn 45 (2001) 5–32. [Google Scholar]
- [34].scikit-learn: machine learning in Python — scikit-learn 0.19.1 documentation, (n.d.). http://scikit-learn.org/stable/ (accessed February 25, 2018).
- [35].Halpern Y, Horng S, Choi Y, Sontag D, Electronic medical record phenotyping using the anchor and learn framework, J. Am. Med. Inform. Assoc 23 (2016) 731–740. doi: 10.1093/jamia/ocw011. [DOI] [PMC free article] [PubMed] [Google Scholar]
- [36].Banda JM, Halpern Y, Sontag D, Shah NH, Electronic phenotyping with APHRODITE and the Observational Health Sciences and Informatics (OHDSI) data network, AMIA Jt. Summits Transl. Sci. Proc. AMIA Jt. Summits Transl. Sci 2017 (2017) 48–57. [PMC free article] [PubMed] [Google Scholar]
- [37].Agarwal V, Podchiyska T, Banda JM, Goel V, Leung TI, Minty EP, Sweeney TE, Gyang E, Shah NH, Learning statistical models of phenotypes using noisy labeled training data, J. Am. Med. Inform. Assoc 23 (2016) 1166–1173. doi: 10.1093/jamia/ocw028. [DOI] [PMC free article] [PubMed] [Google Scholar]
- [38].Young T, Hazarika D, Poria S, Cambria E, Recent Trends in Deep Learning Based Natural Language Processing [Review Article], IEEE Comput. Intell. Mag 13 (2018) 55–75. doi: 10.1109/MCI.2018.2840738. [DOI] [Google Scholar]
- [39].Shickel B, Tighe PJ, Bihorac A, Rashidi P, Deep EHR: A Survey of Recent Advances in Deep Learning Techniques for Electronic Health Record (EHR) Analysis, IEEE J. Biomed. Health Inform 22 (2018) 1589–1604. doi: 10.1109/JBHI.2017.2767063. [DOI] [PMC free article] [PubMed] [Google Scholar]
- [40].Annual Surveillance Report Of Drug-related Risks And Outcomes United States, 2017, (n.d.). https://www.cdc.gov/drugoverdose/pdf/pubs/2017-cdc-drug-surveillance-report.pdf (accessed March 9, 2018).
Associated Data
This section collects any data citations, data availability statements, or supplementary materials included in this article.


