

Abstract
Recent studies suggest that blood–brain barrier (BBB) permeability contributes to epileptogenesis in symptomatic epilepsies. We have previously described angiogenesis, aberrant vascularization, and BBB alteration in drug-refractory temporal lobe epilepsy. Here, we investigated the role of vascular endothelial growth factor (VEGF) in an in vitro integrative model of vascular remodeling induced by epileptiform activity in rat organotypic hippocampal cultures. After kainate-induced seizure-like events (SLEs), we observed an overexpression of VEGF and VEGF receptor-2 (VEGFR-2) as well as receptor activation. Vascular density and branching were significantly increased, whereas zonula occludens 1 (ZO-1), a key protein of tight junctions (TJs), was downregulated. These effects were fully prevented by VEGF neutralization. Using selective inhibitors of VEGFR-2 signaling pathways, we found that phosphatidylinositol 3-kinase is involved in cell survival, protein kinase C (PKC) in vascularization, and Src in ZO-1 regulation. Recombinant VEGF reproduced the kainate-induced vascular changes. As in the kainate model, VEGFR-2 and Src were involved in ZO-1 downregulation. These results showed that VEGF/VEGFR-2 initiates the vascular remodeling induced by SLEs and pointed out the roles of PKC in vascularization and Src in TJ dysfunction, respectively. This suggests that Src pathway could be a therapeutic target for BBB protection in epilepsies.
Introduction
Temporal lobe epilepsy (TLE), the most common form of symptomatic epilepsies, is associated with pharmacoresistance in 30% of patients. TLE pathogenesis is poorly understood, but imaging and neuropathology indicate that progressive tissular and cellular reorganization participates in epileptogenesis (Pitkänen and Sutula, 2002). Since the early 20th century, vascular anomalies and blood supply failure have been suspected to contribute to epileptogenesis (Bratz, 1899; Spielmeyer, 1927; Scholz, 1959). Today, this theory is supported by several studies describing alterations of the blood–brain barrier (BBB) in TLE and relevant models (Eid et al., 2004, 2005; Rigau et al., 2007; van Vliet et al., 2007; Marcon et al., 2009; Ghosh et al., 2010; Ndode-Ekane et al., 2010). In parallel, clinical and experimental data showed that BBB permeability also contributes to epileptogenesis (Seiffert et al., 2004; Ivens et al., 2007; Tomkins et al., 2007; van Vliet et al., 2007; Fabene et al., 2008; Cacheaux et al., 2009; David et al., 2009).
We previously described in patients a pathological angiogenesis and a disruption of the BBB associated with overexpression of VEGF and its main receptor VEGFR-2 (Rigau et al., 2007). In a rat model of TLE with similar vascular remodeling, we found a significant upregulation of VEGF as reported in other models of seizures (Croll et al., 2004; Newton et al., 2006; Rigau et al., 2007; Nicoletti et al., 2008).
VEGF is a pleiotropic growth factor induced by hypoxia and inflammation in various cell types. The VEGFR-2 receptor is expressed in endothelial cells and neurons. It activates numerous signaling pathways (Kowanetz and Ferrara, 2006), which are in principle neuroprotective or improve neurovascular coupling (Ahmad et al., 2006). VEGFR-2 activation also alters extracellular matrix, as well as adherens junctions (AJs) and tight junctions (TJs) (Zhang and Chopp, 2002; Sandoval and Witt, 2008). A role of the Src pathway in the downregulation of AJ and TJ proteins has already been demonstrated (Gavard and Gutkind, 2006; Takenaga et al., 2009).
To address the role of VEGF/VEGFR-2 in TJ protein downregulation in epileptic tissue, we used an in vitro model of vascular remodeling induced by seizure-like events (SLEs) in organotypic hippocampal cultures (OHCs), in which microvessels and TJs are preserved (Moser et al., 2003). We investigated vascular changes induced in OHCs by SLEs by measuring vascular density and branching, and the expression of the main TJ proteins. We focused on the regulation of zonula occludens 1 (ZO-1), which anchors transmembrane proteins to actin and contributes to electrical resistance and paracellular flux. Moreover, this protein is degraded or mislocalized by VEGF (Bazzoni and Dejana, 2004; Harhaj and Antonetti, 2004; Sandoval and Witt, 2008; Fanning and Anderson, 2009).
We tested the effects of VEGF application and neutralization, as well as specific inhibitors of VEGFR-2 signaling pathways, on BBB alterations secondary to kainate (KA)-induced SLEs. We found that protein kinase C (PKC) participates in vascularization and Src in the regulation of ZO-1 expression following epileptiform activity.
Materials and Methods
OHCs
OHCs were prepared and cultured according to the method of Stoppini et al. (1991). Hippocampi from 6- to 7-d-old Sprague Dawley rats (Janvier) were rapidly dissected under aseptic conditions, and transverse sections (400 μm) were obtained using a tissue chopper (MacIIwain, Mickle Laboratory Engineering). Ten slices were placed on a 30 mm porous membrane (Millicell-CM, Millipore) and kept in 100-mm-diameter Petri dishes filled with 5 ml of culture medium composed of 25% heat-inactivated horse serum, 25% HBSS, 50% Opti-MEM, 25 U/ml penicillin, 25 μg/ml streptomycin (Invitrogen). Cultures were maintained in a humidified incubator at 35°C and 5% CO2. One week later, cultures were transferred in defined medium composed of 25% B27 supplemented Neurobasal medium, 25% HBSS, 50% Opti-MEM, 25 U/ml penicillin, 25 μg/ml streptomycin (Invitrogen).
At 2 weeks, membranes were transferred for experimentation to 6 well plates, each well filled with 1 ml of defined culture medium. Any other compound was added in this volume and below the membrane, to obtain the desired final concentration.
Treatments
In all experiments, slices and culture medium were collected for different analyses, at various time points: 2, 12, and 24 h after kainate treatment (post-KA).
Induction and recording of seizure-like events.
Slices were treated for 1 h with 25 μm kainate (Sigma-Aldrich), a dose that induces SLEs and neuronal death (de Bock et al., 1998). Then they were perfused with kainate-free defined culture medium up to 24 h (recovery period). Neuronal activity was recorded by dendritic field potentials in CA1 area during kainate treatment (1 h) and for the following 3 h at the beginning of the recovery period. Control slices received no treatment (supplemental Fig. 1A, available at www.jneurosci.org as supplemental material).
The first SLE, which consisted of an 8–9 Hz spike frequency lasting 10–20 s, appeared from 3 to 5 min after the beginning of the kainate treatment. Two to three successive similar SLEs separated by 3–6 min followed this initial event. This SLE pattern was found in all treated OHCs (n = 5). No SLE was observed following kainate washout, as well as in control (nontreated) slices (supplemental Fig. 2A, available at www.jneurosci.org as supplemental material).
SLE suppression by tetrodotoxin.
To determine whether neuronal activity per se was necessary to induce vascular remodeling, we suppressed the epileptic activity with tetrodotoxin (Sigma-Aldrich), a potent blocker of voltage-dependent sodium channels at a dose (1 μm) that abolishes in vitro seizures in hippocampus (Khirug et al., 2010). We used four conditions: control (no treatment), KA only (25 μm, 1 h), TTX only (1 μm, 15 min before and during KA treatment), and KA + TTX (supplemental Fig. 1B, available at www.jneurosci.org as supplemental material). OHCs were used to study vascular density (n = 12 slices from 3 rats per condition) and protein expression (n = 5 samples per condition).
VEGF neutralization.
To neutralize the endogenous VEGF released after SLEs, we used a monoclonal antibody raised against rat VEGF (R&D System Europe catalog #AF 564). It was added at 1 μg/ml in the culture medium after KA treatment, to prevent an effect of the antibody on epileptiform activity (supplemental Fig. 1C, available at www.jneurosci.org as supplemental material).
Inhibition of VEGFR-2 signaling pathways.
We inhibited VEGF-dependent signaling pathways using the following specific inhibitors, already used on rat brain slices (Selvatici et al., 2003; Ramsey et al., 2005; Dahmani et al., 2007): (1) Src pathway with 4-amino-5-(4-chlorophenyl)-7-(t-butyl)pyrazolo[3,4-d]pyrimidine (PP2) (10 μm), and its inactive analog (PP3, 10 μm), as control; (2) phosphatidylinositol 3-kinase (PI3K) with 2-(4-morpholinyl)-8-phenyl-4H-1-benzopyran-4-one (LY294002) (10 μm); and (3) PKC with 2-[1-(3-dimethylaminopropyl)-1H-indol-3-yl]-3-(1H-indol-3-yl)-maleimide (Bis 1) (1 μm). All inhibitors (Calbiochem Merk Chemicals) were dissolved in DMSO. The final dilution of DMSO was always >1:2000. At this dilution, DMSO had no effect on kainate-induced Src activation (supplemental Fig. 3B, available at www.jneurosci.org as supplemental material).
Inhibitors were added in the culture medium 1 h before KA treatment and up to 24 h post-KA (supplemental Fig. 1D, available at www.jneurosci.org as supplemental material). We assessed the cytotoxicity of these inhibitors using the lactate dehydrogenase (LDH) test.
Recombinant rat VEGF.
Slices were treated up to 24 h with 2 ng/ml recombinant rat VEGF (rrVEGF) or inactivated rrVEGF (rrVEGF boiled 10 min at 100°C; BrrVEGF) dissolved in culture medium. They were then sampled at 2, 12, and 24 h after the beginning of rrVEGF or BrrVEGF treatment (n = 5 samples for each time point) to analyze phosphorylated VEGFR-2 (VEGFR-2P) (supplemental Fig. 1E, available at www.jneurosci.org as supplemental material). Vascular density was checked 24 h after the beginning of rrVEGF or BrrVEGF treatment. We also examined the effect of rrVEGF or BrrVEGF on Src phosphorylation, and ZO-1 expression, 2 h post-treatment, and then, vascular density and vascular branching 24 h post-treatment in the presence of PP2 inhibitor (supplemental Fig. 1F, available at www.jneurosci.org as supplemental material). No effect of BrrVEGF was observed, indicating a specific effect of rrVEGF. Control slices received no treatment (n = 5 samples for each time point).
Cell death detection
The cell death was evaluated by the following two methods.
Quantitative assay: LDH test.
LDH activity was determined according to the manufacturer's protocol (kit no. 11644793001, Roche Diagnostics). Briefly, 100 μl of culture medium were collected to measure LDH released by damaged cells (Koh and Choi, 1987) in control (no treatment) and at 2, 12, and 24 h post-KA (n = 20 samples per condition). Cultures treated for 1 h with glutamate (25 mm) were used as controls of maximal toxicity (positive control). LDH activity was measured by the optical density (OD) at 405 nm. The cytotoxicity was evaluated in percentage of the maximal toxicity obtained by glutamate exposure: [(SLEs OD − control OD)/(glutamate OD − control OD)]. Statistical analysis was performed using Student's t test for unpaired data (p < 0.05 is significant). From 2 to 24 h post-KA, the cytotoxicity measured by the LDH test increased continuously and became significant at 12 and 24 h post-KA (supplemental Fig. 2B, available at www.jneurosci.org as supplemental material).
Evaluation of propidium iodide accumulation in different hippocampal areas.
We studied the localization of cell death using propidium iodide (PI) staining in control, 24 h post-KA, and positive control OHCs (n = 20 slices from 5 rats per condition). PI accumulated selectively in CA3 24 h post-KA, as previously described (de Bock et al., 1998) (supplemental Fig. 2C, available at www.jneurosci.org as supplemental material).
VEGF and VEGFR-2 transcript quantification
Slices were placed in RNAlater tissue collection solution (Ambion/Applied Biosystems) for RNA stabilization before extraction. Total RNAs were prepared using the RNAqueous-4PCR kit (Ambion), and their concentrations were evaluated by NanoDrop (Thermo Fisher Scientific). Then, 300 ng of RNA were reverse-transcribed with Cloned AMV First-Strand cDNA synthesis (Invitrogen). Primer pairs were designed with PrimerExpress Soft (Applied Biosystems): VEGF, 5′-TTGAATCCGCATGATCTGCATA-3′ and 3′-GCTATTGCCGTCCAATTGAGA-5′; VEGFR-2, 5′-CGCTGGAGTACACGGTGGTAT-3′ and 3′-TGTCAGAGACACTGAGCATGGA-5′; β-actin, 5′-CCAGRGGRACGACCAGAGGC-3′ and 3′-CGTAGCCATCCAGGCTGTGT-5′; TATA box binding protein, 5′-AATCCAGGAAATAATTCTGGCTCATA-3′ and 3′-GTTGACCCACCAGCAGTTCAG-5′; HPRT (hypoxanthine phosphoribosyltransferase 1), 5′-TCGCTGATGACACAAACATGATT-3′ and 3′TGACTATAATGAGCACTTCAGGGATT-3′.
Quantitative PCR was performed using SYBR Green Master Mix (Applied Biosystems 7500). Reverse-transcribed products (10 ng) were amplified in 10 μl of a solution containing 1× Syber Mix and primers. β-Actin, TATA box binding protein, and HPRT were used as housekeeping genes.
Relative quantification of VEGF and VEGFR-2 mRNA was performed by a comparative threshold cycle (Ct) method between control and kainate conditions (Applied Biosystems). Each gene was normalized according to the formula 2−[(Ct gene(kainate) − Ct ref(kainate)) − (Ct gene(control) − Ct ref(control))] for each reference (β-actin, HPRT, and TATA box). Statistical analysis was performed by Student's t test (p < 0.05 is significant).
Western blot and analysis of protein expression
In Western blots, each sample consisted of 10 slices from the same well, pooled and lysed in the same tube. The number of samples used for each analysis is indicated in figure legends. In each experiment, samples were loaded in duplicate. Data shown in figures correspond to the average of such duplicates.
Tissues were lysed in sample buffer containing Tris-EDTA 1×, NaCl (100 mm), 1% Triton X-100, 1× protease inhibitors, and phosphatase inhibitors: sodium fluoride (10 mm), sodium orthovanadate (2 mm), and sodium pyrophosphate (1 mm) (all components from Sigma-Aldrich). After mechanical lysis with a Potter-Elvehjem homogenizer, samples underwent centrifugation at 1000 × g at 4°C for 10 min, and the supernatant containing proteins was stored at −20°C.
Protein concentration was determined by using a BCA assay kit (Sigma-Aldrich). Protein samples (40 μg) boiled in Laemmli buffer containing 2-β-mercaptoethanol were loaded onto a Novex NuPAGE 4–12% Bis-Tris Midi gel (Invitrogen), separated electrophoretically, and transferred to polyvinyl difluoridine membranes (Hybond-C-extra, GE Healthcare Europe). Membranes were blocked with TBS-T/milk 5% or TBS-T/BSA 5% for phosphorylated proteins. After blocking, membranes were incubated overnight at 4°C with primary antibodies raised against VEGF, VEGFR-2, VEGFR-2P (phosphorylation sites on tyrosine 1054 and on tyrosine 1059), ZO-1, phosphorylated Src (SrcP) (phosphorylation site on tyrosine 416), Src, or actin diluted as indicated in Table 1, in TBS-T/milk 5% or TBS-T/BSA 3% for phosphorylated antibody. Membranes were then incubated with HRP-conjugated secondary antibodies (Table 1) for 1 h at room temperature in TBS-T/milk 5% or TBS-T 3% followed by chemiluminescence detection (Western Lightning, PerkinElmer). The detected bands were scanned at high definition and analyzed by densitometry using NIH ImageJ software and normalized with actin. Statistical analysis was performed by Kruskall–Wallis test (p < 0.05 is significant).
Table 1.
Primary and secondary antibodies
| Source | Clone or Reference | Dilution | Supplier | IHC | WB | |
|---|---|---|---|---|---|---|
| Primary antibodies | ||||||
| GFAP | Mouse monoclonal | 6F2 | 1:500 | DAKO | + | |
| Rabbit polyclonal | 1:1000 | + | ||||
| NeuN | Mouse monoclonal | MAB377 | 1:500 | Millipore Bioscience Research Reagents | + | |
| VEGF | Goat polyclonal | Sc-1836 | 1:200 | Santa Cruz Biotechnology, Tebu-bio | + | |
| 1:100 | + | |||||
| VEGFR2 | Rabbit polyclonal | Sc-504 | 1:200 | Santa Cruz Biotechnology, Tebu-bio | + | |
| Rabbit polyclonal | Ab2349 | 1:1000 | Abcam | + | ||
| VEGFR2P | Rabbit polyclonal | Ab5473 | 1:1000 | Abcam | + | |
| Src | Rabbit monoclonal | 36D10 | 1:1000 | Cell Signaling Technology, Ozyme | + | |
| SrcP | Rabbit polyclonal | 2101 | 1:1000 | Cell Signaling Technology, Ozyme | + | |
| ZO-1 | Rabbit polyclonal | 61-7300 | 1:200 | Zymed, Invitrogen | + | |
| 1:800 | + | |||||
| RECA-1 | Mouse monoclonal | MCA970R | 1:1000 | AbD Serotec | + | |
| Laminin | Mouse monoclonal | 2E8 | 1:3000 | Millipore Bioscience Research Reagents | + | |
| Rabbit polyclonal | L9393 | 1:4000 | Sigma-Aldrich | + | ||
| Actin | Mouse monoclonal | ACTN05 | 1:1000 | LabVision, Thermo Fisher Scientific | + | |
| Other markers | ||||||
| Lectin | Biotinylated isolectin B4 | L-3759 | 1:200 | Sigma-Aldrich | + | |
| Secondary antibodies | ||||||
| Alexa 488 | Donkey anti-goat | A11055 | 1:2000 | Invitrogen | + | |
| Goat anti-rabbit | A11008 | 1:2000 | + | |||
| Cy3 | Donkey anti-mouse | 715-165-151 | 1:500 | Jackson ImmunoResearch Europe | + | |
| AMCA | Donkey anti-rabbit | 711-155-152 | 1:100 | Jackson ImmunoResearch Europe | + | |
| Texas Red | Avidin | A-1100 | 1:100 | DAKO | + | |
| HRP | Goat anti-rabbit | 111-035-003 | 1:4000 | Jackson ImmunoResearch Europe | + | |
| Goat anti-mouse | 115-005-146 | 1:4000 | Jackson ImmunoResearch Europe | + | ||
| Rabbit anti-goat | AP107P | 1:2000 | Millipore Bioscience Research Reagents | + |
IHC, Immunohistochemistry; WB, Western blot.
Quantification of VEGF release
The level of VEGF released in culture medium was determined by standard ELISA using the Quantikine Immunoassay Kit (catalog #DY564, R&D Systems Europe), according to the manufacturer's protocol. VEGF concentration was determined with linear regression using standard concentrations of rrVEGF between 31 and 1000 pg/ml as a reference. Statistical analysis was performed using one-way ANOVA followed by Fisher's test (p < 0.05 is significant).
Histological study of vascularization, VEGF, VEGFR-2, and ZO-1 expression
Immunohistochemistry.
Slices were fixed in 4% paraformaldehyde (PFA) for 30 min and stored at 4°C in PBS containing 0.1% NaNO3. To evaluate vascular density and ZO-1 expression, immunohistochemistry was performed on free-floating whole slices. After preincubation in a PBS solution containing 10% goat serum and 0.1% Triton X-100 for 2 h at room temperature, slices were incubated at 48 h at 4°C with primary antibodies raised against the following: laminin (a specific protein of the peri-endothelial basal lamina), rat endothelial cell antigen (RECA-1), and the tight junction protein ZO-1, in PBS + 0.1% Triton X-100. Slices were then incubated with fluorescence-conjugated secondary antibodies (Table 1). To check the specificity of antibodies, we performed negative controls, by omitting primary antibodies.
For VEGF and VEGFR-2 expression and localization, PFA-fixed slices were cryoprotected by immersion in successive sucrose solutions (10, 20, and 30%) in PBS, 1 h for 10 and 20%, and overnight for 30% at 4°C, and cut into 20 μm sections with a cryostat, mounted on slides, and processed for immunostaining as above. All antibody sources, suppliers and dilutions are specified in Table 1.
Microscope observation and image acquisition.
To measure the vascular density, sections were observed with a Leitz DMRB microscope (Leica Microsystems) equipped for fluorescence microscopy. Images were digitized by a 1392 × 1040 pixel resolution cooled CCD camera (CoolSNAP, Princeton Instruments, Roper Scientific, SAS) on a computer with CoolSNAP software and transferred to Adobe Photoshop Elements for image processing.
For VEGF, VEGFR-2, and ZO-1 immunostaining, sections were observed using a confocal microscope (LSM 510 Meta, Zeiss). Images were collected sequentially to avoid cross-contamination between fluorochromes. Series of 15 optical sections were projected onto a single image plane and scanned at 1024 × 1024 pixel resolution.
Measure of vascular density: data analysis.
We used the point-counting method (de Paz and Barrio, 1985) to quantify the whole vascular network in the different experimental conditions as previously described in vivo and in organotypic slices (Rigau et al., 2007). Briefly, a 5 × 5 grid (5.2 mm2) was superimposed on the digitized image, and the number of labeled vessels crossing the grid was counted. The score was expressed in arbitrary units of vascular density per square millimeter. Results were expressed in percentage of controls. Slices used for quantification were randomized among slices of three different cultures and different animals. Statistical analysis was performed by one-way ANOVA followed by Fisher's test for OHCs (p < 0.05 is significant).
Branching: data analysis.
To evaluate the branching after each treatment, we selected magnifications of 0.5 mm2 areas in the two main hippocampal fields: CA1 and CA3 areas. We counted manually the vessel branch points (Horowitz and Simons, 2008). Results were expressed as a percentage of controls. Statistical analysis was performed by one-way ANOVA followed by Fisher's test for OHCs (p < 0.05 is significant).
Results
SLEs induce vascularization and ZO-1 downregulation
To confirm that laminin was specific to blood vessels in our preparation, we performed a double labeling with the endothelial cell marker RECA-1. We observed a regular expression of laminin, lining RECA-1-stained cells, in control slices and at 24 h post-KA (Fig. 1A). This observation supports the idea that laminin is a suitable marker of blood vessels. In control OHCs, laminin immunostaining revealed the presence of large microvessels derived from the periventricular zone and hippocampal fissure, with collaterals forming a regular network of capillaries in the whole hippocampus (Fig. 1B). In kainate-treated OHCs, we observed an overexpression of laminin (Fig. 1B) and a significant increase in vascular density at 24 h post-KA (Fig. 1C). Moreover, the inhibition of neuronal activity by TTX prevented the increase in vascular density observed after kainate treatment (Fig. 1D). This result indicates that the epileptiform activity was necessary to induce vascularization. We also found an intense branching, which generated large and short collateral capillaries in CA1 and CA3 areas of KA-treated OHCs (Fig. 1E). The quantification of branches in these areas revealed a significant increase at 24 h post-KA (Fig. 1F). We noticed that branching was stronger in CA1 than in CA3 (supplemental Fig. 3A, available at www.jneurosci.org as supplemental material).
Figure 1.
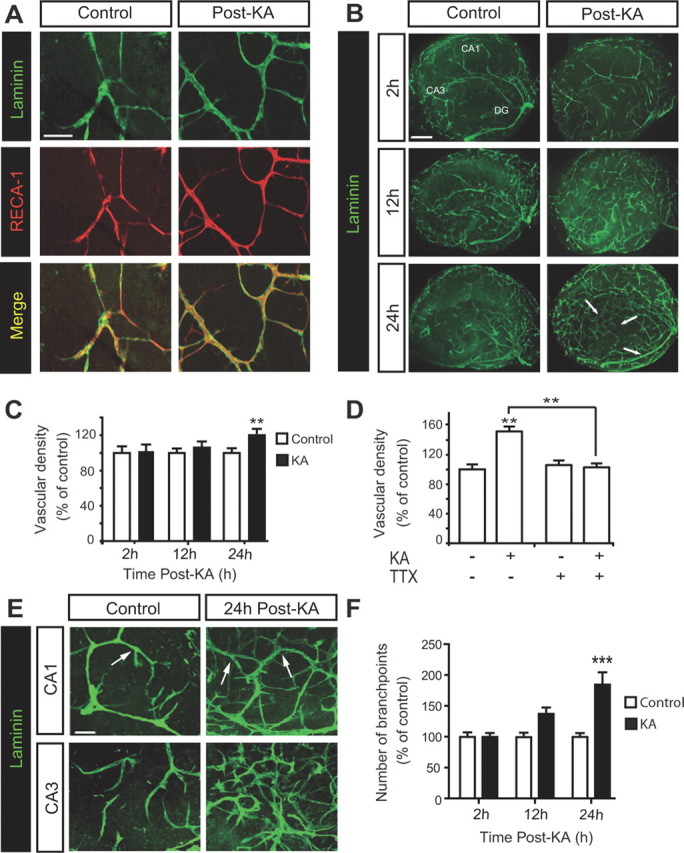
KA treatment induces vascularization in OHCs. A, Double immunostaining of laminin and RECA-1 at 24 h post-KA. Scale bar, 50 μm. B, Immunostaining of laminin in whole slices at 2, 12, and 24 h post-KA. Arrows show the zones in which vascular density is increased after KA, compared with control slices. Scale bar, 400 μm. C, Quantification of vascular density at 2, 12, and 24 h post-KA. Data are expressed as percentage of control (control n = 21 slices from 6 rats, KA n = 24 slices from 6 rats for each time point). D, Quantification of vascular density at 24 h post-KA with or without TTX. Data are expressed as percentage of control (n = 12 slices from 3 rats per condition). E, Representative confocal images of laminin staining in CA1 and CA3 areas at 24 h post-KA. Arrows show vessel branch points. Scale bar, 50 μm. F, Quantification of branching at 2, 12, and 24 h post-KA. Data are expressed as percentage of control (n = 15 slices from 6 rats per condition and for each time point). **p < 0.01, ***p < 0.005.
The TJ integrity was evaluated by quantifying expression of three main proteins of tight junctions: occludin, claudin-5, and ZO-1. Western analysis showed no significant difference in occludin expression between control and KA-treated slices (Fig. 2A). Both claudin-5 and ZO-1 were significantly decreased at 2 h post-KA (Fig. 2B,C). However, only the level of ZO-1 remained significantly low 24 h post-KA (Fig. 2C). Immunofluorescence showed that ZO-1 staining was regular along microvessels in control OHCs, whereas it was discontinuous or absent from 2 to 24 h after kainate treatment (Fig. 2D). Therefore, we focused our study on the regulation of ZO-1.
Figure 2.

KA-induced SLEs regulate tight junction proteins. A–C, Western blotting of occludin, claudin-5, and ZO-1 expression at 2, 12, and 24 h post-KA. Quantification is expressed as percentage of control (n = 10 samples per condition and for each time point). *p < 0.05, **p < 0.01, ***p < 0.005. D, Representative confocal images of double labeling of ZO-1 (green) and laminin (red) at 2 and 24 h post-KA. Scale bar, 10 μm.
SLEs induce VEGF/VEGFR-2 upregulation and VEGFR-2 activation
To study the kinetics of angiogenic processes in vitro, we measured transcription, expression, localization, and secretion of VEGF. The amount of VEGF mRNA was significantly upregulated at 2 and 24 h post-KA (Fig. 3A). At 12 h post-KA, VEGF mRNA was at the same level as that found in untreated OHCs (Fig. 3A). VEGF protein level was significantly increased at 12 h post-KA, subsequent to the peak of VEGF mRNA (Fig. 3B). The progressive accumulation of VEGF in the medium, measured by ELISA, was significantly enhanced only at 24 h post-KA (Fig. 3C).
Figure 3.

KA-induced SLEs activate VEGFR-2 and upregulate VEGF/VEGFR-2. A, D, Quantitative RT-PCR of VEGF and VEGFR-2 mRNA isolated from control OHCs and KA-treated OHCs at 2, 12, and 24 h post-KA (n = 3 samples per condition and for each time point). B, E, Western blot of VEGF and VEGFR-2 at 2, 12, and 24 h post-KA. Quantification expressed as percentage of control (n = 5 samples per condition and for each time point). C, Measure of VEGF released in medium by ELISA at 2, 12, and 24 h post-KA (n = 5 samples for each time point). F, Western blot of phosphorylated VEGFR-2 at 2, 12, and 24 h post-KA. Quantification is expressed as percentage of control (n = 5 samples per condition and for each time point). *p < 0.05, **p < 0.01, ***p < 0.005, NS, not significant. G, Representative confocal images of CA1 area in control and treated OHCs (12 h post-KA). Top, Triple labeling of VEGF (green), NeuN (red), and GFAP (blue). Bottom, Triple labeling of VEGF (green), laminin (red), and GFAP (blue). Arrows indicate the diffusion of VEGF around microvessels; arrowheads indicate the presence (control) or loss (post-KA) of GFAP staining that is consistent with the detachment of astrocytic end feet around microvessels. Scale bar, 10 μm. H, Representative confocal images of double labeling of VEGFR-2 (green) and NeuN or GFAP or laminin (red) in CA1 area of control and treated OHCs (12 h post-KA). The arrow shows VEGFR-2 expression in neurons. Scale bar, 10 μm.
Quantitative reverse transcriptase (RT)-PCR revealed a significant upregulation of VEGFR-2 mRNA at 2 and 24 h post-KA (Fig. 3D). At 12 h post-KA, VEGFR-2 mRNA amount was at the same level as the one measured in the control condition (Fig. 3D). The expression of VEGFR-2 increased at 12 and 24 h post-KA (Fig. 3E). We measured a characteristic feature of VEGFR-2 activation: the trans-autophosphorylation of tyrosine residues Y1054/Y1059 in the cytoplasmic domain following receptor activation by VEGF (Dougher and Terman, 1999). Immunoblotting showed that the levels of pY1054/pY1059 were transiently increased at 2 h post-KA and returned to control level at later time points (Fig. 3F).
We identified by immunofluorescence the cell types expressing VEGF and VEGFR-2. In control OHCs, a substantial amount of VEGF was stored in large vesicles of neurons and few astrocytes (Fig. 3G). At 12 h post-KA, VEGF staining was strongly increased, particularly in astrocytes and, to a lesser extent, in neurons. We observed a diffusion of VEGF around capillaries (Fig. 3G, arrows) and a detachment of astrocytic end feet from microvessels (Fig. 3G, arrowheads).
VEGFR-2 staining was very faint in neurons and blood vessels in control conditions, whereas it was strong in both neurons and vascular cells after neuronal activity (Fig. 3H).
SLEs induce vascularization and ZO-1 downregulation by VEGF/VEGFR-2 activation
To further examine the implication of VEGF in vascular remodeling after neuronal activity, we neutralized extracellular VEGF with an anti-VEGF antibody. We assessed the efficacy of the antibody by the lack of detectable VEGF measured by ELISA in culture medium, 24 h after kainate treatment (Fig. 4A).
Figure 4.

KA-induced SLEs lead to VEGF/VEGFR-2 activation. A, Measure of VEGF released in medium by ELISA, 24 h post-KA, with or without anti-VEGF antibody (n = 15 samples per condition and for each time point). B, Cytotoxicity measured by LDH activity in the supernatant at 24 h post-KA, with or without anti-VEGF antibody. Results are expressed as percentage of maximal toxicity (n = 10 wells from 8 rats for each condition). C, D, Western blot of VEGFR-2 expression and phosphorylation at 2, 12, and 24 h post-KA, with or without anti-VEGF antibody. Quantification is expressed as percentage of control (n = 5 samples per condition and for each time point). *p < 0.05, **p < 0.01, ***p < 0.005.
We checked the toxicity of the anti-VEGF antibody on OHCs using the LDH test. The antibody alone had no cytotoxic effects on control OHCs, whereas it worsened significantly the KA-induced cytotoxicity (Fig. 4B).
Then, we evaluated the effects of the anti-VEGF antibody on VEGF/VEGFR-2 activation. As reported above, VEGFR-2 expression was significantly increased at 12 and 24 h after KA treatment. These changes were not modified in the presence of the neutralizing antibody (Fig. 4C). The transient phosphorylation of VEGFR-2 at tyrosine Y1054/Y1059, observed at 2 h post-KA, was prevented by the anti-VEGF antibody (Fig. 4D). Thus, VEGF neutralization did not modify VEGFR-2 expression, but prevented VEGFR-2 activation induced by KA.
The effects of VEGF neutralization on vascular remodeling were measured at 24 h post-KA (the time point of maximal vascular density and branching). The anti-VEGF antibody had no effect on the vascularization in control OHCs, but fully prevented the vascular changes induced by KA treatment (Fig. 5A). Vascular density and branching 24 h post-KA were quantitatively similar to those observed in control OHCs (Fig. 5B,C).
Figure 5.

KA-induced SLEs lead to vascularization via VEGF/VEGFR-2 activation. A, Representative images of laminin immunostaining at 24 h post-KA, with or without anti-VEGF antibody. Scale bar, 400 μm. B, C, Quantification of vascular density and number of branch points. Results are expressed as percentage of control (n = 15 slices from 6 rats per condition and for each time point). D, Western blot of VEGF at 12 h post-KA, with or without TTX. Quantification is expressed as percentage of control (n = 3 samples per condition and for each time point). **p < 0.01, ***p < 0.005.
We evaluated the effects of anti-VEGF antibody on ZO-1 expression and localization. In the control condition, ZO-1 was regularly expressed along microvessels, and the anti-VEGF antibody did not alter this staining (Fig. 6A). At 24 h post-KA, the ZO-1 labeling disappeared, while anti-VEGF antibody maintained a regular expression staining of ZO-1 in microvessels (Fig. 6A). This effect was confirmed by immunoblot analysis showing that the antibody did not modify ZO-1 expression in control slices, but prevented its downregulation observed at 2, 12, and 24 h post-KA (Fig. 6B).
Figure 6.

KA-induced SLEs downregulate ZO-1 via VEGF/VEGFR-2 activation. A, Representative confocal images of double labeling of ZO-1 (green) and laminin (red) in CA1 area, 24 h post-KA, with or without anti-VEGF antibody. Scale bar, 10 μm. B, Western blot of ZO-1 at 2, 12, and 24 h post-KA, with or without anti-VEGF antibody; quantification is expressed as percentage of control (n = 5 samples per condition and for each time point). C, Western blot of ZO-1 at 12 h post-KA, with or without TTX; quantification is expressed as percentage of control (n = 3 samples per condition and for each time point). **p < 0.01, ***p < 0.005.
Suppression of neuronal activity by TTX prevented VEGF overexpression and ZO-1 downregulation (Figs. 5D, 6C), thus confirming that epileptiform activity, rather than KA per se, controls expression of these proteins.
Together, these results show that VEGF neutralization by an anti-VEGF antibody fully prevented SLE-induced vascular remodeling and ZO-1 downregulation.
Phosphatidylinositol 3-kinase pathway and PKC are involved in cell survival and vascularization, respectively, secondary to SLEs
Since both neurons and endothelial cells express VEGFR-2 and because the anti-VEGF antibody fully prevents the effects of VEGFR-2 on SLE-induced vascular remodeling, we aimed at determining the respective roles of the signaling pathways downstream to VEGFR-2.
We selectively blocked the three main pathways, PI3K, PKC, and Src, with specific inhibitors (LY294002, Bis 1, and PP2, respectively). First, we checked the effects of the three inhibitors on cytotoxicity and vascularization at 24 h post-KA. As shown in Figure 4B, KA alone induced cytotoxicity in OHCs. Bis 1 and PP2 alone had no effect on cytotoxicity in control and in KA-treated OHCs. In contrast, LY294002 alone was toxic and significantly worsened the cytotoxic effect of KA treatment (Fig. 7A). We thought that this over-cytotoxicity itself could have deleterious effects, like inflammation, which could participate in vascular alteration (Ravizza et al., 2008). Thus, we concluded that PI3K inhibition by LY294002 was not relevant in this study, and we focused on PKC and Src pathways.
Figure 7.

Cell survival depends on PI3K and vascularization on PKC. A, Cytotoxicity measured by LDH activity in the supernatant at 24 h post-KA, with or without specific inhibitors: Bis 1, PP2, or LY294002. Results are expressed as percentage of maximal toxicity [control = 10 wells, KA n = 12 wells; control + inhibitor (inh) n = 8 wells; KA + inh n = 8 wells) B, Immunostaining of laminin 24 h post-KA, with or without Bis 1 or PP2. Scale bar, 400 μm. C, Quantification of vascular density 24 h post-KA, with or without Bis 1 or PP2. Results are expressed as percentage of control (control n = 20 slices from 6 rats, KA n = 20 slices from 6 rats, control + inh n = 10 slices from 3 rats and KA+ inh n = 10 slices from 3 rats). D, Representative confocal images of laminin staining in CA1 and CA3 areas at 24 h post-KA, with or without Bis 1 or PP2. Scale bar, 50 μm. E, Branch point quantification in CA1 and CA3 areas at 24 h post-KA, with or without Bis 1 or PP2. Results are expressed as percentage of control (control n = 15 slices from 6 rats, KA n = 5 slices from 6 rats, control + inh n = 10 slices from 5 rats, and KA + inh n = 10 slices from 5 rats). *p < 0.05, **p < 0.01, ***p < 0.005.
We evaluated the effects of PKC or Src inhibition by Bis 1 and PP2, respectively, on the vascularization at 24 h post-KA, which is the time point of maximal vascular density and branching. Neither Bis 1 nor PP2 modified the laminin staining in OHCs (Fig. 7B), showing that these inhibitors had no effects on vascular network. However, 24 h post-KA, the increase in laminin staining (Fig. 7B) and vascular density (Fig. 7C) was totally blocked by Bis 1, while PP2 had no effect (Fig. 7B,C). OHCs treated with Bis 1 displayed an impressive lack of branching in CA1 and CA3 areas that was confirmed by quantification in these areas (Fig. 7D,E). Inhibiting Src pathway by PP2 did not prevent the increase in KA-induced branching (Fig. 7D,E). These results indicate a specific role of PKC, but not Src in KA-induced vascularization and branching.
Src pathway is involved in KA-induced ZO-1 downregulation
Since Src inhibition had no effect on toxicity, vascular density, and branching, we decided to investigate the role of this pathway in ZO-1 regulation. We evaluated Src activation by measuring phosphorylation of its tyrosine 416 (Y416) at 2 h post-KA, because this time point corresponds to the peak of VEGFR-2 activation (Fig. 3F). KA treatment induced a significant phosphorylation of Src (Fig. 8A). This effect was fully prevented by the anti-VEGF antibody (Fig. 8A). PP2 alone reduced significantly Src phosphorylation compared with untreated OHCs (Fig. 8A), thus showing that PP2 was effective for blocking Src phosphorylation. PP3, an inactive analog of PP2, had no effect (supplemental Fig. 3B, available at www.jneurosci.org as supplemental material).
Figure 8.

Src is involved in SLE-induced ZO-1 downregulation. A, Western blot of phosphorylated Src (SrcP) and Src 2 h post-KA with or without anti-VEGF antibody or PP2. Quantification of the ratio SrcP/Src is expressed as percentage of control (n = 5 samples per condition and for each time point). B, Confocal images of double labeling of ZO-1 (green) and laminin (red) in CA1 area 2 and 24 h post-KA, with or without PP2. Scale bar, 10 μm. C, Western blot of ZO-1 at 2 and 24 h post-KA, with or without PP2, and quantification expressed as percentage of control (n = 5 samples per condition and for each time point). **p < 0.01, ***p < 0.005.
In PP2-treated OHCs, ZO-1 staining was regular along microvessels, as in control OHCs. From 2 to 24 h after KA treatment, the ZO-1 staining along microvessels was missing, an effect that was prevented by PP2 application (Fig. 8B). Western blot analysis confirmed that KA treatment induced a significant decrease in ZO-1 expression, which was fully reversed by PP2 (Fig. 8C).
VEGF is responsible for ZO-1 downregulation via VEGFR-2/Src activation
To determine whether VEGF was sufficient to induce ZO-1 downregulation via the Src pathway, we applied rrVEGF on OHCs at 2000 pg/ml, a dose related to the concentration of VEGF released in culture medium at 24 h post-KA (Fig. 3C), and measured the expression and phosphorylation of VEGFR-2. Protein expression analysis revealed no significant change in the expression of VEGFR-2 (supplemental Fig. 3C, available at www.jneurosci.org as supplemental material). VEGFR-2 phosphorylation was increased at 2 h and returned to control levels at 12 and 24 h after rrVEGF application. No VEGFR-2 activation was observed after the application of the inactive BrrVEGF (Fig. 9A), suggesting a specific effect of rrVEGF. We then studied the activation of Src pathway 2 h after rrVEGF treatment, which is the time point of maximal VEGFR-2 activation. We found that Src phosphorylation increased in the presence of rrVEGF, and this effect was inhibited by PP2 (Fig. 9B). No Src phosphorylation was observed with BrrVEGF treatment (Fig. 9B). These results were comparable to those obtained with KA treatment (Fig. 8A).
Figure 9.

rrVEGF reproduces KA-induced vascular remodeling. A, Western blot of VEGFR-2P, 2, 12, 24 h after rrVEGF or BrrVEGF application. Quantification expressed in percentage of control (n = 5 samples per condition). B, Western blot of SrcP and Src at 2 h of application with or without PP2. Quantification represents the ratio SrcP/Src expressed in percentage of control (n = 5 samples per condition. C, Laminin immunostaining in OHCs at 24 h of rrVEGF or BrrVEGF application, with or without PP2. Scale bar, 400 μm. D, Quantification of vascular density at 24 h after BrrVEGF or rrVEGF application with our without PP2. Data are expressed in percentage of control (n = 15 slices from 3 rats per condition). E, Confocal images of laminin staining in CA1 and CA3 areas at 24 h after rrVEGF treatment, with or without PP2. Scale bar, 50 μm. F, Branch point quantification at 24 h of rrVEGF application with our without PP2. Data are expressed in percentage of control (n = 10 slices from 4 rats per condition). G, Confocal images of double labeling of ZO-1 (green) and laminin (red) in CA1 area 2 h after BrrVEGF or rrVEGF application, with or without PP2. Arrows show the disrupted ZO-1 on microvessels. Scale bar, 10 μm. H, Western blot of ZO-1 expression 2 h after rrVEGF or BrrVEGF application with or without PP2, and quantification expressed in percentage of control (n = 5 samples per condition). *p < 0.05, **p < 0.01, ***p < 0.005.
Neither PP2 alone nor BrrVEGF altered the vascular network 24 h after the onset of drug application. To the contrary, we observed a significant increase in laminin staining and vascular density at 24 h of rrVEGF treatment (Fig. 9C,D). The number of branch points quantified in CA1 and CA3 also increased significantly in OHCs after 24 h of rrVEGF treatment compared with control OHCs. PP2 treatment did not prevent this effect (Fig. 9E,F).
Two hours of rrVEGF treatment induced an irregular staining of ZO-1 along microvessels (Fig. 9G) and a significant decrease in ZO-1 expression (Fig. 9H). No changes in ZO-1 expression were observed after BrrVEGF application. Finally, PP2 treatment maintained a normal pattern of ZO-1 staining at the TJ and abolished the rrVEGF-induced downregulation of the protein (Fig. 9G,H).
Together, these results showed that rrVEGF mimicked the effects of KA-induced SLEs on OHCs: transient activation of VEGFR-2 and Src, downregulation of ZO-1, and increase in vascularization. Moreover, they confirmed that VEGF/VEGFR-2 activation was responsible for vascular remodeling and that Src pathway regulates ZO-1 expression.
Discussion
This study showed that kainic acid induced vascular changes, which disappear in the presence of TTX, suggesting that neuronal activity activated VEGF/VEGFR-2-signaling pathways. In our in vitro model, we found that PI3K is involved in cell survival, PKC in vascularization, and Src in ZO-1 downregulation. VEGF mobilization by SLEs seemed to be the key event in the vascular remodeling since neutralizing VEGF with a specific antibody fully prevented all the changes.
ZO-1 downregulation was likely to be the first step of tight junction dysfunction, leading to an alteration of the BBB. Such causal deleterious effects of the VEGF/VEGFR-2 system on BBB integrity have been suggested in neuroinflammatory pathologies such as experimental autoimmune encephalomyelitis and Alzheimer's disease (Ballabh et al., 2004; Zlokovic, 2008; Argaw et al., 2009), but have never been demonstrated in epilepsy.
Several observations indicate that the initiation of VEGFR-2 signaling cascades was exclusively due to a release of the VEGF present in neurons before SLEs and not to the VEGF synthesized after SLEs. We do not exclude that other VEGFR-2 ligands, present in our preparation, could also participate in this effect, but the following observation favors a prevalent effect of VEGF. On the one hand, the phosphorylation of VEGFR-2 on Y1054/Y1056, which is necessary for maximal activation, was strongly increased at 2 h post-KA, concomitant with the VEGF-induced Src activation and ZO-1 downregulation. On the other hand, VEGF level peaked only at 12 h post-KA, expressed mainly by astrocytes rather than neurons. It has already been described that VEGF is stored in large extracellular vesicles of neurons and astrocytes, like in tumor cells. Such vesicles have been shown to rapidly release and diffuse VEGF in the vicinity of microvessels by shedding (Schiera et al., 2007; Proia et al., 2008). The opposite effects of anti-VEGF and recombinant VEGF treatments confirmed that a transient phosphorylation of VEGFR-2 is necessary and sufficient to initiate vascular remodeling.
Paradoxically, VEGFR-2 activation plays a dual role in the epileptic focus. Indeed, VEGF has a beneficial role for two reasons. First, the neuronal VEGFR-2 has been shown to be protective via the PI3K/Akt pathway and to exert anti-epileptic effects (McCloskey et al., 2005; Nicoletti et al., 2008). In our study, PI3K inhibition increased SLE-induced toxicity, in accordance with the protective effect of PI3K/Akt against neuronal death after kainate-induced SLEs (Lee et al., 2006). Second, activation of endothelial VEGFR-2 provides an indirect neuroprotection, via PKC-dependent endothelial proliferation. By increasing the vascular density, this pathway improves the neurovascular coupling required during in vivo seizures. In OHCs, inhibiting PKC pathway prevented branching and vascularization after SLEs, as has already been reported in diabetic retinopathy (Holmes et al., 2007), thus indicating a crucial role of PKC in SLE-induced vascularization.
In contrast to these positive consequences of VEGF following SLEs, other VEGF signaling pathways exert deleterious effects on vascular integrity, particularly at the BBB. We showed here that downregulation of ZO-1, an essential scaffold protein for tight junction assembly, follows activation of VEGFR-2 and Src pathway. We also showed that Src inhibition provided an effective protection of ZO-1 network after SLEs, confirming the major role of Src in ZO-1 downregulation, as was reported in models of ischemia and retinopathy (Sheikpranbabu et al., 2009; Takenaga et al., 2009). It is noteworthy that another Src inhibitor (CGP76030), tested on an in vivo model of epilepsy, was shown to reduce the proconvulsive effects of IL-1β (Balosso et al., 2008), strengthening the interest in investigating Src signaling for epilepsy.
Transcription and synthesis of VEGF and VEGFR-2 are not involved in the acute activation of VEGFR-2 pathways observed after SLEs. VEGF is known to be rapidly induced in hypoxic or inflammatory conditions, via transcription factors such as HIF-1 (hypoxia-inducible factor 1), AP-1 (activator protein 1), Sp-1, and STAT 3 (signal transducer and activator of transcription 3), which are also activated by seizures (Feng et al., 1997, 1999; Choi et al., 2003). Similarly, VEGFR-2 synthesis was shown to depend on the same transcription factors (HIF-1 and Sp-1) in hypoxic or inflammatory conditions and after seizures (Gerber et al., 1997; Meissner et al., 2009). Nevertheless, in OHCs, VEGFR-2 activation occurred early after seizure induction (2 h post-KA) and not at later time points when VEGF and VEGFR-2 were overexpressed. Such a downregulation of VEGFR-2 activity has been described previously during angiogenesis as a ligand-stimulated mechanism of receptor desensitization, endocytosis, or proteolysis (Lampugnani et al., 2006; Bruns et al., 2010). We suggest that the delayed increase in VEGF and VEGFR-2 expression could potentiate the vascular alteration in response to putative subsequent epileptiform activity, worsening and prolonging BBB disruption, as shown in vivo (Rigau et al., 2007).
Moreover, other angiogenic or inflammatory factors such as angiopoietins, bFGF, interleukins, TNFα, and chemokines could be induced by cell death, which peaks at 12 h post-KA, potentiating the effects of VEGFR-2 via a synergy of signaling pathways (Allan et al., 2005; Ravizza et al., 2008; Vezzani et al., 2008; Marcon et al., 2009). Such receptor transactivation or modulation has been shown previously to prolong BBB degradation (Petreaca et al., 2007).
In conclusion, our findings revealed that the VEGF/VEGR-2 system played a pivotal role in initiating SLE-induced BBB alterations, which in turn contributed to epileptogenesis. Selectively targeting the Src pathway prevented tight junction dysfunction without deleterious side effects on neurons or vascularization. Future investigations should consider the Src pathway as a putative therapeutic target for intractable epilepsies, and that protecting BBB integrity could reduce or delay epileptogenesis.
Footnotes
This study was supported by the French Foundation for Research on Epilepsy. We thank Dr. Federica Bertaso-Espeut for critically reading the manuscript, Nicole Lautredou-Audouy for confocal microscopy at the Centre Régional d'Imagerie Cellulaire, and Dr. Veronique Saywell for her help with quantitative RT-PCR experiments.
The authors declare no competing financial interests.
References
- Ahmad S, Hewett PW, Wang P, Al-Ani B, Cudmore M, Fujisawa T, Haigh JJ, le Noble F, Wang L, Mukhopadhyay D, Ahmed A. Direct evidence for endothelial vascular endothelial growth factor receptor-1 function in nitric oxide-mediated angiogenesis. Circ Res. 2006;99:715–722. doi: 10.1161/01.RES.0000243989.46006.b9. [DOI] [PubMed] [Google Scholar]
- Allan SM, Tyrrell PJ, Rothwell NJ. Interleukin-1 and neuronal injury. Nat Rev Immunol. 2005;5:629–640. doi: 10.1038/nri1664. [DOI] [PubMed] [Google Scholar]
- Argaw AT, Gurfein BT, Zhang Y, Zameer A, John GR. VEGF-mediated disruption of endothelial CLN-5 promotes blood-brain barrier breakdown. Proc Natl Acad Sci U S A. 2009;106:1977–1982. doi: 10.1073/pnas.0808698106. [DOI] [PMC free article] [PubMed] [Google Scholar]
- Ballabh P, Braun A, Nedergaard M. The blood-brain barrier: an overview: structure, regulation, and clinical implications. Neurobiol Dis. 2004;16:1–13. doi: 10.1016/j.nbd.2003.12.016. [DOI] [PubMed] [Google Scholar]
- Balosso S, Maroso M, Sanchez-Alavez M, Ravizza T, Frasca A, Bartfai T, Vezzani A. A novel non-transcriptional pathway mediates the proconvulsive effects of interleukin-1beta. Brain. 2008;131:3256–3265. doi: 10.1093/brain/awn271. [DOI] [PMC free article] [PubMed] [Google Scholar]
- Bazzoni G, Dejana E. Endothelial cell-to-cell junctions: molecular organization and role in vascular homeostasis. Physiol Rev. 2004;84:869–901. doi: 10.1152/physrev.00035.2003. [DOI] [PubMed] [Google Scholar]
- Bratz E. Ammonshornbefunde bei epileptikern. Arch Psychiatr Nervenkr. 1899;32:820–835. [Google Scholar]
- Bruns AF, Herbert SP, Odell AF, Jopling HM, Hooper NM, Zachary IC, Walker JH, Ponnambalam S. Ligand-stimulated VEGFR-2 signaling is regulated by co-ordinated trafficking and proteolysis. Traffic. 2010;11:161–174. doi: 10.1111/j.1600-0854.2009.01001.x. [DOI] [PubMed] [Google Scholar]
- Cacheaux LP, Ivens S, David Y, Lakhter AJ, Bar-Klein G, Shapira M, Heinemann U, Friedman A, Kaufer D. Transcriptome profiling reveals TGF-beta signaling involvement in epileptogenesis. J Neurosci. 2009;29:8927–8935. doi: 10.1523/JNEUROSCI.0430-09.2009. [DOI] [PMC free article] [PubMed] [Google Scholar]
- Choi JS, Kim SY, Park HJ, Cha JH, Choi YS, Kang JE, Chung JW, Chun MH, Lee MY. Upregulation of gp130 and differential activation of STAT and p42/44 MAPK in the rat hippocampus following kainic acid-induced seizures. Brain Res Mol Brain Res. 2003;119:10–18. doi: 10.1016/j.molbrainres.2003.08.010. [DOI] [PubMed] [Google Scholar]
- Croll SD, Goodman JH, Scharfman HE. Vascular endothelial growth factor (VEGF) in seizures: a double-edged sword. Adv Exp Med Biol. 2004;548:57–68. doi: 10.1007/978-1-4757-6376-8_4. [DOI] [PMC free article] [PubMed] [Google Scholar]
- Dahmani S, Rouelle D, Gressens P, Mantz J. The effects of lidocaine and bupivacaine on protein expression of cleaved caspase 3 and tyrosine phosphorylation in the rat hippocampal slice. Anesth Analg. 2007;104:119–123. doi: 10.1213/01.ane.0000249048.56863.08. [DOI] [PubMed] [Google Scholar]
- David Y, Cacheaux LP, Ivens S, Lapilover E, Heinemann U, Kaufer D, Friedman A. Astrocytic dysfunction in epileptogenesis: consequence of altered potassium and glutamate homeostasis? J Neurosci. 2009;29:10588–10599. doi: 10.1523/JNEUROSCI.2323-09.2009. [DOI] [PMC free article] [PubMed] [Google Scholar]
- de Bock F, Derijard B, Dornand J, Bockaert J, Rondouin G. The neuronal death induced by endotoxic shock but not that induced by excitatory amino acids requires TNF-alpha. Eur J Neurosci. 1998;10:3107–3114. doi: 10.1046/j.1460-9568.1998.00317.x. [DOI] [PubMed] [Google Scholar]
- de Paz P, Barrio JP. Stereological parameters from the analysis of the cell micrographs either by manual point-counting methods or by using a semi-automatic system: a BASIC program for ZX-Spectrum personal computer. Comput Biol Med. 1985;15:153–158. doi: 10.1016/0010-4825(85)90028-9. [DOI] [PubMed] [Google Scholar]
- Dougher M, Terman BI. Autophosphorylation of KDR in the kinase domain is required for maximal VEGF-stimulated kinase activity and receptor internalization. Oncogene. 1999;18:1619–1627. doi: 10.1038/sj.onc.1202478. [DOI] [PubMed] [Google Scholar]
- Eid T, Brines ML, Cerami A, Spencer DD, Kim JH, Schweitzer JS, Ottersen OP, de Lanerolle NC. Increased expression of erythropoietin receptor on blood vessels in the human epileptogenic hippocampus with sclerosis. J Neuropathol Exp Neurol. 2004;63:73–83. doi: 10.1093/jnen/63.1.73. [DOI] [PubMed] [Google Scholar]
- Eid T, Lee TS, Thomas MJ, Amiry-Moghaddam M, Bjørnsen LP, Spencer DD, Agre P, Ottersen OP, de Lanerolle NC. Loss of perivascular aquaporin 4 may underlie deficient water and K+ homeostasis in the human epileptogenic hippocampus. Proc Natl Acad Sci U S A. 2005;102:1193–1198. doi: 10.1073/pnas.0409308102. [DOI] [PMC free article] [PubMed] [Google Scholar]
- Fabene PF, Navarro Mora G, Martinello M, Rossi B, Merigo F, Ottoboni L, Bach S, Angiari S, Benati D, Chakir A, Zanetti L, Schio F, Osculati A, Marzola P, Nicolato E, Homeister JW, Xia L, Lowe JB, McEver RP, Osculati F, et al. A role for leukocyte-endothelial adhesion mechanisms in epilepsy. Nat Med. 2008;14:1377–1383. doi: 10.1038/nm.1878. [DOI] [PMC free article] [PubMed] [Google Scholar]
- Fanning AS, Anderson JM. Zonula occludens-1 and -2 are cytosolic scaffolds that regulate the assembly of cellular junctions. Ann N Y Acad Sci. 2009;1165:113–120. doi: 10.1111/j.1749-6632.2009.04440.x. [DOI] [PMC free article] [PubMed] [Google Scholar]
- Feng Z, Zhang W, Hudson P, Bing G, Feng W, Hong JS. Characterization of the long-lasting activator protein-1 complex induced by kainic acid treatment. Brain Res. 1997;770:53–59. doi: 10.1016/s0006-8993(97)00744-0. [DOI] [PubMed] [Google Scholar]
- Feng Z, Chang RC, Bing G, Hudson P, Tiao N, Jin L, Hong JS. Long-term increase of Sp-1 transcription factors in the hippocampus after kainic acid treatment. Brain Res Mol Brain Res. 1999;69:144–148. doi: 10.1016/s0169-328x(99)00099-6. [DOI] [PubMed] [Google Scholar]
- Gavard J, Gutkind JS. VEGF controls endothelial-cell permeability by promoting the beta-arrestin-dependent endocytosis of VE-cadherin. Nat Cell Biol. 2006;8:1223–1234. doi: 10.1038/ncb1486. [DOI] [PubMed] [Google Scholar]
- Gerber HP, Condorelli F, Park J, Ferrara N. Differential transcriptional regulation of the two vascular endothelial growth factor receptor genes. Flt-1, but not Flk-1/KDR, is up-regulated by hypoxia. J Biol Chem. 1997;272:23659–23667. doi: 10.1074/jbc.272.38.23659. [DOI] [PubMed] [Google Scholar]
- Ghosh C, Gonzalez-Martinez J, Hossain M, Cucullo L, Fazio V, Janigro D, Marchi N. Pattern of P450 expression at the human blood-brain barrier: roles of epileptic condition and laminar flow. Epilepsia. 2010;51:1408–1417. doi: 10.1111/j.1528-1167.2009.02428.x. [DOI] [PMC free article] [PubMed] [Google Scholar]
- Harhaj NS, Antonetti DA. Regulation of tight junctions and loss of barrier function in pathophysiology. Int J Biochem Cell Biol. 2004;36:1206–1237. doi: 10.1016/j.biocel.2003.08.007. [DOI] [PubMed] [Google Scholar]
- Holmes K, Roberts OL, Thomas AM, Cross MJ. Vascular endothelial growth factor receptor-2: structure, function, intracellular signalling and therapeutic inhibition. Cell Signal. 2007;19:2003–2012. doi: 10.1016/j.cellsig.2007.05.013. [DOI] [PubMed] [Google Scholar]
- Horowitz A, Simons M. Branching morphogenesis. Circ Res. 2008;103:784–795. doi: 10.1161/CIRCRESAHA.108.181818. [DOI] [PubMed] [Google Scholar]
- Ivens S, Kaufer D, Flores LP, Bechmann I, Zumsteg D, Tomkins O, Seiffert E, Heinemann U, Friedman A. TGF-beta receptor-mediated albumin uptake into astrocytes is involved in neocortical epileptogenesis. Brain. 2007;130:535–547. doi: 10.1093/brain/awl317. [DOI] [PubMed] [Google Scholar]
- Khirug S, Ahmad F, Puskarjov M, Afzalov R, Kaila K, Blaesse P. A single seizure episode leads to rapid functional activation of KCC2 in the neonatal rat hippocampus. J Neurosci. 2010;30:12028–12035. doi: 10.1523/JNEUROSCI.3154-10.2010. [DOI] [PMC free article] [PubMed] [Google Scholar]
- Koh JY, Choi DW. Quantitative determination of glutamate mediated cortical neuronal injury in cell culture by lactate dehydrogenase efflux assay. J Neurosci Methods. 1987;20:83–90. doi: 10.1016/0165-0270(87)90041-0. [DOI] [PubMed] [Google Scholar]
- Kowanetz M, Ferrara N. Vascular endothelial growth factor signaling pathways: therapeutic perspective. Clin Cancer Res. 2006;12:5018–5022. doi: 10.1158/1078-0432.CCR-06-1520. [DOI] [PubMed] [Google Scholar]
- Lampugnani MG, Orsenigo F, Gagliani MC, Tacchetti C, Dejana E. Vascular endothelial cadherin controls VEGFR-2 internalization and signaling from intracellular compartments. J Cell Biol. 2006;174:593–604. doi: 10.1083/jcb.200602080. [DOI] [PMC free article] [PubMed] [Google Scholar]
- Lee SH, Chun W, Kong PJ, Han JA, Cho BP, Kwon OY, Lee HJ, Kim SS. Sustained activation of Akt by melatonin contributes to the protection against kainic acid-induced neuronal death in hippocampus. J Pineal Res. 2006;40:79–85. doi: 10.1111/j.1600-079X.2005.00283.x. [DOI] [PubMed] [Google Scholar]
- Marcon J, Gagliardi B, Balosso S, Maroso M, Noé F, Morin M, Lerner-Natoli M, Vezzani A, Ravizza T. Age-dependent vascular changes induced by status epilepticus in rat forebrain: implications for epileptogenesis. Neurobiol Dis. 2009;34:121–132. doi: 10.1016/j.nbd.2008.12.018. [DOI] [PubMed] [Google Scholar]
- McCloskey DP, Croll SD, Scharfman HE. Depression of synaptic transmission by vascular endothelial growth factor in adult rat hippocampus and evidence for increased efficacy after chronic seizures. J Neurosci. 2005;25:8889–8897. doi: 10.1523/JNEUROSCI.2577-05.2005. [DOI] [PMC free article] [PubMed] [Google Scholar]
- Meissner M, Michailidou D, Stein M, Hrgovic I, Kaufmann R, Gille J. Inhibition of Rac1 GTPase down-regulates vascular endothelial growth factor receptor-2 expression by suppressing Sp1-dependent DNA binding in human endothelial cells. Exp Dermatol. 2009;18:863–869. doi: 10.1111/j.1600-0625.2009.00867.x. [DOI] [PubMed] [Google Scholar]
- Moser KV, Schmidt-Kastner R, Hinterhuber H, Humpel C. Brain capillaries and cholinergic neurons persist in organotypic brain slices in the absence of blood flow. Eur J Neurosci. 2003;18:85–94. doi: 10.1046/j.1460-9568.2003.02728.x. [DOI] [PubMed] [Google Scholar]
- Ndode-Ekane XE, Hayward N, Gröhn O, Pitkänen A. Vascular changes in epilepsy: functional consequences and association with network plasticity in pilocarpine-induced experimental epilepsy. Neuroscience. 2010;166:312–332. doi: 10.1016/j.neuroscience.2009.12.002. [DOI] [PubMed] [Google Scholar]
- Newton SS, Girgenti MJ, Collier EF, Duman RS. Electroconvulsive seizure increases adult hippocampal angiogenesis in rats. Eur J Neurosci. 2006;24:819–828. doi: 10.1111/j.1460-9568.2006.04958.x. [DOI] [PubMed] [Google Scholar]
- Nicoletti JN, Shah SK, McCloskey DP, Goodman JH, Elkady A, Atassi H, Hylton D, Rudge JS, Scharfman HE, Croll SD. Vascular endothelial growth factor is up-regulated after status epilepticus and protects against seizure-induced neuronal loss in hippocampus. Neuroscience. 2008;151:232–241. doi: 10.1061/j.neuroscience.2007.09.083. [DOI] [PMC free article] [PubMed] [Google Scholar]
- Petreaca ML, Yao M, Liu Y, Defea K, Martins-Green M. Transactivation of vascular endothelial growth factor receptor-2 by interleukin-8 (IL-8/CXCL8) is required for IL-8/CXCL8-induced endothelial permeability. Mol Biol Cell. 2007;18:5014–5023. doi: 10.1091/mbc.E07-01-0004. [DOI] [PMC free article] [PubMed] [Google Scholar]
- Pitkänen A, Sutula TP. Is epilepsy a progressive disorder? Prospects for new therapeutic approaches in temporal-lobe epilepsy. Lancet Neurol. 2002;1:173–181. doi: 10.1016/s1474-4422(02)00073-x. [DOI] [PubMed] [Google Scholar]
- Proia P, Schiera G, Mineo M, Ingrassia AM, Santoro G, Savettieri G, Di Liegro I. Astrocytes shed extracellular vesicles that contain fibroblast growth factor-2 and vascular endothelial growth factor. Int J Mol Med. 2008;21:63–67. [PubMed] [Google Scholar]
- Ramsey MM, Adams MM, Ariwodola OJ, Sonntag WE, Weiner JL. Functional characterization of des-IGF-1 action at excitatory synapses in the CA1 region of rat hippocampus. J Neurophysiol. 2005;94:247–254. doi: 10.1152/jn.00768.2004. [DOI] [PubMed] [Google Scholar]
- Ravizza T, Gagliardi B, Noé F, Boer K, Aronica E, Vezzani A. Innate and adaptive immunity during epileptogenesis and spontaneous seizures: evidence from experimental models and human temporal lobe epilepsy. Neurobiol Dis. 2008;29:142–160. doi: 10.1016/j.nbd.2007.08.012. [DOI] [PubMed] [Google Scholar]
- Rigau V, Morin M, Rousset MC, de Bock F, Lebrun A, Coubes P, Picot MC, Baldy-Moulinier M, Bockaert J, Crespel A, Lerner-Natoli M. Angiogenesis is associated with blood-brain barrier permeability in temporal lobe epilepsy. Brain. 2007;130:1942–1956. doi: 10.1093/brain/awm118. [DOI] [PubMed] [Google Scholar]
- Sandoval KE, Witt KA. Blood-brain barrier tight junction permeability and ischemic stroke. Neurobiol Dis. 2008;32:200–219. doi: 10.1016/j.nbd.2008.08.005. [DOI] [PubMed] [Google Scholar]
- Schiera G, Proia P, Alberti C, Mineo M, Savettieri G, Di Liegro I. Neurons produce FGF2 and VEGF and secrete them at least in part by shedding extracellular vesicles. J Cell Mol Med. 2007;11:1384–1394. doi: 10.1111/j.1582-4934.2007.00100.x. [DOI] [PMC free article] [PubMed] [Google Scholar]
- Scholz W. The contribution of patho-anatomical research to the problem of epilepsy. Epilepsia. 1959;1:36–55. [Google Scholar]
- Seiffert E, Dreier JP, Ivens S, Bechmann I, Tomkins O, Heinemann U, Friedman A. Lasting blood–brain barrier disruption induces epileptic focus in the rat somatosensory cortex. J Neurosci. 2004;24:7829–7836. doi: 10.1523/JNEUROSCI.1751-04.2004. [DOI] [PMC free article] [PubMed] [Google Scholar]
- Selvatici R, Marino S, Piubello C, Rodi D, Beani L, Gandini E, Siniscalchi A. Protein kinase C activity, translocation, and selective isoform subcellular redistribution in the rat cerebral cortex after in vitro ischemia. J Neurosci Res. 2003;71:64–71. doi: 10.1002/jnr.10464. [DOI] [PubMed] [Google Scholar]
- Sheikpranbabu S, Kalishwaralal K, Venkataraman D, Eom SH, Park J, Gurunathan S. Silver nanoparticles inhibit VEGF-and IL-1beta-induced vascular permeability via Src dependent pathway in porcine retinal endothelial cells. J Nanobiotechnology. 2009;7:8. doi: 10.1186/1477-3155-7-8. [DOI] [PMC free article] [PubMed] [Google Scholar]
- Spielmeyer W. Die Pathogenese des epileptisches Krampfes, histopathologischer Teil. Ztschr Neurol Psychiatr. 1927;109:501–519. [Google Scholar]
- Stoppini L, Buchs PA, Muller D. A simple method for organotypic cultures of nervous tissue. J Neurosci Methods. 1991;37:173–182. doi: 10.1016/0165-0270(91)90128-m. [DOI] [PubMed] [Google Scholar]
- Takenaga Y, Takagi N, Murotomi K, Tanonaka K, Takeo S. Inhibition of Src activity decreases tyrosine phosphorylation of occludin in brain capillaries and attenuates increase in permeability of the blood-brain barrier after transient focal cerebral ischemia. J Cereb Blood Flow Metab. 2009;29:1099–1108. doi: 10.1038/jcbfm.2009.30. [DOI] [PubMed] [Google Scholar]
- Tomkins O, Friedman O, Ivens S, Reiffurth C, Major S, Dreier JP, Heinemann U, Friedman A. Blood-brain barrier disruption results in delayed functional and structural alterations in the rat neocortex. Neurobiol Dis. 2007;25:367–377. doi: 10.1016/j.nbd.2006.10.006. [DOI] [PubMed] [Google Scholar]
- van Vliet EA, da Costa Araújo S, Redeker S, van Schaik R, Aronica E, Gorter JA. Blood-brain barrier leakage may lead to progression of temporal lobe epilepsy. Brain. 2007;130:521–534. doi: 10.1093/brain/awl318. [DOI] [PubMed] [Google Scholar]
- Vezzani A, Balosso S, Ravizza T. The role of cytokines in the pathophysiology of epilepsy. Brain Behav Immun. 2008;22:797–803. doi: 10.1016/j.bbi.2008.03.009. [DOI] [PubMed] [Google Scholar]
- Zhang Z, Chopp M. Vascular endothelial growth factor and angiopoietins in focal cerebral ischemia. Trends Cardiovasc Med. 2002;12:62–66. doi: 10.1016/s1050-1738(01)00149-9. [DOI] [PubMed] [Google Scholar]
- Zlokovic BV. The blood-brain barrier in health and chronic neurodegenerative disorders. Neuron. 2008;57:178–201. doi: 10.1016/j.neuron.2008.01.003. [DOI] [PubMed] [Google Scholar]