

Abstract
In the olfactory bulb (OB), loss of preexisting granule cells (GCs) and incorporation of adult-born new GCs continues throughout life. GCs consist of distinct subsets. Here, we examined whether the loss and incorporation of GC subsets are coordinated in the OB. We classified GCs into mGluR2-expressing and -negative subsets and selectively ablated mGluR2-expressing GCs in a local area of the OB with immunotoxin-mediated cell ablation method. The density of mGluR2-expressing GCs showed considerable recovery within several weeks after the ablation. During recovery, an mGluR2-expressing new GC subset was preferentially incorporated over an mGluR2-negative new GC subset in the area of ablation, whereas the preferential incorporation was not observed in the intact area. The area-specific preferential incorporation of mGluR2-expressing new GCs occurred for BrdU analog- and retrovirus-labeled adult-born cells as well as for neonate-derived transplanted cells. The mGluR2-expressing new GCs in the ablated area were synaptically incorporated into the local bulbar circuit. The spine size of mGluR2-expressing new GCs in the ablated area was larger than that of those in the intact area. In contrast, mGluR2-negative new GCs did not show ablated area-specific spine enlargement. These results indicate that local OB areas have a mechanism to coordinate the loss and incorporation of GC subsets by compensatory incorporation of new GC subsets, which involves subset-specific cellular incorporation and subset-specific regulation of spine size.
Introduction
Interneurons in the neocortex and hippocampus have been classified into distinct subsets (Markram et al., 2004; Somogyi and Klausberger, 2005), which coordinately work to ensure function of the neuronal circuit (Tamás et al., 1997; Pouille and Scanziani, 2004). Loss of a specific subset of interneurons can lead to dysfunction of the circuit (Cobos et al., 2005). Granule cells (GCs) in the olfactory bulb (OB) consist of distinct subsets with distinct molecular expression and dendritic morphology (Mori et al., 1983; Naritsuka et al., 2009). Although function of individual GC subsets is not well understood, various subsets appear to cooperate to ensure function of the OB circuit.
Bulbar GCs are continually generated in the subventricular zone (SVZ) and incorporated into preexisting neuronal circuits throughout life (Alvarez-Buylla and Garcia-Verdugo, 2002; Lledo et al., 2006). Adult-born GCs also give rise to various subsets (Bagley et al., 2007; Kelsch et al., 2007; Batista-Brito et al., 2008; Lledo et al., 2008). At the same time, neonate-born preexisting GCs are substantially lost during adulthood, and adult-born new GCs represent a significant proportion of total GCs in the adult OB (Ninkovic et al., 2007; Imayoshi et al., 2008). Although proportion of various GC subsets among total GCs has been reported (Parrish-Aungst et al., 2007), it is not known whether and how the proportion of GC subsets is maintained during the GC turnover. We hypothesized that the incorporation of adult-born GC subsets may be coordinated with the loss of preexisting GC subsets. Interestingly, the loss of preexisting GCs occurs even in the absence of new GCs (Imayoshi et al., 2008), raising the possibility that new GCs are incorporated, at least partly, to compensate for the preceding loss of preexisting GCs and that such compensation occurs in a GC subset-specific manner to maintain the proportion of GC subsets. Although intrinsic property of SVZ progenitors crucially influences the proportion of new GC subsets (Bagley et al., 2007; Kelsch et al., 2007; Batista-Brito et al., 2008; Lledo et al., 2008), the proportion might also be regulated in local OB areas, thereby ensuring the structure and function of local bulbar circuits.
In this study, we asked the question of whether loss of a specific subset of preexisting GCs in a restricted area of the OB results in preferential incorporation of the subset of new GCs in the restricted area. We classified GCs into mGluR2-expressing and -negative subsets (Ohishi et al., 1993; Ohishi et al., 1998). Because both subsets were comparably large (approximately one-third and two-thirds of total GCs, respectively), we were able to compare the amount of loss and incorporation between them. Using immunotoxin-mediated cell ablation method (Batra et al., 1990; Kobayashi et al., 1995; Watanabe et al., 1998), we successfully ablated mGluR2-expressing preexisting GCs in a restricted area of the OB. After the ablation, mGluR2-expressing new GCs were preferentially incorporated over mGluR2-negative new GCs in the ablated area. In addition, spine size of new GCs was larger for the mGluR2-expressing subset in the ablated area than for the mGluR2-negative subset.
Materials and Methods
Animals.
We used the transgenic mouse line of C57BL/6 genetic background in which human interleukin 2 receptor α (hIL2Rα)–GFP was expressed under the mGluR2 promoter (Watanabe et al., 1998), the transgenic mouse line of C57BL/6 genetic background in which DsRed2 was expressed under the CAG promoter, and wild-type C57BL/6 mice (Japan SLC). All experiments were approved by the Experimental Animal Research Committee of the University of Tokyo.
Stereotaxic injection of immunotoxin.
Immunotoxin was produced as described previously (Batra et al., 1990; Kobayashi et al., 1995). The 8- to 12-week-old male and female transgenic mice and wild-type mice were deeply anesthetized with ketamine (50 mg/kg) 10 min after the pre-anesthesia with medetomidine. Animals were mounted in a stereotaxic apparatus (SR-5N; Narishige). After exposure of the dorsal surface of the OB, a beveled pulled glass micropipette with a 30-μm-diameter tip loaded with immunotoxin (100 ng/μl in PBS) was inserted into the external plexiform layer (EPL) at the point of 350 μm depth from the dorsal surface of the OB. Immunotoxin (0.4 μl) was pressure ejected from the tip of the glass micropipette over 1 min by microprocessor-controlled syringe pump (IC3200; Kd Scientific). Using the bregma as a landmark, an injection coordinate was made as follows: anterior, +4.6 mm; lateral, +1.0 mm. After the injection, the OB was covered with agarose (Nippongene) and polystyrene sheet, and then the mice were recovered from anesthesia.
Administration of bromodeoxyuridine, 5-chloro-2-deoxyuridine, and 5-iodo-2-deoxyuridine.
Bromodeoxyuridine (BrdU) (Nacalai Tesque) was dissolved in PBS (10 mg/ml) and intraperitoneally injected into mice (300 mg/kg) at 8–10 weeks. 5-Chloro-2-deoxyuridine (CldU) (MP Biomedicals) was dissolved in PBS (2.5 mg/ml) and intraperitoneally injected into mice (50 mg/kg) at postnatal days 4, 5, 6, and 7. 5-Iodo-2-deoxyuridine (IdU) (Sigma) was dissolved in a solution containing 0.5% dimethylsulfoxide, 20% propylene glycol, 24.5% distilled water, and 50% PBS with a final concentration of 5 mg/ml and injected intraperitoneally into mice (50 mg/kg) at 6–12 d after the immunotoxin/PBS injection.
Retroviral labeling of new GCs.
Construction of DNmPlum, an expression vector carrying mPlum as a transgene, and establishment of 293gpg/DNmPlum, a 293gpg cell transduced with DNmPlum, were described previously (Suzuki et al., 2002). The 293gpg cell (kindly provided by Dr. R. C. Mulligan, Massachusetts Institute of Technology, Cambridge, MA) is a producer cell in which vesicular stomatitis virus G pseudotyped retrovirus is generated. The conditioned medium of 293gpg/DNmPlum was collected and centrifuged at 6000 × g and 4°C for 16 h, followed by resuspension of viral vector pellet in PBS. Finally, the viral vector was concentrated 1000-fold and loaded into a beveled pulled glass micropipette with a 50- to 60-μm-diameter tip. The titer of concentrated viral vector was ∼109 cell transducing units/ml for HeLa cells.
Mice received stereotaxic injection of retroviral vector suspension as described previously for the stereotaxic injection of immunotoxin procedure, at 1 week after the immunotoxin/PBS injection. Retroviral vector suspension (0.4 μl) was injected into five spots just anterior to the SVZ (anterior, 0.0 mm; lateral, +1.7 mm from bregma; depth, 1.8, 2.0, 2.2, 2.4, and 2.6 mm from the dorsal surface). The injection rate was 0.4 μl /min.
Cell transplantation.
To harvest the donor cells, mGluR2 promoter hIL2Rα–GFP mice were intercrossed with DsRed2 transgenic mice, and the offspring at P4–P5 were killed. The rostral migratory stream and the SVZ were microdissected in ice-cold Leibovitz's L-15 medium (Invitrogen), trypsinized, mechanically triturated to a single-cell suspension, and filtered with cell strainer with 40 μm nylon mesh (BD Biosciences). Cells were then washed and resuspended in Leibovitz's L-15 medium (1.0 × 10⁵ cells/μl) and loaded into a beveled pulled glass micropipette with a 50- to 60-μm-diameter tip.
Mice received stereotaxic injection of cell suspension as described previously for the stereotaxic injection of immunotoxin procedure, at 1 week after the immunotoxin injection. Cell suspension (0.4 μl) was injected into five spots just anterior to the SVZ (anterior, 0.0 mm; lateral, +1.7 mm from bregma; depth, 1.8, 2.0, 2.2, 2.4, and 2.6 mm from the dorsal surface). The injection rate was 0.4 μl/min.
In situ hybridization.
C-terminal 489 bp of enhanced GFP sequence were obtained by PCR. The PCR products were inserted into pGEM-T easy plasmid vector (Promega). DIG-labeled antisense RNA probe for GFP was produced by T7 RNA polymerase using the linearized plasmid as a template.
Mice were deeply anesthetized by intraperitoneal injection of sodium pentobarbital. They were transcardially perfused with PBS, followed by 4% paraformaldehyde (PFA) in 0.1 m phosphate buffer (PB). Brains were removed from the skull, immersed in 4% PFA in 0.1 m PB for overnight, and then transferred to 30% sucrose in 0.1 m PB. Brains were embedded in the O.C.T. compound (Sakura Finetechnical), frozen at −80°C, and sliced into coronal sections with a thickness of 12 μm by a cryotome.
The sections were postfixed with 4% PFA in 0.1 m PB for 10 min and then digested in 10 mg/ml proteinase K solution for 20 min at 37°C. Hybridization was performed in 50% formamide, 10 mm Tris-HCl, pH 8.0, 1× Denhardt's solution, 10% dextran sulfate, 0.2% SDS, 0.5 m EDTA, 0.5 mg/ml tRNA, and the adequate amount of DIG-labeled antisense RNA probe at 56°C for 12–18 h. After the incubation, the slides were washed in 4× SSC and then treated with RNase solution (20 μg/ml RNaseA, 0.5 m NaCl, and 10 mm Tris-HCl, pH 8.0) for 30 min at 37°C. The slides were immersed in SSC (final concentration, 0.5× SSC) and TBST (0.1 m Tris-HCl, pH 7.5, 150 mm NaCl, and 0.1% Tween20). The sections were immersed in DIG blocking buffer (2% BMP, 0.1% Tween 20, 10% normal goat serum in 100 mm Tris-HCl, pH 7.5, and 150 mm NaCl) for 1 h, alkaline phosphate-conjugated anti-DIG antibody solution for 3 h, and then color developed for 3 h at room temperature. The slides were coverslipped with Perma Fluor (Immunotech). For counterstaining, the sections were immersed in 0.01% methyl green for 30 s and then coverslipped.
Immunohistochemistry.
Mice were transcardially perfused, and brain samples were prepared as described previously for the in situ hybridization procedure. Brain samples embedded in O.C.T. compound were sliced into coronal sections with a thickness of 12, 20, or 50 μm serially by a cryotome.
Primary antibodies used were as follows: mouse monoclonal anti-mGluR2 antibody (1:200; ab15672; Abcam), rat monoclonal anti-GFP antibody (1:1000; 04404-84; Nakarai Tesque), rabbit polyclonal anti-GFP antibody (1:1000; catalog #598; MBL International), rabbit polyclonal anti-glutamate decarboxylase 67 (GAD67) antibody (1:1000; AB108; Millipore Bioscience Research Reagents), rabbit polyclonal anti-single-strand DNA (ssDNA) antibody (1:500; catalog #18731; IBL), mouse monoclonal anti-NeuN antibody (1:400; MAB377; Millipore), goat polyclonal anti-doublecortin (DCX) antibody (1:100; sc-8066; Santa Cruz Biotechnology), rat monoclonal anti-BrdU antibody (1:250; OBT0030; AbD Serotec), mouse monoclonal anti-BrdU antibody (1:50; catalog #347580; BD Biosciences), rabbit polyclonal anti-DsRed antibody (1:200 for staining mPlum and 1:500 for staining DsRed2; catalog #632496; Clontech), mouse monoclonal anti-synaptophysin antibody (1:200; MAB5258; Millipore), mouse monoclonal anti-GAD65 antibody (1:1000; MAB351; Millipore), guinea pig polyclonal anti-VGLUT1 antibody (1:500; AB5905; Millipore), rabbit polyclonal anti-calretinin antibody (1:1000; AB5054; Millipore), rabbit polyclonal anti-PGP9.5 antibody (1:250; RA95101; UltraClone Limited), and rabbit polyclonal anti-5T4 antibody (1:500) (Imamura et al., 2006).
Secondary antibodies used were Alexa Fluor 488-, 546-, or 647-conjugated goat anti-rabbit, anti-rat, anti-mouse, or anti-guinea pig IgG antibodies (1:300; Invitrogen) and Alexa Fluor 488- or 546-conjugated donkey anti-rat or anti-goat IgG antibodies (1:300; Invitrogen).
For staining of 12 and 20 μm sections, sections were preincubated with Tris-buffered saline containing 0.2% Triton-X (TBST) and then incubated with blocking buffer (TBST containing 10% of normal goat serum or 10% of fetal calf serum) for 30 min. Primary antibodies were diluted with blocking buffer and applied to the sections for overnight. After rinses with TBST, secondary antibodies were diluted with blocking buffer and applied to the sections for >1 h. Sections were rinsed with TBST. Then sections were rinsed with PBS and incubated with 4′,6-diamidino-2-phenylindole dihydrochloride (DAPI) (2 μg/ml in PBS; Nacalai Tesque) for 5 min. Sections were washed by PBS and coverslipped with Prolong Gold Antifade Reagent (Invitrogen). For staining of 50 μm sections, PBS containing 0.5% Triton-X (PBST) was used for washing buffer and PBST with 5% normal goat serum or 5% fetal calf serum for blocking buffer.
For detection of BrdU, CldU, and IdU, cryosections were denatured in 0.025N HCl at 65°C for 30 min and subjected to immunostaining. Rat monoclonal anti-BrdU antibody (clone BU1/75) was used for BrdU and CldU detection, and mouse monoclonal anti-BrdU antibody (clone B44) was used for IdU detection. For the double immunostaining of CldU and IdU, sections were washed with high-salt solution containing 0.5 m NaCl, 50 mm Tris-HCl, pH 8.0, and 1% Tween 20 to reduce the cross-reactivity of the antibodies (Darzynkiewicz et al., 1994).
TUNEL assay.
PFA-fixed brain samples were cryosectioned to 12 μm thickness as described previously for the in situ hybridization procedure. The samples were postfixed with ethanol/acetate (2:1) for 5 min at −30°C and subject to TUNEL assay (MEBSTAIN apoptosis kit II; MBL International) according to the instructions of the manufacturer.
Image acquisition and analysis.
Sections were examined by bright-field microscopy (BX51; Olympus), fluorescent microscopy (DM6000B; Leica), and confocal laser scanning microscopy (TCS SP5; Leica). Whole images of OB coronal sections and SVZ coronal sections were taken by bright-field and fluorescent microscopy under a 10× objective lens with MetaMorph (Molecular Devices). Double positivity and apposition of immunoreactivity were examined by confocal laser scanning microscopy under a 20×, 40×, or oil-immersion 63× objective lens with LAS AF software (Leica). Those GCs that had GFP immunoreactivity on the plasma membrane of soma in all x–y planes throughout z confocal images examined were classified into a GFP-positive subset. The number of cells and the area of regions of interest were counted and measured with MetaMorph, and the density of cells was determined. We used Photoshop (Adobe Systems) for plotting and delineation.
Images of mPlum-expressing adult-born GCs and DsRed2-expressing transplanted cells were taken by confocal laser scanning microscopy under an oil-immersion 63× objective lens with a pixel size of 0.06 × 0.06 μm or 0.03 × 0.03 μm and a z-step of 0.5 μm. After the classification of the cells into a GFP-positive or -negative subset, its whole image within the OB coronal section was taken. An unbranched portion of an apical dendrite within the granule cell layer (GCL) from the soma was defined as a proximal dendrite. The length of proximal dendrites analyzed ranged from 11 to 117 μm from the soma. Among dendritic and somatic protrusions of the cells, those with an obvious head and neck structure were classified as headed spines. The spine size of headed spines was measured in the x–y plane of z-stacked confocal images using MetaMorph.
Definition of injected area and non-injected area.
In all experiments, we applied the same definition of the injected and non-injected area to the images of the OB coronal sections to exclude arbitrariness. Images of the whole OB coronal section that covered the immunotoxin-injected site were obtained using fluorescent microscopy. For the analysis of the PBS-treated animals, we chose the coronal sections corresponding to the same rostrocaudal level as those of immunotoxin-injected OBs showing ablation of GFP-positive GCs. The mitral cell layer (MCL) and core were outlined with a circular line, and the lines were respectively divided into 20 sections of equal length using the most ventral point of the coronal section as the start point. Based on the sectioned lines, images of the OB coronal section were divided into 20 regions in a columnar manner (see Fig. 2C). Each columnar region was serially numbered, starting from the medial column of the most ventral region and ending in the lateral column of the most ventral region. The injected and non-injected areas were determined based on the decrease in density of CldU-labeled cells at 2 weeks after immunotoxin/PBS injection, when the loss of preexisting GCs was remarkable. The density of CldU-labeled cells in MCL, internal plexiform layer (IPL), and GCL was measured and compared between immunotoxin-injected OB and PBS-injected OB in each region. The regions showing a significant decrease (p < 0.01) in the density of CldU-labeled cells by immunotoxin compared with PBS-injected OB were #10–12 (see Fig. 2D). The #10–12 regions were therefore defined as the injected area and those of #1–8 and #14–20 as the non-injected area. Regions #9 and #13 were excluded from the analysis. This area definition was applied to OB coronal sections at different time points after immunotoxin/PBS injection, with validity confirmed by the density of CldU-labeled cells in each area.
Figure 2.
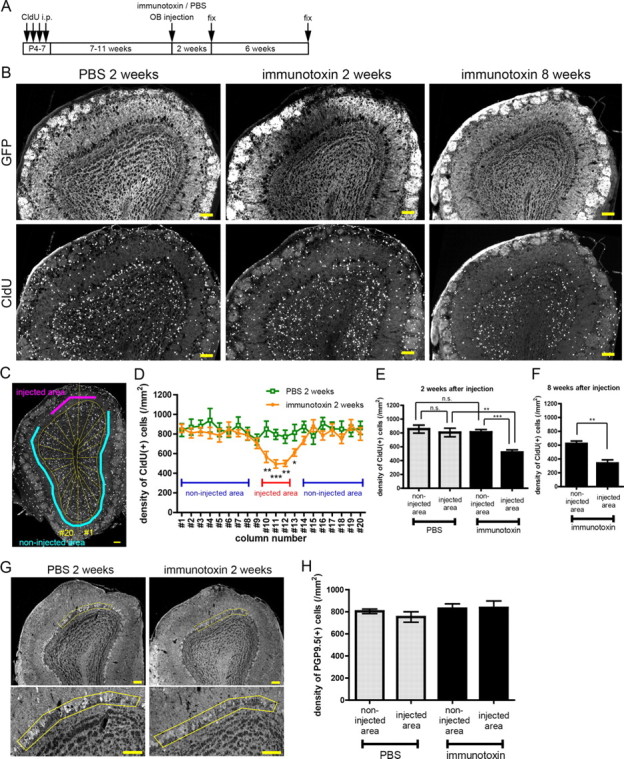
Area and cell-type specificity of immunotoxin-mediated cell ablation. A, Schedule of CldU labeling of preexisting GCs and immunotoxin or PBS injection in the adult OB. The animals received CldU injection intraperitoneally at P4–P7 and immunotoxin or PBS injection in the local OB area at the age of 8–12 weeks. B, Immunoreactivity for GFP (top) and CldU (bottom) of the OB at 2 weeks after PBS injection (left) or immunotoxin injection (middle) and 8 weeks after immunotoxin injection (right). C, Definition of the injected and non-injected areas in a coronal section of the OB. An image of an OB coronal section was divided into 20 columnar subregions. D, Density of CldU-labeled preexisting GCs in each column at 2 weeks after immunotoxin or PBS injection. Density in the corresponding subregions between immunotoxin- and PBS-injected OB was compared. Columns #10–12 showed a significant decrease (p < 0.01) in density in the immunotoxin-injected OB. n = 9 and 10 mice for PBS or immunotoxin injection, respectively. *p < 0.05; **p < 0.01; ***p < 0.001 (unpaired t test). E, F, Density of CldU-labeled preexisting GCs at 2 weeks after immunotoxin or PBS injection (E) and 8 weeks after immunotoxin injection (F) (n = 9, 10 mice, for PBS and immunotoxin, respectively in E; n = 6 mice in F). **p < 0.01; ***p < 0.001; n.s., not significant (one-way ANOVA with post hoc Tukey's test in E, unpaired t test in F). G, Distribution of PGP9.5-expressing mitral cells in the PBS-injected (left) and immunotoxin-injected (right) OB at 2 weeks after injection. MCL of the injected area is delineated by yellow lines. Bottom panels show magnified views of the delineated regions of the top panels. H, Density of PGP9.5-expressing mitral cells in the injected and non-injected area at 2 weeks after local immunotoxin or PBS injection. No significant difference in density was observed among the four groups. n = 4 mice for individual groups (one-way ANOVA). Data in D–F and H show mean ± SEM. Scale bars: B, C, G, 100 μm.
Statistical analysis.
Data were expressed as mean ± SEM unless otherwise stated. Two-tailed unpaired t test and Kolmogorov–Smirnov test was used for groups of two. One-way ANOVA with post hoc Tukey's test and Kruskal–Wallis test with post hoc Steel–Dwass test was used for multiple comparisons. Statistical significance was set at p = 0.05.
Results
Selective ablation of mGluR2-expressing preexisting GCs in a local area of the OB
To examine whether the local loss of a given subset of GCs locally regulates the subsequent incorporation of the subset of new GCs into the OB area, we planned to selectively and locally ablate an mGluR2-expressing subset of GCs using immunotoxin-mediated cell ablation method. Immunotoxin is a fusion protein of anti-hIL2Rα antibody and Pseudomonas exotoxin (Fig. 1A), which is specifically incorporated into hIL2Rα-expressing cells and induces their cell death (Fig. 1A) (Batra et al., 1990; Kobayashi et al., 1995).
Figure 1.

Immunotoxin-mediated ablation of mGluR2-expressing GCs in a local OB area. A, Schema of immunotoxin-mediated ablation of mGluR2-expressing cells. The transgenic mice express the hIL2Rα–GFP fusion protein under the mGluR2 promoter. Immunotoxin binds only to hIL2Rα–GFP-expressing cells and induces their cell death. B, Coexpression of mGluR2 and GFP in GCs of the transgenic mouse OB. Among GAD67-expressing GCs (blue), most mGluR2-expressing cells (red) were GFP positive (green) (arrow), and most mGluR2-negative cells were GFP negative (arrowhead). C, Percentage of GFP-positive GCs among NeuN-expressing GCs in the adult transgenic mouse OB. There was no significant difference in percentage among 2-, 3-, 4-, 7-, and 10-month-old mice (n = 3 mice in each group, one-way ANOVA). D, Distribution of GFP mRNA-expressing cells in the transgenic mice OB. GL, Glomerular layer. E, F, Local immunotoxin injection induced the local loss of GFP mRNA-expressing cells (E) and GFP immunoreactivity (F) in the injected area at 2 weeks after injection. Immunotoxin was injected in the dorsal OB area. Arrowheads show the affected areas. Pictures in E and F are from adjacent sections of the same OB. G, Time course of the loss and recovery of GFP immunoreactivity in the immunotoxin-injected area of the OB before injection and at 1, 2, 3, 4, and 8 weeks after injection. Arrowheads show the affected areas. H, Immunoreactivity for ssDNA (top; green, ssDNA; blue, DAPI) and TUNEL assay (bottom) in the immunotoxin-injected area before injection and at 1, 2, and 3 weeks after injection. Data in C show mean ± SD. Scale bars: B, 10 μm; D–H, 100 μm.
We used transgenic mice that express hIL2Rα–GFP fusion protein under an mGluR2 promoter (Fig. 1A) (Watanabe et al., 1998). In situ hybridization study of the transgenic mouse OB revealed that a subpopulation of GCs and periglomerular cells expressed the transgene (Fig. 1D). GCs expressing the transgene were mainly distributed in the MCL and the superficial portion of the GCL. Immunohistochemical detection of the fusion protein using anti-GFP antibody showed that it colocalized with immunoreactivity for endogenous mGluR2 (Fig. 1B). In fact, among GAD67-expressing GABAergic cells in the MCL, IPL and GCL, 97.0% of the mGluR2-expressing cells expressed GFP (GFP-positive GCs/mGluR2-expressing GCs; 124 of 126, 137 of 142, and 120 of 125 in each of three animals), and mGluR2 expression was detected in 94.6% of the GFP-positive cells (mGluR2-expressing GCs/GFP-positive GCs; 124 of 131, 137 of 146, and 120 of 126 in each animal). In periglomerular cells, GFP and mGluR2 were expressed in the subpopulation and were well colocalized (data not shown). None of the GFP-positive cells in the MCL expressed a mitral cell marker protein, PGP9.5 (Taniguchi et al., 1993), and no PGP9.5-expressing cells expressed GFP or mGluR2 (data not shown). Thus, GFP-positive cells in the MCL, IPL, and GCL were considered to be mGluR2-expressing GCs.
It has not been well known whether the proportion of GC subsets is maintained during adult period. Thus, we next examined the proportion of GFP-positive GCs among total NeuN-expressing GCs at different ages of the adult transgenic mice. NeuN-expressing GCs in the GCL, IPL, and MCL were classified into GFP-positive and GFP-negative GCs (see Fig. 3B,C). In 2-, 3-, 4-, 7-, and 10-month-old mice, the percentage of GFP-positive GCs among NeuN-expressing GCs was 32.1, 31.5, 30.9, 29.7, and 30.7%, respectively (Fig. 1C). The proportion of GFP-positive GCs was thus maintained at a similar level during the adult period examined, with approximately one-third of GCs being GFP positive and the remaining two-thirds being GFP negative.
Figure 3.
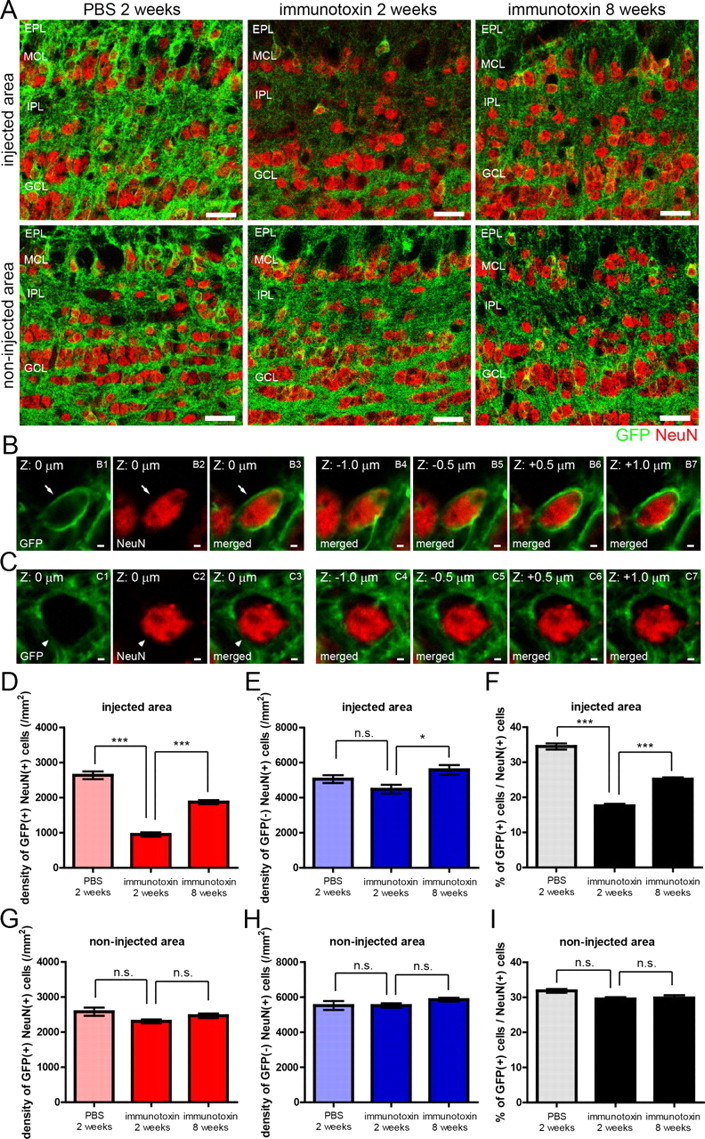
Recovery of mGluR2-expressing GC subset after the ablation of preexisting mGluR2-expressing GCs in a local OB area. A, Confocal images of GFP-positive GCs and GFP-negative GCs in the injected area (top) and non-injected area (bottom) of the OB after immunotoxin or PBS injection. Left, Two weeks after PBS injection; middle, 2 weeks after immunotoxin injection; right, 8 weeks after immunotoxin injection. Green, GFP; red, NeuN. B, C, Confocal images of a GFP-positive NeuN-expressing GC (B) and a GFP-negative NeuN-expressing GC (C). Left three panels show GFP expression (green), NeuN expression (red), and the merged view at a same z-plane (z = 0 μm). Right four panels show the merged views at different z-planes of the same GC (z = −1.0, −0.5, +0.5, and +1.0 μm). D, E, Density of GFP-positive (D) and GFP-negative (E) NeuN-expressing GCs in the injected area at 2 weeks after PBS injection, 2 weeks after immunotoxin injection, and 8 weeks after immunotoxin injection. F, Percentage of GFP-positive GCs among NeuN-expressing GCs in the injected area at 2 weeks after PBS injection, 2 weeks after immunotoxin injection, and 8 weeks after immunotoxin injection. Number of NeuN-expressing cells examined was 319–562 cells per an animal. G, H, Density of GFP-positive (G) and GFP-negative (H) NeuN-expressing GCs in the non-injected area. I, Percentage of GFP-positive GCs among NeuN-expressing GCs in the non-injected area. Number of NeuN-expressing cells examined was 333–535 cells per an animal. n = 4, 5, and 5 mice for 2 weeks after PBS injection, 2 weeks after immunotoxin injection, and 8 weeks after immunotoxin injection, respectively. *p < 0.05; ***p < 0.001; n.s., not significant (one-way ANOVA with post hoc Tukey's test). Data in D–I show mean ± SEM. Scale bars: A, 20 μm; B, C, 5 μm.
To locally ablate GFP-positive mGluR2-expressing GCs, immunotoxin was injected into the EPL in the dorsal region of the OB. At 2 weeks after immunotoxin injection, hybridization signals of hIL2Rα–GFP mRNA and GFP immunoreactivity decreased locally in the injected area (Fig. 1E,F). The decrease in GFP immunoreactivity was prominent in the EPL, MCL, and superficial part of GCL. These results suggest that immunotoxin injection caused the loss of GFP-positive GCs, whose apical dendrites project through the MCL to the EPL. The area with reduced GFP immunoreactivity spanned several hundred micrometers at maximum along the mediolateral and superficial-deep axes and nearly 1 mm along the rostrocaudal axis. No area outside the injected area showed reduced GFP immunoreactivity (data not shown).
Examination of local GFP immunoreactivity at various periods after immunotoxin injection showed that it decreased at 1 week, further decreased at 2 weeks, and then gradually recovered at 3, 4, and 8 weeks (Fig. 1G), suggesting that the loss of preexisting GFP-positive GCs reached maximum at 2 weeks and that the addition of new GFP-positive GCs occurred continuously at later time points. Immunohistochemistry for ssDNA and TUNEL assay confirmed that immunotoxin injection induced cell death in the injected area (Fig. 1H).
Because the local area of cell ablation was estimated by the loss of GFP immunoreactivity, the recovery of GFP-positive GCs at later time points after immunotoxin injection made identification of the ablated area difficult. In place of GFP immunoreactivity, we therefore identified the ablated area by examining the local decrease in labeled preexisting GCs. Neonate-born GCs were labeled by intraperitoneal injection of a DNA analog CldU at P4–P7 (Fig. 2A), and immunotoxin was injected in adulthood. At 2 weeks after immunotoxin injection, the density of CldU-labeled cells decreased in the local area in which GFP immunoreactivity decreased (Fig. 2B, middle column), indicating that the area of reduced GFP immunoreactivity corresponded with that of the loss of preexisting GCs. At 8 weeks after injection, CldU-labeled cell density remained decreased locally, whereas GFP expression showed recovery (Fig. 2B, right column). We therefore delineated the ablated area based on the density of CldU-labeled cells (Fig. 2C,D). In short, the dorsal area that showed a significant decrease in density was defined as the ablated area, and the ventral area that showed no significant change in density was defined as the non-ablated area (see Materials and Methods).
At 2 weeks after immunotoxin injection, the density of CldU-labeled GCs in the ablated area of immunotoxin-injected OB decreased to 61–64% of that in the non-ablated area of immunotoxin-injected OB and the control areas of PBS-injected OB (Fig. 2E). At 8 weeks after injection, the density of CldU-labeled GCs in the ablated area was still low, at 54% of that in the non-ablated area (Fig. 2F), indicating that this method is useful for identifying the ablated area throughout the recovery period. We therefore used this method in all subsequent analyses. In the local area of GC ablation, mitral cells remained intact and showed no decrease in density (Fig. 2G,H), confirming the cell-type specificity of immunotoxin-mediated cell ablation. Local injection of immunotoxin into the dorsal portion of wild-type mouse OB did not induce the loss of mGluR2 immunoreactivity (data not shown).
Recovery of mGluR2-expressing GC population after local ablation of mGluR2-expressing GCs
We examined the degree of loss and recovery of mGluR2-expressing GCs in the ablated area. NeuN-expressing GCs were classified into GFP-positive and GFP-negative subsets (Fig. 3B,C). At 2 weeks after immunotoxin injection, the ablated area showed a marked decrease in the density of GFP-positive cells (Fig. 3A, top row), to only 36% of that in the dorsal area of control PBS-injected OB (PBS-injected area) (Fig. 3D). In striking contrast, the density of GFP-negative GCs showed no decrease in the ablated area (Fig. 3E), indicating that immunotoxin-mediated cell ablation was specific to GFP-positive GCs. At 8 weeks after immunotoxin injection, the density of GFP-positive GCs recovered to 71% of the control (Fig. 3D).
We then examined the change in the percentage of GFP-positive GCs among total GCs (sum of GFP-positive and -negative GCs) (Fig. 3F). Whereas the percentage was 34% in the PBS-injected area, it was 18% in the ablated area at 2 weeks. The percentage recovered to 25% in the ablated area at 8 weeks. These results indicated that ablation of GFP-positive GCs significantly reduced the ratio of GFP-positive GCs to total GCs in the ablated area at 2 weeks, whereas the ratio showed large recovery at 8 weeks as a result of an increase in GFP-positive GCs.
Such loss and recovery of GFP-positive GCs occurred specifically in the ablated area. In the non-ablated (ventral) area of the immunotoxin-injected OB, density of GFP-expressing and GFP-negative GCs showed no significant change at 2 or 8 weeks after immunotoxin injection (Fig. 3A, bottom row, G, H). The percentage of GFP-positive GCs among total GCs also showed no significant change (Fig. 3I).
Enhanced recruitment of adult-born new GCs into the ablated area
We next examined whether the incorporation of adult-born new neurons contributed to the recovery of GFP-positive cells in the ablated area. In the OB, immature new GCs, but not mature GCs, express DCX (Brown et al., 2003). At 2 weeks after local immunotoxin injection, distribution of DCX-expressing neurons was examined immunohistochemically in coronal sections that contained the ablated area (Fig. 4A). Many DCX-expressing neurons with radially directed processes were observed in the GCL, MCL, and EPL of the ablated area (Fig. 4A). The density of these DCX-expressing neurons in the ablated area was 1.5-fold higher than that in the non-ablated area of the immunotoxin-injected OB and the corresponding dorsal area of PBS-injected OB (Fig. 4B). No significant difference in density was observed between the non-ablated area of immunotoxin-injected OB and the corresponding ventral area of PBS-injected OB. The local increase in DCX-expressing cell density was dependent on cell ablation because the density did not increase in the immunotoxin-injected area of wild-type mouse OB (data not shown). These results indicate the enhanced recruitment of adult-born immature neurons in the ablated area compared with the non-ablated areas.
Figure 4.
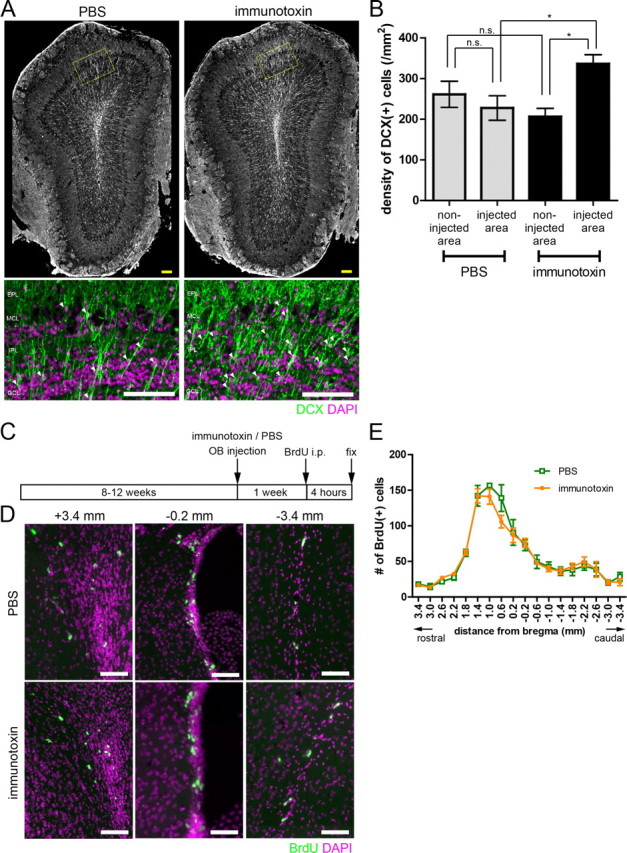
Increased recruitment of immature new neurons to the local OB area of preexisting mGluR2-expressing GC ablation. A, Top panels show distribution of DCX-expressing cells in the PBS-injected (left) or immunotoxin-injected (right) OB at 2 weeks after injection. Bottom panels show magnified views of the delineated regions of the top panels. Green, DCX; magenta, DAPI. Arrowheads indicate somata of DCX-expressing cells. B, Density of DCX-expressing cells in the injected and non-injected OB area at 2 weeks after local immunotoxin or PBS injection. n = 4 and 5 mice for PBS and immunotoxin injection, respectively. *p < 0.05; n.s., not significant (one-way ANOVA with post hoc Tukey's test). C, Schedule for BrdU labeling of proliferating cells in the rostral migratory stream and the SVZ after immunotoxin or PBS injection into the OB. Mice received BrdU injection at 1 week after immunotoxin or PBS injection and fixed at 4 h after BrdU injection. D, BrdU-labeled proliferating cells in the rostral migratory stream (left), rostral SVZ (middle), and caudal SVZ (right). Top panels show PBS-injected animals, and bottom panels show immunotoxin-injected animals. Green, BrdU; magenta, DAPI. E, Number of BrdU-labeled cells in the immunotoxin- or PBS-injected animals. No significant difference in number between immunotoxin- and PBS-injected animals was observed along all the rostrocaudal levels examined (n = 4 mice in each group, unpaired t test). Data in B and E show mean ± SEM. Scale bars: A, 100 μm; D, 50 μm.
We also examined whether local ablation caused enhanced cell proliferation in the SVZ. Newly generated cells were labeled by intraperitoneal injection of BrdU at 7 d after immunotoxin injection, and, at 4 h after labeling, we counted the number of BrdU-labeled cells in the area ranging from the rostral migratory stream to the caudal region of the SVZ (Fig. 4C,D). We found no significant difference in the number of BrdU-labeled cells between immunotoxin-injected mice and PBS-injected mice (Fig. 4E), indicating that cell proliferation was not significantly influenced by the local ablation of GCs in the OB.
GFP-positive adult-born GCs showed preferential incorporation into the ablated area over GFP-negative adult-born GCs
We then addressed the question of which subset of adult-born GCs, namely GFP-positive or -negative GCs, was preferentially incorporated into the ablated area. Because examination of the time course of GFP expression after birth during maturation showed that the percentage of GFP-positive adult-born GCs among all adult-born GCs reached a near-plateau level at days 28–34 (Fig. 5A,B), we examined the density of GFP-positive and -negative adult-born GCs at days 28–34.
Figure 5.
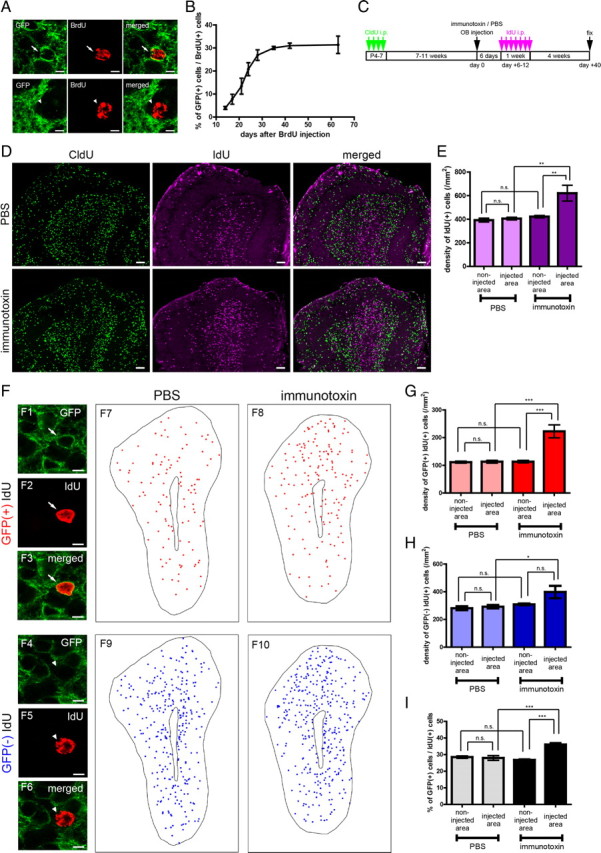
Preferential incorporation of an mGluR2-expressing subset of adult-born GCs in the local area of ablation. A, B, Time course of GFP expression during the maturation of adult-born GCs. A, Confocal images of a GFP-positive (top) and a GFP-negative (bottom) BrdU-labeled new GC at 28 d after BrdU labeling. B, Percentage of GFP-positive cells among BrdU-labeled new GCs at 14, 17, 21, 24, 28, 35, 42, and 63 d after BrdU administration in the intact adult transgenic mice. Number of BrdU-labeled cells examined was 80–243 cells per an animal. n = 3 mice at each time point. C, Schedule of CldU labeling of preexisting GCs, immunotoxin, or PBS injection, IdU labeling of adult-born new GCs, and fixation. D, Distribution of CldU-labeled preexisting GCs (left, green), IdU-labeled new GCs (middle, magenta), and the merged views (right) in OB that received PBS (top) or immunotoxin (bottom) injection. E, Density of IdU-labeled GCs in the injected and non-injected area of OBs that received local immunotoxin or PBS injection. n = 5 mice in each group. **p < 0.01; n.s., not significant (one-way ANOVA with post hoc Tukey's test). F, Distribution of mGluR2-expressing and -negative IdU-labeled new GCs. F1–F6, Confocal images of a GFP-positive IdU-labeled new GC (F1–F3) and a GFP-negative IdU-labeled new GC (F4–F6). F7–F10, Distribution of GFP-positive IdU-labeled GCs (red, F7, F8) and GFP-negative IdU-labeled GCs (blue, F9, F10) in the PBS-injected (F7, F9) or immunotoxin-injected (F8, F10) OBs. The MCL and core are outlined. G, H, Density of GFP-positive (G) and GFP-negative (H) IdU-labeled new GCs in the injected and non-injected area of OBs that received local immunotoxin or PBS injection. I, Percentage of GFP-positive GCs among IdU-labeled GCs in the injected and non-injected area. Number of IdU-labeled cells examined per an animal were 234–296, 70–93, 273–362, and 92–169 cells in the four groups, respectively (columns from left to right). n = 5 mice in each group for G–I. *p < 0.05; ***p < 0.001; n.s., not significant (one-way ANOVA with post hoc Tukey's test). Data in B show mean ± SD. Data in E and G–I show mean ± SEM. Scale bars: A, F1–F6, 5 μm; D, 100 μm.
To determine the ablated area, mice received intraperitoneal CldU injection at P4–P7 to label neonate-born GCs and then in adulthood received local immunotoxin or PBS injection (Fig. 5C). At 6–12 d after the immunotoxin or PBS injection, the mice received intraperitoneal injection of another DNA analog, IdU, to label adult-born GCs and were then analyzed 28 d after the IdU labeling (Fig. 5C). The area with decreased density of CldU-labeled GCs indicated the ablated area (Fig. 5D, left column).
IdU-labeled adult-born GCs were significantly increased in the ablated area in density compared with the non-ablated areas (Fig. 5D,E). The IdU-labeled GCs were classified into GFP-positive and GFP-negative GCs (Fig. 5F). The density of GFP-positive IdU-labeled GCs in the ablated area increased by 2.0-fold on average compared with those in the non-ablated area of immunotoxin-injected OB and PBS-injected OB areas (Fig. 5G). The density of GFP-negative IdU-labeled GCs in the ablated area also increased by 1.3-fold compared with that in the PBS-injected area and showed no significant change compared with those in non-injected areas (Fig. 5H). These results indicate that both GFP-positive and GFP-negative adult-born GCs showed enhanced incorporation into the ablated area and that the increased incorporation of GFP-positive GCs was more prominent than that of GFP-negative GCs. Thus, GFP-positive GCs showed preferential incorporation over GFP-negative GCs into the area in which preexisting GFP-positive GCs were selectively ablated.
To confirm this preferential incorporation of GFP-positive over GFP-negative IdU-labeled GCs in the ablated area, the percentage of GFP-positive GCs among all IdU-labeled GCs was calculated. The percentage in the ablated area of immunotoxin-injected OB was 36%, which was higher than those in the other areas (27–28%) (Fig. 5I). In the non-ablated area of immunotoxin-injected OB, the density of GFP-positive and GFP-negative IdU-labeled GCs showed no difference with those in the PBS-injected OB areas (Fig. 5G,H), confirming that the enhancement of GC incorporation was ablated area specific.
The preferential incorporation of GFP-positive adult-born GCs in the ablated area was also examined using retrovirus-mediated cell labeling (Yamada et al., 2004). Adult-born GCs were labeled by injecting mPlum-expressing retrovirus into the SVZ of immunotoxin- or PBS-injected mice, and mPlum-labeled GCs were observed 4 weeks after the retrovirus injection (Fig. 6A,B). Because labeling efficiency varied among mice (data not shown), the ratio of the density of mPlum-labeled GCs in the injected area to that in the non-injected area was determined in individual OBs. In the immunotoxin-injected OB, ratio of the density of mPlum-labeled GCs was 1.7 on average, whereas that in the PBS-injected area to PBS-non-injected area was 1.2 on average (Fig. 6C). Thus, this retrovirus labeling experiment again showed that a larger number of adult-born GCs were incorporated in the local area in which preexisting GFP-positive GCs were ablated.
Figure 6.

Preferential incorporation and synaptic integration of an mGluR2-expressing subset of retrovirus-labeled adult-born GCs in the local area of ablation. A, Schedule of CldU labeling of preexisting GCs, immunotoxin, or PBS injection, retroviral labeling of adult-born new GCs, and fixation. B, Distribution of mPlum-labeled GCs in the PBS-injected (left) or immunotoxin-injected (right) OBs. C, Ratio of the density of mPlum-labeled new GCs in the injected area over that in the non-injected area. D, E, Confocal images of a GFP-positive mPlum-labeled new GC (D) and a GFP-negative mPlum-labeled new GC (E). F, Ratio of the density of GFP-positive (red) and GFP-negative (blue) mPlum-labeled new GCs in the injected area over that in the non-injected area. G, Percentage of GFP-positive GCs among mPlum-labeled GCs. Number of mPlum-labeled cells examined per an animal were 66–152, 14–52, 68–241, and 42–89 cells in the four groups, respectively (columns from left to right). H, I, Expression of synaptophysin (H, green) and GAD65 (I, green) in EPL spines of GFP-positive mPlum-labeled new GCs (magenta) in the ablated area. J, Apposition to VGLUT1-expressing structures (green) for GCL spines of GFP-positive mPlum-labeled new GCs (magenta) in the ablated area. Top, A spine on proximal dendrite; middle, a spine on soma; bottom, a spine on basal dendrite. The right panels show single optical planes with the z dimension. Bars in C and F and data in G show mean ± SEM (n = 5 and 6 mice, for PBS and immunotoxin, respectively). *p < 0.05; n.s., not significant (unpaired t test for C and F, one-way ANOVA with post hoc Tukey's test for G). Scale bars: B, 100 μm; D, E, 5 μm; H–J, 1 μm.
We then classified mPlum-labeled GCs into GFP-positive and GFP-negative GCs (Fig. 6D,E) and analyzed their density in each area (Fig. 6F). The ratio of density of GFP-positive mPlum-labeled GCs in the ablated to non-ablated area was 2.2 on average, whereas that in the PBS-injected OB was 1.1 on average. In contrast, the ratio of density of GFP-negative mPlum-labeled GCs in the ablated to non-ablated area was 1.3, whereas that of GFP-negative mPlum-labeled GCs in the PBS-injected to PBS non-injected area was 1.2 (Fig. 6F). These observations again indicate the preferential incorporation of GFP-positive adult-born GCs in the ablated area over GFP-negative adult-born GCs. To quantitatively analyze these observations, the percentage of GFP-positive GCs among all mPlum-labeled GCs was calculated. The percentage in the ablated area was 54%, which was significantly higher than those in other areas (41–43%) (Fig. 6G).
Synaptic incorporation of GFP-positive adult-born GCs in the ablated area
Adult-born GCs, as well as preexisting GCs, form spines in the EPL to make dendrodendritic reciprocal synapses with dendrites of mitral cells and tufted cells (Petreanu and Alvarez-Buylla, 2002; Shepherd, 2004; Whitman and Greer, 2007; Kelsch et al., 2008). The spines in the EPL contain the presynaptic structure of a granule-to-mitral/tufted dendrodendritic inhibitory synapse, as well as the postsynaptic structure of a mitral/tufted-to-granule dendrodendritic excitatory synapse. These GCs also form spines on the proximal portion of apical dendrites (proximal dendrites), somata, and basal dendrites in the GCL for the receipt of glutamatergic synaptic inputs. To examine whether GFP-positive adult-born GCs in the ablated area formed spines and were thus synaptically incorporated into the local OB circuit, the spines of GFP-positive mPlum-labeled adult-born GCs were examined. The dendrites of GFP-positive mPlum-labeled GCs bared headed spines in both the EPL (Fig. 6H,I, left panels) and GCL (Fig. 6J, left panels). In the EPL, headed spines of GFP-positive mPlum-labeled GCs expressed synaptophysin, a presynaptic vesicular protein (Südhof and Jahn, 1991; Kelsch et al., 2008) (Fig. 6H), and GAD65, which is expressed in the presynaptic terminals of GABAergic neurons (Esclapez et al., 1994) (Fig. 6I), indicating that the spines of GFP-positive adult-born GCs in the ablated area contained presynaptic structures in the EPL. In the GCL, headed spines of GFP-positive mPlum-labeled GCs were apposed to VGLUT1-expressing structures (Fig. 6J), indicating that the spines in the GCL received contacts from glutamatergic axon terminals (Fremeau et al., 2004; Gabellec et al., 2007). These observations indicated that GFP-positive adult-born GCs in the ablated area were synaptically incorporated into preexisting OB circuits.
GFP-positive new GCs, but not GFP-negative new GCs, showed ablated area-specific enlargement of spines in the GCL
Results so far showed that the local loss of preexisting mGluR2-expressing GCs results in the preferential incorporation of the adult-born new mGluR2-expressing GCs in the local ablated area and that the mGluR2-expressing new GCs were synaptically incorporated in the local area of OB circuit. We then asked whether synapse formation of new GCs also receives subset-specific regulation in the local OB area. To address this point, we compared the morphology of spines of new GCs of different subsets in different OB areas by using transplantation method (Sawamoto et al., 2006; Merkle et al., 2007) as follows, which enabled the detailed examination of spine morphology because of the intense expression of fluorescent protein in the transplanted cells.
Transgenic mice expressing DsRed2 under a ubiquitous promoter were intercrossed with mGluR2 promoter hIL2Rα–GFP transgenic mice (mice used throughout this study), and the offspring were used on neonatal days 4–5. Cells were harvested from the SVZ and transplanted into the SVZ of adult mGluR2 promoter hIL2Rα–GFP transgenic mice after immunotoxin-mediated cell ablation (Fig. 7A). At 28 d after transplantation, a larger amount of DsRed2-expressing GCs accumulated in the ablated area than in the non-ablated area (Fig. 7B). They extended elongated dendrites through the GCL into the EPL. We classified DsRed2-expressing GCs into GFP-positive and GFP-negative GCs (Fig. 7C,D). As was the case for endogenous adult-born GCs, the percentage of GFP-positive GCs among DsRed2-expressing GCs in the ablated area of immunotoxin-injected OB (66%) was significantly higher than that in the non-ablated area (52%) (Fig. 7D), indicating that the preferential incorporation of GFP-positive over GFP-negative GCs in the ablated area also occurred for transplanted cells of neonatal SVZ origin.
Figure 7.
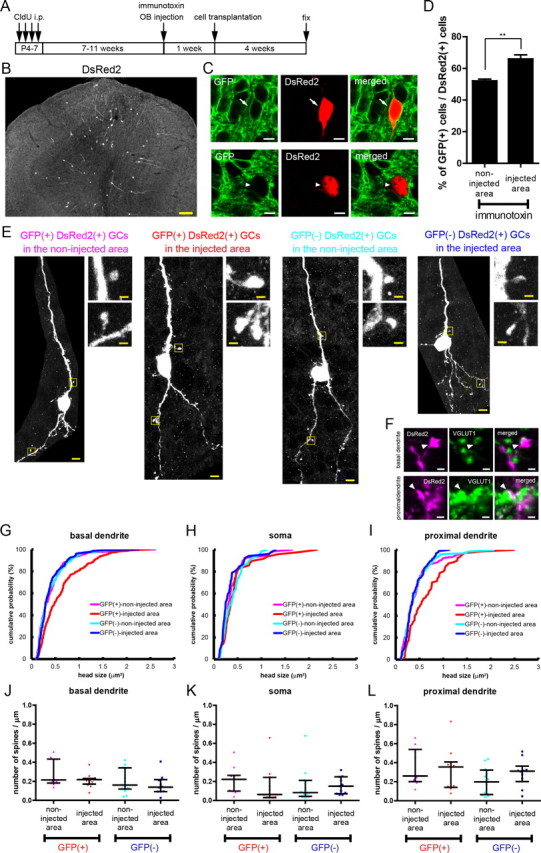
Formation of large-sized spines for an mGluR2-expressing subset of neonate-derived transplanted new GCs in the local area of ablation. A, Schedule of CldU labeling of preexisting GCs, immunotoxin injection, transplantation of neonate-derived progenitors, and fixation. B, Distribution of DsRed2-expressing GCs in the immunotoxin-injected OB. C, Confocal images of a GFP-positive DsRed2-expressing new GC (top) and a GFP-negative DsRed2-expressing new GC (bottom). D, Percentage of GFP-positive GCs among DsRed2-expressing GCs in the injected and non-injected area of OBs that received local immunotoxin injection. Number of DsRed2-expressing cells examined per an animal was 57–98 cells for the non-injected areas and 18–55 cells for the injected areas. Data show mean ± SEM (n = 4 mice). **p < 0.01 (unpaired t test). E, Images of DsRed2-expressing new GCs: left, magenta, a GFP-positive cell in the non-injected area; second from the left, red, a GFP-positive cell in the injected area; second from the right, cyan, a GFP-negative cell in the non-injected area; right, blue, a GFP-negative cell in the injected area. Insets show magnified views of dendritic structures in the GCL. F, Apposition to VGLUT1-expressing structures (green) of enlarged spines of GFP-positive DsRed2-expressing new GCs (magenta) in the ablated area. Top, A large spine on basal dendrite (1.57 μm2 in area); bottom, a large spine on proximal dendrite (1.17 μm2 in area). G–I, Cumulative probability plots of spine head size of DsRed2-expressing GCs in the GCL of four groups of cells, namely GFP-positive and GFP-negative transplanted GCs in immunotoxin-injected or non-injected areas. Size is evaluated as the area (square micrometers) of individual spine heads. G, Spines on basal dendrites; H, spines on soma; I, spines on proximal dendrites. Magenta, GFP-positive GCs in the non-injected area; red, GFP-positive GCs in the injected area; cyan, GFP-negative GCs in the non-injected area; blue, GFP-negative GCs in the injected area. The number of spines analyzed is 227, 322, 387, and 150 for basal dendrites from 11, 13, 14, and 10 cells (G), 69, 49, 64, and 52 for soma from 11, 11, 12, and 11 cells (H), and 141, 81, 129, and 96 for proximal dendrites from 10, 10, 14, and 10 cells (I), of GFP-positive GCs in the non-injected area, GFP-positive GCs in the injected area, GFP-negative GCs in the non-injected area, and GFP-negative GCs in the injected area, respectively. Distribution of spine head size was significantly different between GFP-positive cells in the injected area and those in the non-injected area, in basal dendrites (p = 3.0 × 10⁻⁷) and proximal dendrites (p = 5.3 × 10⁻⁴) but not in soma (p = 0.58). No significant difference in size distribution was observed between GFP-negative cells in the injected and non-injected areas (p = 0.60, 0.059, and 0.89 for basal dendrites, soma, and proximal dendrites, respectively, Kolmogorov–Smirnov test). J–L, Density of spines in the dendritic and somatic portion of the four groups of the cells. J, Spine density of basal dendrites; number of cells analyzed is 11, 13, 14, and 10 for individual groups (from left to right in the figure). K, Spine density of soma; number of cells is 11, 11, 12, and 11. L, Spine density of proximal dendrites; number of cells is 10, 10, 14, and 10 (Kruskal–Wallis test). Bars in J–L indicate median with interquartile range. Scale bars: B, 100 μm; C, E, 5 μm; E, F, insets, 1 μm.
We then examined the morphology of headed spines of DsRed2-expressing GCs (Fig. 7E). In the GCL of the ablated area, very large headed spines were occasionally found on the dendrites of GFP-positive DsRed2-expressing GCs, as exemplified in Figure 7E (insets). We therefore compared the head size of headed spines on basal dendrites, somata, and proximal dendrites among four groups of DsRed2-expressing cells, namely GFP-positive and GFP-negative GCs in the ablated and non-ablated areas of immunotoxin-injected OB (Fig. 7G–I). Comparison of the size distribution of headed spines measured from 10–14 cells in individual cell groups showed that, for spines on basal dendrites, the head size of GFP-positive DsRed2-expressing GCs in the ablated area (median, 0.48 μm2) was significantly larger than that in GFP-positive DsRed2-expressing GCs in the non-ablated area (median, 0.31 μm2) (Fig. 7G). Conversely, the head size in GFP-negative DsRed2-expressing GCs showed no significant difference between the ablated and non-ablated areas (median: 0.29 μm2 for ablated area, 0.30 μm2 for non-ablated area) (Fig. 7G). Similarly, for spines on proximal dendrites, the head size of GFP-positive DsRed2-expressing GCs in the ablated area (median, 0.53 μm2) was significantly larger than that of GFP-positive DsRed2-expressing GCs in the non-ablated area (median, 0.33 μm2), whereas that of GFP-negative DsRed2-expressing GCs showed no significant difference between these areas (median: 0.34 μm2 for ablated area, 0.28 μm2 for non-ablated area) (Fig. 7I). Somatic spines showed no significant difference in size between these areas, with regard to both GFP-positive and GFP-negative DsRed2-expressing GCs (Fig. 7H).
A similar comparison was conducted for the density of headed spines (Fig. 7J–L). Number of spines per 1 μm of the respective somatodendritic domains was determined in each cell and compared among cell groups. The density of headed spines on basal dendrites (Fig. 7J), somata (Fig. 7K), and proximal dendrites (Fig. 7L) showed no significant difference between these areas, for both GFP-positive and GFP-negative DsRed2-expressing GCs. The very large headed spines in GFP-positive DsRed2-expressing GCs were apposed to VGLUT1-expressing glutamatergic terminals in the same way as other GCL spines of ordinary size (Fig. 7F).
Thus, these transplantation studies showed the formation of larger size of headed spines on GFP-positive new GCs in the ablated area, suggesting that synapse formation of new GCs also received subset-specific regulation in the local OB area. Quantitative analysis of spines in the EPL remained to be performed because of the difficulty in discriminating GFP-positive and -negative spines under high expression level of GFP in the layer.
Preexisting GFP-negative GCs did not contribute to the recovery of GFP-positive GCs after local ablation of GFP-positive GCs
The restoration of GFP-positive GCs might also be attributable to the transformation of preexisting GFP-negative GCs into GFP-positive GCs after the ablation of preexisting GFP-positive GCs in the local area. To address this possibility, CldU-labeled, neonatal-born GCs in the immunotoxin-injected OB were classified into GFP-positive and GFP-negative GCs (Fig. 8B–D) and examined at the peak time of cell ablation (day 14 after immunotoxin injection) and in the recovery period (day 40) (Fig. 8A). In accord with the specific ablation of GFP-positive GCs, the percentage of GFP-positive GCs among CldU-labeled GCs in the ablated area was remarkably decreased at day 14 (15%) compared with that in the non-ablated area (38%) (Fig. 8E). At day 40, the percentage in the ablated area stayed low (17%) and showed no significant difference to that at day 14. This result argues against the idea of contribution of preexisting GCs to the restoration of the density of GFP-positive GCs in the ablated area but rather suggests the essential role of adult-born new GCs in restoration.
Figure 8.
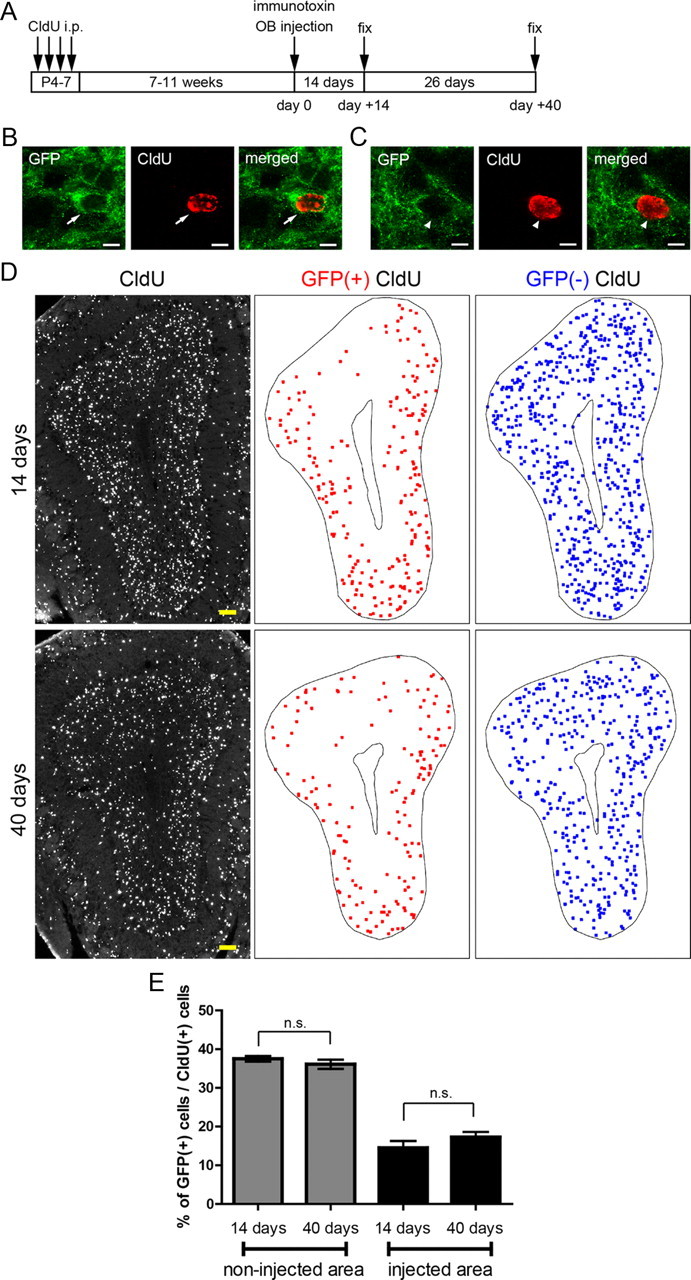
Continual low proportion of a preexisting mGluR2-expressing GC subset in the local area of ablation during recovery of the mGluR2-expressing GC subset. A, Schedule of CldU labeling of preexisting GCs, immunotoxin or PBS injection, and fixation. B, C, Confocal images of a GFP-positive CldU-labeled preexisting GC (B) and a GFP-negative CldU-labeled preexisting GC (C). D, Distribution of CldU-labeled GCs (left), GFP-positive CldU-labeled GCs (red, middle), and GFP-negative CldU-labeled GCs (blue, right) after 14 d of immunotoxin injection (top) and 40 d of immunotoxin injection (bottom). The MCL and core are outlined. E, Percentage of GFP-positive GCs among CldU-labeled cells. Number of CldU-labeled cells examined per an animal were 559–1029, 396–770, 103–197, and 93–132 cells in the four groups, respectively (columns from left to right) (n = 5 mice in each group). n.s., not significant (unpaired t test). Data in E show mean ± SEM. Scale bars: B, C, 5 μm; D, 100 μm.
Ablation and restoration of a calretinin-expressing GC subset and preferential incorporation of calretinin-expressing adult-born GCs in the immunotoxin-injected local area
In addition to mGluR2, GCs can be also classified into subsets by two other molecular markers, calretinin and 5T4 (Jacobowitz and Winsky, 1991; Imamura et al., 2006; Parrish-Aungst et al., 2007). We examined the effect of local ablation of preexisting mGluR2-expressing GCs on these GC subsets.
Immunohistochemical studies showed that 72.5% of calretinin-expressing GCs were GFP positive (GFP-positive GCs/calretinin-expressing GCs; 75 of 100, 72 of 103, and 80 of 107 in each of three animals) (Fig. 9B). Conversely, 25.9% of GFP-positive GCs were calretinin-expressing GCs (calretinin-expressing GCs/GFP-positive GCs; 75 of 280, 72 of 359, and 80 of 260 in each of three animals), indicating that the majority of calretinin-expressing GCs were GFP (mGluR2)-positive GCs, and GFP-positive GCs contained a calretinin-expressing subpopulation. Conversely, 91.5% of 5T4-expressing GCs were GFP negative (GFP-negative GCs/5T4-expressing GCs; 95 of 102, 90 of 100, and 95 of 104 in each animal), and 37.3% of GFP-negative GCs in the MCL and IPL were 5T4-expressing GCs (5T4-expressing GCs/GFP-negative GCs; 95 of 160, 90 of 163, and 95 of 177 in each animal), indicating that 5T4-expressing GCs were a subpopulation of GFP (mGluR2)-negative GCs (Fig. 9H). At 2 weeks after immunotoxin injection in the local OB area, the density of calretinin-expressing GCs was significantly reduced locally in the ablated area, to 52% of that in the control (PBS-injected dorsal) area (Fig. 9A,C). At 8 weeks, in contrast, density recovered to 71% of the control (Fig. 9A,C). These changes in the density of calretinin-expressing GCs were specific to the ablated area (Fig. 9A,C). Conversely, the density of 5T4-expressing GCs in the ablated area of the immunotoxin-injected OB showed no significant change at these periods (Fig. 9G,I).
Figure 9.
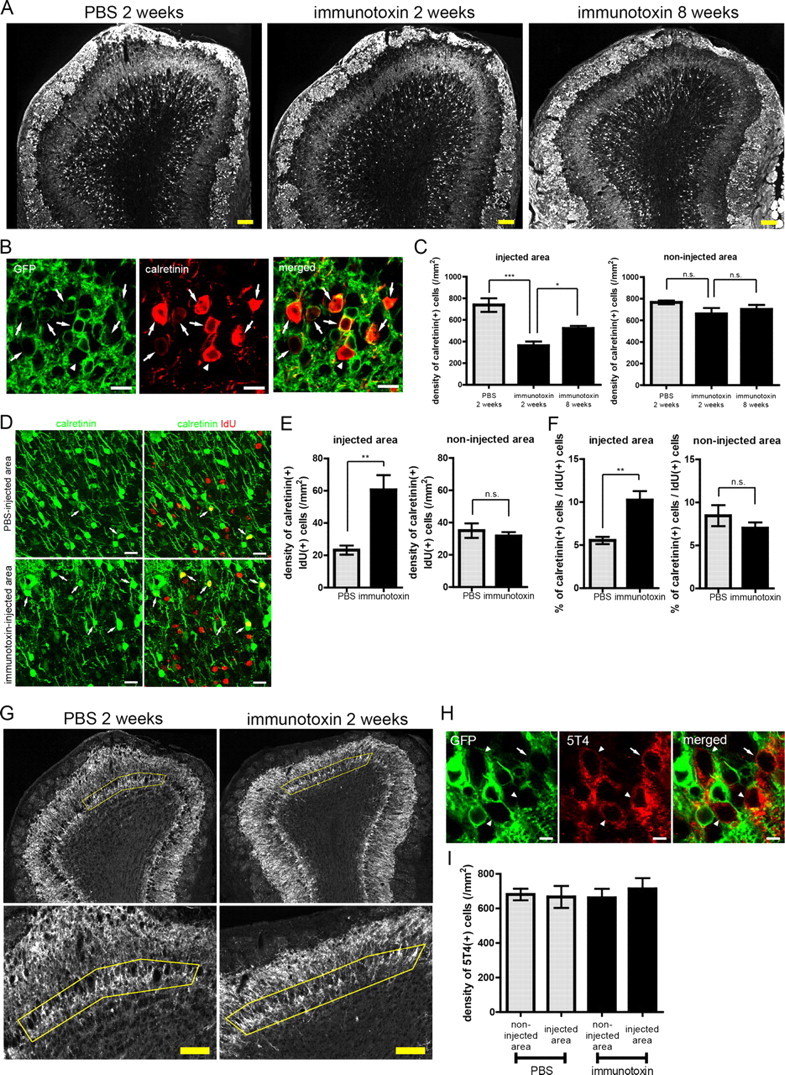
A calretinin-expressing GC subset showed ablation, restoration, and preferential incorporation of GCs after local injection of immunotoxin. A, Distribution of calretinin-expressing GCs in the OBs at 2 weeks after PBS injection (left), 2 weeks after immunotoxin injection (middle), and 8 weeks after immunotoxin injection (right). B, Coexpression of GFP and calretinin in GCs of the transgenic mouse OB. Green, GFP; red, calretinin. Arrows show GFP-positive calretinin expressing GCs. An arrowhead shows a GFP-negative calretinin-expressing GC. C, Density of calretinin-expressing GCs in the injected (left) and non-injected area (right). n = 4, 5, and 5 mice for 2 weeks after PBS injection, 2 weeks after immunotoxin injection, and 8 weeks after immunotoxin injection, respectively. *p < 0.05; ***p < 0.001; n.s., not significant (one-way ANOVA with post hoc Tukey's test). D, Confocal images of calretinin-expressing IdU-labeled adult-born GCs (arrows) in the PBS-injected area (top) and immunotoxin-injected area (bottom) at 40 d after injection. IdU-labeled cells are 28–34 d of age. Green, Calretinin; red, IdU. E, Density of calretinin-expressing IdU-labeled GCs in the injected (left) and non-injected area (right). n = 5 mice for individual groups. **p < 0.01; n.s., not significant (unpaired t test). F, Percentage of calretinin-expressing GCs among IdU-labeled GCs in the injected (left) and non-injected area (right). n = 5 mice for individual groups. **p < 0.01; n.s., not significant (unpaired t test). G, Distribution of 5T4-expressing GCs in the PBS-injected (left) and immunotoxin-injected (right) OB at 2 weeks after injection. MCL and IPL of the injected area are delineated by yellow lines. Bottom panels show magnified views of the delineated regions of the top panels. H, 5T4-expressing GCs (red) and GFP-positive GCs (green) in the transgenic mouse OB. The majority of 5T4-expressing GCs were GFP negative (arrowhead). An arrow shows a GFP-positive 5T4-expressing GC. I, Density of 5T4-expressing GCs in the injected and non-injected area at 2 weeks after local immunotoxin or PBS injection. There was no significant difference in density among the groups. n = 4 mice for individual groups (one-way ANOVA). Data in C, E, F, and I show mean ± SEM. Scale bars: A, G, 100 μm; B, D, 20 μm, H, 5 μm.
Adult-born GCs were labeled by IdU after immunotoxin-mediated cell ablation as above (Fig. 5C) and analyzed at 4 weeks after labeling (Fig. 9D). Because the density of calretinin-expressing IdU-labeled GCs differed between dorsal and ventral areas of the control OB, comparison was made between the corresponding dorsal or ventral areas of immunotoxin-injected and PBS-injected OBs (Fig. 9E). The number of calretinin-expressing IdU-labeled GCs in the dorsal (ablated) area of immunotoxin-injected OB was greater than in the PBS-injected dorsal area, with a 2.6-fold increase in density (Fig. 9E). This increased density was specific to the ablated area (Fig. 9E).
To examine the preferential incorporation of calretinin-expressing adult-born GCs, the percentage of calretinin-expressing IdU-labeled GCs among total IdU-labeled GCs was calculated. The percentage in the ablated dorsal area of immunotoxin-injected OB was 1.8-fold larger than that in the PBS-injected dorsal area (Fig. 9F). This increase was specific to the ablated area (Fig. 9F). These results for calretinin-expressing GCs confirmed the ablation, restoration, and preferential incorporation of adult-born GC subsets.
Discussion
Coordination of loss of preexisting GC subsets and incorporation of new GC subsets in a local OB area
In this study, we found that the selective ablation of preexisting mGluR2-expressing GCs in a local area of the OB was followed by substantial recovery in the density of mGluR2-expressing GCs. This recovery from selective ablation involved preferential incorporation of the mGluR2-expressing subset of new GCs over the mGluR2-negative subset in the local OB area. These results suggest that local OB neuronal circuits have a mechanism to coordinate the loss of a specific subset of preexisting GCs with the incorporation of new GCs of the same subset.
In adult mice, the number of new GCs that enter the OB each day is several percentages of the total number of GCs in the OB (Kaplan et al., 1985; Winner et al., 2002; Lledo et al., 2006), and preexisting GCs are substantially lost during the adult period (Imayoshi et al., 2008). Despite this extensive turnover of GCs, we found that the proportion of mGluR2-expressing GCs among total GCs was kept at a similar level during the period examined (2–10 months old) (Fig. 1C). Such homeostasis of OB circuits with constant composition of mGluR2-expressing and -negative subsets may be ensured by coordination between the loss of the mGluR2-expressing subset of preexisting GCs and incorporation of the same subset of new GCs. The present cell ablation study revealed that new GC subsets compensate for the preceding loss of preexisting GCs. Interestingly, a substantial loss of preexisting GCs occurs in mutant mice that lack adult neurogenesis (Imayoshi et al., 2008), indicating that the loss of preexisting GCs does not depend on the arrival of adult-born new GCs. Thus, incorporation of new GC subsets might be continually regulated by the preceding loss of preexisting GCs and might compensate for the physiologically occurring loss of preexisting GCs to maintain the composition of GC subsets.
Analysis of spine formation of new GCs in the ablated area showed that they are synaptically integrated into the neuronal circuits in a manner similar to preexisting and new GCs under physiological conditions. Surprisingly, enlargement of spine size was observed specifically for the mGluR2-expressing subset of new GCs that were incorporated into OB circuits of the ablated area (Fig. 7). This cell-type- and area-specific alteration in synaptic structure is likely another manifestation of compensatory mechanisms in the local OB circuit. Because large glutamatergic spines tend to express a large amount of AMPA receptor (Kasai et al., 2010), the enlarged spines of mGluR2-expressing new GCs may receive stronger excitatory inputs and the GCs may become more excitable. Despite the large recovery, the density of mGluR2-expressing GCs in the ablated area was still lower than in the control area during the period examined (Fig. 7). The larger spines of mGluR2-expressing new GCs may functionally compensate for the lower density of mGluR2-expressing GCs in the local circuit. Homeostasis of the local bulbar circuits with mGluR2-expressing GCs may be maintained by both the local circuit-dependent coordination of cellular incorporation with the loss of GC subsets and local circuit-dependent spine size regulation of individual mGluR2-expressing GCs. Additional electrophysiological analysis of new GCs and local OB circuits should reveal how structural compensation by new GCs contributes to functional compensation in the local OB circuit.
Possible mechanisms for the preferential incorporation of the mGluR2-expressing subset of new GCs in the local OB area
Both adult-born new neurons (Figs. 5, 6) and transplanted neurons of neonate origin (Fig. 7) contributed to the preferential substitution of the depleted mGluR2-expressing GC subset. In contrast, preexisting old GCs did not appear to contribute to compensation for the depletion of GC subsets (Fig. 8), suggesting the importance of the high plasticity of new neurons in subset compensation. Then, how do new neurons compensate for depleted GC subsets? It is possible that increased proliferation of putative precursors for mGluR2-expressing GCs in the SVZ results in the increased incorporation of mGluR2-expressing GCs. However, the present results argue against this idea because the ablation of mGluR2-expressing GCs did not influence cell proliferation in the SVZ (Fig. 4), and transplantation of progenitors from intact mice showed the preferential incorporation of mGluR2-expressing new GCs (Fig. 7).
Present results rather suggest that compensation occurs by regulating the fate of new neurons in local areas of the OB. Recruitment of larger number of new neurons in the ablated area (Fig. 4) effectively provides cellular materials for compensation, and the new neurons can contribute to the preferential compensation of the mGluR2-expressing GC subset through several mechanisms. Putative precursors for mGluR2-expressing GCs may be preferentially recruited in the local area, undifferentiated precursors may be preferentially differentiated into mGluR2-expressing GCs in the local area, or survival of mGluR2-expressing GCs may be preferentially enhanced in the local area. All these mechanisms are possible, but it is currently difficult to pinpoint the mechanism because mGluR2 (GFP) expression in adult-born new GCs was not evident at early cellular ages (e.g., day 14) (Fig. 5B). In the present study, the percentage of the mGluR2-expressing GC subset among newly incorporated GCs differed among experiments that labeled or used progenitors of spatially and temporally distinct origins (Figs. 5I, 6G, 7D, 8E). This observation suggests the heterogeneity in SVZ precursors with regard to the generation of mGluR2-expressing GCs, as observed for other OB interneuron subsets (Lemasson et al., 2005; De Marchis et al., 2007; Kelsch et al., 2007; Kohwi et al., 2007; Merkle et al., 2007; Young et al., 2007; Batista-Brito et al., 2008; Lledo et al., 2008). Identification of early markers for the mGluR2-expressing GC subset, including transcription factors, will aid understanding of the mechanisms of subset compensation. Subset-specific GC compensation was also seen for calretinin-expressing GCs in the present analysis (Fig. 9). Given the knowledge of calretinin-expressing GC development (Waclaw et al., 2006; Merkle et al., 2007), additional analysis of this subset might also help understanding of the underlying mechanisms.
Another important question is which mechanisms coordinate the loss and incorporation of GC subsets. The present study indicates the existence of “local cues” in the local OB area for the coordination. In this regard, the cell-type- and area-specific enlargement in spine size of new GCs is again intriguing: the observation raises the possibility that synapse formation of new GCs is regulated in a GC subset-specific manner in the local OB area. On the dendritic spines of GCs in the GCL, axon terminals of olfactory cortical neurons and bulbar mitral/tufted cells make glutamatergic synaptic contacts (Price and Powell, 1970; Shepherd, 2004). These axon terminals may be specified for particular GC subsets. In the retina, lamina-specific synaptic connections between ganglionic cell subsets and amacrine cell subsets are mediated by homophilic adhesion molecules Dscam and Sidekick (Yamagata and Sanes, 2008). Such adhesion molecules are candidates that mediate possible GC subset-specific axon targeting; in particular, Dscams are highly expressed in OB (Agarwala et al., 2001; Barlow et al., 2001). In the present study, putative subset-specific axons may have facilitated incorporation of mGluR2-expressing GCs by inducing large spines and promoting survival for the subset, given that synaptic input onto new GCs is considered crucial to their survival (Lin et al., 2010). In addition to the synaptic counterparts in the GCL, those in the MCL and EPL may also direct subset-specific GC incorporation on the basis that distinct subcellular domains of mitral/tufted cells in the layers are suggested to provide synaptic sites for different OB interneuron subsets (Toida et al., 1994; Shepherd, 2004; Naritsuka et al., 2009). Identification of the synaptic counterparts of GC subsets in terms of neuronal types, subcellular domains, and contributing molecules should reveal the local cues that control subset-specific GC incorporation. Furthermore, understanding local cues in neuronal circuits that control the incorporation of neuronal subsets would improve regenerative therapy for neurodegenerative diseases. In many neurodegenerative diseases, specific neuronal subsets are preferentially affected (Cowan and Raymond, 2006; Allan et al., 2010). Cell replenishment may effectively restore the affected neuronal subsets by using local cues for subset incorporation.
Our findings do not deny the possibility that mechanisms other than subset compensation coordinate the loss and incorporation of GC subsets. Enhanced incorporation of new GCs by olfactory learning (Rochefort et al., 2002; Alonso et al., 2006) might be followed by the expulsion of preexisting GCs, and this process, if present, might occur in a GC subset-specific manner to coordinate the subset loss and incorporation. mGluR2 in the OB is involved in the formation of pheromonal memory and odor preference (Hayashi et al., 1993; Kaba et al., 1994; Rumsey et al., 2001). It will be intriguing to see whether mGluR2-dependent memory formation is related to turnover of mGluR2-expressing GCs. Electrophysiological studies indicated that new GCs show higher synaptic plasticity than old GCs (Nissant et al., 2009). Thus, increased turnover of mGluR2-expressing GCs may enhance mGluR2-dependent bulbar plasticity and olfactory memory formation. Additional studies examining the loss and incorporation of distinct subsets of GCs during various olfactory learning paradigms should provide clues for understanding the functional role of the coordination of the loss and incorporation of specific subsets of GCs.
Footnotes
This work was supported by a Grant-in-Aid for Scientific Research on Priority Areas from the Ministry of Education, Culture, Sports, Science, and Technology, Japan (K.Mo., M.Y.) and a Grant-in-Aid for Scientific Research from Japan Society for the Promotion of Science (JSPS), Japan (K.Mo., M.Y.). K.Mu. was supported by JSPS Research Fellowship for Young Scientists. This research was also supported in part by the Intramural Research Program of the NIH, National Cancer Institute, Center for Cancer Research. We thank Dr. K. Sawamoto and Dr. N. Kaneko for technical assistance with cell transplantation, Dr. M. Onodera for retroviral vectors, and the members of the Department of Physiology at the University of Tokyo for valuable discussion and comments.
The authors declare no competing financial interest.
References
- Agarwala KL, Ganesh S, Tsutsumi Y, Suzuki T, Amano K, Yamakawa K. Cloning and functional characterization of DSCAML1, a novel DSCAM-like cell adhesion molecule that mediates homophilic intercellular adhesion. Biochem Biophys Res Commun. 2001;285:760–772. doi: 10.1006/bbrc.2001.5214. [DOI] [PubMed] [Google Scholar]
- Allan LE, Petit GH, Brundin P. Cell transplantation in Parkinson's disease: problems and perspectives. Curr Opin Neurol. 2010;23:426–432. doi: 10.1097/WCO.0b013e32833b1f62. [DOI] [PubMed] [Google Scholar]
- Alonso M, Viollet C, Gabellec MM, Meas-Yedid V, Olivo-Marin JC, Lledo PM. Olfactory discrimination learning increases the survival of adult-born neurons in the olfactory bulb. J Neurosci. 2006;26:10508–10513. doi: 10.1523/JNEUROSCI.2633-06.2006. [DOI] [PMC free article] [PubMed] [Google Scholar]
- Alvarez-Buylla A, Garcia-Verdugo JM. Neurogenesis in adult subventricular zone. J Neurosci. 2002;22:629–634. doi: 10.1523/JNEUROSCI.22-03-00629.2002. [DOI] [PMC free article] [PubMed] [Google Scholar]
- Bagley J, LaRocca G, Jimenez DA, Urban NN. Adult neurogenesis and specific replacement of interneuron subtypes in the mouse main olfactory bulb. BMC Neurosci. 2007;8:92. doi: 10.1186/1471-2202-8-92. [DOI] [PMC free article] [PubMed] [Google Scholar]
- Barlow GM, Micales B, Lyons GE, Korenberg JR. Down syndrome cell adhesion molecule is conserved in mouse and highly expressed in the adult mouse brain. Cytogenet Cell Genet. 2001;94:155–162. doi: 10.1159/000048808. [DOI] [PubMed] [Google Scholar]
- Batista-Brito R, Close J, Machold R, Fishell G. The distinct temporal origins of olfactory bulb interneuron subtypes. J Neurosci. 2008;28:3966–3975. doi: 10.1523/JNEUROSCI.5625-07.2008. [DOI] [PMC free article] [PubMed] [Google Scholar]
- Batra JK, FitzGerald D, Gately M, Chaudhary VK, Pastan I. Anti-Tac(Fv)-PE40, a single chain antibody Pseudomonas fusion protein directed at interleukin 2 receptor bearing cells. J Biol Chem. 1990;265:15198–15202. [PubMed] [Google Scholar]
- Brown JP, Couillard-Després S, Cooper-Kuhn CM, Winkler J, Aigner L, Kuhn HG. Transient expression of doublecortin during adult neurogenesis. J Comp Neurol. 2003;467:1–10. doi: 10.1002/cne.10874. [DOI] [PubMed] [Google Scholar]
- Cobos I, Calcagnotto ME, Vilaythong AJ, Thwin MT, Noebels JL, Baraban SC, Rubenstein JL. Mice lacking Dlx1 show subtype-specific loss of interneurons, reduced inhibition and epilepsy. Nat Neurosci. 2005;8:1059–1068. doi: 10.1038/nn1499. [DOI] [PubMed] [Google Scholar]
- Cowan CM, Raymond LA. Selective neuronal degeneration in Huntington's disease. Curr Top Dev Biol. 2006;75:25–71. doi: 10.1016/S0070-2153(06)75002-5. [DOI] [PubMed] [Google Scholar]
- Darzynkiewicz Z, Robinson JP, Crissman HA. Flow cytometry. Ed 2. San Diego: Academic; 1994. American Society for Cell Biology. [Google Scholar]
- De Marchis S, Bovetti S, Carletti B, Hsieh YC, Garzotto D, Peretto P, Fasolo A, Puche AC, Rossi F. Generation of distinct types of periglomerular olfactory bulb interneurons during development and in adult mice: implication for intrinsic properties of the subventricular zone progenitor population. J Neurosci. 2007;27:657–664. doi: 10.1523/JNEUROSCI.2870-06.2007. [DOI] [PMC free article] [PubMed] [Google Scholar]
- Esclapez M, Tillakaratne NJ, Kaufman DL, Tobin AJ, Houser CR. Comparative localization of two forms of glutamic acid decarboxylase and their mRNAs in rat brain supports the concept of functional differences between the forms. J Neurosci. 1994;14:1834–1855. doi: 10.1523/JNEUROSCI.14-03-01834.1994. [DOI] [PMC free article] [PubMed] [Google Scholar]
- Fremeau RT, Jr, Voglmaier S, Seal RP, Edwards RH. VGLUTs define subsets of excitatory neurons and suggest novel roles for glutamate. Trends Neurosci. 2004;27:98–103. doi: 10.1016/j.tins.2003.11.005. [DOI] [PubMed] [Google Scholar]
- Gabellec MM, Panzanelli P, Sassoè-Pognetto M, Lledo PM. Synapse-specific localization of vesicular glutamate transporters in the rat olfactory bulb. Eur J Neurosci. 2007;25:1373–1383. doi: 10.1111/j.1460-9568.2007.05400.x. [DOI] [PubMed] [Google Scholar]
- Hayashi Y, Momiyama A, Takahashi T, Ohishi H, Ogawa-Meguro R, Shigemoto R, Mizuno N, Nakanishi S. Role of a metabotropic glutamate receptor in synaptic modulation in the accessory olfactory bulb. Nature. 1993;366:687–690. doi: 10.1038/366687a0. [DOI] [PubMed] [Google Scholar]
- Imamura F, Nagao H, Naritsuka H, Murata Y, Taniguchi H, Mori K. A leucine-rich repeat membrane protein, 5T4, is expressed by a subtype of granule cells with dendritic arbors in specific strata of the mouse olfactory bulb. J Comp Neurol. 2006;495:754–768. doi: 10.1002/cne.20896. [DOI] [PubMed] [Google Scholar]
- Imayoshi I, Sakamoto M, Ohtsuka T, Takao K, Miyakawa T, Yamaguchi M, Mori K, Ikeda T, Itohara S, Kageyama R. Roles of continuous neurogenesis in the structural and functional integrity of the adult forebrain. Nat Neurosci. 2008;11:1153–1161. doi: 10.1038/nn.2185. [DOI] [PubMed] [Google Scholar]
- Jacobowitz DM, Winsky L. Immunocytochemical localization of calretinin in the forebrain of the rat. J Comp Neurol. 1991;304:198–218. doi: 10.1002/cne.903040205. [DOI] [PubMed] [Google Scholar]
- Kaba H, Hayashi Y, Higuchi T, Nakanishi S. Induction of an olfactory memory by the activation of a metabotropic glutamate receptor. Science. 1994;265:262–264. doi: 10.1126/science.8023145. [DOI] [PubMed] [Google Scholar]
- Kaplan MS, McNelly NA, Hinds JW. Population dynamics of adult-formed granule neurons of the rat olfactory bulb. J Comp Neurol. 1985;239:117–125. doi: 10.1002/cne.902390110. [DOI] [PubMed] [Google Scholar]
- Kasai H, Fukuda M, Watanabe S, Hayashi-Takagi A, Noguchi J. Structural dynamics of dendritic spines in memory and cognition. Trends Neurosci. 2010;33:121–129. doi: 10.1016/j.tins.2010.01.001. [DOI] [PubMed] [Google Scholar]
- Kelsch W, Mosley CP, Lin CW, Lois C. Distinct mammalian precursors are committed to generate neurons with defined dendritic projection patterns. PLoS Biol. 2007;5:e300. doi: 10.1371/journal.pbio.0050300. [DOI] [PMC free article] [PubMed] [Google Scholar]
- Kelsch W, Lin CW, Lois C. Sequential development of synapses in dendritic domains during adult neurogenesis. Proc Natl Acad Sci U S A. 2008;105:16803–16808. doi: 10.1073/pnas.0807970105. [DOI] [PMC free article] [PubMed] [Google Scholar]
- Kobayashi K, Morita S, Sawada H, Mizuguchi T, Yamada K, Nagatsu I, Fujita K, Kreitman RJ, Pastan I, Nagatsu T. Immunotoxin-mediated conditional disruption of specific neurons in transgenic mice. Proc Natl Acad Sci U S A. 1995;92:1132–1136. doi: 10.1073/pnas.92.4.1132. [DOI] [PMC free article] [PubMed] [Google Scholar]
- Kohwi M, Petryniak MA, Long JE, Ekker M, Obata K, Yanagawa Y, Rubenstein JL, Alvarez-Buylla A. A subpopulation of olfactory bulb GABAergic interneurons is derived from Emx1- and Dlx5/6-expressing progenitors. J Neurosci. 2007;27:6878–6891. doi: 10.1523/JNEUROSCI.0254-07.2007. [DOI] [PMC free article] [PubMed] [Google Scholar]
- Lemasson M, Saghatelyan A, Olivo-Marin JC, Lledo PM. Neonatal and adult neurogenesis provide two distinct populations of newborn neurons to the mouse olfactory bulb. J Neurosci. 2005;25:6816–6825. doi: 10.1523/JNEUROSCI.1114-05.2005. [DOI] [PMC free article] [PubMed] [Google Scholar]
- Lin CW, Sim S, Ainsworth A, Okada M, Kelsch W, Lois C. Genetically increased cell-intrinsic excitability enhances neuronal integration into adult brain circuits. Neuron. 2010;65:32–39. doi: 10.1016/j.neuron.2009.12.001. [DOI] [PMC free article] [PubMed] [Google Scholar]
- Lledo PM, Alonso M, Grubb MS. Adult neurogenesis and functional plasticity in neuronal circuits. Nat Rev Neurosci. 2006;7:179–193. doi: 10.1038/nrn1867. [DOI] [PubMed] [Google Scholar]
- Lledo PM, Merkle FT, Alvarez-Buylla A. Origin and function of olfactory bulb interneuron diversity. Trends Neurosci. 2008;31:392–400. doi: 10.1016/j.tins.2008.05.006. [DOI] [PMC free article] [PubMed] [Google Scholar]
- Markram H, Toledo-Rodriguez M, Wang Y, Gupta A, Silberberg G, Wu C. Interneurons of the neocortical inhibitory system. Nat Rev Neurosci. 2004;5:793–807. doi: 10.1038/nrn1519. [DOI] [PubMed] [Google Scholar]
- Merkle FT, Mirzadeh Z, Alvarez-Buylla A. Mosaic organization of neural stem cells in the adult brain. Science. 2007;317:381–384. doi: 10.1126/science.1144914. [DOI] [PubMed] [Google Scholar]
- Mori K, Kishi K, Ojima H. Distribution of dendrites of mitral, displaced mitral, tufted, and granule cells in the rabbit olfactory bulb. J Comp Neurol. 1983;219:339–355. doi: 10.1002/cne.902190308. [DOI] [PubMed] [Google Scholar]
- Naritsuka H, Sakai K, Hashikawa T, Mori K, Yamaguchi M. Perisomatic-targeting granule cells in the mouse olfactory bulb. J Comp Neurol. 2009;515:409–426. doi: 10.1002/cne.22063. [DOI] [PubMed] [Google Scholar]
- Ninkovic J, Mori T, Götz M. Distinct modes of neuron addition in adult mouse neurogenesis. J Neurosci. 2007;27:10906–10911. doi: 10.1523/JNEUROSCI.2572-07.2007. [DOI] [PMC free article] [PubMed] [Google Scholar]
- Nissant A, Bardy C, Katagiri H, Murray K, Lledo PM. Adult neurogenesis promotes synaptic plasticity in the olfactory bulb. Nat Neurosci. 2009;12:728–730. doi: 10.1038/nn.2298. [DOI] [PubMed] [Google Scholar]
- Ohishi H, Shigemoto R, Nakanishi S, Mizuno N. Distribution of the messenger RNA for a metabotropic glutamate receptor, mGluR2, in the central nervous system of the rat. Neuroscience. 1993;53:1009–1018. doi: 10.1016/0306-4522(93)90485-x. [DOI] [PubMed] [Google Scholar]
- Ohishi H, Neki A, Mizuno N. Distribution of a metabotropic glutamate receptor, mGluR2, in the central nervous system of the rat and mouse: an immunohistochemical study with a monoclonal antibody. Neurosci Res. 1998;30:65–82. doi: 10.1016/s0168-0102(97)00120-x. [DOI] [PubMed] [Google Scholar]
- Parrish-Aungst S, Shipley MT, Erdelyi F, Szabo G, Puche AC. Quantitative analysis of neuronal diversity in the mouse olfactory bulb. J Comp Neurol. 2007;501:825–836. doi: 10.1002/cne.21205. [DOI] [PubMed] [Google Scholar]
- Petreanu L, Alvarez-Buylla A. Maturation and death of adult-born olfactory bulb granule neurons: role of olfaction. J Neurosci. 2002;22:6106–6113. doi: 10.1523/JNEUROSCI.22-14-06106.2002. [DOI] [PMC free article] [PubMed] [Google Scholar]
- Pouille F, Scanziani M. Routing of spike series by dynamic circuits in the hippocampus. Nature. 2004;429:717–723. doi: 10.1038/nature02615. [DOI] [PubMed] [Google Scholar]
- Price JL, Powell TP. An electron-microscopic study of the termination of the afferent fibres to the olfactory bulb from the cerebral hemisphere. J Cell Sci. 1970;7:157–187. doi: 10.1242/jcs.7.1.157. [DOI] [PubMed] [Google Scholar]
- Rochefort C, Gheusi G, Vincent JD, Lledo PM. Enriched odor exposure increases the number of newborn neurons in the adult olfactory bulb and improves odor memory. J Neurosci. 2002;22:2679–2689. doi: 10.1523/JNEUROSCI.22-07-02679.2002. [DOI] [PMC free article] [PubMed] [Google Scholar]
- Rumsey JD, Darby-King A, Harley CW, McLean JH. Infusion of the metabotropic receptor agonist, DCG-IV, into the main olfactory bulb induces olfactory preference learning in rat pups. Brain Res Dev Brain Res. 2001;128:177–179. doi: 10.1016/s0165-3806(01)00156-0. [DOI] [PubMed] [Google Scholar]
- Sawamoto K, Wichterle H, Gonzalez-Perez O, Cholfin JA, Yamada M, Spassky N, Murcia NS, Garcia-Verdugo JM, Marin O, Rubenstein JL, Tessier-Lavigne M, Okano H, Alvarez-Buylla A. New neurons follow the flow of cerebrospinal fluid in the adult brain. Science. 2006;311:629–632. doi: 10.1126/science.1119133. [DOI] [PubMed] [Google Scholar]
- Shepherd GM. The synaptic organization of the brain. Ed 5. Oxford: Oxford UP; 2004. [Google Scholar]
- Somogyi P, Klausberger T. Defined types of cortical interneurone structure space and spike timing in the hippocampus. J Physiol. 2005;562:9–26. doi: 10.1113/jphysiol.2004.078915. [DOI] [PMC free article] [PubMed] [Google Scholar]
- Südhof TC, Jahn R. Proteins of synaptic vesicles involved in exocytosis and membrane recycling. Neuron. 1991;6:665–677. doi: 10.1016/0896-6273(91)90165-v. [DOI] [PubMed] [Google Scholar]
- Suzuki A, Obi K, Urabe T, Hayakawa H, Yamada M, Kaneko S, Onodera M, Mizuno Y, Mochizuki H. Feasibility of ex vivo gene therapy for neurological disorders using the new retroviral vector GCDNsap packaged in the vesicular stomatitis virus G protein. J Neurochem. 2002;82:953–960. doi: 10.1046/j.1471-4159.2002.01048.x. [DOI] [PubMed] [Google Scholar]
- Tamás G, Buhl EH, Somogyi P. Fast IPSPs elicited via multiple synaptic release sites by different types of GABAergic neurone in the cat visual cortex. J Physiol. 1997;500:715–738. doi: 10.1113/jphysiol.1997.sp022054. [DOI] [PMC free article] [PubMed] [Google Scholar]
- Taniguchi K, Saito H, Okamura M, Ogawa K. Immunohistochemical demonstration of protein gene product 9.5 (PGP 9.5) in the primary olfactory system of the rat. Neurosci Lett. 1993;156:24–26. doi: 10.1016/0304-3940(93)90430-s. [DOI] [PubMed] [Google Scholar]
- Toida K, Kosaka K, Heizmann CW, Kosaka T. Synaptic contacts between mitral/tufted cells and GABAergic neurons containing calcium-binding protein parvalbumin in the rat olfactory bulb, with special reference to reciprocal synapses between them. Brain Res. 1994;650:347–352. doi: 10.1016/0006-8993(94)91804-x. [DOI] [PubMed] [Google Scholar]
- Waclaw RR, Allen ZJ, 2nd, Bell SM, Erdélyi F, Szabó G, Potter SS, Campbell K. The zinc finger transcription factor Sp8 regulates the generation and diversity of olfactory bulb interneurons. Neuron. 2006;49:503–516. doi: 10.1016/j.neuron.2006.01.018. [DOI] [PubMed] [Google Scholar]
- Watanabe D, Inokawa H, Hashimoto K, Suzuki N, Kano M, Shigemoto R, Hirano T, Toyama K, Kaneko S, Yokoi M, Moriyoshi K, Suzuki M, Kobayashi K, Nagatsu T, Kreitman RJ, Pastan I, Nakanishi S. Ablation of cerebellar Golgi cells disrupts synaptic integration involving GABA inhibition and NMDA receptor activation in motor coordination. Cell. 1998;95:17–27. doi: 10.1016/s0092-8674(00)81779-1. [DOI] [PubMed] [Google Scholar]
- Whitman MC, Greer CA. Synaptic integration of adult-generated olfactory bulb granule cells: basal axodendritic centrifugal input precedes apical dendrodendritic local circuits. J Neurosci. 2007;27:9951–9961. doi: 10.1523/JNEUROSCI.1633-07.2007. [DOI] [PMC free article] [PubMed] [Google Scholar]
- Winner B, Cooper-Kuhn CM, Aigner R, Winkler J, Kuhn HG. Long-term survival and cell death of newly generated neurons in the adult rat olfactory bulb. Eur J Neurosci. 2002;16:1681–1689. doi: 10.1046/j.1460-9568.2002.02238.x. [DOI] [PubMed] [Google Scholar]
- Yamada M, Onodera M, Mizuno Y, Mochizuki H. Neurogenesis in olfactory bulb identified by retroviral labeling in normal and 1-methyl-4-phenyl-1,2,3,6-tetrahydropyridine-treated adult mice. Neuroscience. 2004;124:173–181. doi: 10.1016/j.neuroscience.2003.10.040. [DOI] [PubMed] [Google Scholar]
- Yamagata M, Sanes JR. Dscam and Sidekick proteins direct lamina-specific synaptic connections in vertebrate retina. Nature. 2008;451:465–469. doi: 10.1038/nature06469. [DOI] [PubMed] [Google Scholar]
- Young KM, Fogarty M, Kessaris N, Richardson WD. Subventricular zone stem cells are heterogeneous with respect to their embryonic origins and neurogenic fates in the adult olfactory bulb. J Neurosci. 2007;27:8286–8296. doi: 10.1523/JNEUROSCI.0476-07.2007. [DOI] [PMC free article] [PubMed] [Google Scholar]