

Abstract
Like most mammals, mice feature dichromatic color vision based on short (S) and middle (M) wavelength-sensitive cone types. It is thought that mammals share a retinal circuit that in dichromats compares S- and M-cone output to generate blue/green opponent signals, with bipolar cells (BCs) providing separate chromatic channels. Although S-cone-selective ON-BCs (type 9 in mouse) have been anatomically identified, little is known about their counterparts, the M-cone-selective OFF-BCs. Here, we characterized cone connectivity and light responses of selected mouse BC types using immunohistochemistry and electrophysiology. Our anatomical data indicate that four (types 2, 3a/b, and 4) of the five mouse OFF-BCs indiscriminately contact both cone types, whereas type 1 BCs avoid S-cones. Light responses showed that the chromatic tuning of the BCs strongly depended on their position along the dorsoventral axis because of the coexpression gradient of M- and S-opsin found in mice. In dorsal retina, where coexpression is low, most type 2 cells were green biased, with a fraction of cells (≈14%) displaying strongly blue-biased responses, likely reflecting S-cone input. Type 1 cells were also green biased but did not comprise blue-biased “outliers,” consistent with type 1 BCs avoiding S-cones. We therefore suggest that type 1 represents the green OFF pathway in mouse. In addition, we confirmed that type 9 BCs display blue-ON responses. In ventral retina, all BC types studied here displayed similar blue-biased responses, suggesting that color vision is hampered in ventral retina. In conclusion, our data support an antagonistically organized blue/green circuit as the common basis for mammalian dichromatic color vision.
Introduction
Human color vision is based on spectrally opponent pathways (Hering, 1878) that originate in the retina, where the signals from three cone types—short (S) (“blue”), middle (M) (“green”), and long (L) (“red”) wavelength sensitive—are compared (Dacey, 2000). Among mammals, red/green (L/M) opponency is restricted to trichromatic primates, whereas blue/yellow (S/L+M) or blue/green (S/M) opponency is thought to be common to all mammals with at least two cone types. In primates, multiple types of blue/yellow opponent ganglion cells (GCs) have been found (Dacey and Packer, 2003), among them the “small bistratified” GC (Dacey and Lee, 1994). It receives input from OFF-bipolar cells (BCs) that contact M- and L-cones (Calkins et al., 1998) as well as from ON-BCs that selectively contact S-cones (“blue-cone BCs”) (Mariani, 1984; Kouyama and Marshak, 1992; Ghosh et al., 1997; Ghosh and Grünert, 1999), resulting in blueON/yellowOFF responses (Crook et al., 2009).
Little is known about the blue/green opponent circuit in nonprimate mammals (for review, see Puller and Haverkamp, 2011). A morphologically distinct blue-cone BC type was found in several species, including ground squirrel (Li and DeVries, 2006) and mouse (type 9) (Haverkamp et al., 2005). However, its counterpart, an M-cone-selective OFF-BC has not yet been identified in most species. With respect to chromatic bipolar cell pathways, the cone-dominated ground squirrel (Kryger et al., 1998) is the best studied nonprimate mammal. It possesses an S-cone-selective ON-BC type as well as two M-cone-selective OFF-BC types (Li and DeVries, 2006).
Demonstrating the presence of a blue/green circuitry in rod-dominated animals specialized in low light-intensity vision would support the idea of a common blueprint for the mammalian retina. Therefore, we aimed at investigating the chromatic BC pathways in mice, which feature two cone types, S and M, with the S-cone absorption peak in the near-UV spectral range (Jacobs et al., 1991). Extracellular recordings from mouse retina provided evidence for blue/green opponent GCs (Ekesten et al., 2000; Ekesten and Gouras, 2005) and behavioral studies demonstrated that mice can perform color discrimination tasks (Jacobs et al., 2004, 2007). Two retinal properties have to be kept in mind when studying chromatic processing in mice: First, like some other species, mice possess a dorsoventral gradient of S-opsin coexpression in M-cones, with S-opsin coexpression levels being low in the dorsal and high in the ventral retina (Szél and Röhlich, 1992; Röhlich et al., 1994; Applebury et al., 2000). Independent of this gradient, mice possess “true” S-cones that exclusively express S-opsin, account for ∼4% of the cones, are homogenously distributed across the retina, and are selectively contacted by blue-cone BCs (Haverkamp et al., 2005). Second, because of this low S-cone density and because mouse BCs have small dendritic fields, only a fraction of nonselective bipolar cells (meaning no preference toward one cone type) has a true S-cone within its reach. For example, for type 1 BCs with approximately eight cone contacts and type 2 BCs with approximately five cone contacts (Wässle et al., 2009), only ∼30 and ∼20%, respectively, are expected to receive true S-cone input.
Materials and Methods
Animals and tissue preparation.
Four mouse lines expressing fluorescent proteins in different subpopulations of bipolar cells were used (for mice and references, see Table 1). For the physiological measurements, mice (>8 weeks; both genders) were dark adapted for at least 2 h before the experiment and all subsequent procedures were performed under dim red illumination. [Note that, during the recordings, the tissue was light-adapted to constant background levels, as described below (see Light stimulation).] The animals were anesthetized with isoflurane (Baxter) inhalation and killed by cervical dislocation. All procedures were approved by the local animal care committee and were in accordance with the law of animal experimentation issued by the German Federal Government (Tierschutzgesetz).
Table 1.
Mouse lines and immunohistological markers
| Labeled structure (concentration, source) | References | |
|---|---|---|
| Mouse lines | ||
| MitoP (mitoCFP-P) | Type 1 OFF-BCs | Misgeld et al., 2007; Schubert et al., 2008 |
| CLM12 | Type 2 OFF-BCs | Berglund et al., 2006; Wässle et al., 2009 |
| Gus-GFP (GUS8.4GFP) | Type 7 ON-BCs | Wong et al., 1999; Huang et al., 2003 |
| CLM1 | Type 9 ON-BCs | Berglund et al., 2006 |
| Antibodies and markers | ||
| Anti-glyphoa | Cone pedicles (1:1000; guinea pig) | Pfeiffer-Guglielmi et al., 2003; Haverkamp et al., 2005 |
| Anti-GluR5b | Cone pedicles (1:100; goat) | Haverkamp et al., 2001b |
| PNA | Cone invaginations | Mataruga et al., 2007 |
| Anti-S-opsinb | S-cone outer segments (1:1000; goat) | |
| Anti-NK3Rc | Type 1 and 2 OFF-BCs (1:500; rabbit) | Haverkamp et al., 2003; Ghosh et al., 2004; Pignatelli and Strettoi, 2004 |
| Anti-Syt2/Znp-1d | Type 2 OFF-BCs (1:300; mouse) | Fox and Sanes, 2007; Wässle et al., 2009 |
| Anti-HCN4e | Type 3a OFF-BCs (1:500; rabbit) | Mataruga et al., 2007 |
| Anti-PKARIIβf | Type 3b OFF-BCs (1:2000; mouse) | Mataruga et al., 2007 |
| Anti-Cseng | Type 4 OFF-BCs (1:2000; mouse) | Haverkamp et al., 2008 |
aKind gift from B. Hamprecht and B. Pfeiffer-Guglielmi (University of Tübingen, Tübingen, Germany).
bSanta Cruz Biotechnology.
cKind gift from A. Hirano (Geffen School of Medicine, University of California, Los Angeles, Los Angeles, CA).
dZebrafish International Resource Center (University of Oregon, Eugene, OR).
eAlomone.
fBD Biosciences.
gKind gift from W. Wasco (Harvard Medical School, Charlestown, MA).
Tissue preparation.
For immunocytochemistry, the eyes were removed and dissected, and the posterior eye cup containing the retina was immediately immersed in 4% (w/v) paraformaldehyde in 0.1 m phosphate buffer (PB), pH 7.4, for 20 min. After fixation, the retina was dissected from the eyecup. For cryostat sections, it was cryoprotected in graded sucrose solutions (10, 20, and 30% w/v, respectively) and cut at 25 μm, mounted, and stored at −20°C. For retinal whole mounts, the tissue was cryoprotected and frozen and thawed several times. Whole mounts were processed free-floating.
For electrophysiology, the eyes were marked dorsally, enucleated, and transferred to a Petri dish containing carboxygenated (95% O2/5% CO2) Ringer's solution (Biometra) at room temperature. Then the retina was dissected out—while keeping track of the retinal orientation—and sliced (≈150–200 μm thick) manually (Edwards et al., 1989; Boos et al., 1993) with the scalpel blade oriented perpendicular to the dorsoventral axis of the retina. The slices were arranged in the recording chamber of the microscope, where they were held in place by a platinum “harp” and superfused (at ≈3 ml/min) with warmed (≈34°C) carboxygenated Ringer's solution.
Antibodies.
Rabbit anti-green fluorescent protein (GFP) (1:2000; Invitrogen) and goat anti-GFP (1:1000; Rockland) were used to amplify the signal of the various fluorescent proteins expressed in the transgenic mouse lines. Cone pedicles were labeled with antibodies against glycogen phosphorylase (glypho) or the glutamate receptor (GluR) subunit GluR5, S-cones with S-opsin antibodies (Table 1). The antibodies we used to label specific types of bipolar cells, together with concentrations and references, are also listed in Table 1.
Antibodies were diluted in PB, containing 0.5–1% Triton X-100, 0.02% sodium azide, 3% normal donkey serum, and 1% bovine serum albumin. In the case of neurokinin-3 receptor (NK3R) staining, antibodies were diluted in 0.01 m PBS, pH 7.4, containing 0.5–1% Triton X-100 and 0.02% sodium azide but without a blocking substance. Cryostat sections were incubated overnight in a mixture of primary antibodies, followed by incubation (2 h) in a mixture of secondary antibodies, which were conjugated to either Alexa Fluor 488 (Invitrogen), Cy3, or Cy5 (Dianova). Whole mounts were incubated for 2 d in the primary and for 3 h in the secondary antibody solution. The Alexa Fluor 594- or 647-conjugated lectin peanut agglutinin (PNA) (Invitrogen) was added to the secondary antibody solution and used at a 1:200 concentration.
Light microscopy.
Fluorescent specimens were viewed with a Zeiss Axioplan 2 microscope (Zeiss). Images were taken by using a CCD camera (Zeiss; AxioCam Mrm) and the Zeiss AxioVision 4.2 software. The microscope was equipped with a Plan-Neofluar 63×/1.4 oil-immersion objective and with the Zeiss ApoTome oscillating grating to reduce out of focus stray light. Confocal micrographs were taken using LSM 5 Pascal (Zeiss) or FluoView 1000 (Olympus) fluorescence microscopes equipped with argon and a HeNe lasers. Scanning was performed with Plan Apochromat 63×/1.4 or UPlanSapo 60×/1.35 oil-immersion objectives at 1024 × 1024 pixels. The z-axis increment was 0.32 μm for image stacks taken with both the Axioplan 2 and the confocal microscope. When projections of image stacks are shown, three to five serial optical sections were collapsed into a single plane. Brightness and contrast of the final images were adjusted using Adobe Photoshop CS, version 8.0.1.
Image analysis.
The staining pattern of some cell markers did not allow counting distinct dendritic tips at the cone pedicle. Thus, ImageJ (version 1.38; http://rsbweb.nih.gov/ij/) was used to measure areas of immunoreactivity in micrographs. Although this method is not as accurate as counting single tips, it yielded data per marker, which could then be compared with those from experiments with other markers. Furthermore, the results for the different cell markers turned out to be very consistent.
For these measurements, single optical sections or projections of two to three consecutive sections were selected with regard to the pedicle position along the z-axis. These sections were loaded into the software as unmodified grayscale images of single channels and color inverted. The threshold of each image was manually set for each image to compensate for putative differences in background staining intensity before the regions of interest were outlined. The area of immunoreactivity within each region was then calculated and summed by the software. If not indicated otherwise, Student's t test was used to determine statistical significance between corresponding samples.
Two-photon microscopy and patch-clamp recordings.
We used a custom-built two-photon microscope (2PM) (Denk et al., 1990) as described previously (Euler et al., 2009). In brief, the 2PM was equipped with through-the-objective light stimulation and two detection channels for fluorescence imaging (red, HQ 622 BP 36, and green, D 535 BP 50 or 520 BP 30; AHF/Chroma). The 2P excitation source was a mode-locked Ti/sapphire laser (Mira-900; Coherent) tuned to ≈930 nm. The 2PM was used to visualize the retinal slices by adding a fluorescent dye [0.5–1 μm sulforhodamine 101 (SR101); Sigma-Aldrich] to the perfusion medium (Euler et al., 2009) and to identify and target fluorescent protein-expressing bipolar cells for electrical recordings. During the electrical recordings, the laser was off. In addition, the microscope was equipped with infrared transillumination and a CCD camera.
Fluorescently labeled BCs were recorded in tight-seal whole-cell configuration using patch pipettes (5–15 MΩ; borosilicate; outer diameter, 1.0 mm; inner diameter, 0.58 mm, with filament; Hilgenberg) filled with the following (in mm): 100 K-aspartate, 10 KCl, 0.5 CaCl2, 5 (NMG)2-HEDTA, 5 HEPES, 1 ATP, 1 GTP, 10 K2-phosphocreatine (all Sigma-Aldrich) and 0.2 Oregon Green 488 BAPTA-1 (Invitrogen or SR101), pH 7.25, ≈267 mosmol. Data were acquired using a Multiclamp amplifier (with Digidata 1322A and pClamp8 software; Molecular Devices), digitized (5 kHz), low-pass filtered (2 kHz), and analyzed off-line using IgorPro (Wavemetrics).
Light stimulation.
Dichromatic light stimuli were generated by two alternative stimulators. The first stimulator used custom-written software running on a PC (with Windows XP; Microsoft) to present spatiotemporally structured stimuli on a small reflective liquid-crystal display (LCoS-type; i-glasses; EST), alternately illuminated by two bandpass-filtered (green, 578 BP 10; blue, 400 BP 20; AHF/Chroma) light-emitting diodes (LEDs) within each frame (Euler et al., 2009). The display was coupled into the main optical path of the microscope, and, hence, the stimuli were projected onto the retinal slice through the objective lens [XLUMPlanFL; 20× water-immersion, 0.95 numerical aperture (NA); Olympus]. The choice of the blue stimulus band was limited because the display does not efficiently modulate wavelengths <400 nm (Euler et al., 2009). The intensity (irradiance) ranges for the blue and green stimulus components were each adjusted to 50–270 (in 103 photons · s−1 · μm−2). The intensities of the two LEDs were frequently checked (and corrected, when necessary) at the level of the recording chamber using calibrated photometers (model 840, 400–1100 nm; model 818, 200–1800 nm; both Newport) set to the respective center wavelength of the LED filters (see above). For these two wavelengths, the intensities were equivalent to photo-isomerization rates (in s−1 per cone) of 2730–14,800 for blue in S-cones and 1670–9000 for green in M-cones (assuming exclusive M-opsin expression). This was calculated using the relative sensitivities of the mouse cone opsins at the stimulus wavelengths via an opsin-template (Stockman and Sharpe, 2000) fitted to the peak sensitivities (360 and 511 nm) (Jacobs et al., 1991) and assuming the light collection area of a cone ac = 0.2 μm2 (Nikonov et al., 2006). We light-adapted the slices during the experiment to the low photopic range by presenting a background intensity of ≈105 photons · s−1 · μm−2 (equivalent to ≈5100 photo-isomerizations per rod and second), which was expected to suppress ∼96.7% of the rod response (Nikonov et al., 2006).
The second light stimulator was mounted below the recording chamber and consisted of two bandpass-filtered (UV, 360 BP 10; green, 520 BP 10; AHF/Chroma) LEDs. Their light was combined by a beam splitter (400 DCLP; AHF/Chroma), focused by the condenser lens (NA, 0.63 air; Zeiss), and projected through the glass bottom of the recording chamber. Because of the lack of a spatial modulator, this device was limited to a spot of a diameter (∼500 μm) determined by an iris diaphragm. The LEDs were driven by a custom-made electronics that incorporated an open-source microprocessor board (http://www.arduino.cc). The stimulus intensities (irradiance) for UV and green were each adjusted to 1.1–24 (in 103 photons · s−1 · μm−2), equivalent to photo-isomerization rates (in s−1 per cone) of 200–4800 in both M- and S-cones. The background intensity (2.2 × 10³ photons · s−1 · μm−2; ≈590 photo-isomerizations per rod and second) was expected to suppress ∼77.1% of the rod response.
The stimulus was a bright spot on a dark background (spot diameter, 80–200 or ∼500 μm, depending on the stimulator) centered on the photoreceptors distal to the recorded BC (see Fig. 4A). Within the applied range, we did not observe any effect of stimulus diameter on chromatic tuning of BC responses; therefore, we decided to lump together data recorded with different spot diameters. The intensities of the respective blue and green components were stepped (flashes) or modulated sinusoidally (at 1 Hz, in-phase or phase-shifted by 180°) in sync or independently (see Fig. 4C–J).
Figure 4.
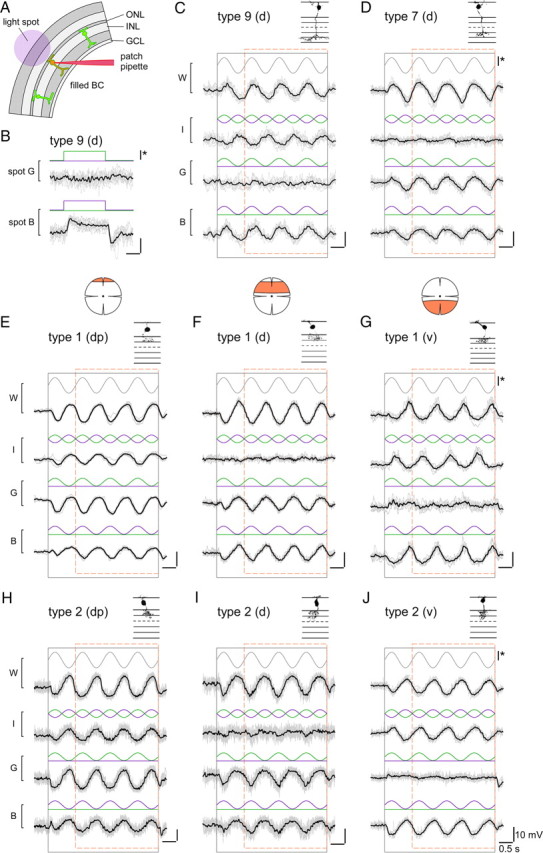
Voltage responses of different bipolar cells to chromatic stimulation. A, Schematic drawing shows experimental configuration: Fluorescently labeled bipolar cells in slices from transgenic mice were electrically recorded while presenting light spots of different wavelengths to the photoreceptors (spot diameters, 80–200 μm). B, Voltage responses of a type 9 ON bipolar cell, recorded in a CLM1 mouse, to spots of green (G) and blue (B) light. C, Voltage responses of a type 9 cell to spots for which blue and/or the green stimulus components were sinusoidally modulated in time, as indicated by stimulus traces (blue, green) above voltage responses (black): blue and green in sync (W, white), blue and green phase-shifted by 180° (I, iso-intense), green only (G) and blue only (B). The black and dashed orange rectangles indicate stimulus presentation and windows for additional analysis (Fig. 5), respectively. D–J, Voltage responses recorded from other bipolar cell types in experiments analog to C: type 7 ON bipolar cell (D) in Gus-GFP mice, type 1 OFF bipolar cells (E–G) in mito-P mice, and type 2 OFF bipolar cells in CLM12 mice. For the OFF cells, examples recorded in different retinal regions (marked by orange area) are shown: dorsal periphery (dp) (E, H), dorsal (d) (F, I), and ventral (v) (G, J). Morphologies of recorded cells (filled with SR101 during the recording; from maximum projected image stacks) are shown above traces. For B–J: Average responses (black) and n = 6–10 individual trials (gray); intensity scale bar (*), 3 × 10⁵ ph · s−2 · μm−2.
Data analysis.
Data were analyzed using Fourier analysis (cf. Hausselt et al., 2007). We took the voltage trace during the sinusoidal light stimulation, discarded the first second (to avoid initial transients) (see Fig. 5A), calculated trialwise power spectra (see Fig. 5B) for each stimulus condition, and determined amplitude and phase of the fundamental component (V1 = the frequency component at FStim = 1 Hz) (see Fig. 5C). In addition, we calculated the power spectrum of the “noise” from voltage trace sections without sinusoidal stimulation. Responses were considered significant if V1(Stim) ≥ 15 · V1(Noise). For quantifying the chromatic tuning of a cell, we trialwise calculated the chromatic contrast CBG = [V1(B) − V1(G)]/[V1(B) + V1(G)] (using blue-only and green-only stimulus responses) as well as the ratio RIW = V1(I)/V1(W) (using the responses to iso-intense and white stimuli) and took the averages. To statistically compare sets of BCs we used Wilcoxon's rank test.
Figure 5.

Analysis. A, Exemplary voltage responses of a type 2 bipolar cell to a chromatic stimulus (as described in the legend of Fig. 4). Stimulus conditions: white (W), iso-intense (I), green only (G), and blue only (B). Individual trials (n = 10) in gray; curves reconstructed from amplitude and phase of fundamental component (C) shown in red; single example trial is indicated in darker colors; the black rectangle indicates stimulus presentation. B, Power spectra (black curves) calculated from single trial responses to white (from cell in A) within the analysis window (A, dashed orange rectangle). The power spectrum for the noise (blue curve) was calculated from data recorded with steady illumination. C, Fundamental voltage component at the stimulus frequency (1 Hz) for the different stimulus conditions (W, circles; I, diamonds; G, triangles; B, squares) as a function of phase. The cell shown here responded to both blue and green light-OFF, with a slight preference for green.
Statistical model.
To statistically simulate the chromatic tuning (CBG) of bipolar cell populations (see Fig. 7), we “connected” single bipolar cells with a subset of cones [ncones = nM + nS, taken from the study by Wässle et al. (2009)], consisting of S- (nS) and M-cones (nM), using the S-cone density as S-cone contact probability (pS). For each M-cone, the opsin coexpression ratio, RSM, was drawn from a Gaussian, with center (xSM) and SD (σSM) estimated from mRNA data (Applebury et al., 2000). For S-cones, we used RSM = 1, meaning exclusive S-opsin expression. The fact that the photo-isomerization rate in the two cone types evoked by the two stimulus wavelengths differed (see above, Light stimulation) was accounted for by the relative excitation factors εblue,S (S-opsin by 400 nm), εgreen,M (M-opsin by 578 nm), εgreen,S (“cross-excitation,” S-opsin by 578 nm), and εblue,M (cross-excitation, M-opsin by 400 nm)—as photo-isomerization rate normalized to the rate evoked by blue in S-cones. The total cone input to a bipolar cell in response to blue was calculated using the following:
 |
with the maximal response contribution per cone (q = 1/ncones), and the weight of synaptic connections from S- and M-cones to bipolar cells (wsyn,S and wsyn,M, respectively). The response component to green was determined using the following:
 |
For the actual parameter values used see legend of Figure 7. From the simulated response components, we determined the chromatic contrast CBG = [V1(B) − V1(G)]/[V1(B) + V1(G)]. This was repeated for n = 5 × 10⁴ cells, and the results were plotted as histograms (see Fig. 7C,D).
Figure 7.

Statistical model of chromatic tuning in mouse bipolar cells. A, Illustration of the mosaic of mouse cone pedicles (filled) with the dendritic fields of type 1 (left) and type 2 dendritic fields overlaid (contours) in horizontal view. Pedicle colors indicate cone identity (∼4% S-cones in blue, M-cones in shades of green, representing different opsin coexpression levels), contour area reflects the difference in cone contact number for the two types of bipolar cells. B, Simplified retina (vertical view) illustrating the statistical model with some of its parameters (see Materials and Methods). C, D, Histograms showing the distribution of chromatic contrast in simulated populations of type 1 (C, red curve) and type 2 (D, dark blue curve) OFF bipolar cells (n = 5 × 10⁴ cells simulated for each type). Number of cone contacts per bipolar cell, ncones = 8 ± 1 (type 1), 5 ± 1 (type 2); probability of S-cone contacts, pS = 0 (M-cone-selective, “type 1”), 0.04 (nonselective, “type 2”); synaptic weight ratios, wsyn,S/wsyn,M, between 1 and 5 (dashed curves, as indicated), and M-cone opsin coexpression ratio, RSM (see inset in C), drawn from a Gaussian centered at xSM = 0.10 (σSM = 0.12). Note that xSM required to reproduce the overall CBG range of the recorded data was lower than expected from mRNA measurements (≈0.4) (Applebury et al., 2000). Normalized excitation factors for the two stimulus wavelengths at the two opsins were as follows: εblue,S = 1, εgreen,M = 0.61, εgreen,S = 4 × 10⁻⁸, and εblue,M = 0.40.
Results
Identifying pedicles of mouse cone types
To determine whether a specific mouse BC type contacts both M- and S-cones nonselectively or systematically avoids one cone type, M- and S-cone pedicles needed to be reliably distinguished. For simplicity, we refer to M- or M-/S-opsin-coexpressing cones as M-cones, and to exclusively S-opsin-expressing cones (true S-cones) as S-cones. We used two different immunohistochemical markers (Table 1), glypho (for size of pedicle base) and PNA (for cone invaginations), to find out whether there are differences between the synapses of S- and M-cones in mouse. We performed these stainings in whole-mounted retina of CLM1 mice (Table 1) (Berglund et al., 2006), in which S-cone-selective type 9 BCs can unambiguously be identified by their unique dendritic morphology (Haverkamp et al., 2005); these dendrites can be used to identify the S-cone pedicles (Fig. 1A,D).
Figure 1.

Mouse cone pedicles. A, B, Double labeling of GFP (green) and glypho (red) in the whole-mounted CLM1 mouse retina. Projections of confocal image stacks from OPL (outer plexiform layer) to outer INL (inner nuclear layer) are shown. Dendrites of two type 9 bipolar cells selectively contact three S-cone pedicles (circled in B). C, Histograms of the glypho-labeled area at S- (n = 25) and M-cone pedicles (n = 288). D, E, Double labeling of GFP (green) and PNA (red) in the whole-mounted CLM1 mouse retina. PNA-labeled S-cone pedicles were identified by their contacts with type 9 bipolar cell dendrites (circled in E). F, Histograms of the PNA-labeled area at S- (n = 30) and M-cone pedicles (n = 149). Scale bars: B, E, 10 μm.
Although there were no obvious differences in the overall shape of glypho-labeled S- and M-cones pedicles (Fig. 1B), the quantitative analysis of the area of the cone pedicle base—represented by the glypho fluorescence—revealed a small, statistically significant difference between the two cone types (Fig. 1C): M-cone pedicles (26.5 ± 4.9 μm2; n = 288) were on average larger than S-cone pedicles (22.4 ± 4.3 μm2; n = 25; p < 0.001). In line with this result and data from primate retina (Haverkamp et al., 2001a; Lee et al., 2005), we expected also a denser clustering of PNA at S-cones compared with M-cones. Because PNA colocalizes with mGluR6 at cone pedicles but not at rod spherules (Mataruga et al., 2007), this lectin can be used to label cone pedicle invaginations. The PNA labeling in the CLM1 retina (Fig. 1D,E) did not reveal a denser labeling; however, the PNA clusters at S-cone pedicles were much smaller than those at M-cones (Fig. 1F). PNA clusters at M-cones occupied a mean area of 5.2 ± 1.1 μm2 (n = 149), whereas those at S-cone pedicles had only a mean area of 3.4 ± 0.9 μm2 (n = 30; p < 0.001).
For both markers, the labeled area at S-cone pedicles was significantly smaller than that at M-cones, consistent with the findings from primate (Ahnelt et al., 1990; Haverkamp et al., 2001a). This strengthens the view that S-cones are not merely variations of cones (as only defined by opsin expression) but a distinct photoreceptor type. Nevertheless, neither glypho nor PNA allowed for reliably assigning identities to individual mouse pedicles. For the following experiments, we therefore visualized all cone pedicles by glypho and identified S-cones either by their contacts with S-cone-selective type 9 BCs or by costaining with S-opsin antibodies. In addition, the dendrites of distinct BC types were labeled by using either selective antibodies or transgenic mouse lines [see overview in Table 1, Fig. 8, and Wässle et al. (2009)].
Figure 8.

Summary. Schematic drawing showing the morphological types of mouse bipolar cells (Ghosh et al., 2004) [figure adapted from Wässle et al. (2009)]. Below the drawing are listed the following: selective immunocytochemical markers, transgenic mouse lines, connectivity with the two cone types (markers and mouse lines: brackets indicate weak labeling; cone contact: brackets indicate data not statistically quantified), and the resulting functional pathways.
Postsynaptic contacts of ON bipolar cells at cone pedicles
Our PNA labeling data (Fig. 1D–F) suggest that S-cone pedicles are contacted by fewer invaginating dendritic tips of ON bipolar cells than M-cones. To test this hypothesis, we immunostained for S-opsin, and glypho in whole-mounted retinas of Gus-GFP mice (Fig. 2A, Table 1), in which type 7 bipolar cells are GFP positive (Huang et al., 2003; Ghosh et al., 2004). We restricted the analysis to the dorsal retinal periphery, where the mouse cone distribution resembles that of most mammalian species and where the level of S-opsin coexpression in M-cones is very low (Szél and Röhlich, 1992; Applebury et al., 2000). S-opsin-labeled cones were traced down from the outer segment to identify the respective pedicle. We measured the area of Gus-GFP-dendritic tips (Fig. 2A5) in single optical sections (see Materials and Methods, Image analysis) at M-cone pedicles (1.7 ± 0.8 μm2; n = 31) and S-cones (1.4 ± 0.6 μm2; n = 9) and found no significant differences (p = 0.295) in the connectivity with the two cone types, suggesting that type 7 ON-BCs are nonselective. Whether this is also the case for the other ON bipolar cells (types 5, 6, and 8) (see Fig. 8) remains to be seen because of a lack of cell type-specific markers.
Figure 2.
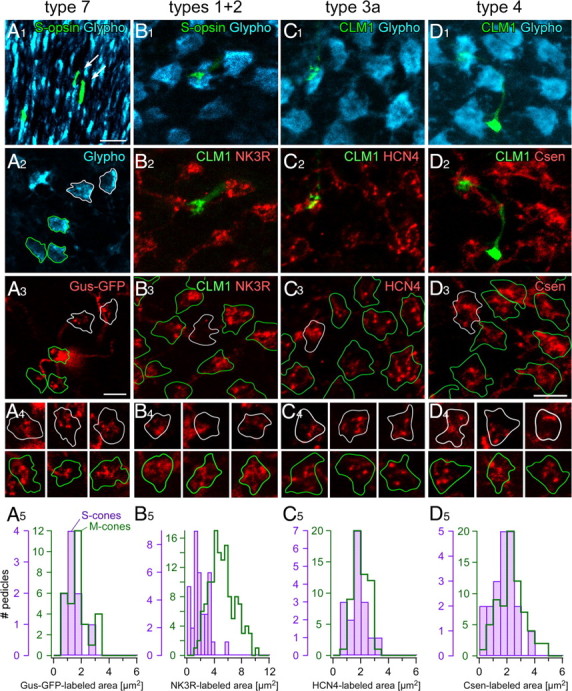
Dendritic contacts of bipolar cell types at M- and S-cones in the mouse retina. A1–A4, Whole-mounted Gus-GFP mouse retina triple labeled against S-opsin, GFP, and glypho. A1, Projection of a confocal image stack showing glypho-labeled cone outer segments (cyan) in the dorsal retina. Three S-cone outer segments are S-opsin-labeled (green), two of which (arrows) were traced to their pedicles (A2, white outlines). A2, Glypho-labeled cone pedicles in a single optical section; pedicles in contact with a type 7 bipolar cell (A3) are outlined (S-cones in white; M-cones in green). A3, Same region as in A2, with the Gus-GFP-labeled type 7 cell (red) shown. A4, Examples of dendrites from additional Gus-GFP-labeled type 7 cells analog to A1–A3 at each three S-cones (top row) and M-cones (bottom row). A5, Histograms of Gus-GFP-labeled areas at S- (n = 9) and M-cones (n = 31). B1–B3, Projections of an ApoTome image stack of horizontally sectioned CLM1 mouse retina triple labeled against GFP, NK3R, and glypho. B1, Glypho-labeled cone pedicles (cyan), one of which is contacted by a type 9 bipolar cell dendrite (green). B2, NK3R-labeled dendrites of type 1 and 2 OFF bipolar cells (same field as in B1). B3, Outlines of glypho-stained pedicles (from B1) superimposed with the NK3R-positive dendrites (red; from B2). B4, Examples of dendrites from additional NK3R-labeled cells analog to B1–B3 at each three S-cones (top row) and M-cones (bottom row). B5, Histograms of NK3R contact areas at S- (n = 36) and M-cones (n = 134). C1–C4, D1–D4, Triple staining analog to B1–B3 but with HCN4 to label type 3a OFF bipolar cells (red; C2–C4) and Csen to label type 4 OFF bipolar cells (red; D2–D4), respectively. C5, D5, Histograms of the immunolabeled contact areas at S- (HCN4, n = 17; Csen, n = 20) and M-cones (HCN4, n = 56; Csen, n = 70). Scale bars, 5 μm.
Postsynaptic contacts of OFF bipolar cells at cone pedicles
It has been shown for a few dichromatic and trichromatic mammals that the expression of postsynaptic ionotropic GluRs on the tips of OFF bipolar cells is reduced at S-cone pedicles (Haverkamp et al., 2001b; Li and DeVries, 2006; Puller et al., 2007). In monkey and ground squirrel retina, this reduction is thought to reflect that certain OFF bipolar cell types avoid contacting S-cones (Lee et al., 2005; Li and DeVries, 2006; Puller et al., 2007). A reduction of GluR1 and GluR5 at S- compared with M-cone pedicles has also been found in the mouse retina (Puller and Haverkamp, 2011). However, it is not yet known whether this reduced GluR expression is attributable to a general reduction of OFF-BC contacts at S-cones or because one (or more) OFF-BCs types avoid S-cones, as seen in ground squirrel.
To address this, we labeled horizontal cryosections of CLM1 mouse retina against glypho and one of the following OFF bipolar cell markers (Table 1): NK3R (types 1 and 2) (Fig. 2B), hyperpolarization-activated cyclic-nucleotide gated channel 4 (HCN4) (type 3a) (Fig. 2C), and calsenilin (Csen) (type 4) (Fig. 2D). Because true S-cone pedicles were reliably identified by their contacts with type 9 BC dendrites (Fig. 2B1–D1) and S-cones are uniformly distributed (Haverkamp et al., 2005) across the retina, we did not restrict this analysis to a specific retinal region. The NK3R-immunoreactive area (Fig. 2B2–B4) per pedicle was significantly reduced at S-cone pedicles (1.9 ± 1.2 μm2; n = 36) compared with M-cone pedicles (5.2 ± 1.8 μm2; n = 134; p < 0.001, Wilcoxon's rank test) (Fig. 2B5), indicating that type 1 and/or type 2 BCs may avoid S-cones. The experiments with HCN4 (Fig. 2C2–C5) (M-cones, 2.0 ± 0.6 μm2, n = 56; S-cones, 1.7 ± 0.6 μm2, n = 17; p = 0.064) and calsenilin (Fig. 2D2–D5) (M-cones, 2.3 ± 1.0 μm2, n = 70; S-cones, 1.8 ± 0.9 μm2, n = 20; p < 0.05) showed rather uniform cone pedicle labeling, suggesting that type 3a and 4 bipolar cells nonselectively contact S- and M-cones. The immunoreactive area for these cells tended to be smaller at S-cones, which is likely attributable to the smaller S-cone pedicle size (Fig. 1C,F).
Stainings against GluR5 (for cone pedicles), and protein kinase A, regulatory subunit IIβ 32 (PKARIIβ), a specific marker for type 3b bipolar cells, in horizontally sectioned CLM1 mouse retina suggested that type 3b BC dendrites also contact S-cone pedicles (data not shown). However, the dendritic PKARIIβ labeling was too weak to allow for quantitative analysis.
The only promising candidates for S-cone avoiding OFF-BCs left were type 1 and type 2 BCs. Since NK3R labels both BC types (Fig. 3A,B) (Ghosh et al., 2004; Pignatelli and Strettoi, 2004) and because selective immunomarkers for type 1 are lacking, it was difficult to examine the cone contacts of these two BC types separately. The mitoCFP-P mouse line (MitoP) (Table 1, Fig. 3A–D), which we used to target type 1 BCs for electrical recordings (see below), was not suitable for analyzing the cone contacts with type 1 cells quantitatively, because in this mouse cyan fluorescent protein (CFP) is expressed in neuronal mitochondria. Consequently, fluorescence is evident in the cell bodies, axons, and primary dendrites (Fig. 3A,C), but not in the distal dendrites of these cells. Instead, we analyzed vertical cryosections of CLM1 mouse retinas, labeled against NK3R and synaptotagmin II (Syt2). The latter antibody labels cell bodies and axon terminals of type 2 BCs (Fox and Sanes, 2007; Wässle et al., 2009) and enabled us to separate type 2 from type 1 BCs in the NK3R staining (Fig. 3E–J). We identified dendritic contacts of type 2 BCs at 14 (of 15) S-cones pedicles, indicating that type 2 does not avoid S-cones. At this point, it is important to emphasize that the genetically labeled OFF-BCs in MitoP and CLM12 mice are type 1 and type 2, respectively, and that they also can be consistently distinguished using antibodies against NK3R and Syt2: (1) It was recently shown that in CLM12 mice all the fluorescent protein-expressing BCs also are Syt2 positive and are, therefore, type 2 cells (Wässle et al., 2009). (2) We show here that, in MitoP mice, the fluorescent protein-expressing BCs are immunoreactive for NK3R but not for Syt2 and are, therefore, type 1 cells (Fig. 3A–D).
Figure 3.
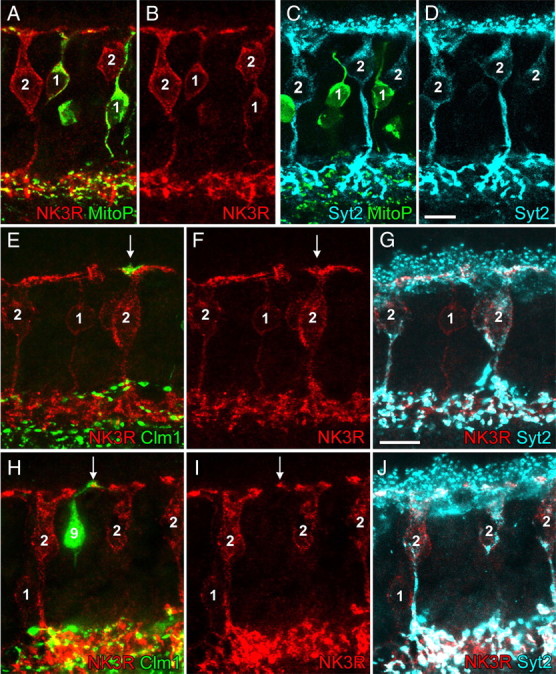
Identity and dendritic S-cone contacts of type 2 OFF bipolar cells. A–D, Identity of type 1 (1) and type 2 (2) bipolar cells in the MitoP mouse retina. A, B, Confocal image of a vertical section double labeled against NK3R (red, type 1 and 2 bipolar cells) and GFP (green, type 1 bipolar cells). C, D, Confocal image of a vertical section double labeled against Syt2 (cyan, type 2 bipolar cells) and GFP (green, type 1 bipolar cells). E–J, Projections of two confocal image stacks (E–G, H–J) of vertically sectioned CLM1 mouse retina triple labeled against GFP (green, type 9 bipolar cells), NK3R (red, type 1 and 2 bipolar cells), and Syt2 (cyan, type 2 bipolar cells). The dendritic tips of type 9 BCs were used to identify S-cone pedicles (arrows), which are contacted by dendrites of type 2 cells. Note the Syt2-negative type 1 cells (arrowheads). In H–J, the red and cyan channel intensities were selectively increased at the level of the INL to better visualize the staining of cell bodies. Scale bar, 10 μm.
In conclusion, the strongly reduced NK3R staining (types 1 and 2) at S-cones compared with M-cones, combined with the finding that type 2 BCs do form contacts with S-cones, suggest that type 1 BCs avoid S-cones. Hence, type 1 BCs are suitable candidates for the green-OFF bipolar cell of the mouse retina, whereas type 2, 3a/b, and 4 OFF-BCs presumably are chromatically nonselective, because they showed no significant preference for M- or S-cone pedicles.
Electrical responses of bipolar cells to dichromatic light stimuli
To characterize the chromatic tuning of the different BC types, we performed whole-cell patch-clamp recordings in retinal slices (Fig. 4A). To relate the light responses to the local opsin expression, we recorded from slices from selected regions along the dorsoventral axis. If not indicated otherwise, slices were taken from the dorsal third of the retina. To target type 1 and type 2 OFF-BCs, type 7 ON-BCs, and the S-cone-selective type 9 ON-BC, we used transgenic mouse lines (Table 1). We decided against pharmacologically blocking lateral interactions, such as amacrine cell input, because this would also affect interactions in the OPL, where, for example, GABA receptors are present not only in bipolar and horizontal cells but likely also in cone pedicles (Hughes et al., 1991; Vardi et al., 1992).
The light spot presented to the photoreceptor array (Fig. 4A) was composed of a blue and a green component generated by two bandpass-filtered and sinusoidally modulated LEDs (peaks at 400 and 578 nm). Note that the wavelengths were constrained by our stimulator. Because of the resulting overlap of the stimulus components with the absorption spectra of mouse cones, the blue component was expected to coexcite M-cones (with M-cone excitation by the blue light stimulus being ≈40% of the S-cone excitation by blue) (see εblue,M in Materials and Methods and Fig. 7). Therefore, even a cell that contacts exclusively M-cones with no S-opsin coexpression was expected to show (weak) blue responses. Great care was taken to keep the light intensities constant between experiments. Furthermore, the use of a two-photon microscope (with a 930 nm excitation laser) to target the fluorescent cells allowed us to define the retinal adaptation state by the visual stimulator (Euler et al., 2009). The background illumination was in the low photopic range and mostly excluded rod photoreceptor contributions (see Materials and Methods).
Four stimulation protocols were used (Fig. 4C–J): the two components were modulated in sync (“white”), phase-shifted by 180° (“iso-intense”), or separately (“green” and “blue”). The idea was that the membrane voltage of a cell with a strong chromatic tuning (Fig. 4C) would be modulated by both white and iso-intense (possibly with a phase difference, depending on its chromatic preference), while showing a clear difference in modulation by green and blue. Nonselective cells (Fig. 4D) would be strongly modulated by white, little to none by the iso-intense stimulus, and close to equally by green and blue. Since we were only interested in relative responses (e.g., green vs blue), we kept the stimuli simple by modulating both wavelengths within the same photon density range without adjusting for differences in cone sensitivities to the stimulation wavelengths.
Type 9 (“blue cone”) ON bipolar cell responses
As expected from its exclusive contacts with S-cones (Haverkamp et al., 2005; Duebel et al., 2006), type 9 BCs (n = 3 cells) were strongly modulated by iso-intense and blue but not by green stimuli (Fig. 4C); they depolarized during the upswing of the blue intensity (blue-ON). In one cell, we observed a weak hyperpolarizing modulation to green (green-OFF), suggestive of an antagonistic blue/green signal (Fig. 4B), as predicted by S-cone recordings in primate retina (Packer et al., 2010). However, we did not investigate this further, because the weak fluorescence in our CLM1 mice together with the low density of type 9 BCs (≈1% of all mouse BCs) (Haverkamp et al., 2005) rendered finding suitable cells in slices difficult.
Type 7 ON bipolar cell responses
As a representative for an ON cone BC that contacts both M- and S-cones (Fig. 2A), we recorded type 7 cells. The majority of type 7 BCs (n = 6 of 7) recorded in the dorsal retina were little modulated by iso-intense stimuli, and displayed ON responses with comparable amplitudes to green and blue (Fig. 4D). A ventrally recorded type 7 cell was strongly modulated by iso-intense (blueON) and blue stimuli, but showed little modulation to green (data not shown). This suggests that the M-opsin level in ventral M-cones is too low to have a substantial effect on the output of the cones and is consistent with measurements of the opsin mRNA ratio along the dorsoventral axis (Applebury et al., 2000). Note that the dorsal type 7 cells contained one “outlier” that displayed responses similar to the ventrally recorded cell.
Type 1 and 2 OFF bipolar cell responses
Our immunohistological data (Figs. 2B, 3E–J) indicated that type 1 (and not type 2) OFF-BCs should exhibit green-biased responses. However, at first glance, there was little difference between these two BC types in their voltage responses to the four stimulus protocols: All dorsal type 1 (n = 18) and most type 2 (n = 19 of 22) BCs depolarized during the intensity downswings of green and blue stimuli (OFF responses), with the green responses being on average larger than the blue responses (see Fig. 6). The responses substantially varied depending on where along the dorsal-ventral axis the cells were recorded. In the dorsal periphery (dp) (Fig. 4E,H), BCs showed voltage modulations (green-OFF) to iso-intense stimuli and depolarized with larger amplitude to green compared with blue. In the middorsal region (d) (Fig. 4F,I), BCs displayed little modulation to iso-intense stimuli and tended to have green and blue responses of similar amplitude. Also in the ventral retina, the responses of type 1 and type 2 BCs (Fig. 4G,J) resembled each other, looking like “OFF versions” of ventral type 7 responses: Strong voltage modulations to iso-intense and blue stimuli but almost no response to green. Nevertheless, we found one important difference between the recorded populations of type 1 and type 2 BCs: 3 (of 22) dorsal type 2 cells showed an exceptionally strong bias for blue—reminiscent of the outlier among type 7 ON-BCs—but none of the dorsal type 1 cells. A possible explanation for this would be that these type 2 cells received S-cone input—the low number of blue-biased cells would be consistent with what is expected considering type 2 dendritic field size and S-cone density (see Introduction).
Figure 6.

Chromatic tuning (blue vs green). A, Scatterplot showing the chromatic tuning of type 1, 2, 7, and 9 bipolar cells in dorsal retina. Chromatic tuning is expressed as contrast CBG = [V1(B) − V1(G)]/[V1(B) + V1(G)] (±SD) with V1(B) and V1(G) being the amplitudes of the fundamental components (=at the stimulus frequency, 1 Hz) of the responses to the blue (B) and green (G) stimulus condition, respectively (see Materials and Methods) (Fig. 5). CBG values toward the left indicate a preference for green, and CBG values toward the right, a preference for blue. Each symbol represents a cell. For each cell type, the vertical lines and shaded areas behind data points represent mean and SD, respectively. The dotted lines indicate theoretically expected contrasts for cells with pure M-cone (no coexpression) or S-cone input (see text for details). B, Scatterplot analog to A but for type 1 and 2 cells in different retinal regions along the dorsoventral axis (dp, dorsal periphery; d, dorsal; v, ventral).
Quantification of chromatic tuning of type 1, 2, 7, and 9 bipolar cells
To compare the BC populations, we quantified the responses, focusing on the modulation at the stimulus frequency FStim = 1 Hz, using Fourier analysis (Fig. 5) (see Materials and Methods). In brief, from the voltage responses for the four stimulus protocols we calculated power spectra to determine phase and amplitude of the fundamental component (V1 = amplitude at FStim). To quantify the chromatic tuning of the cells, we calculated from the fundamental component amplitudes for each cell the chromatic contrast for blue versus green, CBG = [V1(B) − V1(G)]/[V1(B) + V1(G)], and the iso-intense versus white ratio, RIW = V1(I)/V1(W) (for details, see Materials and Methods). Because the results for both were consistent (Table 2), we focus here only on the chromatic contrast (Fig. 6) (iso-intense/white plots not shown). Taking into account stimulus wavelengths and intensities as well as cone pigment absorption spectra (Jacobs et al., 2004), we expected for BCs selective for “pure” M-cones (without coexpression) or S-cones values around CBG = −0.428 and 1.0, respectively.
Table 2.
Chromatic tuning for different populations of BCs
| Type of BC | Region | n | Chromatic contrast: CBG (with blue outliers) | Ratio (I/W): RIW (with blue outliers) |
|---|---|---|---|---|
| Stimulation wavelengths (peaks, in nanometers): 400, 578 | ||||
| Type 1 | dp | 6 (0) | −0.248 ± 0.124 | −0.517 ± 0.061 |
| d | 12 (0) | −0.070 ± 0.088 | −0.273 ± 0.151 | |
| v | 3 | 0.623 ± 0.048 | 0.863 ± 0.019 | |
| Type 2 | dp | 7 (8) | −0.282 ± 0.073 (−0.200 ± 0.241) | −0.532 ± 0.130 (−0.388 ± 0.423) |
| d | 12 (14) | −0.137 ± 0.107 (−0.019 ± 0.324) | −0.252 ± 0.133 (−0.094 ± 0.421) | |
| v | 3 | 0.798 ± 0.033 | 0.926 ± 0.026 | |
| Type 7 | d | 6 (7) | −0.033 ± 0.133 (0.075 ± 0.312) | −0.149 ± 0.267 (−0.012 ± 0.438) |
| v | 1 | 0.644 | 0.869 | |
| Type 9 | d | 3 | 0.513 ± 0.043 | 0.803 ± 0.279 |
| All outliers (types 2 and 7) | d | 4 | 0.619 ± 0.224 | 0.784 ± 0.140 |
| Stimulation wavelengths (peaks, in nanometers): 360, 520 | ||||
| Type 1 | dp | 6 | −0.130 ± 0.090 | −0.365 ± 0.176 |
| Type 2 | dp | 7 | −0.196 ± 0.177 | −0.416 ± 0.201 |
Chromatic contrast (CBG = [V1(B) − V1(G)]/[V1(B) + V1(G)]) and I/W ratio, RIW, for the different BC types and retinal positions along the dorsal-ventral axis (dp, dorsal periphery; d, dorsal; v, ventral).
The chromatic contrast for type 9 ON cells was clearly blue-biased but did not reach those predicted for S-cone-selective cells (Fig. 6A, Table 2). The most likely reason for this is that because of noise, V1(G) is always larger than zero, even in the absence of a detectable modulation by green. Another possibility is the contribution from rods through gap junctions between AII amacrine cells and blue-cone BCs (Field et al., 2009). However, since our stimulation intensities were in the photopic range, rods were likely saturated (but see Demontis et al., 1993). For the other BC types—at least in the dorsal retina—CBG was clearly green biased but rarely reached the value predicted for BCs selectively contacting pure M-cones. Without the blue-biased outliers, the average CBG for type 2 BCs was more biased toward green than it was for type 1 (Fig. 6A, Table 2). With these outliers included, type 2 BCs were less biased toward green and displayed a much larger variability in CBG than type 1 BCs. In both cases, the difference between dorsal type 1 and type 2 cells was not statistically significant (p = 0.462; without outliers, p = 0.128).
To test whether the stimulus wavelengths prevented us from separating the chromatic tuning of the two OFF-BCs, we used a second, simplified stimulator that had bandpass-filtered LEDs (peaks, 360 and 520 nm) that closely matched the mouse cone peak sensitivities (360 and 511 nm, respectively) (Jacobs et al., 2004) and reduced the coexcitation of the M-opsin by blue from 40 to 11%. With this stimulator, the difference in CBG between types 1 and 2 remained statistically not significant (p = 0.836) (Table 2), which suggests that the coexcitation by the stimulation wavelengths was not a critical limitation.
To investigate the effect S-opsin coexpression in M-cones has on the chromatic contrast, we compared the groups of type 1 and 2 BCs recorded at three locations along the dorsoventral axis (Figs. 4D–J, 6B). For both OFF-BC types recorded in the dorsal periphery, we indeed measured a green shift in CBG that was statistically significant compared with middorsal cells (type 1, p < 0.01; type 2, p < 0.05) (Fig. 6B, Table 2), whereas ventrally recorded cells displayed a strong blue shift in CBG (type 1, p < 0.01; type 2 with outliers, p < 0.05) toward values in the range of those measured for type 9 cells. It is highly unlikely that these shifts are attributable to variations in contact number with true S-cones, because this cone type is homogenously distributed along the dorsoventral axis (Haverkamp et al., 2005). Instead, the shifts in CBG are in accordance with the coexpression gradient, with minimal S-opsin coexpression in M-cones in the dorsal periphery (strongest green bias) and dominant S-opsin coexpression in ventral M-cones (strongest blue bias) (Applebury et al., 2000).
In view of our histological data, it seems puzzling that type 7 ON-BCs and type 2 OFF-BCs, both of which clearly contact S-cones (Figs. 2A, 3E–J), did not substantially differ in their average chromatic contrast from type 1 OFF-BCs, which likely avoid S-cones. As mentioned above, a possible explanation is that the strongly blue-biased outliers—as were observed among type 2 (3 of 22 = 14%) and type 7 (1 of 7 = 14%) but not type 1 cells (0 of 18 = 0%)—represent BCs with S-cone input. To better understand how opsin coexpression, the low true S-cone density, and the specific cone-to-BC convergence affects BC chromatic contrast distribution, we created a simple statistical model.
Statistical model of M- and S-cone input to bipolar cells
Using data on cone density (Haverkamp et al., 2005), opsin coexpression (Applebury et al., 2000), spectral opsin sensitivity (Jacobs et al., 2004), cone-to-BC convergence (Wässle et al., 2009), as well as stimulus wavelengths, we generated dorsal BC populations and estimated their chromatic contrast (Fig. 7). An individual BC response consisted of the summed outputs of a given number of M-cones and, depending on the BC type, S-cones (Fig. 7A,B) (Eqs. 1, 2). Each M-cone output was modulated by its individual opsin coexpression ratio—randomly drawn from a Gaussian (Fig. 7C, inset). We further introduced “synaptic weight” factors (wsyn,M, wsyn,S) to be able to adjust the relative input strength of the two cone types, if necessary.
The chromatic contrast for the simulated type 1 population (no S-cone contacts, ncones = 8 ± 1) (Fig. 7A,B, left) was similar to that of the cells recorded in dorsal retina (CBG = −0.085 ± 0.061) (Fig. 7C, solid red curve) (compare with Table 2, d+dp). The simulated type 2 population (S-cone contacts permitted, ncones = 5 ± 1) (Fig. 7A,B, right) showed a distribution with two main peaks, reminiscent of the recorded data: a larger green peak that consisted of BCs contacting only M-cones (81.3% of the cells; CBG = 0.087 ± 0.078) (Fig. 7D, solid blue curve), and a smaller blue peak (side band) that consisted of cells contacting one or more S-cones. This fraction of simulated type 2 cells with S-cone contacts (16.8% with one S-cone, 1.5% with two S-cones, and 0.1% with more than two S-cones) was close to the fraction of blue-biased outliers in the recorded data (14%). The mean CBG of the blue peak depended strongly on wsyn,M. To approach the CBG of the blue peak in the model (CBG = 0.498 ± 0.100) with that of the recorded outlier cells (Table 2), we had to assume the input from S-cones to be approximately five times stronger than that from M-cones (wsyn,S/wsyn,M = 5). Nevertheless, the fraction of type 2 BCs with S-cones within reach would also be detectable at least as a side band in the simulated population when assuming smaller factors (e.g., wsyn,S/wsyn,M = 1.4) (Fig. 7D, dashed curves) (Nikonov et al., 2006). Furthermore, the model also predicts that, if type 1 cells contacted S-cones, this fraction should also be distinguishable as a separate peak (Fig. 7C, dashed curves), despite the fact that with more cone contacts (eight vs five) (Wässle et al., 2009) the S-cone input may be more “diluted.”
Discussion
A green-OFF bipolar cell pathway in mouse retina
Two lines of evidence support that type 1 BCs represent a dedicated green-OFF pathway in mouse retina (Fig. 8). The first line comes from anatomy: It was shown that the glutamate receptors of mouse OFF-BCs (GluR1, GluR5) are strongly reduced at S- compared with M-cone pedicles (Haverkamp et al., 2005; Puller and Haverkamp, 2011). The large extent of this reduction (>40% for each of the GluR subunits) cannot be explained solely by the smaller S-cone pedicle size and a slight bias of all OFF-BC types against S-cones. It is more likely that (at least) one OFF-BC type completely avoids S-cones, consistent with our immunohistological data: four of five OFF-BC types (2, 3a/b, and 4) contact both cone types, whereas type 1 BCs likely avoid S-cone contact (Figs. 2, 3). Furthermore, immunohistochemical and electrophysiological data (C. Puller, T. Schubert, and S. Haverkamp, unpublished data) revealed that type 1 expresses mainly AMPA-type receptors (GluR1), whereas the other OFF-BC types express kainate receptors and little or no GluR1. Hence, the strong reduction of GluR1 at S-cones (Puller and Haverkamp, 2011) is in agreement with type 1 BCs avoiding S-cones.
The second line of evidence comes from electrophysiology: The recorded type 2 BCs contain blue-biased outliers, which were not found among the type 1 cells (Fig. 6). As already pointed out, because of the low density of true S-cones (∼4%) and the small dendritic fields of mouse BCs (Wässle et al., 2009), it is, in fact, expected that only a fraction of cells (for each BC type) has an S-cone within reach. This was quantified in the statistical simulation (Fig. 7), which matches our data well: The percentage of recorded outliers among type 2 cells (14%) is in agreement with that predicted for type 2 cells with one or more S-cones within reach (∼20%). At least equally important, though, is the lack of blue-biased outliers among the recorded type 1 BCs: Considering that type 1 contacts on average more cones (eight vs five for type 2) (Wässle et al., 2009), one would expect ∼30% of type 1 cells (6 of 18 recorded ones) contacting S-cones. The lack of outliers in our type 1 cell sample is significant (p < 0.01, binomial test) and supports that type 1 BCs avoid S-cones.
To not only predict the presence of two peaks in the distribution of type 2 BCs but also quantitatively match the average CBG of the blue-biased fraction, we needed to assume that S-cones provide approximately five times stronger input to BCs than M-cones. Although a gain difference of this magnitude seems implausible at first, there is evidence in support of a gain difference between the two cone types. Recordings from cone–BC pairs in ground squirrel revealed that current injection into M-cones evoke larger BC responses than into S-cones (Li and DeVries, 2006). Although this is opposite to what we expect from our mouse data, it demonstrates that the cone-to-BC transmission strength can be cone type dependent. Consistent with our data, recordings from mouse cones revealed a higher gain [1.4× (Nikonov et al., 2006)] in cones that are more sensitive to 360 nm stimuli compared with those more sensitive to 510 nm stimuli. Also in line with our findings is that, in mice, data from flicker-evoked ERGs indicated a substantially higher spectral sensitivity in S-cones compared with M-cones [∼4× (Lyubarsky et al., 1999); ∼10× (Jacobs et al., 2004; Jacobs and Williams, 2007)]. Even if this may partially be attributable to the overall higher S-opsin expression in mouse [∼3:1, estimated from mRNA levels (Applebury et al., 2000; Jacobs et al., 2004; Jacobs and Williams, 2007)], it could result in a difference in output of the two cone types, consistent with our results.
Although we cannot rule out the possibility that the blue-biased outliers observed among type 2 cells represent a different BC (sub)type, we consider this unlikely because (1) all fluorescently labeled BCs in the CLM12 mouse are Syt2 positive and therefore likely comprise a single type (Wässle et al., 2009), and (2) the morphology of CLM12-positive BCs cells we recorded was highly consistent with that of type 2 (Ghosh et al., 2004). Another explanation may be slicing artifacts, although then the lack of these artifacts among type 1 cells would be surprising.
Regardless of the blue-biased outliers, we did not observe a significant difference in mean CBG between type 1 and 2 BCs. That direct or indirect rod input obscured such CBG differences is unlikely, because neither of these types contact rods (Haverkamp et al., 2006, 2008) and rod responses are almost completely saturated under our stimulus conditions. If we leave the blue-biased outliers aside, our data suggest that a type 2 BC with S-cone input does not differ substantially in CBG from one connected to strongly S-opsin coexpressing M-cones—the presence of S-cone contacting BCs would be masked by the variety in M-cone coexpression ratios. With outliers excluded, it would make functionally little difference whether a color-opponent GC contacted type 1 or 2 BCs, because in both cases the presumed mouse blue/green circuit compares S-cone signals with a mixture of S-/M-opsin-mediated signals from M-cones. If, however, S-cone signals were as dominant as suggested by the CBG of the type 2 outliers, color discrimination should benefit from selecting type 1 signals for green-OFF.
Comparison with bipolar cell types in other mammals
The situation in mouse is similar to what was reported for a cone-dominated dichromatic mammal, the ground squirrel (Li and DeVries, 2006). Ground squirrel b7 OFF-BCs [nomenclature of West (1976)] resemble morphologically mouse type 1: They stratify in inner plexiform layer (IPL) stratum 1 and selectively contact M-cones. Type b2 OFF-BCs, which stratify in the middle of the OFF sublamina of the IPL [nomenclature of DeVries (2000)]—homologous to mouse type 3a/b—are nonselective. Our data suggest that there is no explicit blue–OFF-BC pathway in mice; the same is true for ground squirrel. In contrast to what we found in mice, ground squirrels possess a second OFF-BC type (b3) (West, 1976) that avoids S-cones (Li and DeVries, 2006). However, the b3 as well as its presumed counterpart in mouse, the type 2, have small dendritic fields. Consequently, a substantial fraction of type 2 BCs find no S-cone within their dendritic field—as expected for most mouse BC types. Of the ON-BCs, we analyzed type 7, which contacts both cone types; connectivity and chromatic responses of the other mouse ON-BC types (5a/b, 6 and 8) remain to be investigated. Nevertheless, in cone pedicle stainings, they appeared to contact all cones within their reach (Wässle et al., 2009); therefore, the presence of a second chromatic ON pathway seems unlikely. This is consistent with ground squirrel data, in which none of the ON-BC types investigated so far (except for the blue-cone BC, bb) appears to completely avoid contacts with one or the other cone type (Li and DeVries, 2006).
Chromatic circuitry in the mouse retina
The presence of cone-selective BCs supports the view that a blueON/greenOFF chromatic circuitry exists in mouse—analog to the blueON/yellowOFF (S vs L+M) circuitry described in primate (for review, see Calkins, 2001; Dacey and Packer, 2003). That mouse retina contains color-opponent GCs was shown with extracellular recordings (∼2% of all GCs) (Ekesten and Gouras, 2005). A suitable bistratified mouse GC type has been morphologically described [“type 1” in the study by Schubert et al. (2005); G12 in the study by Völgyi et al. (2009)], with dendrites ramifying in IPL strata 1 and 5, where they could contact type 1 and 9 BCs. Color-opponent GCs in mouse may also be monostratified, like in guinea pig (Yin et al., 2009). To implement color-opponent monostratified GC presumably requires amacrine cells to generate the necessary green-OFF (or blue-ON) signals (for review, see Dacey and Packer, 2003).
Influence of the opsin coexpression gradient on chromatic processing
Our data indicate that the dorsoventral opsin coexpression gradient in mice (Röhlich et al., 1994) has a tremendous effect on BC chromatic tuning (Fig. 6B) and therefore likely on color discrimination. In the ventral retina, where S-opsin coexpression in M-cones is the highest (Applebury et al., 2000), BC responses are—almost regardless of the type—strongly blue-biased, suggesting that ventral color vision is seriously hampered. Opsin coexpression gradients have been found in several mammalian species, including mouse, rabbit, and guinea pig (Juliusson et al., 1994; Röhlich et al., 1994). The effect of the gradient on horizontal and ganglion cell responses has been studied in guinea pig (Yin et al., 2006, 2009), where the local opsin coexpression ratio was found to relate to the chromatic tuning of the neurons—similar to our observations in mouse BCs. Yin et al. (2009) found color-opponent GCs across the whole retina, with ventrally recorded cells showing reduced opponency. Regional opsin coexpression may, however, offer functional advantages [e.g., to enhance contrast detection against different spectral backgrounds (i.e., blue sky vs greenish-brownish ground) (Yin et al., 2006)].
In summary, our combined anatomical and electrophysiological data as well as the results from statistical simulations suggest that mice feature at least two chromatic BC pathways—green-OFF via type 1 and blue-ON via type 9 BCs. It is conceivable that they represent parts of a conserved chromatic circuit that resembles that of primates and ground squirrel, supporting the view that blue/green opponency results from a common blueprint in mammalian retina.
Footnotes
The study was supported by the Max Planck Society and Deutsche Forschungsgemeinschaft Grants FOR 701 and EXC 307. The Zebrafish International Resource Center (ZIRC) is supported by National Institutes of Health–National Center for Research Resources Grant P40 RR012546. We thank S. Nanguneri, L. Chang, and, in particular, K. Briggman and H. Wässle for helpful discussions, W. Denk for support, and B. Hamprecht, A. Hirano, S. Nakanishi, B. Pfeiffer-Guglielmi, W. Wasco, and ZIRC for providing antibodies.
References
- Ahnelt P, Keri C, Kolb H. Identification of pedicles of putative blue-sensitive cones in the human retina. J Comp Neurol. 1990;293:39–53. doi: 10.1002/cne.902930104. [DOI] [PubMed] [Google Scholar]
- Applebury ML, Antoch MP, Baxter LC, Chun LL, Falk JD, Farhangfar F, Kage K, Krzystolik MG, Lyass LA, Robbins JT. The murine cone photoreceptor: a single cone type expresses both S and M opsins with retinal spatial patterning. Neuron. 2000;27:513–523. doi: 10.1016/s0896-6273(00)00062-3. [DOI] [PubMed] [Google Scholar]
- Berglund K, Schleich W, Krieger P, Loo LS, Wang D, Cant NB, Feng G, Augustine GJ, Kuner T. Imaging synaptic inhibition in transgenic mice expressing the chloride indicator, Clomeleon. Brain Cell Biol. 2006;35:207–228. doi: 10.1007/s11068-008-9019-6. [DOI] [PMC free article] [PubMed] [Google Scholar]
- Boos R, Schneider H, Wässle H. Voltage- and transmitter-gated currents of all-amacrine cells in a slice preparation of the rat retina. J Neurosci. 1993;13:2874–2888. doi: 10.1523/JNEUROSCI.13-07-02874.1993. [DOI] [PMC free article] [PubMed] [Google Scholar]
- Calkins DJ. Seeing with S cones. Prog Retin Eye Res. 2001;20:255–287. doi: 10.1016/s1350-9462(00)00026-4. [DOI] [PubMed] [Google Scholar]
- Calkins DJ, Tsukamoto Y, Sterling P. Microcircuitry and mosaic of a blue-yellow ganglion cell in the primate retina. J Neurosci. 1998;18:3373–3385. doi: 10.1523/JNEUROSCI.18-09-03373.1998. [DOI] [PMC free article] [PubMed] [Google Scholar]
- Crook JD, Davenport CM, Peterson BB, Packer OS, Detwiler PB, Dacey DM. Parallel ON and OFF cone bipolar inputs establish spatially coextensive receptive field structure of blue-yellow ganglion cells in primate retina. J Neurosci. 2009;29:8372–8387. doi: 10.1523/JNEUROSCI.1218-09.2009. [DOI] [PMC free article] [PubMed] [Google Scholar]
- Dacey DM. Parallel pathways for spectral coding in primate retina. Annu Rev Neurosci. 2000;23:743–775. doi: 10.1146/annurev.neuro.23.1.743. [DOI] [PubMed] [Google Scholar]
- Dacey DM, Lee BB. The “blue-on” opponent pathway in primate retina originates from a distinct bistratified ganglion cell type. Nature. 1994;367:731–735. doi: 10.1038/367731a0. [DOI] [PubMed] [Google Scholar]
- Dacey DM, Packer OS. Colour coding in the primate retina: diverse cell types and cone-specific circuitry. Curr Opin Neurobiol. 2003;13:421–427. doi: 10.1016/s0959-4388(03)00103-x. [DOI] [PubMed] [Google Scholar]
- Demontis GC, Bisti S, Cervetto L. Light sensitivity, adaptation and saturation in mammalian rods. Prog Brain Res. 1993;95:15–24. doi: 10.1016/s0079-6123(08)60353-2. [DOI] [PubMed] [Google Scholar]
- Denk W, Strickler JH, Webb WW. Two-photon laser scanning fluorescence microscopy. Science. 1990;248:73–76. doi: 10.1126/science.2321027. [DOI] [PubMed] [Google Scholar]
- DeVries SH. Bipolar cells use kainate and AMPA receptors to filter visual information into separate channels. Neuron. 2000;28:847–856. doi: 10.1016/s0896-6273(00)00158-6. [DOI] [PubMed] [Google Scholar]
- Duebel J, Haverkamp S, Schleich W, Feng G, Augustine GJ, Kuner T, Euler T. Two-photon imaging reveals somatodendritic chloride gradient in retinal ON-type bipolar cells expressing the biosensor Clomeleon. Neuron. 2006;49:81–94. doi: 10.1016/j.neuron.2005.10.035. [DOI] [PubMed] [Google Scholar]
- Edwards FA, Konnerth A, Sakmann B, Takahashi T. A thin slice preparation for patch clamp recordings from neurons of the mammalian central nervous system. Pflugers Arch. 1989;414:600–612. doi: 10.1007/BF00580998. [DOI] [PubMed] [Google Scholar]
- Ekesten B, Gouras P. Cone and rod inputs to murine retinal ganglion cells: evidence of cone opsin specific channels. Vis Neurosci. 2005;22:893–903. doi: 10.1017/S0952523805226172. [DOI] [PubMed] [Google Scholar]
- Ekesten B, Gouras P, Yamamoto S. Cone inputs to murine retinal ganglion cells. Vision Res. 2000;40:2573–2577. doi: 10.1016/s0042-6989(00)00122-x. [DOI] [PubMed] [Google Scholar]
- Euler T, Hausselt SE, Margolis DJ, Breuninger T, Castell X, Detwiler PB, Denk W. Eyecup scope-optical recordings of light stimulus-evoked fluorescence signals in the retina. Pflugers Arch. 2009;457:1393–1414. doi: 10.1007/s00424-008-0603-5. [DOI] [PMC free article] [PubMed] [Google Scholar]
- Field GD, Greschner M, Gauthier JL, Rangel C, Shlens J, Sher A, Marshak DW, Litke AM, Chichilnisky EJ. High-sensitivity rod photoreceptor input to the blue-yellow color opponent pathway in macaque retina. Nat Neurosci. 2009;12:1159–1164. doi: 10.1038/nn.2353. [DOI] [PMC free article] [PubMed] [Google Scholar]
- Fox MA, Sanes JR. Synaptotagmin I and II are present in distinct subsets of central synapses. J Comp Neurol. 2007;503:280–296. doi: 10.1002/cne.21381. [DOI] [PubMed] [Google Scholar]
- Ghosh KK, Grünert U. Synaptic input to small bistratified (blue-ON) ganglion cells in the retina of a new world monkey, the marmoset Callithrix jacchus. J Comp Neurol. 1999;413:417–428. doi: 10.1002/(sici)1096-9861(19991025)413:3<417::aid-cne5>3.0.co;2-h. [DOI] [PubMed] [Google Scholar]
- Ghosh KK, Martin PR, Grünert U. Morphological analysis of the blue cone pathway in the retina of a new world monkey, the marmoset Callithrix jacchus. J Comp Neurol. 1997;379:211–225. [PubMed] [Google Scholar]
- Ghosh KK, Bujan S, Haverkamp S, Feigenspan A, Wässle H. Types of bipolar cells in the mouse retina. J Comp Neurol. 2004;469:70–82. doi: 10.1002/cne.10985. [DOI] [PubMed] [Google Scholar]
- Hausselt SE, Euler T, Detwiler PB, Denk W. A dendrite-autonomous mechanism for direction selectivity in retinal starburst amacrine cells. PLoS Biol. 2007;5:e185. doi: 10.1371/journal.pbio.0050185. [DOI] [PMC free article] [PubMed] [Google Scholar]
- Haverkamp S, Grünert U, Wässle H. The synaptic architecture of AMPA receptors at the cone pedicle of the primate retina. J Neurosci. 2001a;21:2488–2500. doi: 10.1523/JNEUROSCI.21-07-02488.2001. [DOI] [PMC free article] [PubMed] [Google Scholar]
- Haverkamp S, Grünert U, Wässle H. Localization of kainate receptors at the cone pedicles of the primate retina. J Comp Neurol. 2001b;436:471–486. doi: 10.1002/cne.1081. [DOI] [PubMed] [Google Scholar]
- Haverkamp S, Ghosh KK, Hirano AA, Wässle H. Immunocytochemical description of five bipolar cell types of the mouse retina. J Comp Neurol. 2003;455:463–476. doi: 10.1002/cne.10491. [DOI] [PMC free article] [PubMed] [Google Scholar]
- Haverkamp S, Wässle H, Duebel J, Kuner T, Augustine GJ, Feng G, Euler T. The primordial, blue-cone color system of the mouse retina. J Neurosci. 2005;25:5438–5445. doi: 10.1523/JNEUROSCI.1117-05.2005. [DOI] [PMC free article] [PubMed] [Google Scholar]
- Haverkamp S, Michalakis S, Claes E, Seeliger MW, Humphries P, Biel M, Feigenspan A. Synaptic plasticity in CNGA3−/− mice: cone bipolar cells react on the missing cone input and form ectopic synapses with rods. J Neurosci. 2006;26:5248–5255. doi: 10.1523/JNEUROSCI.4483-05.2006. [DOI] [PMC free article] [PubMed] [Google Scholar]
- Haverkamp S, Specht D, Majumdar S, Zaidi NF, Brandstätter JH, Wasco W, Wässle H, Tom Dieck S. Type 4 OFF cone bipolar cells of the mouse retina express calsenilin and contact cones as well as rods. J Comp Neurol. 2008;507:1087–1101. doi: 10.1002/cne.21612. [DOI] [PubMed] [Google Scholar]
- Hering E. Zur Lehre vom Lichtsinne. Vienna: Carl Gerold's Sohn; 1878. [Google Scholar]
- Huang L, Max M, Margolskee RF, Su H, Masland RH, Euler T. G protein subunit Gγ13 is coexpressed with Gαo, Gβ3, and Gβ4 in retinal ON bipolar cells. J Comp Neurol. 2003;455:1–10. doi: 10.1002/cne.10396. [DOI] [PubMed] [Google Scholar]
- Hughes TE, Grünert U, Karten HJ. GABAA receptors in the retina of the cat: an immunohistochemical study of wholemounts, sections, and dissociated cells. Vis Neurosci. 1991;6:229–238. doi: 10.1017/s0952523800006246. [DOI] [PubMed] [Google Scholar]
- Jacobs GH, Williams GA. Contributions of the mouse UV photopigment to the ERG and to vision. Doc Ophthalmol. 2007;115:137–144. doi: 10.1007/s10633-007-9055-z. [DOI] [PubMed] [Google Scholar]
- Jacobs GH, Neitz J, Deegan JF., 2nd Retinal receptors in rodents maximally sensitive to ultraviolet light. Nature. 1991;353:655–656. doi: 10.1038/353655a0. [DOI] [PubMed] [Google Scholar]
- Jacobs GH, Williams GA, Fenwick JA. Influence of cone pigment coexpression on spectral sensitivity and color vision in the mouse. Vision Res. 2004;44:1615–1622. doi: 10.1016/j.visres.2004.01.016. [DOI] [PubMed] [Google Scholar]
- Jacobs GH, Williams GA, Cahill H, Nathans J. Emergence of novel color vision in mice engineered to express a human cone photopigment. Science. 2007;315:1723–1725. doi: 10.1126/science.1138838. [DOI] [PubMed] [Google Scholar]
- Juliusson B, Bergström A, Röhlich P, Ehinger B, van Veen T, Szél A. Complementary cone fields of the rabbit retina. Invest Ophthalmol Vis Sci. 1994;35:811–818. [PubMed] [Google Scholar]
- Kouyama N, Marshak DW. Bipolar cells specific for blue cones in the macaque retina. J Neurosci. 1992;12:1233–1252. doi: 10.1523/JNEUROSCI.12-04-01233.1992. [DOI] [PMC free article] [PubMed] [Google Scholar]
- Kryger Z, Galli-Resta L, Jacobs GH, Reese BE. The topography of rod and cone photoreceptors in the retina of the ground squirrel. Vis Neurosci. 1998;15:685–691. doi: 10.1017/s0952523898154081. [DOI] [PubMed] [Google Scholar]
- Lee SC, Telkes I, Grünert U. S-cones do not contribute to the OFF-midget pathway in the retina of the marmoset, Callithrix jacchus. Eur J Neurosci. 2005;22:437–447. doi: 10.1111/j.1460-9568.2005.04231.x. [DOI] [PubMed] [Google Scholar]
- Li W, DeVries SH. Bipolar cell pathways for color and luminance vision in a dichromatic mammalian retina. Nat Neurosci. 2006;9:669–675. doi: 10.1038/nn1686. [DOI] [PubMed] [Google Scholar]
- Lyubarsky AL, Falsini B, Pennesi ME, Valentini P, Pugh EN., Jr UV- and midwave-sensitive cone-driven retinal responses of the mouse: a possible phenotype for coexpression of cone photopigments. J Neurosci. 1999;19:442–455. doi: 10.1523/JNEUROSCI.19-01-00442.1999. [DOI] [PMC free article] [PubMed] [Google Scholar]
- Mariani AP. Bipolar cells in monkey retina selective for the cones likely to be blue-sensitive. Nature. 1984;308:184–186. doi: 10.1038/308184a0. [DOI] [PubMed] [Google Scholar]
- Mataruga A, Kremmer E, Müller F. Type 3a and type 3b OFF cone bipolar cells provide for the alternative rod pathway in the mouse retina. J Comp Neurol. 2007;502:1123–1137. doi: 10.1002/cne.21367. [DOI] [PubMed] [Google Scholar]
- Misgeld T, Kerschensteiner M, Bareyre FM, Burgess RW, Lichtman JW. Imaging axonal transport of mitochondria in vivo. Nat Methods. 2007;4:559–561. doi: 10.1038/nmeth1055. [DOI] [PubMed] [Google Scholar]
- Nikonov SS, Kholodenko R, Lem J, Pugh EN., Jr Physiological features of the S- and M-cone photoreceptors of wild-type mice from single-cell recordings. J Gen Physiol. 2006;127:359–374. doi: 10.1085/jgp.200609490. [DOI] [PMC free article] [PubMed] [Google Scholar]
- Packer OS, Verweij J, Li PH, Schnapf JL, Dacey DM. Blue-yellow opponency in primate S cone photoreceptors. J Neurosci. 2010;30:568–572. doi: 10.1523/JNEUROSCI.4738-09.2010. [DOI] [PMC free article] [PubMed] [Google Scholar]
- Pfeiffer-Guglielmi B, Fleckenstein B, Jung G, Hamprecht B. Immunocytochemical localization of glycogen phosphorylase isozymes in rat nervous tissues by using isozyme-specific antibodies. J Neurochem. 2003;85:73–81. doi: 10.1046/j.1471-4159.2003.01644.x. [DOI] [PubMed] [Google Scholar]
- Pignatelli V, Strettoi E. Bipolar cells of the mouse retina: a gene gun, morphological study. J Comp Neurol. 2004;476:254–266. doi: 10.1002/cne.20207. [DOI] [PubMed] [Google Scholar]
- Puller C, Haverkamp S. Bipolar cell pathways for color vision in non-primate dichromats. Vis Neurosci. 2011;28:51–60. doi: 10.1017/S0952523810000271. [DOI] [PubMed] [Google Scholar]
- Puller C, Haverkamp S, Grünert U. OFF midget bipolar cells in the retina of the marmoset, Callithrix jacchus, express AMPA receptors. J Comp Neurol. 2007;502:442–454. doi: 10.1002/cne.21315. [DOI] [PubMed] [Google Scholar]
- Röhlich P, van Veen T, Szél A. Two different visual pigments in one retinal cone cell. Neuron. 1994;13:1159–1166. doi: 10.1016/0896-6273(94)90053-1. [DOI] [PubMed] [Google Scholar]
- Schubert T, Maxeiner S, Krüger O, Willecke K, Weiler R. Connexin45 mediates gap junctional coupling of bistratified ganglion cells in the mouse retina. J Comp Neurol. 2005;490:29–39. doi: 10.1002/cne.20621. [DOI] [PubMed] [Google Scholar]
- Schubert T, Kerschensteiner D, Eggers ED, Misgeld T, Kerschensteiner M, Lichtman JW, Lukasiewicz PD, Wong RO. Development of presynaptic inhibition onto retinal bipolar cell axon terminals is subclass-specific. J Neurophysiol. 2008;100:304–316. doi: 10.1152/jn.90202.2008. [DOI] [PMC free article] [PubMed] [Google Scholar]
- Stockman A, Sharpe LT. The spectral sensitivities of the middle- and long-wavelength-sensitive cones derived from measurements in observers of known genotype. Vision Res. 2000;40:1711–1737. doi: 10.1016/s0042-6989(00)00021-3. [DOI] [PubMed] [Google Scholar]
- Szél A, Röhlich P. Two cone types of rat retina detected by anti-visual pigment antibodies. Exp Eye Res. 1992;55:47–52. doi: 10.1016/0014-4835(92)90090-f. [DOI] [PubMed] [Google Scholar]
- Vardi N, Masarachia P, Sterling P. Immunoreactivity to GABAA receptor in the outer plexiform layer of the cat retina. J Comp Neurol. 1992;320:394–397. doi: 10.1002/cne.903200310. [DOI] [PubMed] [Google Scholar]
- Völgyi B, Chheda S, Bloomfield SA. Tracer coupling patterns of the ganglion cell subtypes in the mouse retina. J Comp Neurol. 2009;512:664–687. doi: 10.1002/cne.21912. [DOI] [PMC free article] [PubMed] [Google Scholar]
- Wässle H, Puller C, Müller F, Haverkamp S. Cone contacts, mosaics, and territories of bipolar cells in the mouse retina. J Neurosci. 2009;29:106–117. doi: 10.1523/JNEUROSCI.4442-08.2009. [DOI] [PMC free article] [PubMed] [Google Scholar]
- West RW. Light and electron microscopy of the ground squirrel retina: functional considerations. J Comp Neurol. 1976;168:355–377. doi: 10.1002/cne.901680304. [DOI] [PubMed] [Google Scholar]
- Wong GT, Ruiz-Avila L, Margolskee RF. Directing gene expression to gustducin-positive taste receptor cells. J Neurosci. 1999;19:5802–5809. doi: 10.1523/JNEUROSCI.19-14-05802.1999. [DOI] [PMC free article] [PubMed] [Google Scholar]
- Yin L, Smith RG, Sterling P, Brainard DH. Chromatic properties of horizontal and ganglion cell responses follow a dual gradient in cone opsin expression. J Neurosci. 2006;26:12351–12361. doi: 10.1523/JNEUROSCI.1071-06.2006. [DOI] [PMC free article] [PubMed] [Google Scholar]
- Yin L, Smith RG, Sterling P, Brainard DH. Physiology and morphology of color-opponent ganglion cells in a retina expressing a dual gradient of S and M opsins. J Neurosci. 2009;29:2706–2724. doi: 10.1523/JNEUROSCI.5471-08.2009. [DOI] [PMC free article] [PubMed] [Google Scholar]