

Abstract
The brain receives a rich flow of information which must be processed according to behavioral relevance. How is the state of the sensory system adjusted to up- or downregulate processing according to anticipation? We used magnetoencephalography to investigate whether prestimulus alpha band activity (8–14 Hz) reflects allocation of attentional resources in the human somatosensory system. Subjects performed a tactile discrimination task where a visual cue directed attention to their right or left hand. The strength of attentional modulation was controlled by varying the reliability of the cue in three experimental blocks (100%, 75%, or 50% valid cueing). While somatosensory prestimulus alpha power lateralized strongly with a fully predictive cue (100%), lateralization was decreased with lower cue reliability (75%) and virtually absent if the cue had no predictive value at all (50%). Importantly, alpha lateralization influenced the subjects' behavioral performance positively: both accuracy and speed of response improved with the degree of alpha lateralization. This study demonstrates that prestimulus alpha lateralization in the somatosensory system behaves similarly to posterior alpha activity observed in visual attention tasks. Our findings extend the notion that alpha band activity is involved in shaping the functional architecture of the working brain by determining both the engagement and disengagement of specific regions: the degree of anticipation modulates the alpha activity in sensory regions in a graded manner. Thus, the alpha activity is under top-down control and seems to play an important role for setting the state of sensory regions to optimize processing.
Introduction
In daily life our brains receive a constant flow of sensory information. To process this information effectively it must be filtered according to behavioral relevance. It is highly conceivable that this filtering involves mechanisms which adjust the processing capabilities of sensory regions according to the input's anticipated relevance. Oscillatory activity in the alpha band (8–14 Hz) was proposed to play an important role in the engagement and disengagement of sensory areas depending on task demands. Here, we investigated whether somatosensory alpha activity is top-down modulated according to the anticipation of sensory input. Further, we asked whether the alpha modulation has consequences for somatosensory discrimination performance.
The prominent posterior alpha rhythm was long considered to reflect cortical idling (Adrian and Matthews, 1934; Pfurtscheller et al., 1996). More recently, converging electrophysiological evidence suggests that alpha oscillations play an important and active role in cognitive processing (Palva and Palva, 2007). The alpha rhythm was proposed to reflect the state of the underlying neuronal network, which provides the neural context for processing (Cooper et al., 2003; Klimesch et al., 2007). In particular, alpha activity might serve to direct the flow of information through the brain and allocate resources to relevant regions (Jensen and Mazaheri, 2010). This is consistent with previous work suggesting that sensory alpha activity is involved in directing focal attention (Pfurtscheller and Lopes da Silva, 1999; Suffczynski et al., 2001).
In support of such an alpha mechanism, visual attention is known to modulate alpha activity over parieto-occipital cortex as measured with electroencephalography (Foxe et al., 1998). In visual spatial attention tasks, alpha activity shows a lateralized pattern: alpha decreases contralateral to the attended location (Sauseng et al., 2005) and increases contralateral to the ignored location, presumably to suppress distracting input (Worden et al., 2000; Kelly et al., 2006). This lateralized alpha activity correlates with visual detection performance (Thut et al., 2006; Händel et al., 2011). The functionality of alpha might be generalized to other modalities. Previously, investigating somatosensory working memory (WM) we found an increase of somatosensory alpha power (also known as the mu rhythm) ipsilateral to the tactile stimulus, which was stronger for correct than incorrect trials (Haegens et al., 2010). These results indicate that the somatosensory alpha rhythm serves the same functional role as posterior alpha.
Here, we asked whether anticipatory somatosensory alpha activity reflects the allocation of attentional resources, and to what extent it is top-down modulated by the degree of anticipation. Brain activity was measured with magnetoencephalography (MEG), while subjects performed a somatosensory discrimination task where a visual cue directed attention to the right or left hand. The strength of attentional modulation was controlled by varying cue reliability in three experimental blocks. We hypothesized that prestimulus somatosensory alpha power would modulate with respect to attention and that the strength of this modulation would increase parametrically with cue reliability. Since we posit that alpha activity plays a direct role in modulating neuronal processing, we further hypothesized that prestimulus alpha would be predictive of somatosensory discrimination performance.
Materials and Methods
Subjects.
Eighteen healthy subjects (mean age, 25 years; range, 20–33 years; 11 female) participated in the experiment after giving written informed consent according to the Declaration of Helsinki. All subjects had normal or corrected-to-normal vision and were right-handed.
Materials.
Electrical stimuli were delivered with two constant-current high-voltage stimulators (Digitimer Ltd) to the left and right thumb. The intensity (left-hand mean, 2.9 mA, range, 1.9–3.8 mA; right-hand mean, 3.3 mA, range, 2.5–4.5 mA) of the 0.2 ms electric pulses was set to 150% of the subject's sensory threshold level. This level was established during a practice session before the recordings, for each thumb independently.
Experimental paradigm.
Subjects performed a somatosensory spatial attention task (Fig. 1A), in which they had to discriminate between two target frequencies presented to the left or right hand thumb. A trial started with a fixed 1.2 s baseline during which a fixation cross was presented. For the following 0.2 s a visual cue (arrow) replaced the fixation cross. The arrow pointed either to the left or right, instructing the subject which hand to attend to while maintaining fixation. After a prestimulus interval (jittered, mean: 1.4 s, range: 1.0–1.8 s) an electrical target stimulus (240 ms pulse train) was presented to the cued hand. At onset of the target stimulus, a distracter stimulus (one pulse) was presented to the non-cued hand. The target stimulus could either be of low or high frequency. The low (either 25 Hz or 33.3 Hz) and high frequencies (41.7, 50, or 66.7 Hz) were established individually for each subject during a practice session before recordings. The frequencies were selected individually such that each subject could execute the task above chance level but below ceiling performance. Furthermore, the practice session was used to familiarize the subject with the task.
Figure 1.

Experimental paradigm and behavioral results. A, Subjects performed a tactile stimulus discrimination task where a visual cue directed attention either to their right or left hand. The strength of attentional modulation was controlled by varying the reliability of the cue in three experimental conditions (100, 75, or 50% valid cueing). Subjects had to discriminate between two target frequencies, presented as electrical pulse trains to the cued thumb on valid cue trials, and to the non-cued thumb on invalid cue trials. B, Discrimination rate (left) and reaction time (right) for each of the experimental conditions, for valid (blue) and invalid cue trials (red) separately. Error bars indicate the SEM. Behavioral performance on invalid trials was significantly worse than on valid trials, both in terms of lower discrimination rate (p < 0.05) and slower RT (p < 0.001). Invalid cues had a more detrimental effect on RT for the 75% condition than for the 50% condition (p < 0.01). Subjects were faster on the 100% condition than on the 75% (p < 0.05) or 50% conditions (p < 0.01).
The task of the subject was to indicate by button press with the right index finger whether the low-frequency (lower button) or high-frequency (upper button) target was presented. The response window was limited to 1.5 s after stimulus offset. Immediately after the button press, visual feedback was presented. For correct responses the fixation cross turned green, and for incorrect or no responses it turned red (for 0.2 s). After the feedback the next trial started.
In one experimental block, the visual cue was always valid, meaning that in 100% of the trials the later presented target stimulus was on the side indicated by the arrow. This condition is further referred to as the 100% condition. In the block of the 75% condition, the cue was invalid on 25% of the trials. On invalid cue trials, the distracter was presented to the cued hand, whereas the target stimulus was presented to the non-cued hand. In this case, the subject had to respond to the non-cued hand. Distracter and target stimuli were sufficiently different, allowing the subject to recognize the cue as invalid. In the block of the 50% condition, half of the cues were invalid, leaving the cue uninformative. The subjects were instructed to always indicate the frequency of the target stimulus (high or low). At the start of each block, subjects were instructed on the cue reliability (being 100%, 75% or 50%) and completed 200, 480 and 200 trials in each condition respectively. The block order was counterbalanced over subjects.
Subjects were seated upright in the MEG system with their arms comfortably positioned on the armrests beside them. They were instructed not to move during the experiment and keep fixation. In between the blocks and twice within the 75% condition subjects had a short break but remained seated in the MEG system.
Data acquisition.
Ongoing brain activity was recorded at a sampling frequency of 1200 Hz, using a whole-head MEG system with 275 axial gradiometers (CTF MEG systems, VSM MedTech Ltd). The data were down-sampled offline to a sampling frequency of 300 Hz. The subject's head location relative to the MEG sensors was measured at the start and end of each session using marker coils placed at the nasion and both ear canals. In addition, anatomical magnetic resonance (MR) images of the subjects' brains were acquired using a 1.5 T Siemens Magnetom Sonata system. During MR acquisition, similar earplugs, now with a drop of Vitamin E in place of the coils, were used to allow coregistration of the MR image and MEG data.
Data analysis.
Behavioral performance on the task was computed in terms of discrimination rate (percentage correct responses) and reaction times (RTs) on correct trials. To analyze the behavioral results, a repeated-measures ANOVA with factors validity (valid and invalid cue) and reliability (75% and 50%) was applied.
For the MEG data analysis we used custom-build Matlab code and the Matlab-based FieldTrip toolbox, which is developed at the Donders Institute for Brain, Cognition and Behaviour (http://www.ru.nl/neuroimaging/fieldtrip/).
Because of the jittered window length between cue and stimulus onset, the data were processed twice: once cue-locked (i.e., with respect to cue onset) and once stimulus-locked (i.e., with respect to stimulus onset). For all the results reported, the stimulus-locked approach was used, unless indicated otherwise.
For each subject, all trials were first cleaned from artifacts. This was done on all conditions combined. Independent component analysis (ICA) (Jung et al., 2000) was used to identify eye artifacts (eye movements and eye blinks) in the data. The ICA components were visually inspected and those representing eye artifacts were then projected out of the data. Further, trials with extremely high variance (containing, e.g., MEG superconducting quantum interference device jumps or muscle artifacts) were removed from the data (on average 3.75% of trials).
For the sensor-level analysis, planar gradients of the MEG field distribution were calculated using a nearest-neighbor method comparable to the method described by Bastiaansen and Knösche (2000), which makes interpretation of the sensor-level data easier, as sensors showing maximal activity are typically located above the actual sources.
Spectral analysis.
Power spectra were calculated for each MEG sensor using the planar gradient representation of the data. From each trial, a segment of data (1 s) directly before stimulus onset (i.e., stimulus-locked) was extracted. This segment was multiplied with a Hanning taper and power of 5–35 Hz was computed using a fast Fourier transform (FFT) approach. To inspect the time course of the frequency effects, we also computed time-frequency representations (TFRs) of the power spectra. To this end we used an adaptive sliding time window of four cycles length (Δt = 4/f) for each frequency represented and applied a Hanning taper before estimating the power using an FFT approach.
Source analysis.
To localize the sources of the alpha band activity we applied a beamformer approach, using an adaptive spatial filtering technique (Gross et al., 2001; Schoffelen et al., 2008). This beamformer technique uses the Fourier spectra, which were obtained by applying a multitaper FFT approach to the stimulus-locked segments (1 s) from the 100% condition, centered at 11 Hz with five orthogonal Slepian tapers resulting in ±3 Hz smoothing (Percival and Walden, 1993), i.e., a band of 8–14 Hz. We constructed a realistically shaped single-shell description of the brain for each subject, using the individual anatomical MR image. The brain volume of each individual subject was divided into a grid with a 1 cm resolution and normalized toward the template MNI brain (International Consortium for Brain Mapping, Montreal Neurological Institute, Canada) using SPM2 (http://www.fil.ion.ucl.ac.uk/spm). Lead fields were calculated for all grid points (Nolte, 2003). With the lead fields and the Fourier spectra (of attention-left and attention-right combined), a common spatial filter was constructed for each grid point, for each subject. Using this common filter, the spatial distribution of power was estimated for attention-left and attention-right separately. Sources that differ between the two attention conditions (left vs right) could now be localized. Note: for source analysis, the data of 17 subjects was used, as for one subject head localization data during the MEG recording were missing due to technical problems.
Statistical analysis.
Statistical analysis was performed both on sensor and source level, using the same procedure. For each subject, trials were averaged for attention left and right separately within each condition and then normalized in the following way: (attention-left − attention-right)/(attention-left + attention-right). This approach gives negative values for stronger decrease in the attention-left condition, and positive values when there is a stronger decrease in the attention-right condition. This procedure also reduces intersubject variability in the power estimates, thus providing a convenient normalization.
To establish whether the difference between attention left and right was significantly different from 0, a cluster-based nonparametric randomization test was applied (Maris and Oostenveld, 2007). By clustering neighboring sensors (or grid points in the source analysis) that show the same effect, this test deals with the multiple-comparisons problem and at the same time takes into account the dependency of the data. The normalized data were averaged over the alpha frequency range (8–14 Hz) and for each sensor a dependent-samples t value was computed (testing the attention left-right contrast vs 0). All samples were selected for which this t value exceeded an a priori threshold (uncorrected p < 0.05), and these were subsequently clustered on the basis of spatial adjacency. The sum of the t values within a cluster was used as cluster-level statistic. The cluster with the maximum sum was subsequently used as test statistic. By randomizing the data across the two conditions (i.e., the normalized contrast and 0) and recalculating the test statistic 2000 times, we obtained a reference distribution of maximum cluster t values to evaluate the statistic of the actual data.
Alpha-lateralization index.
To capture the relative prestimulus alpha distribution over both hemispheres in one measure, a lateralization index of alpha power was calculated for each subject, using sensors within predefined regions of interest (ROIs): alpha-lateralization index = (alpha-ipsilateral-ROI − alpha-contralateral-ROI)/(alpha-ipsilateral-ROI + alpha-contralateral-ROI).
Contra- and ipsilateral refers to the hemispheres with respect to the cue. This index is comparable to the one applied by Thut et al. (2006), and gives a positive value when alpha power is higher over the ipsilateral hemisphere and/or lower over the contralateral hemisphere (ipsilateral > contralateral), and a negative value for the opposite scenario (contralateral > ipsilateral). The ipsi- and contralateral “somatosensory” sensors used to compute the alpha-lateralization index were selected for each subject individually, based on the poststimulus response to guarantee an orthogonal selection of sensors. For all MEG sensors, the average poststimulus power was computed for the combined alpha and beta band (8–26 Hz) in a 500 ms time window. This time-frequency window contained a strong (evoked) stimulus response, as observed from the grand-average TFR. For each subject, a contrast was computed between stimulus-left and stimulus-right (in a fashion similar to that of the attention contrasts computed previously), and 15 left-hemispheric and 15 right-hemispheric sensors were selected based on the strongest stimulus response (note: frontal and occipital sensors were excluded from this selection process to avoid contamination). These selected sensors were subsequently used for the computation of the prestimulus alpha lateralization.
To test for differences in the alpha-lateralization index over conditions (100, 75, and 50%) a linear regression analysis was used. To test for differences in the alpha-lateralization index between good and bad performance, i.e., correct versus incorrect trials and low-RT versus high-RT trials (divided by a median split), paired-sample t tests were performed within each condition. A linear regression analysis was used to assess the modulation of these differences by cue reliability.
Results
Performance increased with cue reliability
The average performance over all conditions in 18 subjects was a discrimination rate of 77.6 ± 8.1% with an RT of 530.7 ± 100.2 ms (RT was computed on correct trials only). Figure 1B shows the average performance per reliability-condition, separately for validly and invalidly cued trials. For the 75% and 50% reliability conditions, a repeated-measures ANOVA was performed. There was neither a significant effect of reliability on discrimination rate (F(1,17) = 0.847, p = 0.370), nor on RT (F(1,17) = 1.479, p = 0.241). There was a significant effect of validity both on discrimination rate (F(1,17) = 6.534, p < 0.05) and on RT (F(1,17) = 23.239, p < 0.001), with higher discrimination rates and lower RTs for validly cued trials. Furthermore, the interaction effect between reliability and validity was not significant for discrimination rate (F(1,17) = 0.458, p = 0.508), but showed a highly significant effect for RT (F(1,17) = 11.715, p < 0.01).
The performance on the 100% reliability condition was compared with the other reliability conditions with paired-sample t tests. In terms of discrimination rate there were no differences between the reliability conditions (100% vs 75%, t(17) = 0.687, p = 0.502; 100% vs 50%, t(17) = 1.208, p = 0.244), but subjects were faster on the 100% condition compared with the other two conditions (100% vs 75%, t(17) = −2.445, p < 0.05; 100% vs 50%, t(17) = −2.960, p < 0.01).
To summarize, the behavioral results confirmed the expected outcome: performance on invalid trials was significantly worse than on valid trials, both in terms of discrimination rate and RT. Invalid cues had a more detrimental effect on RT for the 75% condition than for the 50% condition. Subjects were faster on the 100% condition than on the 75% or 50% conditions.
Prestimulus somatosensory alpha lateralization reflects direction of attention
Using the stimulus-locked data from the 100% condition, we assessed whether a visuo-spatial cue lead to somatosensory prestimulus lateralization in the alpha band. Prestimulus alpha power (8–14 Hz) for the combined planar gradients was calculated for left and right attention conditions separately, and the contrast between left and right attention was computed as (attention-left − attention-right)/(attention-left + attention-right). Spectral analysis revealed a lateralized pattern of alpha power. A cluster-based randomization test over the sensors further showed that the alpha lateralization had two significant clusters of sensors above left and right sensorimotor regions (p < 0.05 for both clusters) (Fig. 2A).
Figure 2.

Prestimulus somatosensory alpha lateralization. A, Topographic plot showing prestimulus (t = −1 to 0 s) alpha power (8–14 Hz) lateralization in sensors over sensorimotor regions. Sensors showing significant modulation (p < 0.05) are marked with asterisks. B, Average TFR of the sensors identified in A, showing sustained decrease of alpha activity during the prestimulus interval (t = −1 to 0 s). Left-hemispheric sensors were mirrored to combine them with the right-hemispheric sensors (scale as in A). C, Alpha power source reconstructions obtained using beamforming are shown on a standardized brain volume. Lateralized alpha activity is located in sensorimotor cortex (including Brodmann areas 1, 2, 3). The color code represents t values obtained from the comparison between attention to left and right hand. The t values are masked at a p value of <0.1, indicating a significant effect for the right somatosensory source (p < 0.01) and a trend for the left source (p = 0.062). All plots are showing power as a contrast between attention left and attention right in the 100% condition, grand-averaged over 18 subjects (note: 17 subjects were included in the source reconstruction).
A time-frequency analysis of the lower frequencies (5–35 Hz) showed that alpha lateralization was sustained throughout the 1 s before stimulus onset (Fig. 2B) and that none of the other lower frequencies between 5 and 35 Hz showed a substantial modulation.
Using a beamforming approach, the sources of the prestimulus alpha lateralization could be localized to sensorimotor regions (Fig. 2C), with the peaks of activity in primary somatosensory cortex [i.e., postcentral gyrus, including Brodmann areas 1, 2, and 3, according to the atlas by Talairach and Tournoux (1988)] for both hemispheres. A cluster-based randomization test over the 3D source space showed that the lateralized difference in alpha activity between attention-left and attention-right was significant for the right somatosensory source (p < 0.01) and showed a trend for the left source (p = 0.062). Note that data of only 17 subjects was used for the source analysis.
Prestimulus somatosensory alpha lateralization increases with cue reliability
Prestimulus alpha power for attention-left versus attention-right was then computed for each of the experimental conditions (i.e., 100, 75, and 50%) as described above and compared across conditions (Fig. 3A). The alpha lateralization was significant on sensor level both in the 100% (see before) and 75% condition (p < 0.01 for two clusters above left and right sensorimotor regions). For the 50% condition the effect was much weaker, however, a significant cluster was found in sensors over left sensorimotor regions (p < 0.05).
Figure 3.

Prestimulus somatosensory alpha lateralization increases with cue reliability. A, Topographic plots showing prestimulus (t = −1 to 0 s) alpha power (8–14 Hz) lateralization over sensorimotor regions, for each of the reliability conditions (100%, 75%, 50%). Sensors showing significant modulation due to attention (p < 0.05) are marked with asterisks. All plots are showing power as a contrast between attention left and attention right, grand-averaged over 18 subjects. B, Bar graph showing a significant (p < 0.01) parametric decrease of the alpha-lateralization index (computed for each subject using individual ROIs, subsequently averaged over 18 subjects) with decreasing cue reliability. Error bars indicate the SEM.
To further assess the differences in alpha lateralization between the conditions, the alpha-lateralization index was computed for each condition in each subject separately using the subject-specific sensor selection based on the stimulus response. There was a significant parametric decrease of the alpha-lateralization index with decreasing cue reliability (Fig. 3B) as assessed by linear regression (R2 = 0.150, p < 0.01).
This decrease could not be explained by a difference in overall ipsilateral plus contralateral alpha power between the conditions (data not shown), as a similar test on the denominator (normalized per subject using the average power over conditions) in the alpha-lateralization index showed no significant effect (R2 = 0.000, p = 0.964).
Prestimulus somatosensory alpha lateralization is a strong predictor of performance
Next, we investigated whether the alpha lateralization was predictive of the subjects' performance. For the 100% condition, we contrasted correct with incorrect trials (Fig. 4A) and trials with low RT versus trials with high RT (Fig. 4B). This analysis shows that a higher alpha-lateralization index precedes better performance: both correct trials and fast RTs are related to high alpha lateralization values whereas incorrect trials and slow RTs show less alpha lateralization. Paired-sample t tests confirmed that these differences were significant (correct vs incorrect: t(17) = 2.187, p < 0.05; low vs high RT: t(17) = 2.556, p < 0.05).
Figure 4.

Prestimulus somatosensory alpha lateralization influences task performance. A, B, Bar graphs showing significant difference (p < 0.05) in alpha lateralization between correct and incorrect trials (A) and between low- and high-RT trials (B) for the 100% condition. The alpha-lateralization index was computed for each subject using individual ROIs with respect to the sensors. Error bars indicate SEM. C and D show similar graphs for the 75% condition. Here, no significant effects were observed (p > 0.05), although for RT a near significant trend (p = 0.056) was observed, indicating that strong alpha lateralization led to faster RTs on valid cue trials, whereas on invalid cue trials this was detrimental for performance.
This was further substantiated by analysis of the invalid cue trials from the 75% condition, on which an opposite pattern was observed: high alpha lateralization was detrimental for performance on invalid cue trials (Fig. 4C,D). These effects were tested using a paired-sample t test comparing the differences in the alpha-lateralization index between correct (low RT) and incorrect (high RT) trials for valid versus invalid. For discrimination rate this effect was not significant (t(17) = 0.638, p = 0.532), for RT a near significant trend was observed (t(17) = 2.048, p = 0.056).
As expected, in the 50% condition alpha-lateralization index values were rather low and did not correlate with performance (data not shown): both correct and incorrect, and low- and high-RT trials showed similarly low alpha-lateralization index values (in the range of 0.01–0.02; correct vs incorrect: t(17) = −0.436, p = 0.669; low vs high RT: t(17) = 0.375, p = 0.712).
Next, we compared the differences in the alpha-lateralization index between good and bad performance (i.e., correct vs incorrect trials and low-RT vs high-RT trials) over conditions, to see whether this was modulated by cue reliability (Fig. 5A,B). A linear regression analysis showed that with decreasing cue reliability, there was a strong trend toward decreasing differences in the alpha-lateralization index between correct and incorrect trials (R2 = 0.043, p = 0.081). This effect was significant for reaction times: with decreasing cue reliability, the difference in the alpha-lateralization index between low- and high-RT trials becomes smaller and eventually flips from positive to negative values (R2 = 0.135, p < 0.01). Note that for this analysis we distinguished the following conditions: 100%, 75% (valid trials from 75% condition), 50% (all trials), and 25% (invalid trials from 75% condition—which is not the exact equivalent of a 25% reliable cue).
Figure 5.
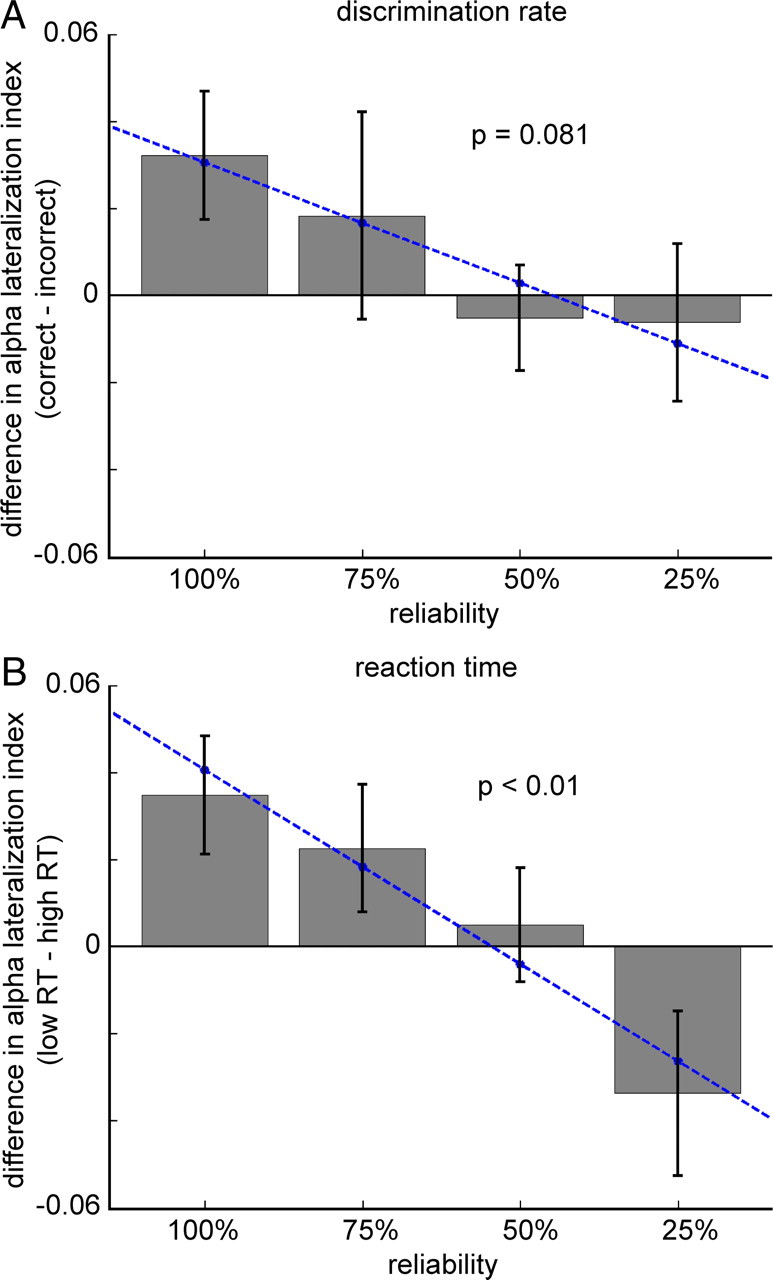
Prestimulus somatosensory alpha lateralization influences task performance in a graded manner. A, B, Bar graphs showing that cue reliability modulates the difference in alpha lateralization between correct and incorrect trials (trend, p = 0.081) (A) and between low- and high-RT trials (significant, p < 0.01) (B). The alpha-lateralization index was computed for each subject using individual ROIs. Error bars indicate SEM. Note that the 25% condition refers to the invalid trials from the 75% condition.
Alpha lateralization: contralateral decrease or ipsilateral increase?
The results presented so far on somatosensory alpha lateralization do not reveal whether the effects considered are explained by a contralateral decrease or an ipsilateral increase, or a combination of the two. To assess this, we inspected the cue-locked time courses of ipsi- and contralateral alpha power, for left and right ROI separately (Fig. 6A,B). This reveals an interesting pattern: for the left ROI, both ipsi- and contralateral attention conditions lead to a decrease in alpha power compared with pre-cue values. However, in the right ROI, we observed a contralateral decrease but a slight ipsilateral increase. To assess the statistical significance of these effects we performed a cluster-based randomization test, contrasting the cue/post-cue window (t = 0–1.2 s) with the baseline period (t = −0.5 to 0 s). We used subject-specific ROIs and normalized the alpha time course per subject with a log transform. For the left ROI, the observed decreases were significant for both conditions (Fig. 6, p < 0.05; significant time samples indicated). For the right ROI, only the contralateral attention condition lead to a trend (p = 0.064).
Figure 6.

Contralateral decrease or ipsilateral increase? Cue-locked time courses of contra- and ipsilateral alpha power in the 100% condition, for left and right ROI separately, grand-averaged over 18 subjects (ROIs were defined for each subject individually). Blue traces show attention-left, red traces show attention-right, dashed lines indicate ipsilateral, straight lines indicate contralateral side, gray area indicates the prestimulus window. A, B, For the left ROI (A), both ipsi- and contralateral attention conditions lead to a significant decrease of alpha power (p < 0.05, significant time samples are indicated by the horizontal traces) compared with pre-cue values (cue onset, t = 0 s; stimulus onset, t = 1.2–2.0 s, depending on jitter), whereas in the right ROI (B), a contralateral decrease (trend, p = 0.064) but an ipsilateral increase (not significant) was observed.
To further explore this, we repeated the contrasts for correct versus incorrect and low-RT versus high-RT trials for the 100% condition, using the ipsi- and contralateral alpha power separately, instead of the alpha-lateralization index. Alpha power was computed for each subject using individual ROIs and normalized by the subject's mean power (data not shown). We observed lower contralateral alpha power (trend: t(17) = −1.962, p = 0.066) and higher ipsilateral alpha power for correct versus incorrect trials (t(17) = 0.971, p = 0.345). Neither of these effects were significant by themselves, whereas the lateralization effect (using both contra- and ipsilateral activity) was significant, as reported before. Interestingly, there was significantly lower contralateral alpha power when contrasting low- with high-RT trials (t(17) = −2.775, p < 0.05), but no ipsilateral difference in alpha power (t(17) = −0.068, p = 0.946).
Discussion
As predicted, prestimulus alpha power in primary sensorimotor regions was strongly lateralized with respect to the direction of somatosensory attention (left versus right hand). The alpha band lateralization increased parametrically with cue reliability. Importantly, the degree of alpha lateralization predicted the subjects' discrimination performance: both accuracy and speed of response improved with lateralization. Our findings strongly suggest that a top-down drive is involved in determining the alpha band activity and thus the state of the somatosensory cortex. The “alpha state” then reflects an anticipatory mechanism which biases the detection ability and consequently behavioral performance.
Alpha lateralization reflects general mechanism
Interestingly, the prestimulus alpha lateralization in the somatosensory system behaves similarly to posterior alpha activity observed in visual attention tasks (Foxe et al., 1998; Worden et al., 2000; Sauseng et al., 2005; Kelly et al., 2006). The sources of the prestimulus alpha lateralization were localized to early sensorimotor regions, with the peak of activity in primary somatosensory cortex. Thus, anticipatory alpha activity is focal and functionally specific to the sensory areas in question. This study extends the notion that alpha band activity is involved in shaping the functional architecture of the working brain by determining the functional engagement and disengagement of specific regions: alpha power decreases in task-relevant areas and increases in task-irrelevant areas.
Alpha lateralization under top-down control
Previous work suggested that spontaneous fluctuations in ongoing alpha activity can modulate visual and somatosensory perception (Linkenkaer-Hansen et al., 2004; van Dijk et al., 2008; Busch et al., 2009; Mathewson et al., 2009; Zhang and Ding, 2010). Here, we show this modulation is under top-down control. Not only is the alpha activity lateralized with respect to the spatial orientation of attention, but the strength of this lateralization is further modulated by the information about cue reliability. The more likely information about important sensory input is valid, the stronger is the modulation of the system via alpha. This view is further supported by previous work suggesting that somatosensory alpha activity is modulated by (pre)frontal regions (Haegens et al., 2010; Zhang and Ding, 2010). To the best of our knowledge, this is the first study to show that subjects can use information about cue reliability to modulate their somatosensory alpha levels in a graded manner to be optimally prepared for processing upcoming stimuli.
Alpha lateralization required for optimal performance
The current result is complementary to our previous finding demonstrating that increased alpha activity over the ipsilateral somatosensory regions leads to better somatosensory WM performance (Haegens et al., 2010). Further, it is in line with results from the visual domain: higher ongoing visual alpha activity has been related to lower visual detection performance (Hanslmayr et al., 2007; van Dijk et al., 2008). Furthermore, alpha lateralization over parieto-occipital regions has been correlated with detection of attended and successful inhibition of unattended visual stimuli (Thut et al., 2006; Händel et al., 2011). Recent TMS studies entraining posterior alpha oscillations strongly suggest that the influence of alpha activity on perception is causal rather than merely correlational (Sauseng et al., 2009; Romei et al., 2010).
Whereas we report a linear relationship between alpha lateralization and performance, previous work on spontaneous fluctuations of ongoing somatosensory alpha activity reported an inverted u-shape relation between contralateral prestimulus alpha activity and detection of near-threshold somatosensory stimuli (Linkenkaer-Hansen et al., 2004; Zhang and Ding, 2010). These studies report that performance is optimal (in terms of detection rate and RT) at intermediate levels of contralateral alpha activity. With both weak and strong contralateral alpha activity, performance drops. It should be noted that in contrast to our findings, these two studies relied on spontaneous fluctuations in alpha band activity. It is possible that spontaneous alpha fluctuations occupy a broader range than the cue-induced alpha activity we report; possibly our data only reflect the latter flank of the inverted u-shape. In a non-cued paradigm other factors not directly related to the task, such as drowsiness, sleep onset and movement, could reduce the measure of alpha power while at the same time impairing performance. In a related study with a similar non-cued paradigm (Monto et al., 2008), it is apparent that non-cued detection tasks can be rather boring and include relatively long periods (i.e., up to several tens of seconds) of no detection. This is quite different from the cued-paradigm we used here, which keeps subjects alert as an active direction of attention is required on each trial. Thus, there is probably quite a difference in the range of alpha activity observed in spontaneous random fluctuations compared with the fluctuations observed when attention is directed.
Recently, Jones et al. (2010) reported functionally relevant modulation of somatosensory alpha activity in a cued spatial attention study, where subjects had to attend to either their hand or foot. When attention was directed to the hand, alpha activity in the somatosensory “hand area” decreased, whereas it increased when attention was directed to the foot. This is consistent with previous reports involving the alpha activity with focal attention in the somatosensory system (Pfurtscheller and Lopes da Silva, 1999; Suffczynski et al., 2001). In a cued-attention paradigm, Jones et al. report a linear relationship between alpha activity and performance, in line with our findings and in contrast with the aforementioned inverted u-shape relationship. They report a decrease of performance with increasing alpha power, which is consistent with our findings.
While our results are in line with those of Jones et al., our study does add several new insights. First, we explored interhemispheric allocation of attention rather than intrahemispheric. We show that the lateralization of alpha activity between contra- and ipsilateral sides (rather than just local alpha) is a strong predictor of performance, both in terms of discrimination rate and RT. In principle Jones et al. could have related detection performance for the hand to alpha activity from the foot area (and vice verse). However, given the spatial smearing of MEG, it is problematic to reliably separate alpha activity from the hand and foot area in the same hemisphere. Further, the improved performance with alpha decrease reported by Jones et al. could potentially be explained by a speed-accuracy trade-off. We exclude this possibility by showing that both accuracy and RT improve with stronger alpha lateralization. Most importantly, we show that there is a gradedness introduced by cue reliability: anticipation allocation by alpha activity is not a binary switch but reflects the environment in a probabilistic manner.
Lateralization mainly driven by contralateral decrease
It is an ongoing debate whether alpha lateralization is mainly driven by an active decrease or increase. In the current study, lateralization was mainly driven by a decrease of prestimulus alpha power contralateral to the cued side, but further enhanced by a slight ipsilateral increase of alpha power in the case of attention to the right hand. It remains unclear whether this reflects a genuine difference between the left and right hemispheres (all subjects were right-handed), or whether it is due to the fact that the right hand was used as response hand. A general preparation for the motor response could explain the decrease in alpha activity over left sensorimotor cortex, in response to both the ipsi- and contralateral cue. Future research should address this issue by comparing left and right hemispheric alpha power modulation in different response paradigms. In any case, ipsilateral alpha activity was always higher than contralateral, both within hemispheres and within attention conditions, and it is this lateralization that best reflects the attentional bias (Thut et al., 2006).
A recent visual WM study by Sauseng et al. (2009) suggests that increasing distracter levels lead to increased ipsilateral alpha levels (compared with contralateral). Previous visual spatial attention studies that reported a true ipsilateral increase versus baseline tend to have used strong distracters that needed to be suppressed for optimal task performance (Worden et al., 2000; Kelly et al., 2006). Why did we primarily observe a contralateral alpha decrease and only a weak ipsilateral increase? It is possible that the relatively weak (one pulse) distracter used in the current paradigm did not require as much active suppression. Whether the presence and strength of ipsilateral distracters affects ipsilateral alpha activity should be addressed in future research. If this is the case, it would further substantiate the claim that alpha power increase reflects active functional disengagement of a region.
Conclusion
The present study demonstrates for the first time that alpha lateralization in the sensorimotor system reflects a top-down controlled attentional bias with a profound influence on performance. Our findings therefore strengthen the idea that the alpha rhythm is not specific for the visual system but reflects a general mechanism for resource allocation in the brain. Further, the graded lateralization depending on statistics of the environment (i.e., cue reliability) suggests that alpha reflects the degree of anticipation. We thus propose that the alpha band rhythm reflects a general mechanism setting the state of sensory regions according to anticipated behavioral relevance.
Footnotes
This work was supported by the Division for the Earth and Life Sciences (ALW) Open Competition Grant (817.02.010) and a Vici grant (453.09.002) from the Netherlands Organization for Scientific Research (NWO).
References
- Adrian ED, Matthews BHC. The Berger rhythm: potential changes from the occipital lobes in man. Brain. 1934;57:355–385. doi: 10.1093/brain/awp324. [DOI] [PubMed] [Google Scholar]
- Bastiaansen MC, Knösche TR. Tangential derivative mapping of axial MEG applied to event-related desynchronization research. Clin Neurophysiol. 2000;111:1300–1305. doi: 10.1016/s1388-2457(00)00272-8. [DOI] [PubMed] [Google Scholar]
- Busch NA, Dubois J, VanRullen R. The phase of ongoing EEG oscillations predicts visual perception. J Neurosci. 2009;29:7869–7876. doi: 10.1523/JNEUROSCI.0113-09.2009. [DOI] [PMC free article] [PubMed] [Google Scholar]
- Cooper NR, Croft RJ, Dominey SJ, Burgess AP, Gruzelier JH. Paradox lost? Exploring the role of alpha oscillations during externally vs internally directed attention and the implications for idling and inhibition hypotheses. Int J Psychophysiol. 2003;47:65–74. doi: 10.1016/s0167-8760(02)00107-1. [DOI] [PubMed] [Google Scholar]
- Foxe JJ, Simpson GV, Ahlfors SP. Parieto-occipital ∼10Hz activity reflects anticipatory state of visual attention mechanisms. Neuroreport. 1998;9:3929–3933. doi: 10.1097/00001756-199812010-00030. [DOI] [PubMed] [Google Scholar]
- Gross J, Kujala J, Hämäläinen M, Timmermann L, Schnitzler A, Salmelin R. Dynamic imaging of coherent sources: studying neural interactions in the human brain. Proc Natl Acad Sci U S A. 2001;98:694–699. doi: 10.1073/pnas.98.2.694. [DOI] [PMC free article] [PubMed] [Google Scholar]
- Haegens S, Osipova D, Oostenveld R, Jensen O. Somatosensory working memory performance in humans depends on both engagement and disengagement of regions in a distributed network. Hum Brain Mapp. 2010;31:26–35. doi: 10.1002/hbm.20842. [DOI] [PMC free article] [PubMed] [Google Scholar]
- Händel B, Haarmeier T, Jensen O. Alpha oscillations correlate with the successful inhibition of unattended stimuli. J Cogn Neurosci. 2011 doi: 10.1162/jocn.2010.21557. [DOI] [PubMed] [Google Scholar]
- Hanslmayr S, Aslan A, Staudigl T, Klimesch W, Herrmann CS, Bäuml KH. Prestimulus oscillations predict visual perception performance between and within subjects. Neuroimage. 2007;37:1465–1473. doi: 10.1016/j.neuroimage.2007.07.011. [DOI] [PubMed] [Google Scholar]
- Jensen O, Mazaheri A. Shaping functional architecture by oscillatory alpha activity: gating by inhibition. Front Hum Neurosci. 2010;4:186. doi: 10.3389/fnhum.2010.00186. [DOI] [PMC free article] [PubMed] [Google Scholar]
- Jones SR, Kerr CE, Wan Q, Pritchett DL, Hämäläinen M, Moore CI. Cued spatial attention drives functionally relevant modulation of the mu rhythm in primary somatosensory cortex. J Neurosci. 2010;30:13760–13765. doi: 10.1523/JNEUROSCI.2969-10.2010. [DOI] [PMC free article] [PubMed] [Google Scholar]
- Jung TP, Makeig S, Humphries C, Lee TW, McKeown MJ, Iragui V, Sejnowski TJ. Removing electroencephalographic artifacts by blind source separation. Psychophysiology. 2000;37:163–178. [PubMed] [Google Scholar]
- Kelly SP, Lalor EC, Reilly RB, Foxe JJ. Increases in alpha oscillatory power reflect an active retinotopic mechanism for distracter suppression during sustained visuospatial attention. J Neurophysiol. 2006;95:3844–3851. doi: 10.1152/jn.01234.2005. [DOI] [PubMed] [Google Scholar]
- Klimesch W, Sauseng P, Hanslmayr S. EEG alpha oscillations: The inhibition-timing hypothesis. Brain Res Rev. 2007;53:63–88. doi: 10.1016/j.brainresrev.2006.06.003. [DOI] [PubMed] [Google Scholar]
- Linkenkaer-Hansen K, Nikulin VV, Palva S, Ilmoniemi RJ, Palva JM. Prestimulus oscillations enhance psychophysical performance in humans. J Neurosci. 2004;24:10186–10190. doi: 10.1523/JNEUROSCI.2584-04.2004. [DOI] [PMC free article] [PubMed] [Google Scholar]
- Maris E, Oostenveld R. Nonparametric statistical testing of EEG- and MEG-data. J Neurosci Methods. 2007;164:177–190. doi: 10.1016/j.jneumeth.2007.03.024. [DOI] [PubMed] [Google Scholar]
- Mathewson KE, Gratton G, Fabiani M, Beck DM, Ro T. To see or not to see: prestimulus {alpha} phase predicts visual awareness. J Neurosci. 2009;29:2725–2732. doi: 10.1523/JNEUROSCI.3963-08.2009. [DOI] [PMC free article] [PubMed] [Google Scholar]
- Monto S, Palva S, Voipio J, Palva JM. Very slow EEG fluctuations predict the dynamics of stimulus detection and oscillation amplitudes in humans. J Neurosci. 2008;28:8268–8272. doi: 10.1523/JNEUROSCI.1910-08.2008. [DOI] [PMC free article] [PubMed] [Google Scholar]
- Nolte G. The magnetic lead field theorem in the quasi-static approximation and its use for magnetoencephalography forward calculation in realistic volume conductors. Phys Med Biol. 2003;48:3637–3652. doi: 10.1088/0031-9155/48/22/002. [DOI] [PubMed] [Google Scholar]
- Palva S, Palva JM. New vistas for alpha-frequency band oscillations. Trends Neurosci. 2007;30:150–158. doi: 10.1016/j.tins.2007.02.001. [DOI] [PubMed] [Google Scholar]
- Percival DB, Walden AT. Spectral analysis for physical applications: multitaper and conventional univariate techniques. Cambridge, UK: Cambridge UP; 1993. [Google Scholar]
- Pfurtscheller G, Stancák A, Jr, Neuper C. Event-related synchronization (ERS) in the alpha band—an electrophysiological correlate of cortical idling: a review. Int J Psychophysiol. 1996;24:39–46. doi: 10.1016/s0167-8760(96)00066-9. [DOI] [PubMed] [Google Scholar]
- Pfurtscheller G, Lopes da Silva FH. Event-related EEG/MEG synchronization and desynchronization: basic principles. Clin Neurophysiol. 1999;110:1842–1857. doi: 10.1016/s1388-2457(99)00141-8. [DOI] [PubMed] [Google Scholar]
- Romei V, Gross J, Thut G. On the role of prestimulus alpha rhythms over occipito-parietal areas in visual input regulation: correlation or causation? J Neurosci. 2010;30:8692–8697. doi: 10.1523/JNEUROSCI.0160-10.2010. [DOI] [PMC free article] [PubMed] [Google Scholar]
- Sauseng P, Klimesch W, Stadler W, Schabus M, Doppelmayr M, Hanslmayr S, Gruber WR, Birbaumer N. A shift of visual spatial attention is selectively associated with human EEG alpha activity. Eur J Neurosci. 2005;22:2917–2926. doi: 10.1111/j.1460-9568.2005.04482.x. [DOI] [PubMed] [Google Scholar]
- Sauseng P, Klimesch W, Heise KF, Gruber WR, Holz E, Karim AA, Glennon M, Gerloff C, Birbaumer N, Hummel FC. Brain oscillatory substrates of visual short-term memory capacity. Curr Biol. 2009;19:1846–1852. doi: 10.1016/j.cub.2009.08.062. [DOI] [PubMed] [Google Scholar]
- Schoffelen JM, Oostenveld R, Fries P. Imaging the human motor system's beta-band synchronization during isometric contraction. Neuroimage. 2008;41:437–447. doi: 10.1016/j.neuroimage.2008.01.045. [DOI] [PubMed] [Google Scholar]
- Suffczynski P, Kalitzin S, Pfurtscheller G, Lopes da Silva FH. Computational model of thalamo-cortical networks: dynamical control of alpha rhythms in relation to focal attention. Int J Psychophysiol. 2001;43:25–40. doi: 10.1016/s0167-8760(01)00177-5. [DOI] [PubMed] [Google Scholar]
- Talairach J, Tournoux P. Co-planar stereotaxic atlas of the human brain. New York: Thieme; 1988. [Google Scholar]
- Thut G, Nietzel A, Brandt SA, Pascual-Leone A. {alpha}-Band electroencephalographic activity over occipital cortex indexes visuospatial attention bias and predicts visual target detection. J Neurosci. 2006;26:9494–9502. doi: 10.1523/JNEUROSCI.0875-06.2006. [DOI] [PMC free article] [PubMed] [Google Scholar]
- van Dijk H, Schoffelen JM, Oostenveld R, Jensen O. Prestimulus oscillatory activity in the alpha band predicts visual discrimination ability. J Neurosci. 2008;28:1816–1823. doi: 10.1523/JNEUROSCI.1853-07.2008. [DOI] [PMC free article] [PubMed] [Google Scholar]
- Worden MS, Foxe JJ, Wang N, Simpson GV. Anticipatory biasing of visuospatial attention indexed by retinotopically specific alpha-band electroencephalography increases over occipital cortex. J Neurosci. 2000;20:RC63. doi: 10.1523/JNEUROSCI.20-06-j0002.2000. (61–66) [DOI] [PMC free article] [PubMed] [Google Scholar]
- Zhang Y, Ding M. Detection of a weak somatosensory stimulus: role of the prestimulus mu rhythm and its top-down modulation. J Cogn Neurosci. 2010;22:307–322. doi: 10.1162/jocn.2009.21247. [DOI] [PubMed] [Google Scholar]