

Abstract
In the multisensory environment, inputs to each sensory modality are rarely independent. Sounds often follow a visible action or event. Here we present behaviorally relevant evidence from the human EEG that visual input prepares the auditory system for subsequent auditory processing by resetting the phase of neuronal oscillatory activity in auditory cortex. Subjects performed a simple auditory frequency discrimination task using paired but asynchronous auditory and visual stimuli. Auditory cortex activity was modeled from the scalp-recorded EEG using spatiotemporal dipole source analysis. Phase resetting activity was assessed using time–frequency analysis of the source waveforms. Significant cross-modal phase resetting was observed in auditory cortex at low alpha frequencies (8–10 Hz) peaking 80 ms after auditory onset, at high alpha frequencies (10–12 Hz) peaking at 88 ms, and at high theta frequencies (∼7 Hz) peaking at 156 ms. Importantly, significant effects were only evident when visual input preceded auditory by between 30 and 75 ms. Behaviorally, cross-modal phase resetting accounted for 18% of the variability in response speed in the auditory task, with stronger resetting overall leading to significantly faster responses. A direct link was thus shown between visual-induced modulations of auditory cortex activity and performance in an auditory task. The results are consistent with a model in which the efficiency of auditory processing is improved when natural associations between visual and auditory inputs allow one input to reliably predict the next.
Introduction
In the multisensory environment that surrounds us, our sensory systems must dynamically adapt to the constantly evolving interrelations between modalities. One effective strategy is to exploit the natural associations between modalities and use one input to predict the next (McGurk and MacDonald, 1976). Indeed, visual input to the auditory system does lead to widespread modulation of processing (for recent reviews, see Driver and Noesselt, 2008; Besle et al., 2009; van Atteveldt et al., 2009) and even activates auditory cortex (AC) alone (Pekkola et al., 2005; Bizley et al., 2007; Besle et al., 2008; Raij et al., 2010). How this is achieved, however, is still debated. One candidate mechanism is the cross-modal phase resetting of AC activity by visual input as described recently in monkeys (Kayser et al., 2008; Lakatos et al., 2009). By this mechanism, visual input adds no additional power to the auditory system but reorganizes—or resets—ongoing activity to a state of high (or low) excitability. The auditory system is thus prepared appropriately for the expected imminent auditory input, leading to potential gains in efficiency or sensitivity.
Cross-modal phase resetting has been proposed as the mechanism by which viewing a speaker's face leads to improvements in speech perception (Schroeder et al., 2008). Because of the natural rhythms inherent in speech, the timing of visual (V) and auditory (A) inputs are tightly linked (Munhall et al., 2004) such that one input reliably predicts the other. Thus, visual input signals the imminent arrival of auditory input, and ongoing oscillatory activity in auditory cortex can thus be set to a transient state of high excitability in preparation. Consistent with this, cross-modal phase resetting has been shown in monkeys to modulate auditory stimulus processing when visual input precedes the auditory input but only when inputs are separated by 20–80 ms (Kayser et al., 2008). In humans, similar effects are yet to be shown, but the link between behavior and oscillatory phase in general (Busch et al., 2009; Mathewson et al., 2009; Stefanics et al., 2010) highlights the importance of a phase control mechanism.
In the present study, we sought evidence of behavior-related cross-modal phase resetting in the human EEG. During EEG recording, subjects were presented with audiovisual stimuli, but the task they performed was purely auditory. The putative function of the mechanism—to improve auditory processing—could thus be tested. To model AC activity, spatiotemporal source analysis was used (Scherg and Picton, 1991; Scherg and Berg, 1996), and AC oscillatory activity was analyzed using time–frequency (TF) decomposition of the AC source waveforms. Genuine modulatory phase-resetting activity is characterized by a stimulus-induced reorganization of oscillatory activity in the absence of any concomitant change in power (Makeig et al., 2002). Using trial-to-trial phase consistency (Tallon-Baudry et al., 1996; Makeig et al., 2002, 2004) as the principal variable, we were able to identify discrete functionally relevant regions of interest within the TF data (Bernat et al., 2005, 2007; Mayhew et al., 2010) and thus could extract specific modulatory effects.
Materials and Methods
Participants.
Twenty healthy adult volunteers took part in the study after giving written informed consent. Data were excluded from one participant who failed to complete the task. The remaining 19 (9 men, 10 women) were aged between 18 and 34 years (mean, 22 years), were all right handed, and had no history of neurological or psychiatric disease. All were screened for normal hearing (pure-tone thresholds better than 20 dB hearing level at 0.5, 1, 2, and 4 kHz) and normal or corrected-to-normal vision. Procedures were approved by the local ethics committee and conformed to the Declaration of Helsinki.
Trials.
Changes in oscillatory phase have been linked both to the onset of a single stimulus (Lakatos et al., 2009) and, by entrainment, to rhythms within sets of stimuli (Lakatos et al., 2008). Accordingly, each trial was designed to incorporate both features, consisting of a sequence of six rhythmically presented stimuli. Analysis of onset responses (to the initial stimulus) and entrained responses (target stimulus) could thus be performed within a single trial. Interstimulus interval within each trial was 200 ms, and thus the presentation rate of the sequence was 2.5 Hz. A schematic illustration of a trial is shown in Figure 1.
Figure 1.

Experimental trial. Each trial consists of a sequence of six rhythmically presented stimuli. The initial stimulus is presented on either the left (L) (illustrated) or right (R), and subsequent stimuli are presented progressively closer to the center. The target stimulus is always presented at the center. Participants judge whether the auditory frequency of the target stimulus is higher or lower (illustrated) than for preceding stimuli. Stimuli consist of simple bars and tones presented together, with visual–auditory onset asynchrony values of 0, 30, 50, 65, 75, or 100 ms. Visual stimuli are represented as small white bars in the gray rectangles. Auditory stimuli from the left and right auditory channels are shown as sine waves below. The relative amplitude of the two channels is used to manipulate apparent spatial position of the auditory stimuli. The target stimulus shown here is lower in frequency than the preceding stimuli. Note the delay between onsets of each visual stimulus and the corresponding auditory stimulus, which remains constant for each trial.
Stimuli.
Target auditory stimuli were 672 or 533 Hz pure tones, binaurally presented at 70 dB sound pressure level for 200 ms (including 5 ms onset and offset cosine ramps). All other auditory stimuli were 600 Hz pure tones of 200 ms duration. Visual stimuli consisted of a white bar (red–green–blue, 255, 255, 255; luminance, 82.9 cd/m2), 1.6° × 0.5°, presented for 200 ms, approximately at eye level. In audiovisual (AV) trials, the auditory and visual stimuli were presented together. Throughout all trials, an open white rectangle, 1.7° × 0.6° at screen center, acted as a fixation marker. Screen background was gray (red–green–blue, 108, 108, and 108; luminance, 42.3 cd/m2) at all times. Stimulus contrast was therefore 0.96.
Spatial manipulation.
To facilitate perceptual “binding” of the auditory and visual stimuli, it was necessary that the stimuli be perceived as a single audiovisual event, following the unity assumption (Vatakis and Spence, 2007). This was achieved by creating an element of apparent motion in the stimuli by manipulating the spatial location of each stimulus within a trial while maintaining a constant spatial and temporal relationship between the auditory and visual parts. The initial stimulus in each trial was thus presented on the left or right of screen, and subsequent stimuli in each trial were presented progressively closer to the screen center. Auditory stimulus position was simulated by adjusting left- or right-channel sound level. Target stimuli were always presented centrally.
Temporal manipulation.
In natural settings, visual and auditory input is rarely simultaneous, and the brain is constantly adapting to variations in stimulus asynchrony (King, 2005). Visual–auditory interactions are consequently highly sensitive to stimulus timing, and a “best” stimulus onset asynchrony (SOA) can cause changes in neuronal firing rates (Kayser et al., 2008) as well as improvements in behavioral responses (Thorne and Debener, 2008a). Visual–auditory SOA was therefore randomly selected for each whole trial from the values 0, 30, 50, 65, 75, and 100 ms. Within this range, stimulus asynchrony was not detected by participants. Trials for each SOA were grouped together for analysis and are referred to henceforth as VA0, VA30, … , VA100. This manipulation has the advantage that, across AV conditions, the physical characteristics of each stimulus are identical. Thus, differences in responses must reflect differences in AV interactions rather than differences in stimuli.
Task.
To assess effects of visual input on auditory processing, participants were set a purely auditory task, a slightly modified version of the auditory frequency discrimination task described in detail by Thorne and Debener (2008a). The task was to decide whether the last tone in the sequence was higher or lower in frequency than the preceding tones. A number of “catch” trials were randomly interspersed to ensure concentration. In these, one, two, or three stimuli from each sequence were removed, creating shorter sequences. After presentation of the target stimulus in each trial, participants were required to respond as quickly and accurately as possible. Intertrial interval was randomized between 800 and 1300 ms. Selection of target frequency (high or low) and trial direction (from left or right) was randomized. Unisensory auditory trials were randomly interspersed with the audiovisual trials. There was no task to perform in the visual only trials, and these were presented in blocks separately.
Design.
A total of 1260 A and AV trials were presented in five equal blocks. An additional 100 V trials were presented separately in two equal blocks at each end of the experiment. A total of 20% of trials in each A and AV condition were included in each block, which was further split into seven equal sets of 36 trials to prevent fatigue. Between each block was a 90 s break, and between each set was a short 12 s break. There were 145 trials in each A and AV conditions, and each A/AV block contained 49 catch trials (∼20% of trials). Presentation order within each block was otherwise randomized. Participants were instructed to use the index finger of each hand for up and down responses and to use the same hand order throughout. Hand order was counterbalanced across participants.
Equipment.
Stimuli presentation was controlled by Presentation 10.0 software (Neurobehavioral Systems) on a personal computer (Dell Optiplex GX270 with 3 GHz Intel Pentium 4 processor), presented using a 58 cm monitor (NVIDIA GeForce FX5700 Ultra, 1280 × 1024 × 32 bit color, 60 Hz refresh rate) and insert earphones (Eartone 3A). Participants were comfortably seated at a distance of 150 cm from the screen. All responses were made using a keypad with two keys, marked with up and down arrows, respectively. The temporal accuracy of stimulus delivery was separately verified before commencement of the experiment.
EEG recording.
Participants were seated in an electrically shielded, sound attenuated and dimly lit booth (Industrial Acoustics). EEG data were recorded from 68 channels using a high-input impedance amplifier system (Neuroscan; Compumedics) and a customized electrode cap specifically designed to facilitate source localization accuracy by increasing spatial information (Easycap). The cap was fitted with 66 Ag/AgCl electrodes in an equidistant layout that spans a larger part of the head than standard 10–20 montages. Two additional electrodes were placed below the eyes. Data were recorded with a sampling rate of 1000 Hz, using a nose-tip reference, and were analog filtered between 0.1 and 200 Hz. Electrode impedances were maintained below 20 kΩ before data acquisition.
Data processing.
Data processing was performed with MATLAB version 7.8 (MathWorks) software using custom scripts and EEGLAB version 6.01 (Delorme and Makeig, 2004) running under MATLAB, except the source modeling, which was performed using BESA version 5.1.8.10 (Megis).
EEG data were offline low-pass filtered at 80 Hz, downsampled to 250 Hz [except for the analysis of the evoked auditory midlatency responses (MLRs), ∼30–80 ms after stimulus onset], and epoched from −1000 to +3996 ms relative to initial auditory stimulus onset. Data from catch trials were excluded. After baseline removal (−300 to −100 ms), all epochs containing unique, non-stereotyped artifacts were rejected, and extended infomax independent component analysis (Bell and Sejnowski, 1995) was applied to the remaining concatenated trials to remove common EEG artifacts such as eye blinks and electrocardiogram artifacts (Delorme et al., 2007). Using this procedure, on average 82% of trials were retained per condition. Because presentation of initial stimuli was slightly lateralized, analysis of responses to these stimuli was restricted to contralateral responses only.
Source modeling.
To obtain activity from auditory cortex with minimized contributions from distant brain areas, the single-trial EEG data were spatially filtered with equivalent current dipole source analysis, as implemented in BESA. A standard four-shell ellipsoid head model was used with default radii and conductivity parameters. A multiple source configuration as provided by BESA with seven fixed locations in visual and six across prefrontal and central regions was used. Note that activity at these source locations was used to filter out activity that otherwise could be volume conducted to the source of interest, which was seeded at symmetric locations in auditory cortex [Talairach coordinates (x, y, z) = 49.5, −17, 9 mm]. We used a regional source model in auditory cortex, that is, three dipoles at the identical location and with mutually orthogonal orientations, to jointly model current flow in any arbitrary direction in this region. This cannot tease apart separate auditory cortex sources in close proximity but ensures that activity of adjacent gray matter patches with arbitrary orientations is captured. The same approach has been used previously to model auditory cortex activity (Hine and Debener, 2007; Hine et al., 2008).
Time–frequency analysis.
To assess frequency domain responses, epoched single-trial data were transformed for each source separately into two-dimensional TF planes using the continuous Morlet wavelet transform as described by Debener et al. (2005). Frequency ranged from 4 to 25 Hz in 80 increments on a logarithmic scale and latency in 4 ms increments from −1000 to +1400 ms relative to auditory stimulus onset for each stimulus separately. A minimum frequency of 4 Hz was selected to avoid direct entrainment effects from the 2.5 Hz stimulus presentation rate. The present analysis focused on frequencies below 25 Hz because they provide a better signal-to-noise ratio.
Output of the wavelet transform is a complex vector for each pixel within the TF plane. Total power at each pixel was derived by squaring the vector length, which was then scaled to decibels (10 × log10) and normalized by subtracting for each frequency the mean value in the −600 to −300 ms prestimulus interval from the poststimulus values. Intertrial coherence (ITC), a measure of phase consistency across trials, was calculated for each pixel by averaging the power-normalized single-trial vectors across trials (Tallon-Baudry et al., 1996; Makeig et al., 2002). ITC values calculated in this way can range from 0 (random phase) to 1 (perfect phase-locking). For each source, ITC and mean total power values were calculated for each of the 19 subjects, 8 conditions, and 2 stimuli (initial and target). To obtain a single-power dataset for each modality, power planes were averaged across sources within each modality. ITC values are a measure of distribution and cannot be linearly summed, so the mean would not accurately represent the individual contribution of each source. Thus, to obtain a single ITC dataset for each modality while still capturing the main activity at each TF pixel, ITC values were first averaged across hemispheres, and then from these hemisphere-averaged sources, the maximum value within each modality was taken. Because our main experimental hypothesis concerned poststimulus phase distribution, ITC was considered the primary variable in subsequent analysis.
To identify and separate meaningful regions of interest within the TF data, principal component analysis (PCA) was performed using the method described by Bernat et al. (2005). This method has been used recently to identify functionally relevant TF regions of interest within the electrophysiological responses to auditory stimuli that show significant trial-to-trial correlations with the hemodynamic blood oxygenation level-dependent response (Mayhew et al., 2010). Data outside a latency range of 0–400 ms after stimulus onset and a frequency range from 4 to 25 Hz were excluded from the PCA, as were all visual-only trials. A total of 266 ITC datasets (19 subjects × 7 conditions × 2 stimuli) were thus included. Factors extracted according to the criteria of Cattell (1966) and Kaiser (1960) were then submitted to varimax rotation. Finally, the rotated components were backprojected onto the original ITC data, by multiplying together the derived component loadings and their respective components. Thus, for each extracted component, ITC values for each subject, condition, and stimulus were obtained. For each such new dataset, the peak ITC value was defined simply as the maximum single ITC value in the dataset. To obtain power values corresponding to the ITC peaks thus identified, the same components were backprojected onto the corresponding TF power data using the same procedure.
Component assessment.
ITC peaks for each component were compared across AV conditions using one-way repeated-measures ANOVAs. Across AV conditions, auditory and visual stimuli were identical, varying only in their relative timing. Thus, any component showing differences across conditions to initial stimuli would reflect auditory activity modulated by the visual input. The baseline for this comparison was taken as the VA0 condition: visual processing is relatively slow, and early visual–auditory interactions were therefore not expected for simultaneous AV stimuli. Thus, when ANOVAs showed significant ITC differences across conditions, planned contrasts were performed between the baseline VA0 condition and all other AV conditions. Phase reset, however, is specifically characterized by an increase in ITC after stimulation in the absence of any significant change in power (Makeig et al., 2002). Corresponding power values for significant ITC components were therefore compared against zero using one-sample t tests. However, because auditory and AV stimuli were expected to evoke responses in AC and therefore lead to potential changes in power across all conditions, any significant ITC components showing nonzero power were assessed for additional power changes in AV conditions compared with the baseline VA0 condition using paired t tests.
To assess the relevance of ITC components to task performance, a backward stepwise multiple linear regression was performed using pooled normalized single-subject data with response time in the behavioral task as the dependent variable and ITC values for each component as independent variables. For the first step, all extracted components were entered as independent variables. Nonsignificant predictors were then removed, and the regression was repeated. This iterative procedure thus identified the significant predictors of response time. For all variables, individual subject data were normalized by removing interindividual differences, specifically by subtracting the difference between the subject's mean and the grand mean for each variable (Loftus and Masson, 1994). A significance criterion of 0.05 was used for all statistical tests.
Results
Behavioral results
As expected, all subjects performed with near 100% accuracy (mean, 98 ± 2%). Trials with incorrect responses were excluded from additional analysis. Figure 2 shows grand average response times for each condition. Response times were shorter in all AV conditions compared with the A-only condition (paired t tests, p < 0.001). Responses in the VA0 condition were slower than all other AV conditions except VA30 (p values < 0.01).
Figure 2.

Grand mean ± SEM response time in the behavioral task. RT, Response time.
Source modeling
Figure 3 shows a summary of the grand average event-related responses to auditory, visual, and simultaneous audiovisual stimuli. Event-related potentials (ERPs) at putative auditory (frontocentral) and visual (occipital) sensors are shown compared with ERPs derived from source waveforms to assess validity of the source model. Clear stimulus-evoked responses to each stimulus type are apparent in both sensor and source data. In response to auditory stimuli, the N1–P2 complex after each stimulus can be seen both in the sensor data (the P2 to the target stimulus is subsumed by the large P3-like response-related positivity) and in the tangential auditory source data (Fig. 3B). Similarly, typical early visual deflections were captured in both the sensor and source data (Fig. 3C). Present only in the sensor data was the high-frequency MLR, 30–80 ms after stimulus onset. The principal features in the sensor data were thus well-modeled other than the high-frequency MLR, so additional analysis focused only on frequencies below 25 Hz.
Figure 3.

Summary of evoked responses in auditory, visual, and simultaneous audiovisual trials. A, Grand average evoked responses across auditory (red), visual (blue), and simultaneous audiovisual (green) trials, shown as global field power, the spatial SD of responses across all sensors. Scalp voltage maps are shown for auditory evoked N1 and P2 peaks. Black bars across the bottom represent the timing and duration of each stimulus. Each trial consists of a total of six stimuli. B, Left, Grand average ERPs for the initial stimulus in each trial averaged across sensors in a frontocentral region of interest. Right, Grand average auditory cortex waveform for the same stimuli. Head plots indicate the sensors (left) and the source orientations (right) used. Color codes as A. C, Left, Grand average ERPs for the same stimuli as B averaged across sensors in a right occipital region of interest. Right, Grand average visual cortex waveform for the same stimuli. Head plots as B. Color codes as B. For illustrative purposes, ERPs shown in B and C are low-pass filtered at 40 Hz. ROI, Region of interest.
Time–frequency decomposition
Figure 4 shows frequency domain auditory and visual cortical responses to unisensory stimuli. As expected, preferred modality responses (auditory stimuli in auditory cortex, and visual in visual) were typical of an evoked response with strong increases in both power and ITC after stimulation (Makeig et al., 2004). Peak response was at 160 ms for auditory stimuli and 208 ms for visual, the difference probably primarily attributable to slow retinal transduction (King, 2005). For nonpreferred modality stimuli, there was a clear increase in ITC in both modalities. Although there was no discernable concomitant change in power in visual cortex, there was both an increase in power at ∼7 Hz and a later decrease at 10–12 Hz in auditory cortex, but whether these power changes were tied to the ITC increase was uncertain. To further assess these power changes in auditory cortex in response to visual stimuli, data for the two visual trial blocks (at each end of the experiment) were then analyzed separately. In visual cortex, although the frequency profile was similar in the two blocks, power changes were generally weaker in the end block compared with the first. In contrast to this, power increases in auditory cortex were generally greater in the end block compared with the first, primarily at 7 Hz and later at ∼4 Hz. It was therefore likely that the power increase in AC reflected, at least in part, a genuine activation of auditory cortex by visual stimulation.
Figure 4.

Time–frequency plots for unisensory responses in auditory and visual cortex. Left, ITC (top) and total power (bottom) in auditory cortex related to the initial stimulus in unisensory auditory (far left) and visual (middle left) trials. Right, as left, showing responses in visual cortex to the same stimuli.
Auditory cortical responses to audiovisual stimuli were then compared across the different SOA conditions (Fig. 5). Peaks in ITC to both the initial (Fig. 5A, top) and target stimuli (Fig. 5B, top) were apparent at frequencies at ∼5, 7, and 10 Hz but overlapped to a substantial degree. A PCA revealed 12 meaningful regions of interest within the ITC data explaining 83% of the variance across subjects and conditions.
Figure 5.

Time–frequency plots for auditory and audiovisual stimuli in auditory cortex. A, ITC (top) and total power (bottom) values in auditory cortex related to the initial stimulus in each trial, for unisensory auditory (A) and audiovisual (VAxx; in ms) trials. B, As A but for target stimuli.
Phase reset
For each component, maximum backprojected ITC values relating to initial stimuli were compared across AV conditions. The three components showing significant differences are illustrated in Figure 6. Component 1 (F = 5.25, p < .001) was characterized by activity in the low alpha-frequency range (8–10 Hz), peaking between 50 and 100 ms after stimulus onset, with a maximum at 80 ms. Compared with the baseline VA0 condition, ITC values were significantly increased in the VA30 (p < 0.01), VA50 (p < 0.05), and VA65 (p < 0.001) conditions (Fig. 6B). Component 3 (F = 2.43, p < 0.05) reflected activity in the high theta range (∼7 Hz), peaking between 100 and 200 ms with a maximum at 156 ms. ITC values were raised only in the VA30 condition (p < 0.05). Component 6 (F = 4.33, p = 0.001) reflected activity in the high alpha range (10–12 Hz) peaking at 88 ms, with significant ITC increases in the VA50 (p < 0.01), VA65 (p < 0.05), and VA75 (p < 0.05) conditions. Importantly, ITC values for each of these three short-latency components were no different for simultaneous AV stimuli (VA0 condition) than for auditory-alone stimuli (paired t tests, p > 0.5), confirming that visual processing was too slow to affect early responses to simultaneous AV stimuli. The suitability of the VA0 condition as an audiovisual baseline condition was thus supported.
Figure 6.
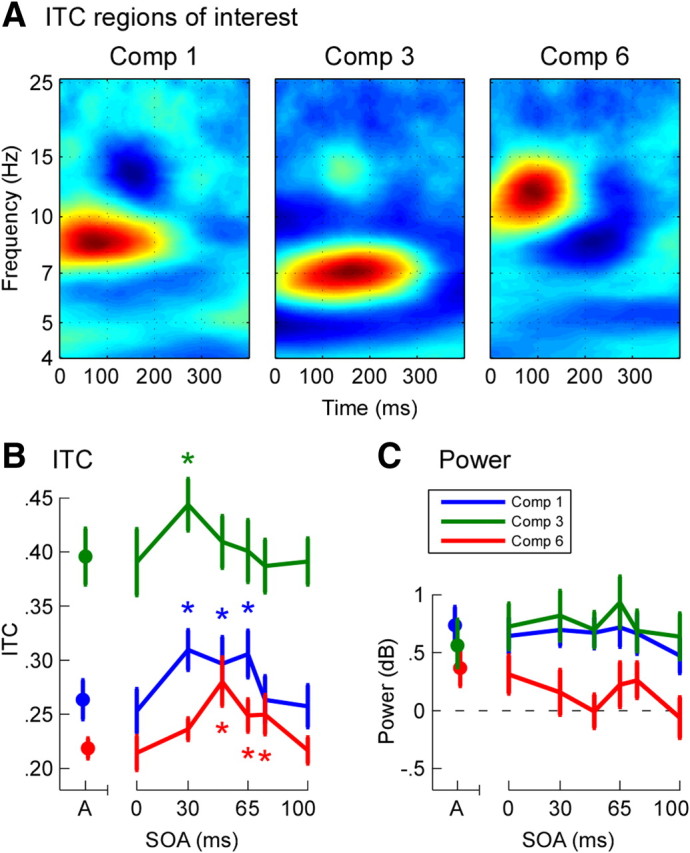
ITC regions of interest in auditory cortical responses identified using principal component analysis. A, Time–frequency representation of components 1, 3, and 6. ITC values for these components were significantly different across audiovisual conditions. Values shown are the component loadings (arbitrary units). B, Grand mean ± SEM peak ITC values in response to initial stimuli in each trial for components 1 (blue), 3 (green), and 6 (red). *p < 0.05, significant increases in peak ITC compared with simultaneous audiovisual stimuli (VA0). C, Grand mean ± SEM total power for the same stimuli and components as B. Color codes as B.
Power changes for significant ITC components were quantified by backprojecting the components onto the original TF power data (Fig. 6C). Power for component 6 did not statistically differ from zero in any AV condition (one-sample t tests, p > 0.05). For components 1 and 3, power was nonzero across all AV conditions (p < 0.05), but there was no difference in power between the baseline VA0 condition and any other AV condition (paired t tests, p values > 0.3). All three components thus showed the typical characteristics of the phase reset mechanism.
Phase reset and behavioral performance
Single-subject target-stimulus ITC and power values were calculated by backprojecting each component onto target-stimulus data. Results for components 1, 3, and 6 are shown in Figure 7. Although there are some differences compared with initial-stimulus responses, presumably related to entrainment effects elicited by the rhythmic stimuli, there are no power increases for any of the three components in any AV condition. To assess the relationship between ITC and task performance, ITC values were then regressed onto response times for the behavioral task using a backward stepwise multiple linear regression with all 12 components entered as the first step. Three significant predictors were identified with this procedure: the same three components identified above as showing phase reset effects to the initial stimulus. The final regression was highly significant (F = 7.68, p < 0.001), explaining 18% of the variance in response times (Fig. 7C). Component 6 (B = −73, b = −0.39, p < 0.001), component 1 (B = 62, b = 0.35, p < 0.01), and component 3 (B = −39, b = −.26, p < 0.05) were all significant predictors. Thus, phase-locking across the three components was highly predictive of response times in the task, with high ITC values in components 3 and 6, offset to a degree by component 1, leading to faster behavioral responses.
Figure 7.
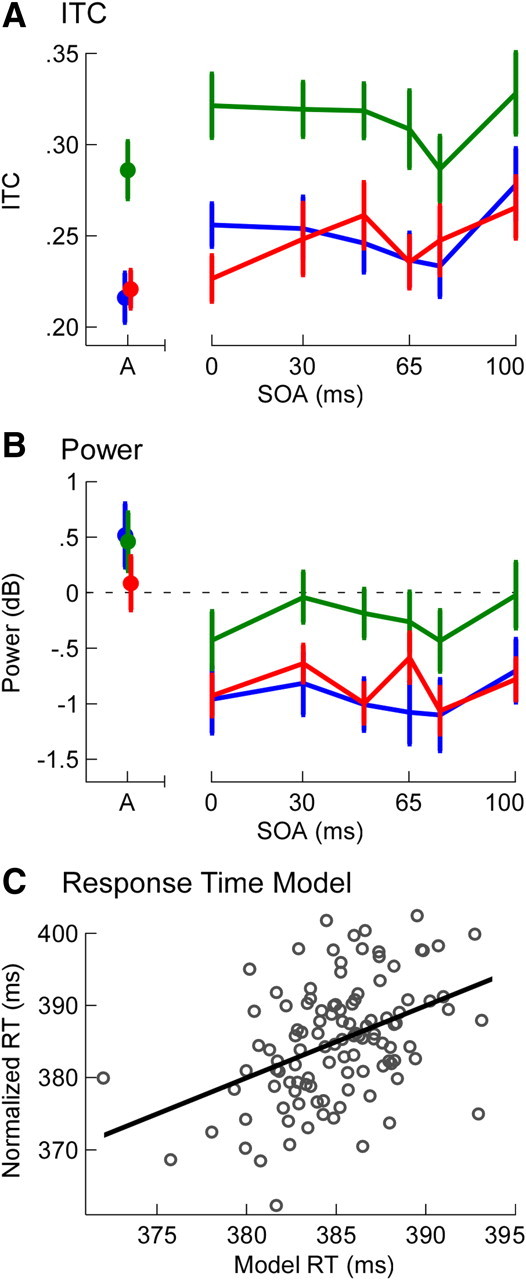
Peak ITC and auditory task performance. A, Grand mean ± SEM peak ITC values in response to target stimuli in each trial for components 1 (blue), 3 (green), and 6 (red). B, Grand mean ± SEM total power for the same stimuli and components as A. Color codes as A. C, Individual subject and condition mean response times plotted against predicted values from ITC model, including the best-fit line. The model was derived from a linear regression of individual subject and condition target-stimulus ITC values for components 1, 3, and 6 (shown in A) on response time (the mean of all variables was first normalized across subjects). The model accounted for 18% of the variance in response times. RT, Response time.
Discussion
The present study provides evidence derived from the human EEG that visual input modulates the processing of auditory stimuli by resetting the phase of alpha- and theta-frequency oscillatory activity in AC. AC activity was modeled from the scalp-recorded EEG, so that the effects of visual stimulus timing on auditory processing in AC could be compared. When visual stimuli preceded auditory stimuli by between 30 and 75 ms, there were significant increases in the phase concentration of alpha- and theta-frequency activity commencing within 50–100 ms of auditory onset. Although, as expected, there were significant increases in AC power in all conditions, there were no additional increases in power concomitant with the SOA-specific increases in ITC. We interpret this pattern of results as evidence of cross-modal phase reset in humans.
The range of effective asynchronies was approximately equal to a half cycle at theta and alpha frequencies (∼40–70 ms), the frequencies at which oscillatory activity was reset. This would be consistent with the idea that cortical ensembles integrate over intervals that correspond with half-cycles of oscillatory activity at various frequencies (Schroeder et al., 2008). Neuronal oscillations cover a range of frequencies from <1 Hz to >200 Hz, allowing inputs to be integrated over multiple biologically relevant timescales (Buzsáki and Draguhn, 2004; Schroeder et al., 2008). Audiovisual speech, for example, consists of rhythms at multiple nested frequencies from slow delta rhythms of prosody, to transitions at gamma frequencies (Munhall et al., 2004; Luo and Poeppel, 2007; Schroeder et al., 2008). It has been proposed that such a structure enables visual input to predictively reset auditory cortical activity at multiple timescales and frequencies, leading to amplification and thereby improved comprehension of the speech (Schroeder et al., 2008). The effective SOA range shown here with simple stimuli was consistent with a transient preparatory increase in excitability in the auditory system, but a demonstration with more complex stimuli, such as speech, remains for future study.
Phase resetting of AC activity was identified at both alpha (8–12 Hz) and theta (7 Hz) frequencies when visual input preceded auditory by 30–75 ms. These results concord well with those from Kayser et al. (2008), working with monkeys, who found that the firing rate of neurons in AC was modulated by visual input with the strongest effects shown when visual input preceded auditory by 20–80 ms. Moreover, their data also showed that visual input acted by resetting the “slow-wave” 10 Hz activity in AC. Using higher-frequency resolution, Lakatos et al. (2009), however, reported resetting only at theta and gamma frequencies and suggested that alpha oscillations probably perform a different role in sensory processing. This would therefore suggest that the theta- and alpha-frequency resetting in the present study serve quite separate functions. Thus, although the theta activity could be predicted by the speech model discussed above, the alpha activity may not be speech specific. Whether this is indeed the case remains to be seen.
Although audiovisual interactions are known to confer many behavioral benefits (Calvert et al., 2004), the role of audiovisual interactions specifically in AC is far less well understood (Musacchia and Schroeder, 2009). In principle, the function of phase reset in AC could be to fine-tune either the sensitivity or efficiency of the auditory system (or both). Our data conform to the latter, showing that the effectiveness of the reset mechanism, as indexed by the degree of AC theta- and alpha-frequency phase concentration, could explain ∼18% of the variance in behavioral response speed in a simple auditory frequency discrimination task. This figure is comparable with the 16% of variability in performance recently accounted for by oscillatory phase in a visual detection task (Busch et al., 2009).
There has been considerable discussion in the ERP literature about the sufficiency of the ITC and power criteria for providing genuine evidence of phase resetting (Hanslmayr et al., 2007; Sauseng et al., 2007). The approach taken in the present study, however, differs from standard scalp ERP analysis in several important respects. First, the use of source data strongly reduces the possibility that activity from two (or more) distinct underlying sources might be equal and opposite and therefore sum to zero at a particular sensor. Only if processes were generated in the same region of cortex would they potentially cancel each other in the source data. Second, the principal analysis used both the time and the frequency domain, thus requiring that processes be similar in frequency and act at similar latencies to cancel. Finally, there was no change in power across as many as five experimental conditions (compared with the baseline condition). Thus the power profile across conditions would need to be exactly mirrored in an opposing process for the effects to cancel in all conditions. We consider the possibility to be negligible that there exist two (or more) processes that cancel each other on all of these dimensions together.
Because of volume conduction across the tissues separating cortex from electrodes, activity recorded by each sensor on the scalp is a mixture of an unknown number of underlying sources. AC activity was not measured directly but was modeled from scalp sensor data using an a priori configuration of cortical sources to spatially filter the data. The source model approach was designed to minimize the effects of volume conduction, but the possibility cannot be entirely ruled out that modeled AC activity included some residual visual (or other non-auditory) activations. Analysis of responses to unisensory visual trials, however, did demonstrate a genuine physiological response in AC after visual stimulation. Moreover, the main modulatory effects in this study cannot be explained by volume conduction for two reasons. First, the critical test for assessing modulations of AC activity was a comparison between one AV condition (VA0) and the others and not a comparison of AV responses with unisensory responses. The main effects were therefore not the result of a simple addition of visual responses to the system. Second, the SOA-specific ITC increases in AC responses were not accompanied by similar increases in power. Volume-conducted activity, in contrast, would be evident as changes in power with or without an ITC increase.
It might also be argued that the modeled AC source activations included activity generated in nearby polymodal regions, such as the superior temporal sulcus (STS). Source localization or modeling from scalp data cannot readily separate activity in such close proximity. However, the latencies of the modulatory effects, particularly those at alpha frequencies, were very short. Although this, in itself, does not rule out STS activation (Musacchia and Schroeder, 2009), evidence obtained using both magnetoencephalography (MEG) (Mottonen et al., 2004) and human intracranial EEG (Besle et al., 2008) has shown interactions in AC to occur before any activity in STS. Moreover, a recent study of onset latencies using non-speech stimuli reported AV interactions in AC from ∼80 ms (Raij et al., 2010), in good agreement with our data. Nevertheless, final confirmation awaits additional research, perhaps using combined EEG–MEG or EEG–functional magnetic resonance imaging (Debener and De Vos, 2011).
Electrophysiological studies of audiovisual interactions have often looked to modulations of the auditory-evoked N1 response for evidence of interaction within AC. This component, peaking at ∼100 ms after auditory onset, is known to be generated in AC regions in the supratemporal plane (Vaughan and Ritter, 1970; Yvert et al., 2005). Often, and usually with audiovisual speech stimuli, the amplitude of this component is attenuated by visual input (van Wassenhove et al., 2005), although with other stimuli, some increases have also been shown (Besle et al., 2009; Vroomen and Stekelenburg, 2010). Although visible lip movements clearly carry semantic content (McGurk and MacDonald, 1976), it is the timing information provided by the visual input that leads to more efficient auditory processing, in turn leading to attenuation of the N1 (Thorne and Debener, 2008b; Vroomen and Stekelenburg, 2010). Although additional study is required, perhaps the cross-modal reset mechanism provides the means by which this information is communicated.
Oscillatory neuronal activity has been linked to a variety of phenomena, both behavioral (Schneider et al., 2008) and physiological (Buzsáki and Draguhn, 2004). Often, it is the fluctuations of power that are of interest (Herrmann et al., 2010) or the coherence in oscillations between brain regions (Senkowski et al., 2008). Recently, however, the importance of oscillatory phase to perception and performance has also been shown. In the visual system, for example, detection thresholds were found to vary across trials according to prestimulus theta and alpha phase angle, such that activity was phase-locked at opposite angles in detected compared with missed trials (Busch et al., 2009; Mathewson et al., 2009). The fine temporal structure contained within rapid fluctuations in phase angle has been linked more generally to dynamic changes in perceptual experience (Buzsáki, 2006; Wyart and Sergent, 2009). Our study provides evidence that such changes in phase angle can be controlled by a cross-modal phase reset mechanism.
Footnotes
J.D.T. was supported by the Medical Research Council (United Kingdom). F.C.V. was supported by the Fundacao para a Ciencia e Tecnologia, Lisbon, Portugal (Grant SFRH/BD/37662/2007).
References
- Bell AJ, Sejnowski TJ. An information-maximization approach to blind separation and blind deconvolution. Neural Comput. 1995;7:1129–1159. doi: 10.1162/neco.1995.7.6.1129. [DOI] [PubMed] [Google Scholar]
- Bernat EM, Williams WJ, Gehring WJ. Decomposing ERP time-frequency energy using PCA. Clin Neurophysiol. 2005;116:1314–1334. doi: 10.1016/j.clinph.2005.01.019. [DOI] [PubMed] [Google Scholar]
- Bernat EM, Malone SM, Williams WJ, Patrick CJ, Iacono WG. Decomposing delta, theta, and alpha time-frequency ERP activity from a visual oddball task using PCA. Int J Psychophysiol. 2007;64:62–74. doi: 10.1016/j.ijpsycho.2006.07.015. [DOI] [PMC free article] [PubMed] [Google Scholar]
- Besle J, Fischer C, Bidet-Caulet A, Lecaignard F, Bertrand O, Giard MH. Visual activation and audiovisual interactions in the auditory cortex during speech perception: intracranial recordings in humans. J Neurosci. 2008;28:14301–14310. doi: 10.1523/JNEUROSCI.2875-08.2008. [DOI] [PMC free article] [PubMed] [Google Scholar]
- Besle J, Bertrand O, Giard MH. Electrophysiological (EEG, sEEG, MEG) evidence for multiple audiovisual interactions in the human auditory cortex. Hear Res. 2009;258:143–151. doi: 10.1016/j.heares.2009.06.016. [DOI] [PubMed] [Google Scholar]
- Bizley JK, Nodal FR, Bajo VM, Nelken I, King AJ. Physiological and anatomical evidence for multisensory interactions in auditory cortex. Cereb Cortex. 2007;17:2172–2189. doi: 10.1093/cercor/bhl128. [DOI] [PMC free article] [PubMed] [Google Scholar]
- Busch NA, Dubois J, VanRullen R. The phase of ongoing EEG oscillations predicts visual perception. J Neurosci. 2009;29:7869–7876. doi: 10.1523/JNEUROSCI.0113-09.2009. [DOI] [PMC free article] [PubMed] [Google Scholar]
- Buzsáki G. Rhythms of the brain. Oxford, UK: Oxford UP; 2006. [Google Scholar]
- Buzsáki G, Draguhn A. Neuronal oscillations in cortical networks. Science. 2004;304:1926–1929. doi: 10.1126/science.1099745. [DOI] [PubMed] [Google Scholar]
- Calvert GA, Spence C, Stein BE. The handbook of multisensory processes. Cambridge, MA: Massachusetts Institute of Technology; 2004. [Google Scholar]
- Cattell RB. The scree test for the number of factors. Multivar Behav Res. 1966;1:245–276. doi: 10.1207/s15327906mbr0102_10. [DOI] [PubMed] [Google Scholar]
- Debener S, De Vos M. The benefits of simultaneous EEG-fMRI for EEG analysis. Clin Neurophysiol. 2011;122:217–218. doi: 10.1016/j.clinph.2010.07.008. [DOI] [PubMed] [Google Scholar]
- Debener S, Ullsperger M, Siegel M, Fiehler K, von Cramon DY, Engel AK. Trial-by-trial coupling of concurrent electroencephalogram and functional magnetic resonance imaging identifies the dynamics of performance monitoring. J Neurosci. 2005;25:11730–11737. doi: 10.1523/JNEUROSCI.3286-05.2005. [DOI] [PMC free article] [PubMed] [Google Scholar]
- Delorme A, Makeig S. EEGLAB: an open source toolbox for analysis of single-trial EEG dynamics including independent component analysis. J Neurosci Methods. 2004;134:9–21. doi: 10.1016/j.jneumeth.2003.10.009. [DOI] [PubMed] [Google Scholar]
- Delorme A, Sejnowski T, Makeig S. Enhanced detection of artifacts in EEG data using higher-order statistics and independent component analysis. Neuroimage. 2007;34:1443–1449. doi: 10.1016/j.neuroimage.2006.11.004. [DOI] [PMC free article] [PubMed] [Google Scholar]
- Driver J, Noesselt T. Multisensory interplay reveals crossmodal influences on “sensory-specific” brain regions, neural responses, and judgments. Neuron. 2008;57:11–23. doi: 10.1016/j.neuron.2007.12.013. [DOI] [PMC free article] [PubMed] [Google Scholar]
- Hanslmayr S, Klimesch W, Sauseng P, Gruber W, Doppelmayr M, Freunberger R, Pecherstorfer T, Birbaumer N. Alpha phase reset contributes to the generation of ERPs. Cereb Cortex. 2007;17:1–8. doi: 10.1093/cercor/bhj129. [DOI] [PubMed] [Google Scholar]
- Herrmann CS, Fründ I, Lenz D. Human gamma-band activity: a review on cognitive and behavioral correlates and network models. Neurosci Biobehav Rev. 2010;34:981–992. doi: 10.1016/j.neubiorev.2009.09.001. [DOI] [PubMed] [Google Scholar]
- Hine J, Debener S. Late auditory evoked potentials asymmetry revisited. Clin Neurophysiol. 2007;118:1274–1285. doi: 10.1016/j.clinph.2007.03.012. [DOI] [PubMed] [Google Scholar]
- Hine J, Thornton R, Davis A, Debener S. Does long-term unilateral deafness change auditory evoked potential asymmetries? Clin Neurophysiol. 2008;119:576–586. doi: 10.1016/j.clinph.2007.11.010. [DOI] [PubMed] [Google Scholar]
- Kaiser HF. The application of electronic computers to factor analysis. Educ Psychol Meas. 1960;20:141–151. [Google Scholar]
- Kayser C, Petkov CI, Logothetis NK. Visual modulation of neurons in auditory cortex. Cereb Cortex. 2008;18:1560–1574. doi: 10.1093/cercor/bhm187. [DOI] [PubMed] [Google Scholar]
- King AJ. Multisensory integration: strategies for synchronization. Curr Biol. 2005;15:R339–R341. doi: 10.1016/j.cub.2005.04.022. [DOI] [PubMed] [Google Scholar]
- Lakatos P, Karmos G, Mehta AD, Ulbert I, Schroeder CE. Entrainment of neuronal oscillations as a mechanism of attentional selection. Science. 2008;320:110–113. doi: 10.1126/science.1154735. [DOI] [PubMed] [Google Scholar]
- Lakatos P, O'Connell MN, Barczak A, Mills A, Javitt DC, Schroeder CE. The leading sense: supramodal control of neurophysiological context by attention. Neuron. 2009;64:419–430. doi: 10.1016/j.neuron.2009.10.014. [DOI] [PMC free article] [PubMed] [Google Scholar]
- Loftus GR, Masson MEJ. Using confidence intervals in within-subject designs. Psychon Bull Rev. 1994;1:476–490. doi: 10.3758/BF03210951. [DOI] [PubMed] [Google Scholar]
- Luo H, Poeppel D. Phase patterns of neuronal responses reliably discriminate speech in human auditory cortex. Neuron. 2007;54:1001–1010. doi: 10.1016/j.neuron.2007.06.004. [DOI] [PMC free article] [PubMed] [Google Scholar]
- Makeig S, Westerfield M, Jung TP, Enghoff S, Townsend J, Courchesne E, Sejnowski TJ. Dynamic brain sources of visual evoked responses. Science. 2002;295:690–694. doi: 10.1126/science.1066168. [DOI] [PubMed] [Google Scholar]
- Makeig S, Debener S, Onton J, Delorme A. Mining event-related brain dynamics. Trends Cogn Sci. 2004;8:204–210. doi: 10.1016/j.tics.2004.03.008. [DOI] [PubMed] [Google Scholar]
- Mathewson KE, Gratton G, Fabiani M, Beck DM, Ro T. To see or not to see: prestimulus alpha phase predicts visual awareness. J Neurosci. 2009;29:2725–2732. doi: 10.1523/JNEUROSCI.3963-08.2009. [DOI] [PMC free article] [PubMed] [Google Scholar]
- Mayhew SD, Dirckx SG, Niazy RK, Iannetti GD, Wise RG. EEG signatures of auditory activity correlate with simultaneously recorded fMRI responses in humans. Neuroimage. 2010;49:849–864. doi: 10.1016/j.neuroimage.2009.06.080. [DOI] [PubMed] [Google Scholar]
- McGurk H, MacDonald J. Hearing lips and seeing voices. Nature. 1976;264:746–748. doi: 10.1038/264746a0. [DOI] [PubMed] [Google Scholar]
- Möttönen R, Schürmann M, Sams M. Time course of multisensory interactions during audiovisual speech perception in humans: a magnetoencephalographic study. Neurosci Lett. 2004;363:112–115. doi: 10.1016/j.neulet.2004.03.076. [DOI] [PubMed] [Google Scholar]
- Munhall KG, Jones JA, Callan DE, Kuratate T, Vatikiotis-Bateson E. Visual prosody and speech intelligibility: head movement improves auditory speech perception. Psychol Sci. 2004;15:133–137. doi: 10.1111/j.0963-7214.2004.01502010.x. [DOI] [PubMed] [Google Scholar]
- Musacchia G, Schroeder CE. Neuronal mechanisms, response dynamics and perceptual functions of multisensory interactions in auditory cortex. Hear Res. 2009;258:72–79. doi: 10.1016/j.heares.2009.06.018. [DOI] [PMC free article] [PubMed] [Google Scholar]
- Pekkola J, Ojanen V, Autti T, Jääskeläinen IP, Möttönen R, Tarkiainen A, Sams M. Primary auditory cortex activation by visual speech: an fMRI study at 3 T. Neuroreport. 2005;16:125–128. doi: 10.1097/00001756-200502080-00010. [DOI] [PubMed] [Google Scholar]
- Raij T, Ahveninen J, Lin FH, Witzel T, Jääskeläinen IP, Letham B, Israeli E, Sahyoun C, Vasios C, Stufflebeam S, Hämäläinen M, Belliveau JW. Onset timing of cross-sensory activations and multisensory interactions in auditory and visual sensory cortices. Eur J Neurosci. 2010;31:1772–1782. doi: 10.1111/j.1460-9568.2010.07213.x. [DOI] [PMC free article] [PubMed] [Google Scholar]
- Sauseng P, Klimesch W, Gruber WR, Hanslmayr S, Freunberger R, Doppelmayr M. Are event-related potential components generated by phase resetting of brain oscillations? A critical discussion. Neuroscience. 2007;146:1435–1444. doi: 10.1016/j.neuroscience.2007.03.014. [DOI] [PubMed] [Google Scholar]
- Scherg M, Berg P. New concepts of brain source imaging and localization. Electroencephalogr Clin Neurophysiol Suppl. 1996;46:127–137. [PubMed] [Google Scholar]
- Scherg M, Picton TW. Separation and identification of event-related potential components by brain electric source analysis. Electroencephalogr Clin Neurophysiol Suppl. 1991;42:24–37. [PubMed] [Google Scholar]
- Schneider TR, Debener S, Oostenveld R, Engel AK. Enhanced EEG gamma-band activity reflects multisensory semantic matching in visual-to-auditory object priming. Neuroimage. 2008;42:1244–1254. doi: 10.1016/j.neuroimage.2008.05.033. [DOI] [PubMed] [Google Scholar]
- Schroeder CE, Lakatos P, Kajikawa Y, Partan S, Puce A. Neuronal oscillations and visual amplification of speech. Trends Cogn Sci. 2008;12:106–113. doi: 10.1016/j.tics.2008.01.002. [DOI] [PMC free article] [PubMed] [Google Scholar]
- Senkowski D, Schneider TR, Foxe JJ, Engel AK. Crossmodal binding through neural coherence: implications for multisensory processing. Trends Neurosci. 2008;31:401–409. doi: 10.1016/j.tins.2008.05.002. [DOI] [PubMed] [Google Scholar]
- Stefanics G, Hangya B, Hernádi I, Winkler I, Lakatos P, Ulbert I. Phase entrainment of human delta oscillations can mediate the effects of expectation on reaction speed. J Neurosci. 2010;30:13578–13585. doi: 10.1523/JNEUROSCI.0703-10.2010. [DOI] [PMC free article] [PubMed] [Google Scholar]
- Tallon-Baudry C, Bertrand O, Delpuech C, Pernier J. Stimulus specificity of phase-locked and non-phase-locked 40 Hz visual responses in human. J Neurosci. 1996;16:4240–4249. doi: 10.1523/JNEUROSCI.16-13-04240.1996. [DOI] [PMC free article] [PubMed] [Google Scholar]
- Thorne JD, Debener S. Irrelevant visual stimuli improve auditory task performance. Neuroreport. 2008a;19:553–557. doi: 10.1097/WNR.0b013e3282f8b1b6. [DOI] [PubMed] [Google Scholar]
- Thorne JD, Debener S. Effects of visual-auditory stimulus onset asynchrony on AEPs in a speech identification task. Presented at the Ninth International Multisensory Research Forum; Hamburg, Germany. 2008b. [Google Scholar]
- van Atteveldt N, Roebroeck A, Goebel R. Interaction of speech and script in human auditory cortex: insights from neuro-imaging and effective connectivity. Hear Res. 2009;258:152–164. doi: 10.1016/j.heares.2009.05.007. [DOI] [PubMed] [Google Scholar]
- van Wassenhove V, Grant KW, Poeppel D. Visual speech speeds up the neural processing of auditory speech. Proc Natl Acad Sci U S A. 2005;102:1181–1186. doi: 10.1073/pnas.0408949102. [DOI] [PMC free article] [PubMed] [Google Scholar]
- Vatakis A, Spence C. Crossmodal binding: evaluating the “unity assumption” using audiovisual speech stimuli. Percept Psychophys. 2007;69:744–756. doi: 10.3758/bf03193776. [DOI] [PubMed] [Google Scholar]
- Vaughan HG, Jr, Ritter W. The sources of auditory evoked responses recorded from the human scalp. Electroencephalogr Clin Neurophysiol. 1970;28:360–367. doi: 10.1016/0013-4694(70)90228-2. [DOI] [PubMed] [Google Scholar]
- Vroomen J, Stekelenburg JJ. Visual anticipatory information modulates multisensory interactions of artificial audiovisual stimuli. J Cogn Neurosci. 2010;22:1583–1596. doi: 10.1162/jocn.2009.21308. [DOI] [PubMed] [Google Scholar]
- Wyart V, Sergent C. The phase of ongoing EEG oscillations uncovers the fine temporal structure of conscious perception. J Neurosci. 2009;29:12839–12841. doi: 10.1523/JNEUROSCI.3410-09.2009. [DOI] [PMC free article] [PubMed] [Google Scholar]
- Yvert B, Fischer C, Bertrand O, Pernier J. Localization of human supratemporal auditory areas from intracerebral auditory evoked potentials using distributed source models. Neuroimage. 2005;28:140–153. doi: 10.1016/j.neuroimage.2005.05.056. [DOI] [PubMed] [Google Scholar]