

Abstract
Synesthesia is a perceptual phenomenon in which stimuli in one particular modality elicit a sensation within the same or another sensory modality (e.g., specific graphemes evoke the perception of particular colors). Grapheme-color synesthesia (GCS) has been proposed to arise from abnormal local cross-activation between grapheme and color areas because of their hyperconnectivity. Recently published studies did not confirm such a hyperconnectivity, although morphometric alterations were found in occipitotemporal, parietal, and frontal regions of synesthetes. We used magnetic resonance imaging surface-based morphometry and graph-theoretical network analyses to investigate the topology of structural brain networks in 24 synesthetes and 24 nonsynesthetes. Connectivity matrices were derived from region-wise cortical thickness correlations of 2366 different cortical parcellations across the whole cortex and from 154 more common brain divisions as well. Compared with nonsynesthetes, synesthetes revealed a globally altered structural network topology as reflected by reduced small-worldness, increased clustering, increased degree, and decreased betweenness centrality. Connectivity of the fusiform gyrus (FuG) and intraparietal sulcus (IPS) was changed as well. Hierarchical modularity analysis revealed increased intramodular and intermodular connectivity of the IPS in GCS. However, connectivity differences in the FuG and IPS showed a low specificity because of global changes. We provide first evidence that GCS is rooted in a reduced small-world network organization that is driven by increased clustering suggesting global hyperconnectivity within the synesthetes' brain. Connectivity alterations were widespread and not restricted to the FuG and IPS. Therefore, synesthetic experience might be only one phenotypic manifestation of the globally altered network architecture in GCS.
Introduction
Synesthesia is a perceptual phenomenon in which stimuli in one modality elicit a sensation within the same or another sensory modality. Several different forms of synesthesia are known, the most investigated of which is grapheme-color synesthesia (GCS) (Rich et al., 2005; Simner et al., 2006). Grapheme-color synesthetes automatically perceive a particular color in association with a particular letter or digit.
Based on the findings of functional studies (Nunn et al., 2002; Rich and Mattingley, 2002; Hubbard et al., 2005a,b; Hubbard and Ramachandran, 2005; Weiss et al., 2005; Esterman et al., 2006; Sperling et al., 2006; Muggleton et al., 2007; Beeli et al., 2008), Hubbard and Ramachandran proposed an influential two-stage model for GCS (Hubbard and Ramachandran, 2005; Hubbard, 2007). First, synesthetic experience stems from abnormal cross-activation in the form of “hyperconnections” between the “grapheme” and “color” areas in the fusiform gyrus (FuG). Second, the two perceptions associated with the FuG are then bound together by top-down mechanisms supported by the parietal cortex, and resulting in “hyperbinding.”
Recent structural imaging studies in GCS have used diffusion tensor imaging (Rouw and Scholte, 2007; Jäncke et al., 2009) and voxel-based (Weiss and Fink, 2009; Rouw and Scholte, 2010) and surface-based (Jäncke et al., 2009) morphometry. These studies have only been able to support this model in part, and only one study was able to confirm the involvement of the FuG and the parietal cortex (Weiss and Fink, 2009). The morphometric analysis of a single subject with interval–taste and tone–color synesthesia did support the idea of hyperconnectivity between brain areas subserving auditory and gustatory processing (Hänggi et al., 2008).
The present study applied a new approach to investigate the pattern of structural interconnections in the FuG, intraparietal sulcus (IPS) and across the entire cortex. Using magnetic resonance imaging (MRI) surface-based morphometry and graph-theoretical network analyses (Watts and Strogatz, 1998; Bullmore and Sporns, 2009), we investigated the topological characteristics of whole cortical anatomical networks in 24 grapheme-color synesthetes and 24 nonsynesthetes. There is mounting evidence that cortical thickness covariations are an indicator of connectivity (Mechelli et al., 2005; Worsley et al., 2005; Lerch et al., 2006). Recently, graph-theoretical network analyses based on cortical thickness correlations and white matter tractography were used to investigate brain network characteristics in healthy (He et al., 2007; Chen et al., 2008; Hagmann et al., 2008; Gong et al., 2009; Honey et al., 2009) and clinical (He et al., 2008, 2009) samples. Based on surface-based morphometry, the connectivity matrices in the present study were derived from region-wise cortical thickness correlations between 2366 anatomical parcellations and between 154 more common anatomical regions and subjected to network analyses. We investigated weighted network characteristics including the clustering coefficient, path length, small-world indices, degree, and betweenness centrality as well as modularity. We expected that hyperconnectivity is either local, in case the two-stage model is valid, or even more global and not restricted to local anatomical differences as suggested by others (Bargary and Mitchell, 2008).
Materials and Methods
Subjects
Twenty-four synesthetes (20 females) with a mean age of 29.2 years (SD ± 10.1 years) and 24 nonsynesthetes (20 females) matched for age (27.3 ± 6.2 years), sex, handedness, and education participated in the study. Given that most of the participants in both groups had an academic background, their years of education were closely matched. All subjects had already participated in one of our previous investigations (Jäncke et al., 2009). Synesthetes reported a lifelong history of grapheme-color perception (i.e., as long as they could remember) and were tested for their color perception to letters and numbers with the established “test of genuineness” that is typically used for the evaluation of synesthesia (Baron-Cohen et al., 1987). All synesthetes had to repeat this test at least 1 month later, all demonstrating constant synesthetic perception. All participants were consistently right-handed according to the procedure proposed by Annett (1970); had no history of neurological, neuropsychological, or psychiatric disease; and reported no use of drugs or medication. The local ethics committee approved the study, and written informed consent was obtained from all participants.
MRI data acquisition
MRI scans were acquired using a 3.0T Philips Intera whole-body scanner (Philips Medical Systems) equipped with a transmit–receive body coil and a commercial eight-element sensitivity encoding (SENSE) head coil array. A volumetric three-dimensional (3D) T1-weighted gradient echo sequence (turbo field echo) scan was obtained from all 48 participants with a spatial resolution of 0.86 × 0.86 × 0.75 mm (matrix, 256 × 256 pixels; 180 slices). Additional imaging parameters were as follows: field of view, 220 × 220 mm; echo time, 2.3 ms; repetition time, 20 ms; flip angle, 20°.
Surface-based morphometry
Cortical surface reconstruction and volumetric segmentation was performed with the FreeSurfer image analysis suite (version 4.0.3), which is documented and freely available for download on-line (http://surfer.nmr.mgh.harvard.edu/). The technical details of these procedures were described in previous publications (Dale et al., 1999; Fischl et al., 1999a,b, 2001, 2002, 2004a,b; Fischl and Dale, 2000; Ségonne et al., 2004). Briefly, the 3D structural T1-weighted MRI scan was used to construct models of each subject's cortical surface to measure brain features such as cortical thickness, cortical surface area, and cortical volume. This is a fully automated procedure involving segmentation of the cortical white matter (Dale et al., 1999), tessellation of the gray/white matter junction, inflation of the folded surface tessellation patterns (Fischl et al., 1999a), and automatic correction of topological defects in the resulting manifold (Fischl et al., 2001). This surface was then used as the starting point for a deformable surface algorithm designed to find the gray/white and pial (gray matter/CSF) surfaces with submillimeter precision (Fischl and Dale, 2000). The procedures for measuring cortical thickness have been validated against histological analysis (Rosas et al., 2002) and manual measurements (Kuperberg et al., 2003; Salat et al., 2004). This method uses both intensity and continuity information from the surfaces in the deformation procedure to interpolate surface locations for regions in which the magnetic resonance image is ambiguous (Fischl and Dale, 2000). For each subject, cortical thickness of the cortical ribbon was computed on a uniform grid (comprised by vertices) with 1 mm spacing across both cortical hemispheres, with the thickness defined by the shortest distance between the gray/white and pial surface models. The thickness maps produced are not limited to the voxel resolution of the image and are thus sensitive for submillimeter differences between groups (Fischl and Dale, 2000). Thickness measures were mapped to the inflated surface of each participant's brain reconstruction, allowing visualization of data across the entire cortical surface (i.e., gyri and sulci) without the data being obscured by cortical folding. Each subject's reconstructed brain was then morphed to an average spherical surface representation that optimally aligned sulcal and gyral features across subjects (Fischl et al., 1999b). This procedure provides accurate matching of morphologically homologous cortical locations among participants on the basis of each individual's anatomy while minimizing metric distortions. This transform was used to map the thickness measurements onto a common spherical coordinate system. In addition, the cerebral cortex was parcellated into units based on gyral and sulcal structure (Fischl et al., 2004b; Desikan et al., 2006), and a variety of surface-based data, including maps of cortical volume and surface area as well as curvature and sulcal depth, was created. Data were resampled for all subjects onto a common spherical coordinate system (Fischl et al., 1999b).
Graph-theoretical network analysis
Network (graph) construction.
One of FreeSurfer's implemented parcellation schemes (aparc.a2005s) was used to compute mean cortical thickness in 154 anatomical structures across both cortical hemispheres (supplemental Fig. S1 and Table S2, available at www.jneurosci.org as supplemental material). These parcellations were used to construct the association (connectivity) matrix (Aij) based on the cortical thickness correlation matrix (Cij) between all pairs of parcellations, resulting in a 154 × 154 association matrix (network) for the synesthetes and one for the nonsynesthetes (supplemental Fig. S1, available at www.jneurosci.org as supplemental material). These networks are referred to here as whole cortical 154-node networks, and they were used to investigate connectivity across both entire cortical hemispheres. A list of the anatomical labels of the nodes in the whole cortical 154-node network is presented in supplemental Table S2 (available at www.jneurosci.org as supplemental material).
Connectivity within a particular brain structure such as the FuG or IPS cannot be investigated within the whole cortical 154-node network because the FuG and IPS of one hemisphere is represented only as one node each in that network. Therefore, we constructed a much finer parcellated network to investigate connectivity across cortices in more detail as well as within the FuG and IPS. To this end, the cortical surface model of FreeSurfer's surface template (fsaverage), onto which the individual surface models of the synesthetes and nonsynesthetes were spatially registered, was parcellated into 100-mm2-sized, strip-like-shaped 2366 cortical regions across both hemispheres (1187 and 1179 parcellations in the left and right hemisphere, respectively). The stripes were then reprojected onto each individual surface using the inverse transformations, and cortical thickness within each strip was measured by averaging across all vertices located within a particular strip. These 2366 parcellations were used to construct the association matrix (Aij) based on the cortical thickness correlation matrix (Cij) between all pairs of stripes, resulting in two 2366 × 2366 association matrices (networks), one for the synesthetes and one for the nonsynesthetes (Fig. 1). These networks are referred to here as whole cortical 2366-node networks and were constructed to investigate connectivity across both hemispheres as well as within the FuG and IPS.
Figure 1.
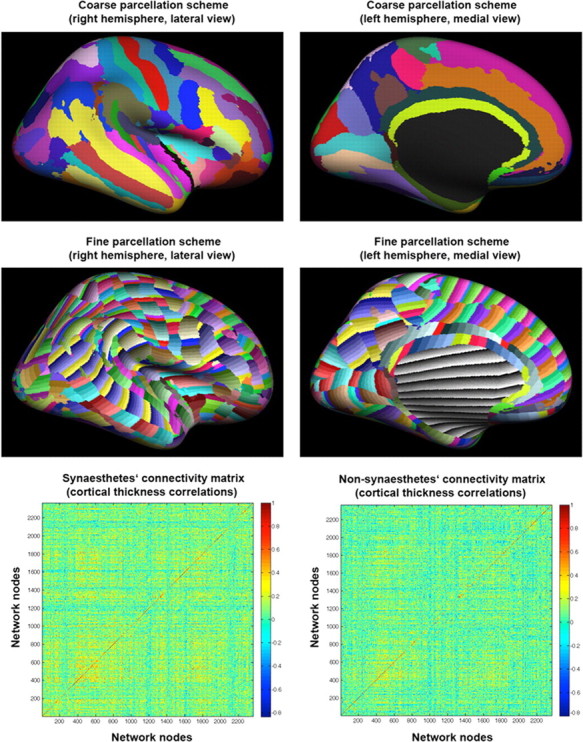
Parcellation scheme and connectivity (correlation) matrices of the whole cortical 2366-node network. Mean parcellation schemes of the right (lateral view) and left (medial view) hemisphere used to define the whole cortical 154-node (top row) and 2366-node (middle row) network nodes and the connectivity matrices (cortical thickness correlations) of the synesthetes (bottom row left) and nonsynesthetes (bottom row right), representing the undirected weighted edges of the whole cortical 2366-node networks, are shown. The connectivity matrices of the whole cortical 154-node networks of the two groups are shown in supplemental Figure S1 (available at www.jneurosci.org as supplemental material). Note that the black and greyish parcellations seen on the medial surfaces represent the medial wall and were not included for the network construction.
In addition, we investigated the connectivity of the FuG and its immediate neighboring areas in isolation from the rest of the brain. For this purpose, the whole cortex was divided into 2053 triangular parcellations, from which 66 nodes (parcellations) per hemisphere were selected that together comprise the fusiform-lingual network (supplemental Fig. S2, available at www.jneurosci.org as supplemental material). These nodes were located within the FuG, lingual gyrus, lingual sulcus, anterior and posterior part of the collateral transverse sulcus, lateral occipito-temporal sulcus, inferior occipital gyrus and sulcus, and the calcarine cortex. The calcarine cortex is not directly adjacent to the fusiform cortex but was included in this network because of our previous findings of changed cortical thickness in synesthetes in that visual region (Jäncke et al., 2009). These triangular parcellations were used to construct the fusiform-lingual association matrix (Aij) based on the cortical thickness correlation matrix (Cij) between all pairs of triangles, resulting in two 132 × 132 association matrices, one for the synesthetes and one for the nonsynesthetes (supplemental Fig. S2, available at www.jneurosci.org as supplemental material). The left FuG was parcellated into 18 nodes, and the right FuG was parcellated into 17 nodes. These networks are referred to here as fusiform-lingual 132-node networks and were constructed to investigate connectivity within the fusiform-lingual complex and its adjacent areas in isolation from all other cortical areas of the brain.
To rule out any influence of the node's shape (stripes vs triangles), we also investigated a high-resolution whole cortical 2053-node network derived from triangular-shaped parcellations (supplemental Fig. S2C, available at www.jneurosci.org as supplemental material). Network measurements of this whole cortical 2053-node network derived from triangular-shaped parcellations (results not shown) is very similar to the network measurements of the whole cortical 2366-node network derived from strip-shaped parcellations (see supplemental Discussion, available at www.jneurosci.org as supplemental material).
Threshold selection.
Networks (graphs) Gr were represented by weighted matrices (Aij, one matrix for each correlation threshold r) with N nodes and Kr edges, where nodes represent cortical regions and edges represent the weighted connections between these cortical regions. There is currently no definitive and generally accepted strategy for applying a particular threshold. Each connectivity matrix was therefore thresholded repeatedly over a wide range of correlation thresholds in increments of r = 0.025 from r = 0.15 to r = 0.525, resulting in 16 networks with different connection densities per group. The fusiform-lingual 132-node network was thresholded only up to r = 0.50 because at a correlation threshold of r = 0.525, several nodes would become disconnected from the network.
This kind of thresholding resulted in different number of edges between the networks of the groups because of differences in their inter-regional cortical thickness correlations (see Fig. 1 and supplemental Fig. S1, available at www.jneurosci.org as supplemental material). Thus, between-group differences in network characteristics might also reflect changes in wiring costs and not only alterations in the topological organization of the network (Achard and Bullmore, 2007; Stam et al., 2007). To control for this wiring cost effect, we also thresholded the correlation matrix (Cij) of the whole cortical 154-node and the fusiform-lingual 132-node networks of each group into matrices with fixed sparsities (percentages of edges by using relative correlation thresholds). Only results of the absolute thresholds are discussed here, but our sparsity analyses revealed that the network measures are not affected by these differing wiring costs (see supplemental Discussion, available at www.jneurosci.org as supplemental material).
Small-world analysis.
The network analysis software tnet was used to analyze the networks (Opsahl et al., 2008; Opsahl, 2009; Opsahl and Panzarasa, 2009). tnet allows analyzing weighted networks (http://opsahl.co.uk/tnet/). The networks were analyzed according to the theory of small-world networks as introduced by Watts and Strogatz (1998; Bullmore and Sporns, 2009). To make our network parameters comparable with those parameters obtained in similar studies that used cortical thickness correlations, we followed their procedures as closely as possible (He et al., 2007, 2008, 2009; Chen et al., 2008; Gong et al., 2009). Small-world indices were derived from the comparison of the real network with 100 random network realizations comprising the same number of nodes, edges, mean degree, and degree distribution. For the densest whole cortical 2366-node networks, <100 random networks were computed because of the enormous computational resources needed for constructing these random networks. However, this is not a problem because measurement variances are almost zero for such dense random networks. The procedure for constructing the random networks was described in more detail previously (Opsahl et al., 2008).
On the basis of these structural brain networks, key characteristics that describe the overall architecture of a network were computed, including the clustering coefficient Cr and the characteristic path length Lr (Watts and Strogatz, 1998). In binary networks, the Cr is the ratio between the number of connections between the direct neighbors of a node and the total number of possible connections between these neighbors and provides information about the level of local connectedness within a network. The characteristic Lr of a binary network gives the average number of connections that have to be crossed to travel from each node to every other node in the network and provides information about the level of global communication efficiency of a network (van den Heuvel et al., 2009). The definitions of Cr and Lr in weighted networks, as implemented in tnet (http://opsahl.co.uk/tnet/), are based on the sum of the weights, and these formulas were reported previously (Opsahl et al., 2008; Opsahl, 2009; Opsahl and Panzarasa, 2009).
Networks with small-world organization have a Cr that is higher than the Cr of a comparable random, organized network (Cr random), while still having a short characteristic Lr similar in length to that of an equivalent random network (Lr random). Formally, small-world networks show a ratio γr, defined as Cr real/Cr random of ≫1, and a ratio λr, defined as Lr real/Lr random of ∼1 (Watts and Strogatz, 1998; Sporns et al., 2004; Humphries et al., 2006; Humphries and Gurney, 2008). A high γr reflects a high level of local neighborhood clustering within a network, and a short normalized travel distance λr expresses a high level of global communication efficiency within a network (Watts and Strogatz, 1998; Sporns et al., 2004; Bullmore and Sporns, 2009).
Nodal centrality analysis.
Hub regions were evaluated by weighted degree and betweenness centrality measures that were originally proposed for binary networks by Freeman (1978). Degree in weighted networks is taken as the sum of weights and labeled node strength (Barrat et al., 2004; Newman, 2004). The formula of this measure for weighted networks was described in more detail previously (Opsahl et al., 2008; Opsahl, 2009; Opsahl and Panzarasa, 2009). Centrality of a node expresses its structural or functional importance. Highly central nodes may serve as way stations for network traffic (betweenness centrality) or as centers for information integration (degree centrality). Degree centrality is the sum of weights incident upon a node (i.e., the sum of weights of the edges that a node has). Degree is often interpreted in terms of the capability of a node to catch whatever is flowing through the network. Betweenness centrality relies on the calculation of shortest distances in the network (Wasserman and Faust, 1994). Nodes that occur on many shortest paths (geodesics) between other nodes have higher betweenness centrality than those that do not. A node with high betweenness centrality is interpreted as a gatekeeper that is able to control the information flow through the node. We focused on the nodes representing both FuG and IPS because of the proposed roles of these structures in the genesis of GCS (Hubbard and Ramachandran, 2005; Hubbard, 2007; Weiss and Fink, 2009). We used Pajek software (http://vlado.fmf.uni-lj.si/pub/networks/pajek/) to visualize weighted, averaged (across all networks) degree and betweenness centrality scores of the nodes in the networks of the synesthetes and nonsynesthetes. Note that degree and betweenness centrality measures of the fusiform-lingual 132-node network based only on connections among areas used to construct that fusiform-lingual network [see above, Network (graph) construction] and excluded the connections to all other cortical areas outside the fusiform-lingual complex.
Modularity analysis.
Modularity analyses aim at detecting community structures (modules) within networks by using decompositions such as hierarchical clustering. Many complex networks consist of a number of modules. Each module contains several densely interconnected nodes, and there are relatively few connections between nodes in different modules. Hubs can therefore be described in terms of their roles in this community structure (Bullmore and Sporns, 2009). To further characterize the nodes in the FuG and IPS in terms of intramodular (normalized within module degree) versus intermodular (participation coefficient) connectivity, we applied a hierarchical modularity analysis using the recently published Louvain algorithm (Meunier et al., 2009). Hierarchical modularity analysis was applied to each differently thresholded network of the whole cortical 2366-node and 154-node networks. The modularity measures (Q values) were averaged across all networks of a group, and the intramodular and intermodular connectivity measures were averaged across all networks of a group and across all FuG and IPS nodes in the case of the whole cortical 2366-node network. Note that, independent from the intrinsic connectivity architecture, a sparse connectivity and a higher number of modules goes with larger Q values.
Statistical analysis.
For the statistical comparisons of global cortical thickness, volume, and surface area, we used analysis of covariance, controlling for intracranial volume. For the variables age and intracranial volume, as well as for the small-world parameter, centrality, and modularity measurements, we used t tests for independent samples. Error probability was set to p < 0.05 (two-tailed hypothesis testing, if not stated otherwise) for a single comparison, and Bonferroni correction was applied in analyses in which multiple comparisons occurred.
Results
Age and global brain tissue characteristics are summarized in supplemental Table S1 (available at www.jneurosci.org as supplemental material). Right global cortical volume and left and right global cortical surface areas were increased in synesthetes compared with nonsynesthetes (corrected for intracranial volume), but these effects did not survive Bonferroni correction for multiple comparisons (corrected p = 0.05/7 = 0.007) and therefore will not be discussed further. There were no significant global mean cortical thickness differences between the groups. Thus, it was not necessary to correct for global cortical thickness.
Whole cortical 154-node and 2366-node network analysis
For reasons of completeness and comparability of the network parameters derived from the whole cortical 2366-node network with those derived from the 154-node network, we descriptively report also some differences in small-world parameters for the 2366-node network that were statistically not significant (see below). However, it is important to note that the effects reported in this study were consistently found in both the whole cortical 2366-node and the 154-node network analysis, but the error probabilities of these effects differed between the two network analyses.
In the absolute correlation threshold condition, the densest whole cortical 154-node network of the synesthetes comprised 6169 edges (connection density, 0.524), and the sparsest network comprised 764 edges (density, 0.067). In nonsynesthetes, the densest whole cortical network comprised of 5217 edges (density, 0.443), and the sparsest network comprised 399 edges (density, 0.034). These networks correspond to absolute correlation thresholds between r = 0.15 and r = 0.525. The connection densities of the whole cortical 154-node network were not statistically different between synesthetes and nonsynesthetes (mean/SD, 0.27/0.15 and 0.20/0.13; p = 0.18).
The densest whole cortical 2366-node network of the synesthetes comprised 1,066,127 edges (connection density, 0.381), and the sparsest network comprised 2468 edges (density, 0.00088). In nonsynesthetes, the densest whole cortical network comprised 923,552 edges (density, 0.330), and the sparsest network comprised 1,978 edges (density, 0.00071). These networks correspond to absolute correlation thresholds between r = 0.15 and r = 0.525. The connection densities of the whole cortical 2366-node network were not statistically different between synesthetes and nonsynesthetes (mean/SD, 0.15/0.12 and 0.12/0.10; p = 0.50).
Small-world analysis
Across the whole range of absolute correlation thresholds of the whole cortical 154-node network, mean weighted clustering (Cr) of the synesthetes' networks was significantly increased (p = 0.001) compared with the mean weighted Cr of the nonsynesthetes' networks (Fig. 2A). The mean weighted path lengths (Lr) were significantly shorter (p = 0.001) in synesthetes compared with nonsynesthetes (Fig. 2B). In synesthetes, the small-world indices γr (Cr real/Cr random) were significantly reduced (p = 0.011) across the whole range of correlation thresholds compared with nonsynesthetes (Fig. 2C). The small-world indices λr (Lr real/Lr random) were not significantly different (p = 0.17) between groups (Fig. 2D). In contrast, the classical small-world scalar parameter σ was significantly reduced (p = 0.003) in the networks of the synesthetes compared with the networks of the nonsynesthetes (Fig. 2E).
Figure 2.

Whole cortical 154-node network indices of the synesthetes and nonsynesthetes. Whole cortical network indices of the synesthetes (triangles) and the nonsynesthetes (squares) are shown. A, Mean weighted clustering coefficients (Cr). B, Mean weighted path lengths (Lr). C, Weighted clustering coefficient parameters γr defined as Cr real/Cr random. D, Weighted path length parameters λr defined as Lr real/Lr random. E, Small-world index σr defined as γr/λr. The x-axis represents the correlation coefficient at which the association matrix was thresholded.
Across the whole range of absolute correlation thresholds of the whole cortical 2366-node network, mean weighted clustering (Cr), a local network property, was increased in synesthetes compared with nonsynesthetes (Fig. 3A), but this difference did not reach statistical significance (p = 0.21). The mean weighted path length (Lr), a global network property, was not statistically different between groups (p = 0.66) (Fig. 3B). In synesthetes, the small-world indices γr (Cr real/Cr random), a local network property compared with random networks, were reduced across the whole range of correlation thresholds compared with the networks of the nonsynesthetes (Fig. 3C), but this difference did also not reach statistical significance (p = 0.22). The small-world indices λr (Lr real/Lr random), which is a global network property compared with random networks, were not different between groups (p = 0.23) (Fig. 3D). The classical small-world scalar parameter σ, which is defined as σr = γr/λr and indicates the integration of local and global network characteristics, was reduced in the networks of the synesthetes compared with the networks of the nonsynesthetes (Fig. 3E), but this difference did not reach statistical significance (p = 0.20).
Figure 3.

Whole cortical 2366-node network indices of the synesthetes and nonsynesthetes. Whole cortical network indices of the synesthetes (triangles) and the nonsynesthetes (squares) are shown. A, Mean weighted clustering coefficients (Cr). B, Mean weighted path lengths (Lr). C, Weighted clustering coefficient parameters γr defined as Cr real/Cr random. D, Weighted path length parameters λr defined as Lr real/Lr random. E, Small-world index σr defined as γr/λr. The x-axis represents the correlation coefficient at which the association matrix was thresholded.
Mean degree and betweenness centrality
Mean (across nodes) degree centrality scores were significantly increased in each single 154-node network in synesthetes compared with nonsynesthetes (all p < 0.0001, Bonferroni corrected p = 0.05/16 = 0.003). When comparing the mean degree centrality scores between the groups across all nodes and networks, synesthetes showed a statistical trend toward increased degree centrality (mean/SD, 14.76/8.36 in synesthetes and 9.99/7.00 in nonsynesthetes; p = 0.062).
With respect to the mean betweenness centrality in each single network, no significant differences were found between synesthetes and nonsynesthetes (all p > 0.027, Bonferroni corrected p = 0.05/16 = 0.003). Across the whole range of correlation thresholds and averaged across all nodes, mean betweenness centrality was not significantly different between groups (p = 0.21).
In each differently thresholded 2366-node network, mean (across nodes) degree centrality scores were significantly increased in synesthetes compared with nonsynesthetes (all p ≪ 0.0001, Bonferroni corrected p = 0.05/16 = 0.003). When comparing mean degree centrality between groups (averaged across all nodes and across the differently thresholded networks), synesthetes showed significantly increased degree centrality (mean/SD, 130.3/59.9 in synesthetes and 103.5/41.2 in nonsynesthetes; p ≪ 0.0001).
With respect to mean (across nodes) betweenness centrality in each single 2366-node network, significant as well as insignificant (after Bonferroni correction) decreases were found in synesthetes compared with nonsynesthetes (0.0001 ≪ p < 0.025, Bonferroni corrected p = 0.05/16 = 0.003). Betweenness centrality was significantly decreased in the sparser networks and also decreased in denser networks, but the decreases in the denser networks were statistically not significant. However, averaged across all nodes and across the whole range of correlation thresholds, synesthetes showed significantly decreased mean betweenness centrality (mean/SD, 1313.1/947.1 in synesthetes and 1409.6/872.9 in nonsynesthetes; p = 0.0003).
Identification of hub regions
Hub regions were identified by weighted mean degree and betweenness centrality scores averaged across all differently thresholded networks. The centrality scores of the 15 largest hubs and that of the FuG and IPS in the whole cortical 154-node network are listed in Table 1, and all mean degree and betweeneess centralities are visualized in Figures 4 and 5, respectively.
Table 1.
Hub regions in the cortical 154-node network revealed by weighted degree and betweenness centrality
| Synesthetes |
Nonsynesthetes |
|||||||
|---|---|---|---|---|---|---|---|---|
| Rank | Node | Absolute centrality | Normalized centrality | Rank | Node | Absolute centrality | Normalized centrality | |
| Degree | 1 | r_CgS_i | 42.4 | 0.2756 | 1 | r_MTG | 28.5 | 0.1851 |
| 2 | l_IFS | 36.6 | 0.2374 | 2 | l_FuG | 26.7 | 0.1732 | |
| 3 | l_FuG | 35.9 | 0.2333 | 3 | r_CgS_i | 26.3 | 0.1708 | |
| 4 | r_SOG | 35.3 | 0.2292 | 4 | r_OFG | 24.6 | 0.1598 | |
| 5 | l_InsG_L | 32.8 | 0.2130 | 5 | l_FMG | 24.5 | 0.1592 | |
| 6 | l_TMP | 32.1 | 0.2083 | 6 | r_SbGG | 24.1 | 0.1564 | |
| 7 | r_OCP | 32.0 | 0.2079 | 7 | r_SOG | 23.3 | 0.1511 | |
| 8 | l_OFS_H | 31.8 | 0.2065 | 8 | r_ITG | 22.8 | 0.1480 | |
| 9 | r_ITG | 31.0 | 0.2014 | 9 | r_Cun | 22.3 | 0.1448 | |
| 10 | l_TTS | 31.0 | 0.2014 | 10 | l_IFS | 22.1 | 0.1435 | |
| 11 | r_SPL | 31.0 | 0.2010 | 11 | r_InsG_L | 21.6 | 0.1400 | |
| 12 | l_IMS_pJ | 30.6 | 0.1988 | 12 | l_SbPS | 21.5 | 0.1397 | |
| 13 | r_LF_av | 30.2 | 0.1960 | 13 | l_OFS_H | 20.7 | 0.1343 | |
| 14 | r_CG_I | 29.9 | 0.1943 | 14 | l_CG_M | 19.7 | 0.1282 | |
| 15 | r_TTS | 29.8 | 0.1933 | 15 | r_IFG_Op | 19.6 | 0.1270 | |
| 19 | r_FuG | 28.1 | 0.1824 | 48 | r_FuG | 12.3 | 0.0797 | |
| 22 | r_IPS | 27.2 | 0.1765 | 108 | r_IPS | 6.1 | 0.0393 | |
| 68 | l_IPS | 15.4 | 0.1002 | 112 | l_IPS | 5.7 | 0.0372 | |
| Betweenness centrality | 1 | l_Pcu | 643.4 | 0.0553 | 1 | r_POS | 544.7 | 0.0468 |
| 2 | r_SFG | 408.8 | 0.0352 | 2 | l_SFG | 432.2 | 0.0372 | |
| 3 | r_POS | 353.0 | 0.0304 | 3 | l_POS | 420.9 | 0.0362 | |
| 4 | l_SFG | 298.1 | 0.0256 | 4 | l_Pcu | 399.1 | 0.0343 | |
| 5 | l_IFG_Op | 286.0 | 0.0246 | 5 | l_SbCG | 362.2 | 0.0311 | |
| 6 | l_IFG_Tr | 258.0 | 0.0222 | 6 | l_IPS | 332.3 | 0.0286 | |
| 7 | l_AOS | 255.0 | 0.0219 | 7 | l_AnG | 309.9 | 0.0266 | |
| 8 | r_CG_M | 232.6 | 0.0200 | 8 | l_CG_M | 304.2 | 0.0262 | |
| 9 | l_InsS_Ca | 207.7 | 0.0179 | 9 | l_LiG | 297.3 | 0.0256 | |
| 10 | l_MTG | 207.4 | 0.0178 | 10 | r_MTG | 287.3 | 0.0247 | |
| 11 | l_LiG | 195.1 | 0.0168 | 11 | l_ITG | 245.1 | 0.0211 | |
| 12 | l_AnG | 190.5 | 0.0164 | 12 | r_IFG_Tr | 242.9 | 0.0209 | |
| 13 | r_Cun | 185.9 | 0.0160 | 13 | l_PCL | 239.3 | 0.0206 | |
| 14 | l_PrCS_S | 175.8 | 0.0151 | 14 | l_SMG | 238.0 | 0.0205 | |
| 15 | r_OTS_m | 168.6 | 0.0145 | 15 | l_STS | 231.3 | 0.0199 | |
| 28 | l_IPS | 130.8 | 0.0112 | 37 | r_FuG | 116.4 | 0.0100 | |
| 45 | l_FuG | 98.0 | 0.0084 | 44 | l_FuG | 91.2 | 0.0078 | |
| 74 | r_IPS | 43.4 | 0.0037 | 95 | r_IPS | 37.2 | 0.0032 | |
| 94 | r_FuG | 28.1 | 0.0024 | |||||
Shown are the 15 largest hub regions. The ranks of the left and right FuG and IPS are shown also. Note the significantly higher degree centrality scores of the 15 largest hubs in synesthetes compared with nonsynesthetes (two-sample t test, p ≪ 0.0001). Although nonsynesthetes showed Increased betweenness centrality scores, this difference is not statistically significant (p = 0.21). Normalized degree centrality is computed by dividing the absolute degree by the number of nodes (154) in the network. Normalized betweenness centrality scores were computed by dividing the absolute betweenness by [(1/2) × (154 − 1) × (154 − 2)]. The values of the FuG and IPS are printed in bold. For the code of the structural parcellation labels, see supplemental Table S2 (available at www.jneurosci.org as supplemental material).
Figure 4.
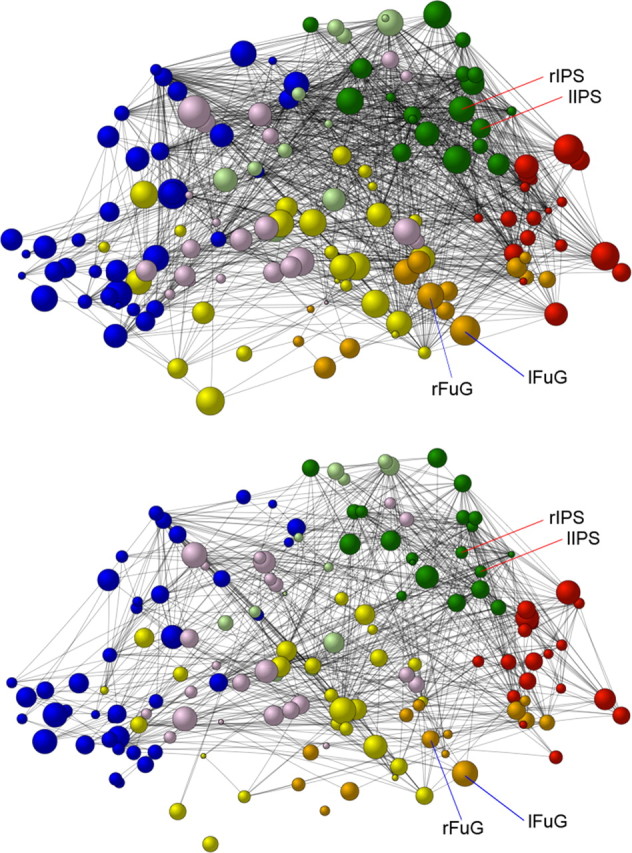
Weighted degree centrality of the nodes in the whole cortical 154-node network of the synesthetes and nonsynesthetes. Weighted degree centrality scores averaged across all networks (correlation thresholds) for the synesthetes (top) and the nonsynesthetes (bottom) are shown. Note that the size of the spheres represents the weighted degree centrality scores; the black lines represent the edges (connections) between the nodes, and the different colors represent the nodes within the different lobes (blue, frontal; pink, limbic; yellow, temporal; orange, temporo-occipital; red, occipital; green, parietal; light green, parieto-frontal). lFuG, rFuG, Left and right fusiform gyrus; lIPS, rIPS, left and right intraparietal sulcus.
Figure 5.
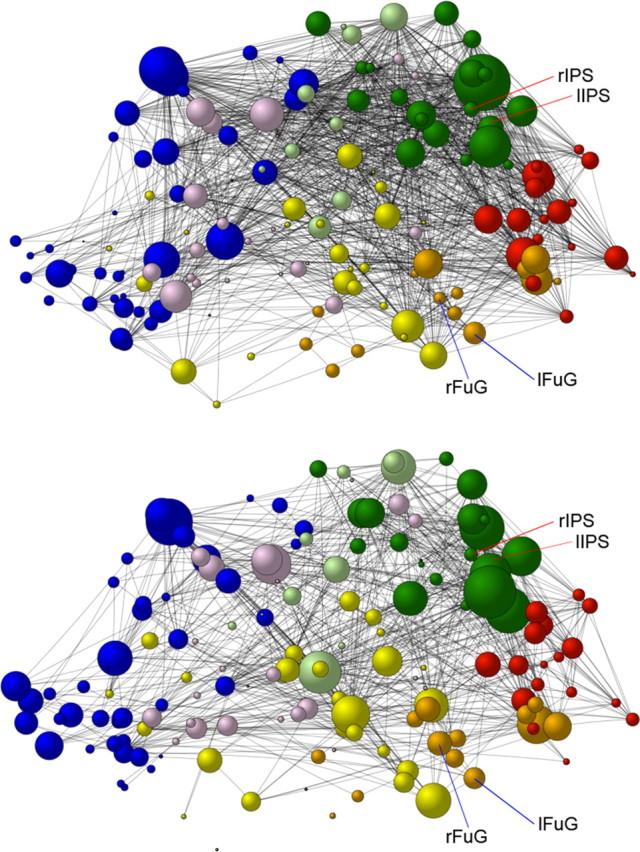
Weighted betweenness centrality of the nodes in the whole cortical 154-node network of the synesthetes and nonsynesthetes. Weighted betweenness centrality scores averaged across all networks (correlation thresholds) for the synesthetes (top) and the nonsynesthetes (bottom) are shown. Note that the size of the nodes represents the weighted betweenness centrality scores; the black lines represent the edges (connections) between the nodes, and the different colors represent the nodes within the different lobes (blue, frontal; pink, limbic; yellow, temporal; orange, temporo-occipital; red, occipital; green, parietal; light green, parieto-frontal). lFuG, rFuG, Left and right fusiform gyrus; lIPS, rIPS, left and right intraparietal sulcus.
Across the 15 largest hubs, mean degree centrality scores were significantly increased in synesthetes compared with nonsynesthetes (mean/SD, 31.3/5.3 in synesthetes and 20.7/6.4 in nonsynesthetes; p < 0.0001). The left FuG is one of the largest hub nodes in both groups, although its degree centrality is much higher in synesthetes than nonsynesthetes. The right FuG and both IPS are higher in the synesthetes' hub node (degree) hierarchy relative to the hierarchy of the nonsynesthetes. Mean degree centrality scores of the regions of interest averaged across all networks were as follows: left FuG, mean/SD for synesthetes and nonsynesthetes was 35.9/10.5 and 26.7/12.7 (p = 0.017); right FuG, 28.1/11.6 and 12.3/9.0 (p < 0.0001); left IPS, 15.4/8.9 and 5.7/4.9 (p = 0.0001); right IPS, 27.2/12.7 and 6.1/5.2 (p ≪ 0.0001).
With respect to betweenness centrality across the 15 largest hubs, there were no significant differences between the groups (p = 0.21). Mean betweenness centrality scores of the FuG and IPS averaged across all networks were as follows: left FuG, mean/SD for synesthetes and nonsynesthetes was 98.0/56.0 and 91.2/56.8 (p = 0.71); right FuG, 28.1/25.2.6 and 116.4/68.9 (p < 0.0001); left IPS, 130.8/39.6 and 332.3/245.7 (p = 0.0009); right IPS, 43.4/22.9 and 37.2/37.0 (p = 0.53).
Note that the differences in degree and betweenness centrality scores of the nodes in the FuG and IPS have a low specificity because a lot of other cortical areas (nodes) also showed statistically significant differences with respect to degree and/or betweenness centrality between synesthetes and nonsynesthetes.
The centralities scores of the 20 largest hubs in the whole cortical 2366-node network are listed in Table 2. All degree centralities and all betweenness centralities are visualized in supplemental Figs. S3 and S4 (available at www.jneurosci.org as supplemental material), respectively. Across the 20 largest hubs, mean degree centrality scores were significantly increased in synesthetes compared with nonsynesthetes (mean/SD, 308.3/18.1 in synesthetes and 228.7/8.6 in nonsynesthetes; p ≪ 0.0001). Degree centrality across all 14 left and across all 14 right fusiform nodes were statistically not significantly different between groups (p = 0.29 and p = 0.21, respectively). However, degree centrality across all 34 left intraparietal nodes was significantly increased in synesthetes compared with nonsynesthetes (mean/SD, 183.1/48.5 in synesthetes and 116.5/33.6 in nonsynesthetes; p ≪ 0.0001), and for the 34 right-hemispheric intraparietal nodes as well (mean/SD, 156.7/51.5 in synesthetes and 89.6/30.7 in nonsynesthetes; p ≪ 0.0001).
Table 2.
Hub regions in the whole cortical 2366-node network revealed by weighted degree and betweenness centrality
| Synesthetes |
Nonsynesthetes |
|||||||
|---|---|---|---|---|---|---|---|---|
| Rank | Node | Absolute centrality | Normalized centrality | Rank | Node | Absolute centrality | Normalized centrality | |
| Degree centrality | 1 | l_SMG div. 13 | 356.1 | 0.1505 | 1 | r_POS div. 6 | 249.3 | 0.1054 |
| 2 | l_SMG div. 14 | 348.6 | 0.1473 | 2 | l_SFG div. 5 | 236.6 | 0.1000 | |
| 3 | l_SMG div. 12 | 323.3 | 0.1366 | 3 | r_POS div. 12 | 236.3 | 0.0999 | |
| 4 | l_Pcu div. 15 | 319.1 | 0.1349 | 4 | r_POS div. 10 | 236.1 | 0.0998 | |
| 5 | r_PCL div. 12 | 316.3 | 0.1337 | 5 | r_CS div. 10 | 235.8 | 0.0996 | |
| 6 | l_Pcu div. 16 | 313.1 | 0.1323 | 6 | r_POS div. 9 | 235.2 | 0.0994 | |
| 7 | l_PrCG div. 27 | 312.5 | 0.1321 | 7 | l_SbCG div. 10 | 234.9 | 0.0993 | |
| 8 | l_SOS div. 3 | 309.6 | 0.1309 | 8 | r_SMG div. 21 | 234.1 | 0.0989 | |
| 9 | l_SFG div. 14 | 306.5 | 0.1295 | 9 | l_AnG div. 15 | 230.2 | 0.0973 | |
| 10 | l_PrCG div. 23 | 306.4 | 0.1295 | 10 | l_ITG div. 2 | 230.0 | 0.0972 | |
| 11 | l_MOG div. 14 | 301.9 | 0.1276 | 11 | l_AnG div. 14 | 227.8 | 0.0963 | |
| 12 | l_PrCG div. 26 | 300.8 | 0.1272 | 12 | r_POS div. 11 | 225.5 | 0.0953 | |
| 13 | r_PCL div. 10 | 300.4 | 0.1269 | 13 | l_POS div. 12 | 223.7 | 0.0945 | |
| 14 | r_PoCS div. 2 | 296.2 | 0.1252 | 14 | l_Pcun div. 17 | 223.7 | 0.0945 | |
| 15 | r_CG_M div. 6 | 296.1 | 0.1252 | 15 | r_SMG div. 20 | 223.0 | 0.0942 | |
| 16 | l_IFG_Tr div. 7 | 295.7 | 0.1250 | 16 | r_SMG div. 19 | 219.5 | 0.0928 | |
| 17 | l_PrCG div. 21 | 293.2 | 0.1239 | 17 | l_PCS div. 11 | 219.1 | 0.0926 | |
| 18 | l_SPL div. 20 | 290.5 | 0.1228 | 18 | r_SOG div. 10 | 217.9 | 0.0921 | |
| 19 | l_PrCG div. 22 | 289.6 | 0.1224 | 19 | r_OTS_m div. 9 | 217.8 | 0.0920 | |
| 20 | l_PCL div. 15 | 289.4 | 0.1223 | 20 | l_SPL div. 21 | 217.3 | 0.0918 | |
| Betweenness centrality | 1 | l_SMG div. 13 | 8050.9 | 0.0029 | 1 | r_POS div. 6 | 6090.8 | 0.0022 |
| 2 | l_CS div. 30 | 6048.4 | 0.0022 | 2 | l_ITG div. 2 | 5900.9 | 0.0021 | |
| 3 | l_SOS div. 3 | 5956.1 | 0.0021 | 3 | r_SMG div. 19 | 5783.9 | 0.0021 | |
| 4 | r_PCL div. 10 | 5954.9 | 0.0021 | 4 | l_AnG div. 15 | 5739.1 | 0.0021 | |
| 5 | r_TTG div. 2 | 5736.6 | 0.0021 | 5 | r_CS div. 10 | 5519.2 | 0.0020 | |
| 6 | l_PrCG div. 26 | 5592.5 | 0.0020 | 6 | l_Pcun div. 17 | 5286.1 | 0.0019 | |
| 7 | l_PrCG div. 23 | 5382.0 | 0.0019 | 7 | l_PoCG div. 1 | 5147.1 | 0.0018 | |
| 8 | l_PrCG div. 27 | 5339.9 | 0.0019 | 8 | l_MOG div. 14 | 5131.1 | 0.0018 | |
| 9 | l_OTS_l div. 1 | 5294.8 | 0.0019 | 9 | r_SMG div. 21 | 5071.6 | 0.0018 | |
| 10 | l_PoCS div. 28 | 5291.8 | 0.0019 | 10 | r_POS div. 8 | 4937.1 | 0.0018 | |
| 11 | r_PCL div. 12 | 5245.1 | 0.0019 | 11 | r_CG_M div. 3 | 4892.2 | 0.0018 | |
| 12 | l_SFG div. 14 | 5173.1 | 0.0019 | 12 | l_SOG div. 1 | 4887.3 | 0.0017 | |
| 13 | l_AOS div. 2 | 5117.3 | 0.0018 | 13 | l_ITG div. 3 | 4879.3 | 0.0017 | |
| 14 | l_MOG div. 14 | 5091.9 | 0.0018 | 14 | r_SMG div. 20 | 4853.5 | 0.0017 | |
| 15 | l_SMG div. 12 | 5081.1 | 0.0018 | 15 | l_IFS div. 5 | 4772.8 | 0.0017 | |
| 16 | l_SMG div. 14 | 5069.0 | 0.0018 | 16 | r_IFS div. 10 | 4747.1 | 0.0017 | |
| 17 | l_PrCG div. 22 | 5060.2 | 0.0018 | 17 | l_POS div. 9 | 4720.2 | 0.0017 | |
| 18 | l_STS div. 15 | 5025.1 | 0.0018 | 18 | r_SbCG div. 8 | 4675.4 | 0.0017 | |
| 19 | r_PoCS div. 2 | 4907.9 | 0.0018 | 19 | l_SbCG div. 10 | 4646.9 | 0.0017 | |
| 20 | l_IFG_Tr div. 7 | 4905.6 | 0.0018 | 20 | l_SMG div. 14 | 4628.9 | 0.0017 | |
Shown are the 20 largest hub regions. Note the significantly higher degree centrality scores of the 20 largest hubs in synesthetes compared with nonsynesthetes (two-sample t test, p ≪ 0.0001). Although synesthetes showed Increased betweenness centrality, this difference shows only a statistical trend toward significance (p = 0.069). Normalized degree centrality is computed by dividing the absolute degree by the number of nodes (2366) in the network. Normalized betweenness centrality is computed by dividing the absolute betweenness by [(1/2) × (2366 − 1) × (2366 − 2)]. For the code of the structural parcellation labels, see supplemental Table S2 (available at www.jneurosci.org as supplemental material). div., Division.
Across the 20 largest hubs, mean betweenness centrality scores tended to be significantly increased in synesthetes compared with nonsynesthetes (mean/SD, 5466/702 in synesthetes and 5116/454 in nonsynesthetes; p = 0.070). Betweenness centrality across all 14 left and across all 14 right fusiform nodes was not statistically different between groups (p = 0.91 and p = 0.10, respectively). Betweenness centrality across all 34 left intraparietal nodes was statistically not significant different between groups (p = 0.68). However, betweenness centrality across the 34 right intraparietal nodes was significantly increased in synesthetes compared with nonsynesthetes (mean/SD, 1477/823 in synesthetes and 1040/577 in nonsynesthetes, p = 0.011).
Modularity analysis
Hierarchical modularity analysis of the whole cortical 154-node network revealed, on average, 10–11 clusters in both groups (mean/SD, 9.9/8.4 clusters in synesthetes and 11.0/9.52 clusters in nonsynesthetes; p = 0.73). Modularity measures (Q values) ranged from 0.141 (densest network) to 0.373 (sparsest network) in synesthetes and from 0.184 to 0.552 in nonsynesthetes. Mean modularity was significantly lower in synesthetes compared with nonsynesthetes (mean/SD, 0.223/0.072 in synesthetes and 0.319/0.115 in nonsynesthetes; p = 0.0095).
Intramodular connectivity for the right FuG was not significantly different between groups (Bonferroni corrected). However, intramodular connectivity was increased in synesthetes compared with nonsynesthetes for the left FuG (mean/SD, 0.72/0.93 in synesthetes and −0.21/0.80 in nonsynesthetes; p = 0.0053), the left IPS (mean/SD, 1.50/0.20 in synesthetes and 0.80/0.49 in nonsynesthetes; p < 0.0001), and the right IPS (mean/SD, 0.41/0.24 in synesthetes and −0.30/0.31 in nonsynesthetes; p ≪ 0.0001).
Intermodular connectivity was not significantly different between groups for both FuG and for the left IPS (all p > 0.017, Bonferroni corrected p = 0.05/4 = 0.015). For the right IPS, however, intermodular connectivity was increased in synesthetes compared with nonsynesthetes (mean/SD, 0.99856/0.0012 in synesthetes and 0.98945/0.0114 in nonsynesthetes; p ≪ 0.0001).
Note that the differences in intramodular and intermodular connectivity of the nodes in the FuG and IPS have a low specificity because a lot of other cortical areas (nodes) also showed statistically significant differences in these connectivity measures between synesthetes and nonsynesthetes.
The hierarchical modularity analysis of the whole cortical 2366-node network revealed, on average, six to seven clusters in both groups (mean/SD, 6.0/2.3 clusters in synesthetes and 6.9/3.5 clusters in nonsynesthetes; p = 0.38). Modularity measures (Q values) ranged from 0.135 (densest network) to 0.367 (sparsest network) in synesthetes and from 0.142 to 0.411 in nonsynesthetes (mean/SD, 0.224/0.069 in synesthetes and 0.241/0.081 in nonsynesthetes; p = 0.53).
When focusing on intramodular connectivity (normalized within-module degree) of the FuG and IPS nodes, there were no significant differences between synesthetes and nonsynesthetes for both FuG and for the left IPS (all p > 0.50). The synesthetes' right IPS, however, showed significantly increased intramodular connectivity (z-score; mean/SD, 0.32/0.83 in synesthetes and −0.43/0.51 in nonsynesthetes; p < 0.0001).
With respect to intermodular connectivity (participation coefficient), there was no significant difference for the left and right FuG nodes between the groups (p = 0.82 and p = 0.24, respectively). For the left IPS, intermodular connectivity was increased in synesthetes compared with nonsynesthetes (participation coefficient; mean/SD, 0.99972/0.0006 in synesthetes and 0.99908/0.0011 in nonsynesthetes; p = 0.006), and for the right IPS as well (mean/SD, 0.99943/0.0008 in synesthetes and 0.99783/0.0031 in nonsynesthetes; p = 0.005).
Fusiform-lingual 132-node network analysis
The main results of the present study are based on the whole cortical 2366-node and 154-node network. We did perform an additional analysis on the fusiform-lingual network. This 132-node network was constructed in isolation from other cortical areas outside the fusiform-lingual complex, except its directly adjacent areas. This analysis showed no significant differences between synesthetes and nonsynesthetes in clustering, path length, gamma, lambda, and sigma (see supplemental Results and supplemental Fig. S5, available at www.jneurosci.org as supplemental material).
Mean degree and betweenness centrality across all nodes and networks were not significantly different between the groups. However, mean degree centrality averaged across the 18 left FuG nodes was significantly decreased in synesthetes (mean/SD, 7.5/3.3 in synesthetes and 10.2/4.2 in nonsynesthetes; p = 0.034). Mean degree centrality averaged across the 17 right FuG nodes was also significantly decreased in synesthetes (mean/SD 8.7/3.0 in synesthetes and 12.4/2.6 in nonsynesthetes; p = 0.0005). There were no significant differences between synesthetes and nonsynesthetes in betweenness centrality. Please note that degree and betweenness centrality within the fusiform-lingual 132-node network was based only on edges (connections) within the fusiform-lingual complex and its adjacent cortical areas, meaning that all edges to other cortical areas located outside of the fusiform-lingual complex and its adjacent cortical areas were excluded.
The direction of the effects (and their statistical significance) of the different network parameters, the network efficiency, and the shifts toward a more regular or random network configuration of the whole cortical 2366-node, whole cortical 154-node, and fusiform-lingual 132-node networks are summarized in Table 3.
Table 3.
Summary of the direction of effects, statistical significance, network efficiency, and shifts in network configuration toward a more regular or random organization
| Network measure | Direction of effects | Statistical significance (p) | Network efficiency |
Shift in configuration |
|||
|---|---|---|---|---|---|---|---|
| Global | Local | Regular | Random | ||||
| Whole cortical 2366-node network | Clustering coefficient (Cr) | Inc. in syn | 0.21 | Increased | In syn | ||
| Path lengths (Lr) | Dec. in syn | 0.66 | Increased | In syn | |||
| Gamma (Cr real/Cr random) | Dec. in syn | 0.22 | Increased | In syn | |||
| Lambda (Lr real/Lr random) | No effect | 0.23 | Similar | Similar | No shift | No shift | |
| Sigma (gamma/lambda) | Dec. in syn | 0.20 | Increased | In syn | |||
| Degree across nodes and networks | Inc. in syn*** | 1.7 × 10−70 | Increased | ||||
| Betweenness across nodes and networks | Dec. in syn*** | 0.0003 | Decreased | ||||
| Degree left FuG | Inc. in syn | 0.29 | Increased | ||||
| Degree right FuG | Inc. in syn | 0.21 | Increased | ||||
| Betweenness left FuG | Inc. in syn | 0.91 | Increased | ||||
| Betweenness right FuG | Dec. in syn | 0.10 | Decreased | ||||
| Degree left IPS | Inc. in syn*** | 1.6 × 10⁻⁸ | Increased | ||||
| Degree right IPS | Inc. in syn*** | 9.2 × 10⁻⁹ | Increased | ||||
| Betweenness left IPS | Inc. in syn | 0.68 | Increased | ||||
| Betweenness right IPS | Inc. in synBonf. | 0.011 | Increased | ||||
| Whole cortical 154-node network | Clustering coefficient (Cr) | Inc. in syn*** | 0.001 | Increased | In syn | ||
| Path lengths (Lr) | Dec. in syn** | 0.001 | Increased | In syn | |||
| Gamma (Cr real/Cr random) | Dec. in syn* | 0.011 | Increased | In syn | |||
| Lambda (Lr real/Lr random) | Inc. in syn | 0.17 | Increased | In syn | |||
| Sigma (gamma/lambda) | Dec. in syn** | 0.003 | Increased | In syn | |||
| Degree across nodes and networks | Inc. in syn | 0.062 | Increased | ||||
| Betweenness across nodes and networks | Dec. in syn | 0.21 | Decreased | ||||
| Degree left FuG | Inc. in synBonf. | 0.017 | Increased | ||||
| Degree right FuG | Inc. in syn*** | 2.3 × 10⁻⁵ | Increased | ||||
| Betweenness left FuG | Inc. in syn | 0.71 | Increased | ||||
| Betweenness right FuG | Dec. in syn*** | 4.0 × 10⁻⁶ | Decreased | ||||
| Degree left IPS | Inc. in syn*** | 0.0001 | Increased | ||||
| Degree right IPS | Inc. in syn*** | 3.8 × 10⁻⁸ | Increased | ||||
| Betweenness left IPS | Dec. in syn*** | 0.0009 | Decreased | ||||
| Fusiform-lingual 132-node network | Clustering coefficient (Cr) | No effect | 0.69 | Similar | Similar | No shift | No shift |
| Path lengths (Lr) | No effect | 0.68 | Similar | Similar | No shift | No shift | |
| Gamma (Cr real/Cr random) | No effect | 0.73 | Similar | Similar | No shift | No shift | |
| Lambda (Lr real/Lr random) | No effect | 0.82 | Similar | Similar | No shift | No shift | |
| Sigma (gamma/lambda) | No effect | 0.70 | Similar | Similar | No shift | No shift | |
| Degree across nodes and networks | No effect | 0.23 | Similar | Similar | |||
| Betweenness across nodes and networks | No effect | 0.82 | Similar | Similar | |||
| Degree left fusiform subregions | Dec. in syn* | 0.034 | Decreased | ||||
| Degree right fusiform subregions | Dec. in syn*** | 0.0005 | Decreased | ||||
| Betweenness left fusiform subregions | Inc. in syn | 0.70 | Increased | ||||
| Betweenness right fusiform subregions | Inc. in syn | 0.13 | Increased | ||||
These measures are shown for the whole cortical 2366-node network (top third), the whole cortical 154-node network (middle third), and the fusiform-lingual 132-node network (bottom third). Note that shifts in network configuration toward a more regular or random configuration are relative to the other group. Dec., Decreased; Inc., Increased; r, correlation threshold; syn, synesthetes;
*p < 0.05;
**p < 0.01;
***p < 0.001; Bonf., not statistically significant after Bonferroni correction.
Discussion
MRI surface-based morphometry and graph theoretical network analysis revealed small-worldness of structural brain networks of both grapheme-color synesthetes and nonsynesthetes. This is because networks had an almost identical path length (λr ≈ 1) (Fig. 2D,3D) but were more locally clustered (γr > 1) (Figs. 2C, 3C) compared with matched random networks, and this finding is consistent with network analyses of data derived from cortical thickness correlations as well as diffusion tensor and spectrum imaging-based fiber tractography in normal and clinical samples (He et al., 2007, 2008, 2009; Bassett et al., 2008; Chen et al., 2008; Hagmann et al., 2008; Gong et al., 2009; Li et al., 2009).
Analysis based on the whole cortical 154-node and 2366-node network
We report first evidence of differences in topological characteristics of structural brain networks across the entire cortex between synesthetes and nonsynesthetes. Clustering coefficients were significantly increased in the synesthete's brain indicating higher local hyperconnectivity (cliquishness) of cortical areas in GCS, suggesting an increased capability in local information processing and integration as well as a shift of the synesthetes' network topology toward a more regular configuration. Path lengths tended to be shorter in synesthetes, suggesting increased network efficiency (i.e., faster global information propagation).
In comparison of the real network with 100 random networks, the γr ratio (Cr real/Cr random) was significantly reduced in synesthetes compared with nonsynesthetes, suggesting that the network of the former is shifted toward a more random configuration compared with that of the latter. A more random network configuration is associated with increased efficiency in global information propagation.
By integrating the clustering coefficient (a local network property) and the path length (a global network property) relative to random networks into the measure of small-worldness, σr = γr/λr, it is evident that small-world properties are significantly reduced in grapheme-color synesthetes. This indicates that the topological network organization (connectivity architecture) in synesthetes deviates strongly from that found in nonsynesthetes whereby increased clustering of the synesthetes' networks is the predominant feature of their reduced small-world architecture. Note that although clustering was increased in synesthetes' networks, it is actually lower than what would be expected in an equivalent network with a random configuration, and therefore these networks, in fact, have reduced small-worldness compared with nonsynesthetes.
“Small worlds” are attractive models for the description of complex brain networks because they support both local segregated and integrated information processing (Sporns et al., 2004) and minimize the brain's wiring costs while simultaneously maximizing the efficiency of global information propagation (Kaiser and Hilgetag, 2006; Achard and Bullmore, 2007). Since small-world networks reflect an optimal balance between local processing specialization/integration and global information propagation, higher clustering in the synesthetes' networks indicates a disruption of this normal balance. Regular lattices have been suggested as reducing global signal propagation speed and synchronisability compared with small-world networks (Strogatz, 2001). We do not consider synesthesia to be a disorder, but, as far as clustering is concerned, an altered network architecture similar to that found in the present study for grapheme-color synesthetes was found in patients with Alzheimer's disease (AD) (He et al., 2008), although these AD patients showed slightly longer path lengths rather than slightly shorter path lengths as synesthetes. This pattern of topological organization leads to an increase in local network efficiency, but a decrease in global efficiency compared with elderly control subjects, suggesting a more regular network configuration in AD (He et al., 2008). This is in contrast to the reduced local network efficiency reported in multiple sclerosis (He et al., 2009). In our synesthetes, local network efficiency is enhanced, as indicated by increased clustering and reduced gamma and sigma. These GCS-related changes in small-world characteristics might be considered as reflecting a less optimal topological network organization characterized by increased clustering and reduced small-worldness. This has implications for the understanding of the relationship between brain network topological characteristics and the evolution of the synesthetic experience of graphemes in GCS. Together, these results suggest that hyperconnectivity in synesthetes is global and not restricted to the FuG and IPS as implied by the current synesthesia literature.
The results of the centrality measurement analyses were in accordance with the findings of the small-world analysis. Mean (across nodes and networks) degree centrality was significantly increased in synesthetes compared with nonsynesthetes. Within the whole cortical 154-node network, both FuG and IPS revealed higher-degree centrality in the networks of the synesthetes. In the whole cortical 2366-node networks, the FuG and IPS nodes showed increased degree centrality scores in synesthetes, but only degree centrality of the IPS nodes were significantly different between groups. Indeed, this suggests that the IPS (and FuG) is globally hyperconnected with other nodes in the synesthete's network. However, this finding has a low specificity because a lot of other nodes (42 of 154) in the 154-node network of the synesthetes showed also significant differences in degree centrality scores: 37 of these 42 nodes showed increased centrality in synesthetes. A similar low specificity of increased FuG and IPS degree centrality was also found for the 2366-node network. The findings in degree centrality support the notion that topological alterations in the network of the synesthetes are widespread and go beyond the FuG and IPS. Other nodes with increased degree centrality in the whole cortical 154-node network were located in the right planum polare, left superior temporal sulcus, left temporal pole, left pars triangularis, right Heschl's sulcus, left precuneus, and regions of the right insula. It is interesting to note that most of these high-degree centrality nodes in the whole cortical 154-node network can be associated with auditory processing, and it has been recently reported that some of these areas are also involved in GCS (Rouw and Scholte, 2010).
The hierarchical modularity analysis of the whole cortical 2366-node and 154-node networks revealed increased intramodular and also intermodular connectivity of the IPS in the synesthetes' brain. However, modularity of structural brain networks was significantly reduced in the whole cortical 154-node networks of synesthetes compared with nonsynesthetes, suggesting a reduced modular brain organization in GCS, which might have functional consequences.
Analysis based on the fusiform-lingual 132-node network
When looking for hyperconnectivity of the FuG within the fusiform-lingual 132-node network, no significant differences in network architecture were found between synesthetes and nonsynesthetes. Neither the clustering coefficients and path lengths nor the small-world indices and betweenness centrality scores were significantly different between synesthetes and nonsynesthetes. Unexpectedly, mean degree centrality of fusiform subregions was significantly decreased in synesthetes compared with nonsynesthetes, suggesting hypoconnectivity within the ventral visual stream but simultaneously suggesting hyperconnectivity of the FuG nodes to areas outside of the fusiform-lingual complex. This is further evidence for a global instead of a local hyperconnectivity in GCS. Our finding derived from the analysis of the fusiform-lingual 132-node network is not compatible with the idea that GCS originates from hyperconnectivity between visual word form areas and the color processing areas, which are both located on the FuG (Hubbard and Ramachandran, 2005; Hubbard, 2007).
Is GCS not the only phenotype?
We suggest that synesthetic experiences might be only one phenotypic manifestation of the reduced small-world architecture in synesthetes. Such an interpretation has already been proposed by Bargary and Mitchell (2008). Widespread differences in the topological organization of white matter connectivity within the synesthetic brain as well as the low modularity of the synesthetes' connectivity architecture are compatible with reports of other phenotypic manifestations in synesthetes, including possible differences in creativity (Ward et al., 2008), mental imagery (Barnett and Newell, 2008), and higher incidence of “Mitempfindung” (the referral of a tactile sensation to a location far away from the stimulation site) (Burrack et al., 2006). Furthermore, some synesthetes have an extraordinary autobiographical memory capacity (Parker et al., 2006), and time–space synesthetes show enhanced performance in temporal and visuospatial tasks (Simner et al., 2009).
Whether the reduced small-world organization of structural brain network in synesthetes is caused by a failure in neural pruning (Kennedy et al., 1997; Rodman and Moore, 1997) or even by synaptic sprouting (Armel and Ramachandran, 1999) remains to be shown in future investigations. Several methodological considerations of the present study, including differences in results between the 154-node and 2366-node networks, are addressed in the supplemental Discussion (available at www.jneurosci.org as supplemental material).
Conclusions
The present findings reveal reduced small-world topology of structural brain networks in grapheme-color synesthetes. Reduced small-worldness in GCS is driven by increased clustering, suggesting that the synesthete's brain as a whole is strongly hyperconnected. This altered pattern of connectivity indicates a disruption of the normal interplay between local information integration and global information propagation and is associated with increased local network processing efficiency. We concluded that hyperconnectivity is not restricted to the FuG and IPS, implying that synesthetic experiences might be only one phenotypic manifestation of the reduced small-world architecture in synesthetes. Although our findings provide strong evidence for a globally hyperconnected brain architecture in synesthetes, we cannot entirely rule out the proposed pivotal role of the FuG and IPS in GCS.
Footnotes
L.J. was supported by a grant from the Swiss National Foundation (32003B_121927). We thank the synesthetes and nonsynesthetes for their participation in the study. We also thank Dr. Tore Opsahl for assistance with the tnet software and Dr. Gian Beeli for recruiting the participants and for data acquisition. We acknowledge Marcus Cheetham for improving the English of a former version of this manuscript.
The authors declare no competing financial interests.
References
- Achard S, Bullmore E. Efficiency and cost of economical brain functional networks. PLoS Comput Biol. 2007;3:e17. doi: 10.1371/journal.pcbi.0030017. [DOI] [PMC free article] [PubMed] [Google Scholar]
- Annett MA. A classification of hand preference by association analysis. Br J Psychol. 1970;61:303–321. doi: 10.1111/j.2044-8295.1970.tb01248.x. [DOI] [PubMed] [Google Scholar]
- Armel KC, Ramachandran VS. Acquired synesthesia in retinitis pigmentosa. Neurocase. 1999;5:293–296. [Google Scholar]
- Bargary G, Mitchell KJ. Synaesthesia and cortical connectivity. Trends Neurosci. 2008;31:335–342. doi: 10.1016/j.tins.2008.03.007. [DOI] [PubMed] [Google Scholar]
- Barnett KJ, Newell FN. Synaesthesia is associated with enhanced, self-rated visual imagery. Conscious Cogn. 2008;17:1032–1039. doi: 10.1016/j.concog.2007.05.011. [DOI] [PubMed] [Google Scholar]
- Baron-Cohen S, Wyke MA, Binnie C. Hearing words and seeing colours: an experimental investigation of a case of synaesthesia. Perception. 1987;16:761–767. doi: 10.1068/p160761. [DOI] [PubMed] [Google Scholar]
- Barrat A, Barthélemy M, Pastor-Satorras R, Vespignani A. The architecture of complex weighted networks. Proc Natl Acad Sci U S A. 2004;101:3747–3752. doi: 10.1073/pnas.0400087101. [DOI] [PMC free article] [PubMed] [Google Scholar]
- Bassett DS, Bullmore E, Verchinski BA, Mattay VS, Weinberger DR, Meyer-Lindenberg A. Hierarchical organization of human cortical networks in health and schizophrenia. J Neurosci. 2008;28:9239–9248. doi: 10.1523/JNEUROSCI.1929-08.2008. [DOI] [PMC free article] [PubMed] [Google Scholar]
- Beeli G, Esslen M, Jancke L. Time course of neural activity Correlated with colored-hearing synesthesia. Cereb Cortex. 2008;18:379–385. doi: 10.1093/cercor/bhm072. [DOI] [PubMed] [Google Scholar]
- Bullmore E, Sporns O. Complex brain networks: graph theoretical analysis of structural and functional systems. Nat Rev Neurosci. 2009;10:186–198. doi: 10.1038/nrn2575. [DOI] [PubMed] [Google Scholar]
- Burrack A, Knoch D, Brugger P. Mitempfindung in synaesthetes: co-incidence or meaningful association? Cortex. 2006;42:151–154. doi: 10.1016/s0010-9452(08)70339-3. [DOI] [PubMed] [Google Scholar]
- Chen ZJ, He Y, Rosa-Neto P, Germann J, Evans AC. Revealing modular architecture of human brain structural networks by using cortical thickness from MRI. Cereb Cortex. 2008;18:2374–2381. doi: 10.1093/cercor/bhn003. [DOI] [PMC free article] [PubMed] [Google Scholar]
- Dale AM, Fischl B, Sereno MI. Cortical surface-based analysis: I. Segmentation and surface reconstruction. Neuroimage. 1999;9:179–194. doi: 10.1006/nimg.1998.0395. [DOI] [PubMed] [Google Scholar]
- Desikan RS, Sègonne F, Fischl B, Quinn BT, Dickerson BC, Blacker D, Buckner RL, Dale AM, Maguire RP, Hyman BT, Albert MS, Killiany RJ. An automated labeling system for subdividing the human cerebral cortex on MRI scans into gyral based regions of interest. Neuroimage. 2006;31:968–980. doi: 10.1016/j.neuroimage.2006.01.021. [DOI] [PubMed] [Google Scholar]
- Esterman M, Verstynen T, Ivry RB, Robertson LC. Coming unbound: disrupting automatic integration of synesthetic color and graphemes by transcranial magnetic stimulation of the right parietal lobe. J Cogn Neurosci. 2006;18:1570–1576. doi: 10.1162/jocn.2006.18.9.1570. [DOI] [PubMed] [Google Scholar]
- Fischl B, Dale AM. Measuring the thickness of the human cerebral cortex from magnetic resonance images. Proc Natl Acad Sci U S A. 2000;97:11050–11055. doi: 10.1073/pnas.200033797. [DOI] [PMC free article] [PubMed] [Google Scholar]
- Fischl B, Sereno MI, Dale AM. Cortical surface-based analysis: II: Inflation, flattening, and a surface-based coordinate system. Neuroimage. 1999a;9:195–207. doi: 10.1006/nimg.1998.0396. [DOI] [PubMed] [Google Scholar]
- Fischl B, Sereno MI, Tootell RBH, Dale AM. High-resolution intersubject averaging and a coordinate system for the cortical surface. Hum Brain Mapp. 1999b;8:272–284. doi: 10.1002/(SICI)1097-0193(1999)8:4<272::AID-HBM10>3.0.CO;2-4. [DOI] [PMC free article] [PubMed] [Google Scholar]
- Fischl B, Liu A, Dale AM. Automated manifold surgery: constructing geometrically accurate and topologically correct models of the human cerebral cortex. IEEE Trans. 2001;20:70–80. doi: 10.1109/42.906426. [DOI] [PubMed] [Google Scholar]
- Fischl B, Salat DH, Busa E, Albert M, Dieterich M, Haselgrove C, van der Kouwe A, Killiany R, Kennedy D, Klaveness S, Montillo A, Makris N, Rosen B, Dale AM. Whole brain segmentation: automated labeling of neuroanatomical structures in the human brain. Neuron. 2002;33:341–355. doi: 10.1016/s0896-6273(02)00569-x. [DOI] [PubMed] [Google Scholar]
- Fischl B, Salat DH, van der Kouwe AJW, Makris N, Segonne F, Quinn BT, Dale AM. Sequence-independent segmentation of magnetic resonance images. Neuroimage. 2004a;23:S69–S84. doi: 10.1016/j.neuroimage.2004.07.016. [DOI] [PubMed] [Google Scholar]
- Fischl B, van der Kouwe A, Destrieux C, Halgren E, Segonne F, Salat DH, Busa E, Seidman LJ, Goldstein J, Kennedy D, Caviness V, Makris N, Rosen B, Dale AM. Automatically parcellating the human cerebral cortex. Cereb Cortex. 2004b;14:11–22. doi: 10.1093/cercor/bhg087. [DOI] [PubMed] [Google Scholar]
- Freeman LC. Centrality in social networks conceptual clarification. Soc Netw. 1978;1:215–239. [Google Scholar]
- Gong G, He Y, Concha L, Lebel C, Gross DW, Evans AC, Beaulieu C. Mapping anatomical connectivity patterns of human cerebral cortex using in vivo diffusion tensor imaging tractography. Cereb Cortex. 2009;19:524–536. doi: 10.1093/cercor/bhn102. [DOI] [PMC free article] [PubMed] [Google Scholar]
- Hagmann P, Cammoun L, Gigandet X, Meuli R, Honey CJ, Wedeen VJ, Sporns O. Mapping the structural core of human cerebral cortex. PLoS Biol. 2008;6:e159. doi: 10.1371/journal.pbio.0060159. [DOI] [PMC free article] [PubMed] [Google Scholar]
- Hänggi J, Beeli G, Oechslin MS, Jäncke L. The multiple synaesthete E.S.—Neuroanatomical basis of interval-taste and tone-colour synaesthesia. Neuroimage. 2008;43:192–203. doi: 10.1016/j.neuroimage.2008.07.018. [DOI] [PubMed] [Google Scholar]
- He Y, Chen ZJ, Evans AC. Small-world anatomical networks in the human brain revealed by cortical thickness from MRI. Cereb Cortex. 2007;17:2407–2419. doi: 10.1093/cercor/bhl149. [DOI] [PubMed] [Google Scholar]
- He Y, Chen Z, Evans A. Structural insights into aberrant topological patterns of large-scale cortical networks in Alzheimer's disease. J Neurosci. 2008;28:4756–4766. doi: 10.1523/JNEUROSCI.0141-08.2008. [DOI] [PMC free article] [PubMed] [Google Scholar]
- He Y, Dagher A, Chen Z, Charil A, Zijdenbos A, Worsley K, Evans A. Impaired small-world efficiency in structural cortical networks in multiple sclerosis associated with white matter lesion load. Brain. 2009 doi: 10.1093/brain/awp089. awp089. [DOI] [PMC free article] [PubMed] [Google Scholar]
- Honey CJ, Sporns O, Cammoun L, Gigandet X, Thiran JP, Meuli R, Hagmann P. Predicting human resting-state functional connectivity from structural connectivity. Proc Natl Acad Sci U S A. 2009;106:2035–2040. doi: 10.1073/pnas.0811168106. [DOI] [PMC free article] [PubMed] [Google Scholar]
- Hubbard EM. Neurophysiology of synesthesia. Curr Psychiatry Rep. 2007;9:193–199. doi: 10.1007/s11920-007-0018-6. [DOI] [PubMed] [Google Scholar]
- Hubbard EM, Ramachandran VS. Neurocognitive mechanisms of synesthesia. Neuron. 2005;48:509–520. doi: 10.1016/j.neuron.2005.10.012. [DOI] [PubMed] [Google Scholar]
- Hubbard EM, Piazza M, Pinel P, Dehaene S. Interactions between number and space in parietal cortex. Nat Rev Neurosci. 2005a;6:435–448. doi: 10.1038/nrn1684. [DOI] [PubMed] [Google Scholar]
- Hubbard EM, Arman AC, Ramachandran VS, Boynton GM. Individual differences among grapheme-color synesthetes: brain-behavior correlations. Neuron. 2005b;45:975–985. doi: 10.1016/j.neuron.2005.02.008. [DOI] [PubMed] [Google Scholar]
- Humphries MD, Gurney K. Network “small-world-ness”: a quantitative method for determining canonical network equivalence. PLoS One. 2008;3:e0002051. doi: 10.1371/journal.pone.0002051. [DOI] [PMC free article] [PubMed] [Google Scholar]
- Humphries MD, Gurney K, Prescott TJ. The brainstem reticular formation is a small-world, not scale-free, network. Proc R Soc Lond B Biol Sci. 2006;273:503–511. doi: 10.1098/rspb.2005.3354. [DOI] [PMC free article] [PubMed] [Google Scholar]
- Jäncke L, Beeli G, Eulig C, Hänggi J. The neuroanatomy of grapheme-color synesthesia. Eur J Neurosci. 2009;29:1287–1293. doi: 10.1111/j.1460-9568.2009.06673.x. [DOI] [PubMed] [Google Scholar]
- Kaiser M, Hilgetag CC. Nonoptimal component placement, but short processing paths, due to long-distance projections in neural systems. PLoS Comput Biol. 2006;2:e95. doi: 10.1371/journal.pcbi.0020095. [DOI] [PMC free article] [PubMed] [Google Scholar]
- Kennedy H, Batardiere A, Dehay C, Barone P. Synaesthesia: implications for developmental neurobiology. In: Baron-Cohen S, Harrison JE, editors. Synaesthesia: classic and contemporary readings. Oxford: Blackwell; 1997. pp. 243–256. [Google Scholar]
- Kuperberg GR, Broome MR, McGuire PK, David AS, Eddy M, Ozawa F, Goff D, West WC, Williams SCR, van der Kouwe AJW, Salat DH, Dale AM, Fischl B. Regionally localized thinning of the cerebral cortex in schizophrenia. Arch Gen Psychiatry. 2003;60:878–888. doi: 10.1001/archpsyc.60.9.878. [DOI] [PubMed] [Google Scholar]
- Lerch JP, Worsley K, Shaw WP, Greenstein DK, Lenroot RK, Giedd J, Evans AC. Mapping anatomical correlations across cerebral cortex (MACACC) using cortical thickness from MRI. Neuroimage. 2006;31:993–1003. doi: 10.1016/j.neuroimage.2006.01.042. [DOI] [PubMed] [Google Scholar]
- Li Y, Liu Y, Li J, Qin W, Li K, Yu C, Jiang T. Brain anatomical network and intelligence. PLoS Comput Biol. 2009;5:e1000395. doi: 10.1371/journal.pcbi.1000395. [DOI] [PMC free article] [PubMed] [Google Scholar]
- Mechelli A, Friston KJ, Frackowiak RS, Price CJ. Structural covariance in the human cortex. J Neurosci. 2005;25:8303–8310. doi: 10.1523/JNEUROSCI.0357-05.2005. [DOI] [PMC free article] [PubMed] [Google Scholar]
- Meunier D, Lambiotte R, Fornito A, Ersche KD, Bullmore ET. Hierarchical modularity in human brain functional networks. Front Neuroinformatics. 2009;3:37. doi: 10.3389/neuro.11.037.2009. [DOI] [PMC free article] [PubMed] [Google Scholar]
- Muggleton N, Tsakanikos E, Walsh V, Ward J. Disruption of synaesthesia following TMS of the right posterior parietal cortex. Neuropsychologia. 2007;45:1582–1585. doi: 10.1016/j.neuropsychologia.2006.11.021. [DOI] [PubMed] [Google Scholar]
- Newman MEJ. Analysis of weighted networks. Phys Rev E. 2004;70 doi: 10.1103/PhysRevE.70.056131. 056131. [DOI] [PubMed] [Google Scholar]
- Nunn JA, Gregory LJ, Brammer M, Williams SC, Parslow DM, Morgan MJ, Morris RG, Bullmore ET, Baron-Cohen S, Gray JA. Functional magnetic resonance imaging of synesthesia: activation of V4/V8 by spoken words. Nat Neurosci. 2002;5:371–375. doi: 10.1038/nn818. [DOI] [PubMed] [Google Scholar]
- Opsahl T. 2009. Structure and evolution of weighted networks. PhD thesis, University of London (Queen Mary College. [Google Scholar]
- Opsahl T, Panzarasa P. Clustering in weighted networks. Soc Netw. 2009;31:155–163. [Google Scholar]
- Opsahl T, Colizza V, Panzarasa P, Ramasco JJ. Prominence and control: the weighted rich-club effect. Phys Rev Lett. 2008;101:168702. doi: 10.1103/PhysRevLett.101.168702. [DOI] [PubMed] [Google Scholar]
- Parker ES, Cahill L, McGaugh JL. A case of unusual autobiographical remembering. Neurocase. 2006;12:35–49. doi: 10.1080/13554790500473680. [DOI] [PubMed] [Google Scholar]
- Rich AN, Mattingley JB. Anomalous perception in synaesthesia: a cognitive neuroscience perspective. Nat Rev Neurosci. 2002;3:43–52. doi: 10.1038/nrn702. [DOI] [PubMed] [Google Scholar]
- Rich AN, Bradshaw JL, Mattingley JB. A systematic, large-scale study of synaesthesia: implications for the role of early experience in lexical-colour associations. Cognition. 2005;98:53–84. doi: 10.1016/j.cognition.2004.11.003. [DOI] [PubMed] [Google Scholar]
- Rodman H, Moore T. Development and plasticity of extrastriate visual cortex in monkeys. In: Rockland KS, Kaas JH, Peters A, editors. Cerebral cortex. New York: Plenum; 1997. pp. 639–672. [Google Scholar]
- Rosas HD, Liu AK, Hersch S, Glessner M, Ferrante RJ, Salat DH, van der Kouwe A, Jenkins BG, Dale AM, Fischl B. Regional and progressive thinning of the cortical ribbon in Huntington's disease. Neurology. 2002;58:695–701. doi: 10.1212/wnl.58.5.695. [DOI] [PubMed] [Google Scholar]
- Rouw R, Scholte HS. Increased structural connectivity in grapheme-color synesthesia. Nat Neurosci. 2007;10:792–797. doi: 10.1038/nn1906. [DOI] [PubMed] [Google Scholar]
- Rouw R, Scholte HS. Neural basis of individual differences in synesthetic experiences. J Neurosci. 2010;30:6205–6213. doi: 10.1523/JNEUROSCI.3444-09.2010. [DOI] [PMC free article] [PubMed] [Google Scholar]
- Salat DH, Buckner RL, Snyder AZ, Greve DN, Desikan RSR, Busa E, Morris JC, Dale AM, Fischl B. Thinning of the cerebral cortex in aging. Cereb Cortex. 2004;14:721–730. doi: 10.1093/cercor/bhh032. [DOI] [PubMed] [Google Scholar]
- Ségonne F, Dale AM, Busa E, Glessner M, Salat D, Hahn HK, Fischl B. A hybrid approach to the skull stripping problem in MRI. Neuroimage. 2004;22:1060–1075. doi: 10.1016/j.neuroimage.2004.03.032. [DOI] [PubMed] [Google Scholar]
- Simner J, Mulvenna C, Sagiv N, Tsakanikos E, Witherby SA, Fraser C, Scott K, Ward J. Synaesthesia: the prevalence of atypical cross-modal experiences. Perception. 2006;35:1024–1033. doi: 10.1068/p5469. [DOI] [PubMed] [Google Scholar]
- Simner J, Mayo N, Spiller M-J. A foundation for savantism? Visuo-spatial synaesthetes present with cognitive benefits. Cortex. 2009;45:1246–1260. doi: 10.1016/j.cortex.2009.07.007. [DOI] [PubMed] [Google Scholar]
- Sperling JM, Prvulovic D, Linden DE, Singer W, Stirn A. Neuronal correlates of colour-graphemic synaesthesia: a fMRI study. Cortex. 2006;42:295–303. doi: 10.1016/s0010-9452(08)70355-1. [DOI] [PubMed] [Google Scholar]
- Sporns O, Chialvo DR, Kaiser M, Hilgetag CC. Organization, development and function of complex brain networks. Trends Cogn Sci. 2004;8:418–425. doi: 10.1016/j.tics.2004.07.008. [DOI] [PubMed] [Google Scholar]
- Stam CJ, Jones BF, Nolte G, Breakspear M, Scheltens P. Small-world networks and functional connectivity in Alzheimer's disease. Cereb Cortex. 2007;17:92–99. doi: 10.1093/cercor/bhj127. [DOI] [PubMed] [Google Scholar]
- Strogatz SH. Exploring complex networks. Nature. 2001;410:268–276. doi: 10.1038/35065725. [DOI] [PubMed] [Google Scholar]
- van den Heuvel MP, Stam CJ, Kahn RS, Hulshoff Pol HE. Efficiency of functional brain networks and intellectual performance. J Neurosci. 2009;29:7619–7624. doi: 10.1523/JNEUROSCI.1443-09.2009. [DOI] [PMC free article] [PubMed] [Google Scholar]
- Ward J, Thompson-Lake D, Ely R, Kaminski F. Synaesthesia, creativity and art: What is the link? Br J Psychol. 2008;99:127–141. doi: 10.1348/000712607X204164. [DOI] [PubMed] [Google Scholar]
- Wasserman S, Faust K. Social network analysis. Cambridge, MA: Cambridge UP; 1994. [Google Scholar]
- Watts DJ, Strogatz SH. Collective dynamics of small-world networks. Nature. 1998;393:440–442. doi: 10.1038/30918. [DOI] [PubMed] [Google Scholar]
- Weiss PH, Fink GR. Grapheme-colour synaesthetes show increased grey matter volumes of parietal and fusiform cortex. Brain. 2009;132:65–70. doi: 10.1093/brain/awn304. [DOI] [PubMed] [Google Scholar]
- Weiss PH, Zilles K, Fink GR. When visual perception causes feeling: enhanced cross-modal processing in grapheme-color synesthesia. Neuroimage. 2005;28:859–868. doi: 10.1016/j.neuroimage.2005.06.052. [DOI] [PubMed] [Google Scholar]
- Worsley KJ, Chen JI, Lerch J, Evans AC. Comparing functional connectivity via thresholding correlations and singular value decomposition. Philos Trans R Soc Lond B Biol Sci. 2005;360:913–920. doi: 10.1098/rstb.2005.1637. [DOI] [PMC free article] [PubMed] [Google Scholar]