

Abstract
During steady muscle contractions, the human sensorimotor cortex generates oscillations in the beta-frequency range (15–30 Hz) that are coherent with the activity of contralateral spinal motoneurons. This corticospinal coherence is thought to favor stationary motor states, but its mode of operation remains elusive. We hypothesized that corticospinal beta-range coherence depends on the sensorimotor processing state before a steady force task and may thus increase after sensorimotor tuning to dynamic force generation. To test this hypothesis we instructed 16 human subjects to compensate static force after rest as well as after compensating predictable or unpredictable dynamic force with their right index finger. We calculated EEG-EMG coherence, cortical motor spectral power, and the motor performance during the force conditions. Corticospinal beta-coherence during stationary force was excessively elevated if the steady-state contraction was preceded by predictable dynamic force instead of rest, and was highest after unpredictable dynamic force. The beta-power decreased from rest to predictable dynamic force, and was lowest during unpredictable dynamic force. The increase in corticospinal beta-coherence showed a significant negative correlation with the preceding change in beta-power. The tuning to dynamic force did not entail an inferior motor performance during static force. The results imply a correlation between corticospinal beta-range coherence and the computational load of the preceding isometric motor engagement. We suggest beta-range coherence provides a functional corticospinal gateway for steady force-related processing that can override cortical states tuned to dynamic force. The modulation of corticospinal beta-range coherence might thus ensure comparable precision of static force in various motor contexts.
Introduction
Synchronized oscillatory activity in the beta-frequency band (15–30 Hz) can be observed over the sensorimotor cortex of primates and humans (Donoghue et al., 1992, 1998; Murthy and Fetz, 1992, 1996b; Sanes and Donoghue, 1993; Baker et al., 1999). Such beta-range oscillations are known to spread via the pyramidal tract to contralateral neurons in the spinal cord, giving rise to constant phase relations between cortical and electromyographic oscillations as assessed by the coherence function (Conway et al., 1995; Murthy and Fetz, 1996a; Baker et al., 1997; Salenius et al., 1997; Brown et al., 1998; Feige et al., 2000; Gross et al., 2000; Tecchio et al., 2008). Both in primates and in humans, this corticospinal beta-range coherence is most prominent during steady-state contractions while being abolished during the preceding phasic movements (Baker et al., 1997; Kilner et al., 1999, 2000, 2004; Feige et al., 2000; Baker, 2007; Engel and Fries, 2010). During a steady-state contraction, corticospinal beta-range coherence correlates with the performance of stationary force application and has been suggested as a mechanism for effective corticospinal interaction (Baker et al., 1999; Kristeva et al., 2007). Before the steady-state contraction, coherent corticospinal beta-range oscillations correlate with the digit displacement in a precision grip task, thereby reflecting the recalibration of the sensorimotor system following phasic movements (Kilner et al., 2000; Riddle and Baker, 2006). Despite the dependence of beta-range coherence on features of the preceding ramp phase, it remains unknown to what extent the motor state several seconds before the ramp phase affects corticospinal beta-range coherence.
It has been suggested recently that memory traces associated with the preceding motor experience can be formed in M1 for the precise scaling of the current grip force (Chouinard et al., 2005; Nowak et al., 2005; Berner et al., 2007; Loh et al., 2010). In this regard, we hypothesized that corticospinal beta-range coherence is modulated by the sensorimotor memory, more precisely by the level of sensorimotor processing that occurred several seconds before the steady force task. Therefore we predicted a distinct increase of beta-range coherence after the motor system is tuned to the processing of nonstationary sensorimotor information, that is, after switching over from a long-lasting dynamic force to a stationary force. Corticospinal beta-range coherence is thought to promote sensorimotor processing related to the maintenance of steady-state contractions (Baker, 2007; Bressler, 2009; Tsujimoto et al., 2009) and may therefore be the appropriate candidate for overriding sensorimotor processing states tuned to dynamic force.
To test our hypothesis, we compared three isometric static conditions with regard to EEG-EMG coherence, cortical spectral power, and motor performance: The first static contraction started from rest, the second was performed after a periodically modulated dynamic force, and the third had to be performed after an unpredictable dynamic force. Thus, from condition 1 to 3, the complexity of the motor engagement before the stationary contraction was increasing along the condition periods rest, predictable dynamic force, and unpredictable dynamic force.
Materials and Methods
Subjects
The study consisted of two separate experimental series: eight subjects (mean age, 31.9 ± 13.7 years, 4 men) participated in experiment 1 and another eight (mean age, 29.3 ± 13.4 years, 2 men) participated in experiment 2. At the time of the experiments, all subjects were healthy and did not have any history of neurological disease. All subjects were right-handed as assessed by the Edinburgh Handedness Inventory (Oldfield, 1971). They gave written consent before the experiment in accordance with the Declaration of Helsinki, and all procedures were approved by the local ethics committee. Every subject experienced similar experiments before.
Paradigm
During the experiments, the subjects sat in an electrically shielded, dimly lit room. We supported the right arm by a splint, and the subject was instructed to place the right index finger in the ring of a homemade manipulandum while the hand was resting on a sphere (Fig. 1a). In experiment 2, an upgraded version of the manipulandum in experiment 1 came into operation.
Figure 1.
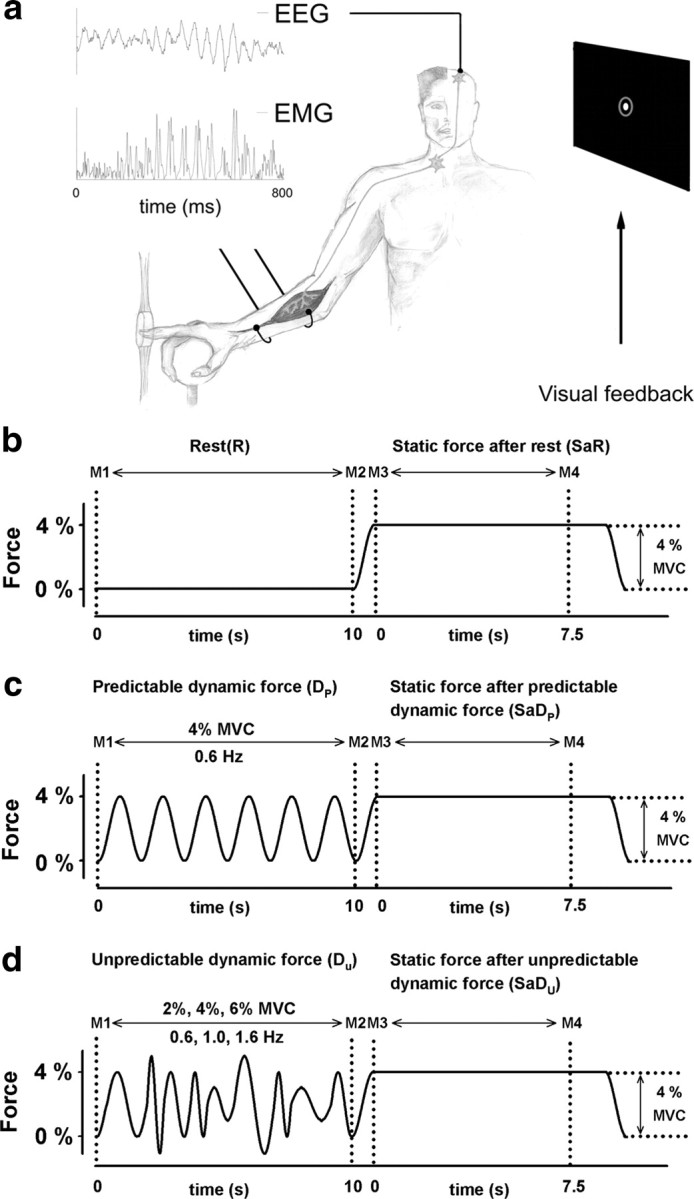
a, High-resolution EEG (52 scalp positions) and the EMG of the flexor digitorum superficialis muscle were recorded while the subject compensated the force profile of a manipulandum with the right index finger. Visual feedback about the position of the right index finger (white spot within the gray circle) was displayed on a monitor placed 60 cm in front of the subject and parallel to the face. EEG and EMG traces are shown during a period of high corticomuscular beta-range coherence in condition II. Simplified depiction of pyramidal tract, α-motoneuron, and muscle. b, Force profile generated by the manipulandum during one force trial of condition I. Condition I was made up of a rest period (R) in between the markers M1 and M2, and a static force period (SaR), in between the markers M3 and M4. c, Condition II consisted of a periodically modulated dynamic force period (Dp), in between the markers M1 and M2, and a static force period (SaDp), in between the markers M3 and M4. d, Condition III was made up of an unpredictable dynamic force period (Du), in between the markers M1 and M2, and a static force period (SaDu), in between the markers M3 and M4.
Both manipulanda were designed for applying vertical forces on the finger at the level of the metacarpophalangeal joint. A variable force on the ring was produced by a computer-controlled drive. The force generated by the manipulandum was named target force (TF). To maintain the ring in its initial position, the subject had to compensate the force generated by the manipulandum isometrically. The force exerted by the subject was called exerted force (EF). Visual feedback about the position of the ring was provided to the subject via a monitor placed 60 cm in front of the subject and parallel to his/her face. Two circles were displayed on the monitor (Fig. 1a, right): the gray outer circle (actually green) was fixed and represented the ring's reference position, while the white inner circle moved corresponding to the ring's actual position. The subject was supposed to maintain the small white circle inside the larger green circle during the motor task: When a given TF was applied to the ring, the subject had to apply the same force in the opposite direction (here, flexion) to keep the ring in its central position. The sensitivity of the visual feedback with respect to the finger position was 2.85 mm for 1 mm. In experiment 1, the conditions I and II, each divided into a subset of two parts, were investigated in a given recording session (Fig. 1b,c). In experiment 2, a third condition was added to the two conditions of experiment 1 (Fig. 1d).
Condition I
Rest (R).
During the first 10 s, the manipulandum generated no force at all so that the subject was instructed to keep the right arm as relaxed as possible (Fig. 1b, left).
Static force after rest (SaR).
Directly after R, the manipulandum generated a steady force at 4% of the maximum voluntary contraction (MVC) for 7.5 s (Fig. 1b, right).
Condition II
Predictable dynamic force (Dp).
During the first 10 s, the manipulandum generated a periodically modulated sinusoidal force at a frequency of 0.6 Hz and with a peak-to-peak amplitude of 4% MVC (Fig. 1c, left).
Static force after predictable dynamic force (SaDp).
Directly after Dp, the manipulandum generated a steady force at 4% of the MVC, which was equivalent to SaR (Fig. 1c, right).
Condition III
Unpredictable dynamic force (Du).
During the first 10 s, the manipulandum generated a dynamic force with a frequency varying randomly between 0.6, 1, and 1.6 Hz and a peak-to-peak amplitude varying randomly between 2, 4, and 6% MVC (Fig. 1d, left).
Static force after unpredictable dynamic force (SaDu).
Directly after Du, the manipulandum generated a steady force at 4% of the MVC, which was equivalent to SaR and SaDp (Fig. 1d, right).
In experiment 1, R, Dp, SaR, and SaDp, respectively, lasted 12 s. We used such low force because there is evidence that the motor cortical neurons are most sensitive within a low force range (Hepp-Reymond et al., 1989). In all three conditions, the period before the steady-state contraction was demarcated by the markers M1 and M2, which then defined R, Dp, and Du (Fig. 1b–d, left). The stationary force periods SaR, SaDp, and SaDu were demarcated by the markers M3 and M4 (Fig. 1b–d, right). To ensure a smooth start of the static force part, a rising sine function was used that was identical to the rising sine parts during Dp. In experiment 1, the motor task included a series of 35 trials of condition 1 and 2, respectively, and the application of each condition was randomized within the 70 trials. In experiment 2, the motor task included a series of 35 trials of condition 1, 2, and 3, respectively, and the application of each condition was randomized within the 105 trials. In experiment 1 and 2, rest intervals of 10–15 s were included between the trials. The subjects were instructed to fix their gaze on the visual feedback and to avoid any other movements during the task.
Recordings
Electrical potentials (bandpass 0–200 Hz, sampling rate 1000 Hz) were recorded from 52 scalp positions according to the international 10--20 system (SynAmp 2, NeuroScan) referenced to Cz with ground at FzA. Electrode impedances were <5 kΩ during the experimental session. We recorded the electrooculogram (EOG) (same bandpass and sampling rate as for EEG) to exclude trials contaminated with eye movements from further analysis. Electromyographic (EMG) activity (bandpass 5–200 Hz, sampling rate 1000 Hz) was recorded from the pars indicis of the right flexor digitorum superficialis muscle. The TF, the EF, and the position of the index finger (POS) were recorded in parallel with the electrophysiological data (the same bandpass and sampling rate as for EEG). EEG, EOG, and EMG were saved and then analyzed off-line.
Data analysis
The continuous data in between the markers M1 and M2, as well as in between the markers M3 and M4, were further divided into successive segments of 512 ms length, allowing for a frequency resolution of 1.96 Hz. The EEG signal was then transformed into the reference-free current source density distribution (CSD) to reduce volume conduction effects (Nunez et al., 1997). The CSD algorithm was estimated by means of the spherical spline interpolation method (Perrin et al., 1989), which was implemented in the commercial software BrainVision 1.05. Artifact rejection was visually performed off-line by inspecting segment by segment. Segments contaminated with eye movements were excluded. In every subject, >300 artifact-free segments could be kept in every condition period, and we regularly selected the first 300 artifact-free segments for further analysis. Because full-wave rectification provides the temporal pattern of grouped firing motor units (Halliday et al., 1995), the EMG signal was rectified. The discrete 512 point Fourier transform was calculated for each segment for the whole 1–500 Hz frequency range. Calculation of the EEG spectral power (sP) for a given channel (c) was further calculated according to the following formula:
where Ci represents the Fourier-transformed channel c for a given segment number (i = 1 … n) and * indicates the complex conjugate.
Coherence (Coh) values were calculated between the EEG channels and the rectified EMG to investigate the synchronization between the two signals. Coh values were calculated on the basis of the following equations:
where
Thus, S(c1,c2)(f) is the cross-spectrum for the EEG signal in channel c1 and the rectified EMG signal in channel c2 at a given frequency, f, and sPc1(f) and sPc2(f) are the respective power spectra for c1 and c2 at the same frequency. For the frequency f, the coherence value, Coh(c1,c2)(f), thus corresponds to the squared magnitude of a complex correlation coefficient. Coh(c1, c2)(f) is then a real number between 0 and 1. Coherence is considered to be significant if the resulting value lies above the confidence level (CL) (Rosenberg et al., 1989).
where n is the number of segments and α is the desired level of confidence. We considered coherence to be significant above the 95% confidence limit. The highest coherence peaks were observed over the left motor cortex contralateral to the active right index finger (EEG channels FC3, C1, and C3). For the grand average, we have always chosen the channel with the highest coherence (FC3, C1, or C3).
Quantification of coherence and spectral power for the statistical analysis (experiment 1 and 2)
To test for any statistical difference on coherence and cortical spectral power between R, Dp, and Du, as well as between SaR, SaDp, and SaDu, we measured the area under the coherence curve and above the significance level, ACoh, and under the spectral power curve, APow (in the channel with the highest significant coherence area in the beta- or gamma-range), in between two frequency windows: 15–30 Hz for the beta and 30–45 Hz for the gamma-range.
Statistical procedures in experiment 1
Statistical analysis of spectral power and coherence.
Individual values for the area under the coherence curve and above significance level were first transformed logarithmically to yield symmetric distributions according to the formula,
To evaluate the difference in magnitude of beta-range coherence between SaR and SaDp, we subtracted the significant beta-range coherence area of SaR from the significant beta-range coherence area of SaDp:
These steps prepared the data for the use of an ANOVA. To statistically verify the hypothesis that the corticospinal beta-range coherence depends on the engagement of the sensorimotor system before a steady contraction task, our analysis of coherence and spectral power consisted of a three-way ANOVA with repeated measures on three factors. The first factor, called condition, had two levels, which are the two different conditions tested (level 1, condition 1—rest and static force after rest; level 2, condition 2—predictable dynamic force and static force after predictable dynamic force). The second factor, called motor state, related to the engagement of the sensorimotor system and had two levels (level 1, prestationary motor state; and level 2, stationary motor state). The third factor was the frequency band, with two levels (level 1, beta; level 2, gamma). We tested the null hypothesis that the distributions of Coh and sP values tested in our ANOVA design are the same across all different motor contraction types. Since the ANOVA indicated a significant difference in some effects, among them, their interaction, we performed the (nonparametric) paired Wilcoxon test as a post hoc test on the resulting values A′Coh for corticospinal coherence, and APow for cortical spectral power. The null hypothesis was that the difference between the matched samples of coherence and power spectra from both static condition parts comes from a distribution which is symmetric around zero.
Calculation and statistical analysis of the performance.
To eliminate offsets accumulated during the recording, the TF and the EF were filtered off-line (bandpass filter of 0.5–30 Hz). To avoid power supply artifacts, we selected the high 30 Hz cutoff, which was large enough to record the changes of the force applied to the ring. The error E between the TF and the EF was calculated to evaluate the performance of the subjects:
Since the force generated by the manipulandum was the reference the subject had to adapt to, the mean squared error (MSEi) of the subject force (EF) around its reference (TF) was calculated using the following formula,
where, again, i = 1 … n is the segment number, k = 1 … s is the sampled point in the actual segment i, and s = 512 is the number of sampled points in each segment. A measure of the cumulative MSE was obtained by adding up individual segment values, as follows:
To account for the intersubject variability and to render the distribution symmetric, the error values were first logarithmically transformed:
To evaluate the difference in magnitude of the force error between SaR and SaDp, we subtracted the MSE′ of SaR from the MSE′ of SaDp:
We then performed the nonparametric paired Wilcoxon test of the null hypothesis that the difference between the matched samples of the force error from both static condition parts comes from a distribution which is symmetric around zero.
Statistical procedures in experiment 2
Statistical analysis of the spectral power and coherence.
Individual values for the coherent area under the curve and above significance level were first transformed logarithmically to yield symmetric distributions according to the formula,
In a similar way, individual values for the power area under the curve were transformed logarithmically to yield symmetric distributions according to the formula,
To evaluate the difference in magnitude of beta-range coherence between SaR and SaDp, between SaR and SaDu as well as between SaDp and SaDu, we subtracted the significant beta-range coherence area of SaR from the significant beta-range coherence area of SaDp and SaDu, respectively, as well as the significant beta-range coherence area of SaDp from SaDu. An equivalent subtraction was performed for the beta-range spectral power. Afterward, the nonparametric Friedman test was applied to compare values ACoh for coherence and APow for spectral power, measured in all three conditions for each single subject, with the null hypothesis that the distributions of the values tested are the same across all three conditions. The Friedman test with the global null hypothesis was calculated first to avoid an α-adjustment in the simultaneous paired hypotheses. When the Friedman test indicated that not all of the three conditions were statistically equivalent, we performed a second nonparametric test (paired Wilcoxon test) on the resulting values A′Coh for coherence and A′Pow for spectral power. The null hypothesis was that the difference between the matched samples of coherence and power spectra arises from a distribution that is symmetric around zero. We applied the post hoc test on the following pairs: R and Dp, R and Du, Dp and Du, SaR and SaDp, SaR and SaDu, and SaDp and SaDu.
Statistical analysis of the performance
In the upgraded manipulandum that has been used in experiment 2, the performance had to be quantified using the position channel.
The position channel (POS) was filtered off-line. To avoid power supply artifacts, we selected the high 70 Hz cutoff and the 50 Hz notch filter, which were high enough to record changes of the index finger position. The mean position error, Ep, of the index finger position compared with the central position within the green circle was calculated to evaluate the performance of the subjects, as follows:
where k = 1 … s is the sampled point in the actual segment i, i = 1 … n is the segment number, and s = 512 is the number of sampled points in each segment.
To account for the intersubject variability and to render the distribution symmetric, the error values were first logarithmically transformed:
To evaluate the difference in magnitude of the position error between SaR, SaDp and SaDu, we subtracted the Ep′ of SaR from the Ep′ of SaDp and SaDu, respectively. Afterward, the nonparametric Friedman test was applied to compare values Ep for the position error, measured in all three conditions for each single subject with the null hypothesis that the distributions of the values tested are the same across all three conditions. When the Friedman test indicated that not all of the three conditions were statistically equivalent, we performed a second nonparametric test (paired Wilcoxon test) on the resulting values Ep′. To evaluate the difference in magnitude of the position error between Dp and Du, we subtracted the Ep′ of Dp from the Ep′ of Du, respectively. Afterward, the nonparametric sign test was performed with the null hypothesis that there is no difference in medians between the distribution of the values tested in both conditions.
Statistical analysis of correlations (experiment 1 and 2)
Whenever the Wilcoxon test indicated a significant change in coherence or spectral power between equal time periods of the conditions I, II, or III, we calculated the Spearman correlation coefficient between the respective changes in the significant coherence areas and/or spectral power areas. The significance of correlations was calculated two-tailed.
Results
Experiment 1
Corticospinal coherence
With regard to corticospinal coherence, the ANOVA indicated significant differences on the motor state (F = 26.87, p = 0.0013), the condition (F = 31.24, p = 0.0008), and their interaction combined with the Frequency band factor (motor state × condition × frequency band, F = 125.48, p = 0.0001). We thus compared R to Dp and SaR to SaDp.
All eight subjects generated systematically increased corticospinal gamma-range coherence when Dp was compared with R. Across subjects, the maximum coherence amplitudes during Dp varied between 0.017 and 0.052. The increase in corticospinal gamma-range coherence from R to Dp was statistically significant (p = 0.0078, Wilcoxon paired test, n = 8).
Figure 2 illustrates the superimposition of the coherence spectra during SaR (dotted line) and SaDp (solid line) for three representative subjects and combined across all eight subjects. During SaR, extensive broad-band beta-range coherence was generated in six of the eight subjects, occasionally with minor extensions in the high-α (e.g., subject 1) or low gamma-range (e.g., subject 6) as illustrated in Figure 2.
Figure 2.

EEG-EMG coherence spectra of three representative subjects and combined across all eight subjects of experiment 1. Corticospinal coherence is compared during SaR (dotted line) and SaDp (solid line). The horizontal line in each coherence spectrum designates 95% confidence level. Note that beta-range coherence is excessively enhanced during SaDp compared with SaR.
Subjects 7 and 8 showed low, but still maximal coherence in the beta-range (Fig. 2; see Fig. 4). Across subjects, the maximum coherence amplitudes during SaR varied between 0.013 and 0.13. When Dp was applied before the static force (SaDp) instead of resting, all subjects featured a tremendous increase of corticospinal beta-range coherence (Fig. 2; see Fig. 4): depending on the subject, the significant beta-range coherence area during SaR was multiplied by factors ranging from 1.8 to 16 (mean, 7.76). Across subjects, the maximum coherence amplitudes during SaDp ranged from 0.036 to 0.4.
Figure 4.

Individual values for the power area and the significant coherence area in the beta-range, for all eight subjects (1–8) of experiment 1. Due to interindividual differences, the results are shown on a logarithmic scale. Empty circles, Values during the labeled period of condition I; filled black circles, values during the respective period of condition II. Note that both the decrease of beta-range power from R to Dp and the increase of beta-range coherence from SaR to SaDp are consistent in all eight subjects.
Still, the main significant coherence area occurred in the beta-range, with no systematic shift to higher or lower frequencies compared with SaR. From SaR to SaDp, the increase in beta-range coherence was statistically significant (p = 0.0078, Wilcoxon paired test, n = 8).
Cortical spectral Power (sP) and Force error (E)
The ANOVA indicated for the analysis of the spectral power (sP) that the motor state, condition, and frequency band interaction was again significant (motor state × condition × frequency band, F = 16.00, p = 0.0052). Thus, we again performed specific individual tests as for the analysis of corticospinal coherence. Figure 3 exhibits the superimposition of the power spectra during R (dotted line) and Dp (solid line) combined across all eight subjects. The respective individual values of the beta-range sP are shown in Figure 4: from R to Dp, the sP in the beta-range decreased consistently in all eight subjects. The decrease of the spectral power proved to be statistically significant in the beta-range (p = 0.0078, Wilcoxon paired test, n = 8), but did not reach significance in the gamma-range.
Figure 3.

EEG spectral power over the sensorimotor cortex in experiment 1, combined across all eight subjects during R (dotted line) and Dp (solid line). Note that the beta-range power during Dp is lower than during R.
SaR and SaDp did not differ significantly with regard to the cortical spectral power, neither in the beta- nor in the gamma-range. In the beta-range, six subjects exhibited increased beta-range spectral power during SaDp compared with SaR, but this effect was not significant (p = 0.11, Wilcoxon paired test, n = 8). Interestingly, SaR and SaDp also showed no statistically significant changes of the force error (p = 0.46, Wilcoxon paired test, n = 8), despite the extensive difference in corticospinal coherence. The Spearman correlation coefficient revealed a significant negative correlation between the beta-power change from R to Dp and the change in corticospinal beta-range coherence from SaR to SaDp (r = −0.79, p = 0.02).
Experiment 2
Corticospinal coherence
In general, the subjects of experiment 2 generated far lower corticospinal coherence than did the subjects of experiment 1. The average significant coherence area under the curve in experiment 1 amounted to 0.14 during SaR and to 0.5 during SaDp. In experiment 2, the average significant coherence area under the curve was 0.013 during SaR, 0.06 during SaDp, and 0.1 during SaDu. Nevertheless, the behavior of corticospinal beta-range coherence and cortical beta-range power was equivalent in experiments 1 and 2.
In contrast to experiment 1, the corticospinal gamma-range coherence was not significantly increased from R to Dp, although some subjects generated low significant gamma-range coherence during Dp. Similarly, no significant change in gamma-range coherence was observed between R and Du, as well as between Dp and Du.
Figure 5 exhibits the superimposed coherence spectra during SaR (dotted line), SaDp (solid black line), and SaDu (solid gray line) for three representative subjects as well as combined across all eight subjects. During SaR, moderate broad-band beta-range coherence was generated only in subjects 1 and 2; the remainder featured low-level beta-range coherence that was, however, mostly more pronounced than implied by the grand average. Since the peaks of corticospinal beta-range coherence during SaR tended to occur at different frequencies within the beta-range, they sum ineffectively and barely exceed the significance level in the grand average.
Figure 5.

Corticospinal coherence spectra of three representative subjects and combined across all eight subjects of experiment 2. Corticospinal coherence is compared during SaR (dotted line), SaDp (solid black line), and SaDu (solid gray line). The horizontal line in each coherence spectrum designates 95% confidence level. Note that beta-range coherence increases along the condition periods SaR, SaDp, and SaDu.
In line with experiment 1, the corticospinal beta-range coherence distinctly increased from SaR to SaDp in all eight subjects (Fig. 5; see Fig. 7). However, the corticospinal beta-range coherence further increased from SaDp to SaDu in all subjects investigated (Fig. 5; see Fig. 7). Despite the low-level beta-range coherence during SaR, all subjects generated moderate to extensive, broad-band beta-range coherence during SaDp and SaDu. The difference in corticospinal beta-range coherence was statistically significant among the conditions SaR, SaDp, and SaDu (p = 0.0003, Friedman test, n = 8). In detail, the corticospinal beta-range coherence during SaDp and SaDu was significantly increased compared with SaR (p = 0.0117, Wilcoxon test, n = 8, respectively). Additionally, the pairwise comparison yielded a significant increase in corticospinal beta-range coherence from SaDp to SaDu (p = 0.0117, Wilcoxon test, n = 8).
Figure 7.

Individual values for the power area and the significant coherence area in the beta-range, for all eight subjects (1–8) of experiment 2. Due to interindividual differences, the results are shown on a logarithmic scale. Empty circles, Values during the indicated period of condition I; filled black circles, values during the labeled part of condition II; filled gray circles, values during the corresponding period of condition III. While cortical beta-range power decreases consistently in all subjects along the condition periods R, Dp, and Du, corticospinal beta-range coherence increases in all subjects along the subsequent condition periods SaR, SaDp, and SaDu.
Cortical motor spectral power (sP) and position error (Ep)
Figure 6 exhibits the superimposition of the power spectra during R (dotted line), Dp (solid black line), and Du (solid gray line), combined across all eight subjects.
Figure 6.

EEG spectral power over the sensorimotor cortex in experiment 2, combined across all eight subjects during R (dotted line), Dp (solid black line), and Du (solid gray line). Note that the cortical motor spectral power decreases along the condition periods R, Dp, and Du.
In line with experiment 1, the cortical sP in the beta-range decreased consistently in all eight subjects when R was compared with Dp (Figs. 6, 7, left panel). The cortical sP further diminished from Dp to Du, and this effect was also consistent in all subjects investigated (Figs. 6, 7, left panel). The difference in cortical beta-range sP was statistically significant among the conditions R, Dp, and Du (p = 0.0003, Friedman test, n = 8). In detail, the cortical sP during Dp and Du was significantly diminished compared with R (p = 0.0117, Wilcoxon test, n = 8, respectively). Moreover, the pairwise comparison indicated a significant decrease in cortical sP from Dp to Du (p = 0.0117, Wilcoxon test, n = 8). The difference in cortical beta-range sP was not statistically significant in between the conditions SaR, SaDp, and SaDu (p = 0.093, Friedman test, n = 8). The performance did not differ significantly either between Dp and Du (p = 0.2891, sign test, n = 8) or among the conditions SaR, SaDp, and SaDu (p = 0.6065, Friedman test, n = 8).
The Spearman correlation coefficient revealed a significant negative correlation between the beta-power change from R to Dp and the change in corticospinal beta-range coherence from SaR to SaDp (r = −0.778, p = 0.023). Likewise, the beta-range power changes from R to Du exhibited a significant negative correlation with the change in corticospinal coherence from SaR to SaDu (r = −0.79, p = 0.02). The Spearman correlation coefficient also indicated a significant negative correlation between the beta-power change from Dp to Du and the change in corticospinal beta-range coherence from SaDp to SaDu (r = −0.711, p = 0.048, Fig. 8).
Figure 8.

Correlation between the beta-range power decrease and the beta-range coherence increase across the conditions of experiment 2. The beta-range power change from Dp to Du showed a significant negative correlation with the subsequent beta-range coherence increase from SaDp to SaDu (circles in dark gray). Likewise, the beta-range power decrease along the condition periods R to Dp was inversely correlated with the beta-range coherence change from SaR to SaDp (circles in black). The most significant inverse correlation was observed between the beta-power change from R to Du and the beta-coherence increase from SaR to SaDu (circles in light gray).
Discussion
We have previously suggested corticospinal beta-range coherence as a mechanism for effective corticospinal interaction during stationary force, which subserves different functions (Kristeva et al., 2007). The magnitude of coherent corticospinal beta-oscillations has been associated with the compliance or displacement before the stationary state (Kilner et al., 2000; Riddle and Baker, 2006), with attention (Kristeva-Feige et al., 2002), performance (Kristeva et al., 2007) and with the force level (Brown et al., 1998; Brown, 2000). Here we show for the first time the striking effect of different recent sensorimotor histories on the subsequent corticospinal beta-range coherence during static force that emerged independently of the simultaneous performance, force level, and displacement before the steady contraction. Moreover, the increased corticospinal beta-range coherence showed a significant negative correlation with the preceding change in cortical spectral power over the sensorimotor cortex.
The results of experiment 2 confirmed those of experiment 1, with the exception of the corticospinal gamma-range coherence during predictable dynamic force (Dp) that was not significantly elevated compared with rest (R). The reason might be the generally lower coherence levels in experiment 2 that can most likely be attributed to interindividual differences (Conway et al., 1995) and may have impeded the generation of significant gamma-range coherence in some subjects. Regardless of the tendency to low coherence levels, the distinct increase of corticospinal beta-range coherence after predictable or unpredictable dynamic force occurred consistently in all subjects of experiment 2, indicating a powerful underlying effect.
Why is the beta-range coherence enhanced after different dynamic force outputs?
The corticospinal beta-range coherence has been suggested to reflect a recalibration process that correlates with the preceding change of motor parameters such as the length of muscles, the angles of joints or the length-tension-relationships of hand muscles (Kilner et al., 2000; Riddle and Baker, 2006). Before SaR, SaDp, and SaDu, the changes of such motor parameters are equivalent since all three force conditions are isometric and feature the same force profile and level. Nonetheless, both SaDp and SaDu feature considerably higher corticospinal beta-range coherence than does SaR, which is why we assume that additional factors of the preceding motor engagement are related to the strength and function of corticospinal beta-range coherence.
The increasing corticospinal beta-range coherence can be explained in the simplest way by ascending fatigue levels along the condition periods SaR, SaDp, and SaDu. Indeed, Tecchio et al. (2006) demonstrated higher corticospinal beta-range coherence after rather than before fatigue. However, three reasons argue against this hypothesis. First, fatigue is defined as the progressive decline of force during the effort of maintaining maximal (Bigland-Ritchie and Woods, 1984) or low-level voluntary contractions (Duchateau et al., 2002). A progressive decline of force would have resulted in a worse performance during SaDp and SaDu compared with SaR, but all static force periods did not differ significantly with regard to the motor performance. Second, our conditions II and III featured a mean force level that amounted to less than one-fifth of the non-fatiguing motor task described by Tecchio et al. (2006), while possessing a comparable duration. Third, the conditions II and III did not differ with regard to the mean force level and should therefore lead to comparable levels of fatigue, but nevertheless, they differed in the magnitude of beta-range coherence.
While the static force parts of all three conditions were equivalent, the complexity of the preceding motor engagement increased from condition I to III. Rest (R) required no neuronal tuning to a particular motor engagement and thereby featured the lowest computational load for the motor system. In contrast, Dp demanded a continuous variation of the force output that could, however, be anticipated by the sensorimotor system because of the periodic and thereby predictable design of Dp. The more complex Du demanded the continuous adjustment of the force output based on sensory information, since the variation of frequency and amplitudes impeded the anticipation of the force cycles. Accordingly, the cortical beta-range power decreased along the condition periods R, Dp, and Du. Beta-oscillations in the sensorimotor cortex have been suggested to desynchronize during preparation, execution, and imagination of a motor act (Pfurtscheller, 1981; Stancák and Pfurtscheller, 1996; Neuper et al., 2006), particularly when the motor task requires high attention resources (Chen et al., 2003). Additionally, recent functional MRI studies correlated sensorimotor beta-range desynchronization with increased neuronal activity (Ritter et al., 2009; Yuan et al., 2010). It is therefore conceivable to assume that the neuronal activity in the sensorimotor cortex increased along the condition periods R, Dp, and Du, which is likely to reflect the ascending attention and computation demands. Corticospinal beta-range coherence was strikingly enhanced when the stationary force had to be performed after predictable dynamic force instead of resting, and was even higher after unpredictable dynamic force. The change in beta-range power along R, Dp, and Du and the increase in the subsequent beta-range coherence along SaR, SaDp, and SaDu showed a significant negative correlation. The inverse correlation indicates that the corticospinal beta-range coherence is related to the preceding neuronal processing state at a cortical level and to the computational load of the preceding motor engagement. The more cortical neurons have to be entrained and tuned to dynamic force-related processing, the more beta-range coherence is generated after switching over to steady force output. What might be the functional meaning behind this relationship? In addition to providing effective corticospinal interaction (Baker et al., 1999; Kristeva et al., 2007), recent evidence established the view that corticospinal beta-range oscillations promote the maintenance of static force while compromising the processing of new dynamic motor acts (Gilbertson et al., 2005; Androulidakis et al., 2006; Pogosyan et al., 2009). Further, several authors demonstrated by applying Granger causality and the directed transfer function that the dominant information flow carried by beta-oscillations during tonic motor output is transmitted from the somatosensory to the motor cortex and then to the subsequent spinal motoneurons (Brovelli et al., 2004; Zhang et al., 2008; Tsujimoto et al., 2009). Altogether, there is converging evidence that beta-range coherence promotes the corticospinal integration of somatosensory information relevant for the maintenance of stationary force (Baker, 2007; Bressler, 2009). In the context of neuronal tuning to dynamic force at a cortical level, corticospinal beta-range coherence is thus the ideal candidate for the efficient extraction and transmission of steady force-related sensorimotor information into downstream targets. When large cortical neuron ensembles are entrained and tuned to dynamic force-related processing, the switching over to a stationary contraction is probably crucially dependent on increased corticospinal integration of steady force-related information—and thereby on the augmentation of corticospinal beta-range coherence. According to the feedback of the subjects, the level of difficulty increased along the condition parts SaR, SaDp, and SaDu, obviously as a consequence of the different recent motor history. Nonetheless, they performed all three motor tasks with equivalent precision. Despite the sensorimotor tuning to dynamic force as reflected by the decrease in beta-range power, a stationary force can be applied with the same level of precision as from the resting state. We presume that this upregulation of corticospinal beta-range coherence along the condition parts SaR, SaDp, and SaDu functions to ensure a constant precision level of stationary force, even though the sensorimotor system is tuned to dynamic force-related processing.
According to the model of rhythmic input gain modulation, neuronal ensembles are susceptible to input sent from other cells only during a narrow phase window of their oscillation cycle (Fries, 2009; van Elswijk et al., 2010). The phase modulation of corticospinal beta-range coherence may entail a suboptimal input gain for nonstationary force-related processing while promoting the corticospinal integration of information relevant for static force application. We suggest that corticospinal beta-range coherence provides a functional corticospinal gateway for steady force-related processing that is able to override cortical states tuned to dynamic force. The modulation of corticospinal beta-range coherence might then ensure a constant precision level of static force regardless of the recent motor history.
In this study we demonstrate a high dependency of corticospinal beta-range coherence on the computational load of the preceding motor engagement. This relationship between beta-range coherence and the preceding sensorimotor processing implies that corticospinal beta-range oscillations are generated in dependence on memory traces that refer to the recent sensorimotor history before a steady-state contraction. Such memory traces are known to be formed in M1 in association with the preceding motor experience (Chouinard et al., 2005; Nowak et al., 2005; Berner et al., 2007; Loh et al., 2010). The sensorimotor system seems to “know” whether the motor engagement before static force was a predictable dynamic force, an unpredictable dynamic force, or rest, and the corticospinal beta-range coherence is adjusted correspondingly. If and to what extent corticospinal beta-range coherence affects those memory traces in M1 might be an interesting question for future research.
Footnotes
This work was supported by Deutsche Forschungsgemeinschaft grants (Kr 1392/7-5 and Kr 1392/11-1). We thank M. C. Hepp-Reymond for the stimulating discussions, and F. Huethe for the technical help.
References
- Androulidakis AG, Doyle LM, Gilbertson TP, Brown P. Corrective movements in response to displacements in visual feedback are more effective during periods of 13–35 Hz oscillatory synchrony in the human corticospinal system. Eur J Neurosci. 2006;24:3299–3304. doi: 10.1111/j.1460-9568.2006.05201.x. [DOI] [PubMed] [Google Scholar]
- Baker SN. Oscillatory interactions between sensorimotor cortex and the periphery. Curr Opin Neurobiol. 2007;17:649–655. doi: 10.1016/j.conb.2008.01.007. [DOI] [PMC free article] [PubMed] [Google Scholar]
- Baker SN, Olivier E, Lemon RN. Coherent oscillations in monkey motor cortex and hand muscle EMG show task-dependent modulation. J Physiol. 1997;501:225–241. doi: 10.1111/j.1469-7793.1997.225bo.x. [DOI] [PMC free article] [PubMed] [Google Scholar]
- Baker SN, Kilner JM, Pinches EM, Lemon RN. The role of synchrony and oscillations in the motor output. Exp Brain Res. 1999;128:109–117. doi: 10.1007/s002210050825. [DOI] [PubMed] [Google Scholar]
- Berner J, Schönfeldt-Lecuona C, Nowak DA. Sensorimotor memory for fingertip forces during object lifting: the role of the primary motor cortex. Neuropsychologia. 2007;45:1931–1938. doi: 10.1016/j.neuropsychologia.2006.11.011. [DOI] [PubMed] [Google Scholar]
- Bigland-Ritchie B, Woods JJ. Changes in muscle contractile properties and neural control during human muscular fatigue. Muscle Nerve. 1984;7:691–699. doi: 10.1002/mus.880070902. [DOI] [PubMed] [Google Scholar]
- Bressler SL. The sensory component of tonic motor control. Clin Neurophysiol. 2009;120:1035–1036. doi: 10.1016/j.clinph.2009.03.017. [DOI] [PubMed] [Google Scholar]
- Brovelli A, Ding M, Ledberg A, Chen Y, Nakamura R, Bressler SL. Beta oscillations in a large-scale sensorimotor cortical network: directional influences revealed by Granger causality. Proc Natl Acad Sci U S A. 2004;101:9849–9854. doi: 10.1073/pnas.0308538101. [DOI] [PMC free article] [PubMed] [Google Scholar]
- Brown P. Cortical drives to human muscle: the Piper and related rhythms. Prog Neurobiol. 2000;60:97–108. doi: 10.1016/s0301-0082(99)00029-5. [DOI] [PubMed] [Google Scholar]
- Brown P, Salenius S, Rothwell JC, Hari R. Cortical correlate of the Piper rhythm in humans. J Neurophysiol. 1998;80:2911–2917. doi: 10.1152/jn.1998.80.6.2911. [DOI] [PubMed] [Google Scholar]
- Chen Y, Ding M, Kelso JA. Task-related power and coherence changes in neuromagnetic activity during visuomotor coordination. Exp Brain Res. 2003;148:105–116. doi: 10.1007/s00221-002-1244-0. [DOI] [PubMed] [Google Scholar]
- Chouinard PA, Leonard G, Paus T. Role of the primary motor and dorsal premotor cortices in the anticipation of forces during object lifting. J Neurosci. 2005;25:2277–2284. doi: 10.1523/JNEUROSCI.4649-04.2005. [DOI] [PMC free article] [PubMed] [Google Scholar]
- Conway BA, Halliday DM, Farmer SF, Shahani U, Maas P, Weir AI, Rosenberg JR. Synchronization between motor cortex and spinal motoneuronal pool during the performance of a maintained motor task in man. J Physiol. 1995;489:917–924. doi: 10.1113/jphysiol.1995.sp021104. [DOI] [PMC free article] [PubMed] [Google Scholar]
- Donoghue JP, Leibovic S, Sanes JN. Organization of the forelimb area in squirrel monkey motor cortex: representation of digit, wrist, and elbow muscles. Exp Brain Res. 1992;89:1–19. doi: 10.1007/BF00228996. [DOI] [PubMed] [Google Scholar]
- Donoghue JP, Sanes JN, Hatsopoulos NG, Gaál G. Neural discharge and local field potential oscillations in primate motor cortex during voluntary movements. J Neurophysiol. 1998;79:159–173. doi: 10.1152/jn.1998.79.1.159. [DOI] [PubMed] [Google Scholar]
- Duchateau J, Balestra C, Carpentier A, Hainaut K. Reflex regulation during sustained and intermittent submaximal contractions in humans. J Physiol. 2002;541:959–967. doi: 10.1113/jphysiol.2002.016790. [DOI] [PMC free article] [PubMed] [Google Scholar]
- Engel AK, Fries P. Beta-band oscillations—signalling the status quo? Curr Opin Neurobiol. 2010;20:156–165. doi: 10.1016/j.conb.2010.02.015. [DOI] [PubMed] [Google Scholar]
- Feige B, Aertsen A, Kristeva-Feige R. Dynamic synchronization between multiple cortical motor areas and muscle activity in phasic voluntary movements. J Neurophysiol. 2000;84:2622–2629. doi: 10.1152/jn.2000.84.5.2622. [DOI] [PubMed] [Google Scholar]
- Fries P. Neuronal gamma-band synchronization as a fundamental process in cortical computation. Annu Rev Neurosci. 2009;32:209–224. doi: 10.1146/annurev.neuro.051508.135603. [DOI] [PubMed] [Google Scholar]
- Gilbertson T, Lalo E, Doyle L, Di Lazzaro V, Cioni B, Brown P. Existing motor state is favored at the expense of new movement during 13–35 Hz oscillatory synchrony in the human corticospinal system. J Neurosci. 2005;25:7771–7779. doi: 10.1523/JNEUROSCI.1762-05.2005. [DOI] [PMC free article] [PubMed] [Google Scholar]
- Gross J, Tass PA, Salenius S, Hari R, Freund HJ, Schnitzler A. Cortico-muscular synchronization during isometric muscle contraction in humans as revealed by magnetoencephalography. J Physiol. 2000;527:623–631. doi: 10.1111/j.1469-7793.2000.00623.x. [DOI] [PMC free article] [PubMed] [Google Scholar]
- Halliday DM, Rosenberg JR, Amjad AM, Breeze P, Conway BA, Farmer SF. A framework for the analysis of mixed time series/point process data—theory and application to the study of physiological tremor, single motor unit discharges and electromyograms. Prog Biophys Mol Biol. 1995;64:237–278. doi: 10.1016/s0079-6107(96)00009-0. [DOI] [PubMed] [Google Scholar]
- Hepp-Reymond MC, Wannier TM, Maier MA, Rufener EA. Sensorimotor cortical control of isometric force in the monkey. Prog Brain Res. 1989;80:451–463. doi: 10.1016/s0079-6123(08)62242-6. [DOI] [PubMed] [Google Scholar]
- Kilner JM, Baker SN, Salenius S, Jousmäki V, Hari R, Lemon RN. Task-dependent modulation of 15–30 Hz coherence between rectified EMGs from human hand and forearm muscles. J Physiol. 1999;516:559–570. doi: 10.1111/j.1469-7793.1999.0559v.x. [DOI] [PMC free article] [PubMed] [Google Scholar]
- Kilner JM, Baker SN, Salenius S, Hari R, Lemon RN. Human cortical muscle coherence is directly related to specific motor parameters. J Neurosci. 2000;20:8838–8845. doi: 10.1523/JNEUROSCI.20-23-08838.2000. [DOI] [PMC free article] [PubMed] [Google Scholar]
- Kilner JM, Fisher RJ, Lemon RN. Coupling of oscillatory activity between muscles is strikingly reduced in a deafferented subject compared with normal controls. J Neurophysiol. 2004;92:790–796. doi: 10.1152/jn.01247.2003. [DOI] [PubMed] [Google Scholar]
- Kristeva R, Patino L, Omlor W. Beta-range cortical motor spectral power and corticomuscular coherence as a mechanism for effective corticospinal interaction during steady-state motor output. Neuroimage. 2007;36:785–792. doi: 10.1016/j.neuroimage.2007.03.025. [DOI] [PubMed] [Google Scholar]
- Kristeva-Feige R, Fritsch C, Timmer J, Lücking CH. Effects of attention and precision of exerted force on beta range EEG-EMG synchronization during a maintained motor contraction task. Clin Neurophysiol. 2002;113:124–131. doi: 10.1016/s1388-2457(01)00722-2. [DOI] [PubMed] [Google Scholar]
- Loh MN, Kirsch L, Rothwell JC, Lemon RN, Davare M. Information about the weight of grasped objects from vision and internal models interacts within the primary motor cortex. J Neurosci. 2010;30:6984–6990. doi: 10.1523/JNEUROSCI.6207-09.2010. [DOI] [PMC free article] [PubMed] [Google Scholar]
- Murthy VN, Fetz EE. Coherent 25- to 35-Hz oscillations in the sensorimotor cortex of awake behaving monkeys. Proc Natl Acad Sci U S A. 1992;89:5670–5674. doi: 10.1073/pnas.89.12.5670. [DOI] [PMC free article] [PubMed] [Google Scholar]
- Murthy VN, Fetz EE. Oscillatory activity in sensorimotor cortex of awake monkeys: synchronization of local field potentials and relation to behavior. J Neurophysiol. 1996a;76:3949–3967. doi: 10.1152/jn.1996.76.6.3949. [DOI] [PubMed] [Google Scholar]
- Murthy VN, Fetz EE. Synchronization of neurons during local field potential oscillations in sensorimotor cortex of awake monkeys. J Neurophysiol. 1996b;76:3968–3982. doi: 10.1152/jn.1996.76.6.3968. [DOI] [PubMed] [Google Scholar]
- Neuper C, Wörtz M, Pfurtscheller G. ERD/ERS patterns reflecting sensorimotor activation and deactivation. Prog Brain Res. 2006;159:211–222. doi: 10.1016/S0079-6123(06)59014-4. [DOI] [PubMed] [Google Scholar]
- Nowak DA, Voss M, Huang YZ, Wolpert DM, Rothwell JC. High-frequency repetitive transcranial magnetic stimulation over the hand area of the primary motor cortex disturbs predictive grip force scaling. Eur J Neurosci. 2005;22:2392–2396. doi: 10.1111/j.1460-9568.2005.04425.x. [DOI] [PubMed] [Google Scholar]
- Nunez PL, Srinivasan R, Westdorp AF, Wijesinghe RS, Tucker DM, Silberstein RB, Cadusch PJ. EEG coherency. I: Statistics, reference electrode, volume conduction, Laplacians, cortical imaging, and interpretation at multiple scales. Electroencephalogr Clin Neurophysiol. 1997;103:499–515. doi: 10.1016/s0013-4694(97)00066-7. [DOI] [PubMed] [Google Scholar]
- Oldfield RC. The assessment and analysis of handedness: the Edinburgh inventory. Neuropsychologia. 1971;9:97–113. doi: 10.1016/0028-3932(71)90067-4. [DOI] [PubMed] [Google Scholar]
- Perrin F, Pernier J, Bertrand O, Echallier JF. Spherical splines for scalp potential and current density mapping. Electroencephalogr Clin Neurophysiol. 1989;72:184–187. doi: 10.1016/0013-4694(89)90180-6. [DOI] [PubMed] [Google Scholar]
- Pfurtscheller G. Central beta rhythm during sensorimotor activities in man. Electroencephalogr Clin Neurophysiol. 1981;51:253–264. doi: 10.1016/0013-4694(81)90139-5. [DOI] [PubMed] [Google Scholar]
- Pogosyan A, Gaynor LD, Eusebio A, Brown P. Boosting cortical activity at beta-band frequencies slows movement in humans. Curr Biol. 2009;19:1637–1641. doi: 10.1016/j.cub.2009.07.074. [DOI] [PMC free article] [PubMed] [Google Scholar]
- Riddle CN, Baker SN. Digit displacement, not object compliance, underlies task dependent modulations in human corticomuscular coherence. Neuroimage. 2006;33:618–627. doi: 10.1016/j.neuroimage.2006.07.027. [DOI] [PubMed] [Google Scholar]
- Ritter P, Moosmann M, Villringer A. Rolandic alpha and beta EEG rhythms' strengths are inversely related to fMRI-BOLD signal in primary somatosensory and motor cortex. Hum Brain Mapp. 2009;30:1168–1187. doi: 10.1002/hbm.20585. [DOI] [PMC free article] [PubMed] [Google Scholar]
- Rosenberg JR, Amjad AM, Breeze P, Brillinger DR, Halliday DM. The Fourier approach to the identification of functional coupling between neuronal spike trains. Prog Biophys Mol Biol. 1989;53:1–31. doi: 10.1016/0079-6107(89)90004-7. [DOI] [PubMed] [Google Scholar]
- Salenius S, Portin K, Kajola M, Salmelin R, Hari R. Cortical control of human motoneuron firing during isometric contraction. J Neurophysiol. 1997;77:3401–3405. doi: 10.1152/jn.1997.77.6.3401. [DOI] [PubMed] [Google Scholar]
- Sanes JN, Donoghue JP. Oscillations in local field potentials of the primate motor cortex during voluntary movement. Proc Natl Acad Sci U S A. 1993;90:4470–4474. doi: 10.1073/pnas.90.10.4470. [DOI] [PMC free article] [PubMed] [Google Scholar]
- Stancák A, Jr, Pfurtscheller G. Event-related desynchronisation of central beta-rhythms during brisk and slow self-paced finger movements of dominant and nondominant hand. Brain Res Cogn Brain Res. 1996;4:171–183. doi: 10.1016/s0926-6410(96)00031-6. [DOI] [PubMed] [Google Scholar]
- Tecchio F, Porcaro C, Zappasodi F, Pesenti A, Ercolani M, Rossini PM. Cortical short-term fatigue effects assessed via rhythmic brain-muscle coherence. Exp Brain Res. 2006;174:144–151. doi: 10.1007/s00221-006-0432-8. [DOI] [PubMed] [Google Scholar]
- Tecchio F, Melgari JM, Zappasodi F, Porcaro C, Milazzo D, Cassetta E, Rossini PM. Sensorimotor integration in focal task-specific hand dystonia: a magnetoencephalographic assessment. Neuroscience. 2008;154:563–571. doi: 10.1016/j.neuroscience.2008.03.045. [DOI] [PubMed] [Google Scholar]
- Tsujimoto T, Mima T, Shimazu H, Isomura Y. Directional organization of sensorimotor oscillatory activity related to the electromyogram in the monkey. Clin Neurophysiol. 2009;120:1168–1173. doi: 10.1016/j.clinph.2009.02.177. [DOI] [PubMed] [Google Scholar]
- van Elswijk G, Maij F, Schoffelen JM, Overeem S, Stegeman DF, Fries P. Corticospinal beta-band synchronization entails rhythmic gain modulation. J Neurosci. 2010;30:4481–4488. doi: 10.1523/JNEUROSCI.2794-09.2010. [DOI] [PMC free article] [PubMed] [Google Scholar]
- Yuan H, Liu T, Szarkowski R, Rios C, Ashe J, He B. Negative covariation between task-related responses in alpha/beta-band activity and BOLD in human sensorimotor cortex: an EEG and fMRI study of motor imagery and movements. Neuroimage. 2010;49:2596–2606. doi: 10.1016/j.neuroimage.2009.10.028. [DOI] [PMC free article] [PubMed] [Google Scholar]
- Zhang Y, Chen Y, Bressler SL, Ding M. Response preparation and inhibition: the role of the cortical sensorimotor beta rhythm. Neuroscience. 2008;156:238–246. doi: 10.1016/j.neuroscience.2008.06.061. [DOI] [PMC free article] [PubMed] [Google Scholar]