

Abstract
The olfactory cortex is functionally isolated from the external odor world during slow-wave sleep. However, the neuronal activity pattern in the olfactory cortex and its functional roles during slow-wave sleep are not well understood. Here, we demonstrate in freely behaving rats that the anterior piriform cortex, a major area of the olfactory cortex, repeatedly generates sharp waves that are accompanied by synchronized discharges of numerous cortical neurons. Olfactory cortex sharp waves occurred relatively independently of hippocampal sharp waves. Current source density analysis showed that sharp wave generation involved the participation of recurrent association fiber synapses to pyramidal cells in the olfactory cortex. During slow-wave sleep, the olfactory bulb showed sharp waves that were in synchrony with olfactory cortex sharp waves, indicating that olfactory cortex sharp waves drove synchronized top-down inputs to the olfactory bulb. Based on these results, we speculate that the olfactory cortex sharp waves may play a role in the reorganization of bulbar neuronal circuits during slow-wave sleep.
Introduction
During slow-wave sleep, local field potentials in the neocortex show characteristic slow-wave oscillations, whereas those of the hippocampus exhibit irregular sharp waves (SPWs) (Buzsaki, 1989; Steriade, 2001). SPWs in the hippocampus are self-organized neuronal activities that occur during postbehavioral sleep and rest periods and are thought to be generated by massive recurrent axon collaterals of pyramidal cells in the CA3 region (Buzsaki, 1986, 1989; Csicsvari et al., 2000). During the narrow time window (∼100 ms) of an SPW event, numerous CA1 pyramidal cells show highly synchronized discharges (Buzsaki, 1989). Experiments with rodents have demonstrated that memory traces stored in the CA3–CA1 regions during exploratory behavior are reactivated repeatedly as SPW events during the sleep and rest periods (Wilson and McNaughton, 1994; Lee and Wilson, 2002; Foster and Wilson, 2006). Hippocampal SPW events are candidate activity patterns for consolidation of the synaptic plasticity that underlies spatial and episodic memory during the sleep and rest periods (Buzsaki, 1989; Hasselmo, 1999).
In the present study, we recorded the neuronal activity pattern in the anterior piriform cortex (APC) in freely behaving rats using chronically implanted tetrodes to address the question of whether the olfactory cortex generates SPW-like potentials in addition to slow-wave oscillation during slow-wave sleep. Based on the following three similarities between the olfactory cortex and hippocampus, we supposed that olfactory cortex also can generate SPW-like events during slow-wave sleep. First, the olfactory cortex and hippocampus are phylogenetically old cortices that have simpler three-layered structures than the more complex six-layered structure of the neocortex (Neville and Haberly, 2004). Second, pyramidal cells in the piriform cortex give rise to massive recurrent association fibers in the piriform cortex (Johnson et al., 2000; Chen et al., 2003; Neville and Haberly, 2004), similarly to the way that CA3 pyramidal cells in the hippocampus emit massive recurrent collaterals in the CA3 region (Amaral and Witter, 1989). Third, the piriform cortex shows brain state-dependent change in the information processing mode (Murakami et al., 2005) that is similar to that found in the hippocampus (Buzsaki, 1989).
We report here that during the slow-wave sleep state, the APC generates SPWs that were associated with synchronized discharges of numerous neurons in the olfactory cortex. The olfactory cortex sharp waves (OC-SPWs) resembled hippocampal SPWs in shape but occurred independently of hippocampal SPWs, suggesting that neuronal circuits in the olfactory cortex serve to generate previously unknown SPW events.
Pyramidal cells in the APC give rise to massive top-down centrifugal fibers that terminate on granule cells in the olfactory bulb (Luskin and Price, 1983). We recently found that apoptotic elimination of adult-born granule cells from neuronal circuits of the olfactory bulb is greatly enhanced during postprandial sleep periods (T. K. Yokoyama, D. Mochimaru, K. Murata, H. Manabe, K. Kobayakawa, R. Kobayakawa, H. Sakano, K. Mori, and M. Yamaguchi, unpublished observation). This raises the possibility that the centrally generated OC-SPWs travel to the olfactory bulb and promote reorganization of the bulbar neuronal circuits, including the elimination of adult-born granule cells during slow-wave sleep.
Materials and Methods
Electrophysiology in freely behaving animals.
All experiments were performed in accordance with the guidelines of the Physiological Society of Japan and the Animal Experiment Committee of the University of Tokyo.
Male adult Long–Evans rats (453–592 g at the time of surgery; Japan SLC) were anesthetized with ketamine (67.5 mg/kg, i.p.) and medetomidine (0.5 mg/kg, i.p.) and implanted with an independently movable microdrive of 5–10 tetrodes in the APC (0.0–2.2 mm anterior to the bregma, 4.2 mm lateral to the midline). Individual tetrodes consisted of four twisted polyimide-coated tungsten wires (12.5 μm diameter; California Fine Wire). For recording of local field potentials, twisted Teflon-insulated stainless steel electrodes (catalog #790900; A-M Systems) were implanted in the olfactory bulb (7.5 mm anterior to the bregma, 1.3 mm lateral to the midline, 2.0 mm from the skull surface) and hippocampus (3.6 mm posterior to the bregma, 2.5 mm lateral to the midline, 2.6 mm from the skull surface). For neocortical EEG recording, a stainless screw was threaded into the bone above the occipital cortex (6.0 mm posterior to the bregma, 3.0 mm lateral to the midline). Another two screws were threaded into the bone above the cerebellum for reference. These electrodes were connected with an electrode interface board (Neuralynx) on the microdrive. The microdrive was fixed to the skull with dental acrylic and anchor screws.
To monitor respiration pattern, a thermocouple (0.23 mm diameter, Teflon coated; World Precision Instruments) was implanted in a nasal cavity through a hole made in the dorsal skull and secured to the skull with dental acrylic.
Electrical signals were obtained using a Cheetah recording system (Neuralynx). The signals were amplified 2000 times, filtered (600–6000 Hz for multiunit recordings, 0.1–6,000 Hz for field potential recordings), and sampled at 15 kHz. Unit recordings were obtained with tetrode depth adjusted on each recording day to acquire activity from new neurons. The positions of the tetrode tips in the layer of the piriform cortex were determined by monitoring the configuration of the local field potential evoked by electrical stimulation of the olfactory bulb.
Animals were allowed to recover from surgery for a minimum of 1 week before recordings. During recordings, rats were allowed to behave freely in their home cage (345 × 403 × 177 mm).
After the recording session, small lesions were made by current injection (tetrodes, −5 μA for 3 s; stainless steel electrodes, 10 μA for 10 s) for later histological examination of the recording sites.
Electrophysiology in anesthetized animals.
Adult male Wistar rats (210–339 g; Japan SLC) were anesthetized with urethane (1.2 g/kg) and prepared for acute electrophysiological recordings according to a previously described method (Nagayama et al., 2004). To record multiunit activity, an array consisting of three tetrodes was inserted into layers II and III of the APC. Electrode placement in the APC was guided by monitoring the field potential evoked by electrical stimulation of the lateral olfactory tract. To record the local field potential, twisted stainless steel electrodes were implanted into the granule cell layer of the olfactory bulb and layer III of the APC (0.0–2.2 mm anterior to the bregma, 2.8 mm lateral to the midline, lowered at an angle of 10° lateral from the vertical line). The positions of the electrode tips in layer III of the APC were determined by monitoring the configuration of olfactory bulb-evoked field potentials. To monitor neocortical EEG, a stainless screw was threaded into the bone above the occipital cortex. To monitor respiration pattern, a thermocouple was placed in the nasal vestibule, without touching the nasal mucosa. These signals were fed into the Cheetah recording system. After the recording session, small lesions were made by current injection.
Data analysis.
For off-line spike sorting and other analyses, we used Spike2 software (Cambridge Electronic Design) and the onboard script language. For spike sorting, we used template matching and principal component analysis methods. Event-correlation analysis, raster plots, and peri-SPW time histograms of spike discharges of APC neurons during the slow-wave sleep or slow-wave state were calculated at 10 ms bins.
The tendency of spike discharges to synchronize with the descending phase of OC-SPW was determined as significant when the firing frequency of at least one bin among those within −0.1 to 0.0 s from the time of nadir of OC-SPW exceeded mean + 5 SDs of background firing frequency (−0.3 to −0.2 s, 0.2–0.3 s). The correlation index was calculated by dividing the averaged counts around the nadir of OC-SPWs (±50 ms) by those of the backgrounds (−0.3 to −0.1 s, 0.1–0.3 s). Statistical analysis of significant differences was performed using the two-tailed unpaired t test.
Classification of behavioral states.
In rats under urethane anesthesia, the neocortical EEG spontaneously alternates between the fast-wave and slow-wave states (Murakami et al., 2005). The method to classify brain states in freely behaving rats has been described previously (Tsuno et al., 2008). We classified five different behavioral states in freely behaving animals: awake exploratory behavior state, grooming state, awake resting state, slow-wave sleep state, and rapid eye movement (REM) sleep state (see Fig. 1D). These states were determined off-line by a combination of visual inspection of animal behavior recorded by video, neocortical EEG, and hippocampal local field potential in 10 s epochs. Waking states were further divided into three different states, namely awake exploratory behavior state when the rats were actively moving, grooming state when the rats showed grooming behavior, and awake resting state when the rats were immobile. Sleep states were determined by a method modified from a previous report (Tsuno et al., 2008). The slow-wave sleep state was characterized by high slow and delta wave power (<4 Hz) of the neocortical EEG and irregular slow-waves of hippocampal local field potential. REM sleep state was characterized as a high theta wave power (5–12 Hz) of neocortical EEG and hippocampal local field potential. We confirmed in rats with neck muscle EMG recording that the REM sleep periods defined by the above method coincided with that defined by the traditional method (combination of neocortical EEG and neck muscle EMG) (Tsuno et al., 2008).
Figure 1.

OC-SPWs occur selectively during slow-wave sleep in freely behaving rats. A, C, Simultaneous recordings of local field potentials in layer III (APC-LFP) and multiunit spike activity (APC-units) of the APC during slow-wave sleep (A) and awake exploratory behavior (C). OC-SPWs are indicated by red arrows. B, Simultaneous recordings of ripples in layer II (top trace, asterisk) and OC-SPWs in layer III (bottom trace) of the APC. D, The frequency and amplitude of OC-SPWs (top two histograms), neocortical EEG pattern (cEEG; shown by a spectrogram), and behavioral states (bottom bar). The spectrogram of the neocortical EEG chronologically represents the intensity of power (shown by color, right inset) at each frequency. The x-axis indicates time (bin, 1 s), and the y-axis indicates frequency (bin, 0.1 Hz). In the bottom bar, different behavioral states are shown by distinct colors.
Identification of SPWs.
SPWs were characterized as large sharp negative potentials with a duration ranging from 90 to 173 ms that occurred relatively irregularly. To record SPWs of large amplitude, we typically adjusted the tip position of tetrodes in layer III of the APC. To qualify SPW potentials in the local field potential of each brain area, each local field potential was downsampled to 100 Hz and bandpass filtered at 2–20 Hz. Mean and SD of local field potential amplitude were calculated. The threshold for SPW detection was set to 4 SDs above the mean in anesthetized rats and to 5 SDs in freely behaving rats. We then selected those SPWs that had a duration <200 ms. For event-correlation calculations, the time of the nadir of each SPW was measured.
Current source density analysis of SPWs.
Depth profiles of OC-SPWs were recorded with a 16-channel silicon probe (16-channel linear probe with 100 μm spacing; NeuroNexus Technologies) in urethane-anesthetized rats. The probe was passed into the dorsal part of APC from the lateral surface (0.0–1.0 mm anterior to the bregma) (see Fig. 6A4) (Yoshida and Mori, 2007). To record the depth profiles of olfactory bulb SPWs, the silicon probe was passed into the olfactory bulb from the dorsal surface (7.0–8.0 mm anterior to the bregma) (see Fig. 7A4). Recording positions of the 16 electrodes in the OC and olfactory bulb were determined by monitoring potentials evoked by electrical stimulation of the olfactory bulb or the lateral olfactory tract, respectively. Each signal was preamplified (50×; Plexon) and amplified (50×), filtered (0.08–3,000 Hz; AB-611J and EW-610; Nihon Kohden), digitalized at 10 kHz, and stored. After the recording session, small lesions were induced by current injection (−5 μA for 3 s) for later histological examination of the recording site.
Figure 6.
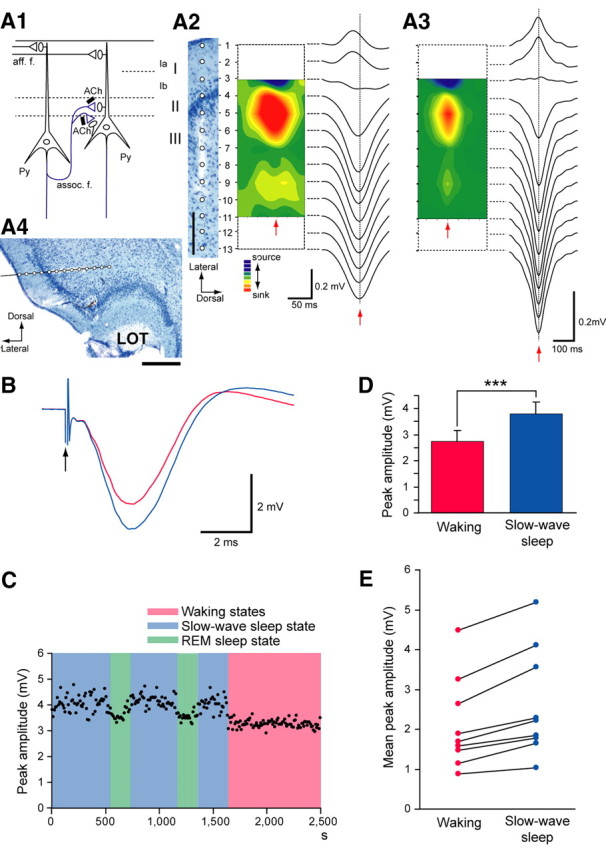
Association fiber excitatory synapses on APC neurons participate in the generation of OC-SPWs in a state-dependent manner. A1, Schematic diagram illustrating mitral cell axon excitatory synapses (aff. f.; black lines) and recurrent association fiber excitatory synapses (assoc. f.; blue lines) on pyramidal cells (Py) of the APC. Association fiber terminals are under the control of cholinergic presynaptic inhibition (black bars with ACh). A2, A3, Current source density analysis of an individual OC-SPW (middle graph) (A2) and averaged OC-SPWs (A3) in a rat under urethane anesthesia. Positions of electrodes (open circles) in layers of the APC are shown on the Nissl-stained section (left; scale bar, 200 μm). The depth profile of an OC-SPW potential and averaged OC-SPW potentials are shown at right of each. Pseudo-color representation of current sink (red) and current source (blue) is shown in the middle. Red arrows indicate the nadir of the OC-SPW. A4, The arrangement of a 16-channel silicon probe electrode in the APC. The electrode was shown as a black bar. White circles indicate recording points. A Nissl-stained coronal section is shown. Scale bar, 500 μm. LOT, Lateral olfactory tract. B–E, Behavioral state-dependent modulation of association fiber-evoked field potentials in freely behaving rats. B, Averaged waveform of association fiber-evoked local field potentials recorded in layer III of the APC during waking states (red) and during the slow-wave sleep state (blue). The arrow indicates the time of association fiber stimulation. C, Chronological plot of the amplitude of association fiber-evoked field potentials. Blue, Slow-wave sleep state; pink, waking states; green, REM sleep state. D, E, Comparison of the amplitude of association fiber-evoked potentials in the APC during the waking (red) and slow-wave sleep states (blue) in a rat (D) and in each of nine different rats (E). Error bars in D indicate SD. ***p < 0.0001. Note that peak amplitude of the association fiber-evoked potentials was significantly larger during the slow-wave sleep state than during waking states in all rats (1.25 ± 0.10 times larger, mean ± SD; p < 0.0001, two-tailed unpaired t test).
Figure 7.

OC-SPWs drive synchronized top-down synaptic inputs to granule cells in the olfactory bulb. A1, Schematic diagram illustrating top-down centrifugal fiber inputs (blue lines) to granule cells in the granule cell layer (GCL) of the olfactory bulb. Both centrifugal fiber synapses on granule cells and granule-to-mitral dendrodendritic inhibitory synapses are under the control of cholinergic presynaptic inhibition (black bars with ACh). MC, Mitral cell; GC, granule cell; assoc. f., association fiber excitatory synapses. A2, A3, Current source density analysis of an individual olfactory bulb SPW (middle) (A2) and averaged olfactory bulb SPWs (A3) in a urethane-anesthetized rat. Positions of electrodes (open circles) in the layers of the olfactory bulb are shown on a Nissl-stained section (left; scale bar, 100 μm). Depth profile of an olfactory bulb SPW potential and averaged olfactory bulb SPW potentials are shown at right of each. Pseudo-color representation of current sink (red) and current source (blue) is shown in the middle. Red arrows indicate the nadir of the olfactory bulb SPW. GL, Glomerular layer; EPL, external plexiform layer; MCL, mitral cell layer; IPL, internal plexiform layer. A4, Arrangement of 16-channel silicon probe electrode in the olfactory bulb. The electrode was shown as a black bar. White circles indicate recording points. A Nissl-stained section is shown. Scale bar, 500 μm. B–E, Behavioral state-dependent modulation of top-down centrifugal fiber input to granule cells in the olfactory bulb in freely behaving rats. B, Averaged waveform of centrifugal fiber-evoked local field potentials recorded in the olfactory bulb during waking (red) and slow-wave sleep (blue) states. C, Chronological plot of the peak amplitude of centrifugal fiber-evoked potentials during waking (red box) and slow-wave sleep (blue box) states. Black dots show the peak amplitude of the response. D, E, Comparison of the averaged amplitude of centrifugal fiber-evoked potentials during the waking (red) and slow-wave sleep states (blue) in a rat (D) and in each of 11 different rats (E). Error bars in D indicate SD. ***p < 0.0001. Note that the peak amplitude of the centrifugal fiber-evoked potentials in the olfactory bulb was significantly larger during the slow-wave sleep state than during waking states in 9 of the 11 rats examined (1.23 ± 0.11 times larger, mean ± SD; p < 0.00001, two-tailed unpaired t test). Filled circles and solid line, Significant increase; filled triangles and dashed line, not significant.
Current source density maps were generated from depth profiles of OC-SPW or olfactory bulb SPW using previously described methods (Freeman and Nicholson, 1975). First, each local field potential was low-pass filtered at 20 Hz. Second, current source density was computed by the following formula to reduce high spatial-frequency noise:
where ϕ(r) was the local field potential at depth r and h was the sampling interval (100 μm). These data were linearly interpolated and plotted as pseudocolor images.
Electrical stimulation of layer III of the APC in freely behaving rats.
Rats were anesthetized with ketamine and medetomidine. To stimulate the association fibers and centrifugal fibers, we implanted a paired stainless steel electrode in layer III of the anterior part of the APC (2.2 mm anterior to the bregma, 2.8 mm lateral to the midline, lowered at an angle of 10° lateral to the vertical direction). The position of the tips of the stimulating electrodes was determined by monitoring the APC-evoked field potential in the olfactory bulb. To record association fiber-evoked potentials, we implanted stainless steel electrodes in layer III of the posterior part of the APC (0.0 mm anterior to the bregma, 2.8 mm lateral to the midline, lowered at an angle of 10° lateral to the vertical direction, 6.8 mm from the brain surface) and in the granule cell layer of the olfactory bulb (7.5 mm anterior to the bregma, 1.3 mm lateral to the midline, 2.0 mm from the brain surface). To monitor the neocortical EEG, a stainless screw was threaded into the bone covering the occipital cortex. All of these electrodes were fixed with dental acrylic and connected to an interface board (EIB-27; Neuralynx).
Animals were allowed to recover from surgery for 1 week before recording. During recording, rats were placed in the home cage (345 × 403 × 177 mm). Stimulation was performed once per 10 s, with stimulus intensity set to ∼90% of the current that evoked the maximal association fiber-evoked field potential in the olfactory bulb. No rats showed startle responses to stimulation in any of the behavioral states. The signals were amplified 2000 times, filtered (0.1–6000 Hz), and sampled at 15 kHz (Cheetah).
For statistical analysis of the mean peak amplitude of centrifugal fiber-evoked field potentials in the olfactory bulb and association fiber-evoked field potentials in the APC, 40 recordings were obtained during each of the slow-wave sleep states and waking states.
Induction of long-term potentiation in centrifugal fiber excitatory synapses to granule cells.
Rats were anesthetized with urethane. To stimulate centrifugal fibers, a paired stainless steel electrode was inserted into layer III of the anterior part of the APC (2.8 mm anterior to the bregma, 3.0 mm lateral to the midline). The position of the electrode tip was adjusted by monitoring centrifugal fiber-evoked field potentials in the olfactory bulb, which were recorded with a stainless steel electrode. To monitor the neocortical EEG, a stainless screw was threaded into the bone covering the occipital cortex. These signals were amplified, filtered (0.08–3000 Hz; AB-611J and EW-610), digitalized at 10 kHz, and stored in a computer. The test stimuli were delivered at 10 s intervals with stimulus intensity set to ∼90% of the current that evoked the maximal centrifugal fiber-evoked field potentials in the olfactory bulb. To mimic OC-SPWs, stimulation with five train volleys (at 50 Hz) was repeated 10 times at 1 Hz. Stimulus intensity was the same as that of the test stimuli. Because OC-SPWs occurred only during the slow-wave state, burst stimulation was performed only during the slow-wave state.
To compare the mean amplitude of the centrifugal fiber-evoked field potentials in the granule cell layer before and after burst stimulation, 20 successive recordings were averaged. Because the brain state alternates between the fast-wave and slow-wave state in urethane anesthesia, we compared these recordings in each state.
Histology.
After the experiments, the animals were deeply anesthetized with urethane and perfused first with PBS followed by 4% paraformaldehyde (PFA) in phosphate buffer (PB), pH 7.4. Brains were postfixed in 4% PFA in PB at 4°C. Coronal sections of the rat brain (50 μm thickness) were cut on a microtome, mounted on glass slides, and stained with cresyl violet. The position of electrode tracks was determined in reference to the atlas of Paxinos and Watson (1998).
Results
APC generates SPWs during slow-wave sleep in freely behaving rats
As a first step in examining the neuronal activity pattern in the olfactory cortex during slow-wave sleep, we recorded local field potentials and multiunit activity from layers II and III of the APC in freely behaving rats using chronically implanted tetrodes. During the slow-wave sleep state, local field potentials in layer III of the APC showed large irregular slow-wave activity (0.5–4 Hz) that resembled the large irregular slow-wave activity in the hippocampus (Buzsaki, 1989) and globally synchronized large slow-wave activity in the neocortex (Timofeev et al., 2001) (Figs. 1A, 2A,B). This irregular slow-wave activity in the APC occurred independently of respiration rhythms (data not shown). To examine whether the irregular slow-wave activity in the APC occurred in coordination with slow-wave activity in the neocortex, we analyzed the temporal correlation between them in the slow-wave sleep state. Whereas slow-wave activity in the hippocampus was partially coherent with that in the neocortex, slow-wave activity in the olfactory cortex showed little coherence with the neocortical slow-waves (Fig. 2C,D), suggesting that the slow-wave activity in APC occurs relatively independently of neocortical slow-waves.
Figure 2.

Low coherence of slow-wave activity between olfactory cortex and neocortex during slow-wave sleep in freely behaving rats. A, Local field potentials recorded in the APC and hippocampus (Hippo) and EEG recorded from neocortex (NC) during slow-wave sleep. B, Averaged normalized power spectrum of local field potentials in APC (blue) and Hippo (red) and neocortical EEG (green) during slow-wave sleep. C, Mean coherence of slow-wave activity (0.5–4 Hz; n = 5 rats) between APC and NC (blue, ±SD; light blue region) and between Hippo and NC (red, ±SD; pink region). D, Averaged coherence of slow-wave activity between APC and NC (APC-NC; blue bar) was significantly lower than that between Hippo and NC (Hippo-NC; red bar). ***p < 0.0001.
By adjusting the tip position of the recording electrodes in layer III of the APC, we were also able to record numerous transient sharp negative potentials (Fig. 1A, red arrows) during the slow-wave sleep state that in shape resembled hippocampal SPWs. The duration of individual OC-SPWs ranged from 90 to 173 ms (110 ± 30 ms, mean ± SD; n = 8395), and they were accompanied by ripple-like oscillatory activity (150–250 Hz) (Fig. 1B), which was recorded in the pyramidal cell layer (layer II) of the APC.
The occurrence of OC-SPWs was associated with synchronized spike discharges of APC neurons, as shown by multiunit recordings (Fig. 1A, APC-units). In sharp contrast, the APC of the same rat showed few OC-SPWs during awake exploratory behavior (Fig. 1C). Chronological analysis of OC-SPWs during sleep-wake cycles (Fig. 1D) indicated that they were absent during waking states but occurred repeatedly during sleep states, particularly during the slow-wave sleep state. However, OC-SPWs were suppressed during REM sleep (Fig. 1D). Synchronized discharges of APC neurons occurred repeatedly in association with OC-SPWs during slow-wave sleep only.
Figure 3 shows the averaged time course of OC-SPWs and the time window of the spike entrainment with OC-SPWs. The entrainment of spike discharges of APC neurons started near the onset of individual OC-SPWs and was maximal during the descending phase of OC-SPWs (Fig. 3A,B). In contrast, entrainment was reduced at the time of the nadir and the ascending phase of OC-SPW. Results from seven rats indicate that synchronous discharges of numerous APC neurons occur during a short interval that coincides with the descending phase of OC-SPWs.
Figure 3.

OC-SPWs are accompanied by synchronized spike discharges of APC neurons. A, Superimposed traces of multiunit spike activity (Units) and OC-SPWs recorded from the APC of a freely behaving rat. Ten traces were superimposed using the nadir of the OC-SPW for alignment. B, Averaged time course of OC-SPWs (top trace) and peri-OC-SPW time histogram of multiunit spike discharges of APC neurons (bottom histogram). Five hundred eighty-five traces of OC-SPWs and multiunit spike discharges were superimposed and averaged using the nadir of OC-SPW for alignment. C, Peri-SPW time histogram of four simultaneously recorded APC neurons. For neuron APC#1, the raster plot of spike discharges is shown above the peri-SPW time histogram. Each row represents spikes that occurred around one OC-SPW. The shaded time window represents the descending phase of aligned OC-SPWs.
During the slow-wave sleep state, a subset of hippocampal CA1 pyramidal cells repeatedly participates in hippocampal SPWs, whereas others rarely participate (Nadasdy et al., 1999). We also found that a specific subset of APC neurons repeatedly participated in OC-SPWs during the slow-wave sleep state, whereas other subsets rarely participated. Figure 3C shows the peri-OC-SPW time histograms of spike discharges of four simultaneously recorded APC neurons. Spike frequencies of neurons 1, 2, and 3, but not 4, were significantly higher during the descending phase of OC-SPWs compared with those outside of the OC-SPWs. This tendency of synchronization of spike discharges with the descending phase of OC-SPWs was observed in about 31% of APC neurons (44 of 141 units examined). OC-SPWs and SPW-associated discharges were recorded from a wide area of the APC (in seven rats), suggesting that neurons participating in the same OC-SPWs were dispersed across wide areas of the APC (data not shown).
Because a large population of pyramidal cells in the APC sends massive centrifugal fibers to granule cells in the olfactory bulb (Luskin and Price, 1983), synchronous discharges of numerous APC neurons associated with individual OC-SPWs should cause massive synchronous excitatory synaptic input to granule cells. In accordance with this hypothesis, simultaneous recordings of local field potentials in the APC and in the granule cell layer of the ipsilateral olfactory bulb showed that the olfactory bulb also showed SPW-like potentials in close temporal proximity with most OC-SPWs (Fig. 4A, arrows) during the slow-wave sleep state. Superimposition and averaging of many SPW-like potentials in the olfactory bulb showed that these SPWs had a duration of 120 ± 30 ms (mean ± SD; n = 1821) and resembled OC-SPWs. The event-correlation histogram between the nadir of olfactory bulb SPWs and that of OC-SPWs confirmed that olfactory bulb SPWs occurred in synchrony with OC-SPWs (Fig. 4B), suggesting that synchronous discharge of APC neurons during OC-SPWs causes strong and synchronized synaptic input to granule cells in the olfactory bulb.
Figure 4.

OC-SPWs occur in synchrony with olfactory bulb SPWs but relatively independently of hippocampal SPWs in freely behaving rats. A, Simultaneous recordings of local field potential in layer III of the APC (APC-LFP), local field potential in the granule cell layer of the olfactory bulb (Olfactory bulb LFP), and local field potential in the stratum radiatum of the CA1 region of the dorsal hippocampus (Hippo-LFP). Arrows indicate SPWs detected by computer program. B, Averaged time course of olfactory bulb SPWs (top trace) and the raster plot of nadir of olfactory bulb SPWs in reference to the nadir of OC-SPWs (middle traces). Only computer-detected SPWs were counted. An event-correlation histogram of olfactory bulb SPWs in reference to OC-SPWs is shown at the bottom. Time 0 indicates the time of nadir of OC-SPW (gray dashed line). C, Averaged time course of hippocampal SPWs (top trace) and the raster plot of the nadir of hippocampal SPWs in reference to the nadir of OC-SPWs (middle traces). Event-correlation histogram of hippocampal SPWs in reference to OC-SPWs is shown at the bottom. D, Correlation index (see Materials and Methods) between olfactory bulb SPWs and OC-SPWs (left) and hippocampal SPWs and OC-SPWs (right). Note that hippocampal SPWs occurred relatively independently of OC-SPWs (p = 0.00003, two-tailed paired t test; n = 7). ***p < 0.0001.
Does the generation of OC-SPWs depend on the generation of hippocampal SPWs? As an initial step to address this question, we simultaneously recorded local field potentials in the APC and the stratum radiatum of the CA1 region of the dorsal hippocampus in freely behaving animals and produced an event-correlation histogram between the nadir of OC-SPWs and that of hippocampal SPWs (Fig. 4C). In contrast to the strong correlation between olfactory bulb SPWs and OC-SPWs, hippocampal SPWs showed only a very faint correlation with OC-SPWs, indicating that OC-SPWs occur relatively independently of hippocampal SPWs (Fig. 4B-D) under our experimental condition.
OC-SPWs occur during the slow-wave state under urethane anesthesia
In urethane-anesthetized rats, the neocortical EEG shows periodic alternation between a slow-wave state and a fast-wave state (Detari et al., 1997; Balatoni and Detari, 2003; Murakami et al., 2005; Tsuno et al., 2008). The slow-wave state is characterized by high-amplitude, slow-wave oscillation and resembles the EEG pattern during slow-wave sleep. The fast-wave state corresponds to the shallower stage of anesthesia and resembles the EEG pattern during REM sleep (Destexhe et al., 1999; Friedberg et al., 1999; Gervasoni et al., 2004; Li et al., 2009).
To examine whether OC-SPWs occur in the anesthetized condition, we recorded local field potentials and multiunit activity from the APC. In the slow-wave state, local field potentials in layer III showed prominent slow-wave activity as reported previously (Wilson, 2010; Wilson and Yan, 2010) and sharp negative potentials (Fig. 5A, arrows) that resembled the OC-SPWs in freely behaving rats. OC-SPWs during the slow-wave state under urethane anesthesia had a longer duration (172 ± 73 ms, mean ± SD; n = 11,883) than those during slow-wave sleep in freely behaving rats. Like OC-SPWs in behaving rats, OC-SPWs under anesthesia accompanied synchronous discharges of APC neurons mostly in the descending phase (Fig. 5A,C) (n = 4 rats). Chronological analysis of the OC-SPWs showed that they occurred repeatedly during the slow-wave state but were absent during the fast-wave state (Fig. 5B). Thus, the APC in urethane-anesthetized rats generated OC-SPWs selectively during the slow-wave state.
Figure 5.

In urethane-anesthetized rats, OC-SPWs occur mostly during the slow-wave state. A, Simultaneous recordings of multiunit spike activity (APC-units 1 and APC-units 2), local field potential in layer III of the APC (APC-LFP), and local field potential in the granule cell layer of the olfactory bulb (Olfactory bulb LFP) during the slow-wave state under urethane anesthesia. OC-SPWs are shown by black arrows, and olfactory bulb SPWs are shown by gray arrows. B, Brain state-dependency of OC-SPW occurrence in a urethane-anesthetized rat. Frequency and amplitude of OC-SPWs (top two histograms), neocortical EEG pattern (cEEG; shown by a spectrogram), and brain state (bottom bar). The white bar represents the transitional state between the fast-wave state (red bar) and the slow-wave state (blue bar). The spectrogram of the cEEG chronologically represents the intensity of power at each frequency. The magnitude of the power at each frequency is shown by color (right inset). C, Entrainment of multiunit spike activity of APC neurons with OC-SPWs. The top trace indicates averaged OC-SPWs. Middle traces indicate raster representation of spike activity, whereas the bottom histogram shows peri-OC-SPW time histogram of spike activity of APC neurons. The vertical dashed line indicates the time of nadir of OC-SPWs (t = 0). Four hundred fifty-four traces of OC-SPWs were superimposed and averaged using the nadir of OC-SPWs for alignment. D, Gray trace indicates the averaged local field potentials in the granule cell layer of the olfactory bulb at the time of OC-SPW occurrence. The vertical dashed line indicates the time of nadir of individual OC-SPWs (black trace). Middle plots show the raster representation of the nadir of olfactory bulb SPWs with reference to that of OC-SPWs. The event-correlation histogram between OC-SPWs and olfactory bulb SPWs is shown at the bottom.
Figure 5D shows averaged OC-SPWs (black trace) and averaged local field potentials recorded under urethane anesthesia in the granule cell layer of the olfactory bulb (gray trace) at the time of OC-SPW occurrence. The alignment of averaged OC-SPWs and the averaged local field potentials in the granule cell layer clearly indicated that large SPW-like potentials occurred in the olfactory bulb at the time of OC-SPW occurrence. The event-correlation histogram also indicated the highly correlated occurrence of olfactory bulb SPWs and OC-SPWs (Fig. 5D, bottom histogram). The nadir of OC-SPWs tended to precede that of olfactory bulb SPWs by 5.1 ± 0.4 ms (mean ± SD; n = 4 rats). These results suggest that OC-SPWs cause synchronized top-down synaptic inputs to granule cells in the olfactory bulb during the slow-wave state in the urethane-anesthetized condition.
Recurrent association fiber synapses to olfactory cortex pyramidal cells participate in the generation of olfactory cortex SPWs
Pyramidal cells in the APC give rise to numerous recurrent axon collaterals (association fibers) that form excitatory synaptic connections on dendritic spines of pyramidal cells in layers Ib, II, and III (Fig. 6A1, assoc. f.) of the APC (Haberly and Presto, 1986; Neville and Haberly, 2004). In addition, pyramidal cells receive excitatory synaptic input from mitral cell axons (Fig. 6A1, aff. f.) in layer Ia. To determine whether mitral cell afferent excitatory synapses or recurrent association fiber excitatory synapses participate in the generation of OC-SPWs, we recorded the depth profiles of OC-SPWs using 16-channnel electrodes and made a current source density analysis of OC-SPWs under urethane-anesthetized rats. Figure 6A2 shows, from right to left, the depth profile (right traces), the current source density map (center graph) of an OC-SPW, and an array of recording sites (left, circles in the Nissl-stained section). The depth profile and current source density map of averaged OC-SPWs (n = 257 SPWs) recorded by these electrodes in a rat are shown in Figure 6A3.
OC-SPWs generated a large current sink in layer II and an adjacent superficial part of layer III, and a smaller current sink in the deep part of layer III of the APC, whereas they generated current source in layer I. This spatial arrangement was observed in all the OC-SPWs examined (n = 1171 OC-SPWs in three rats; in each rat, the OC-SPWs were recorded from a dorsal part of the APC) suggesting that OC-SPW potentials are generated by pyramidal cells that extend dendrites from layer III to layer I. The current sink in layers II and III suggests that the generation of OC-SPWs involved recurrent association fiber excitatory synapses on pyramidal cell dendrites in the APC but not mitral cell afferent excitatory synapses. Additional experiments such as using two-photon imaging of pyramidal cells may provide additional knowledge of neuronal circuit mechanisms for OC-SPW generation.
Given the participation of the association fibers in the OC-SPWs, we next examined candidate mechanisms for the state dependency of OC-SPW occurrence. In the APC, high levels of acetylcholine partially and presynaptically suppress recurrent association fiber excitatory synapses on pyramidal cells during waking states (Fig. 6A1, black bars with ACh) (Hasselmo and Bower, 1992), but not mitral cell afferent excitatory synapses. In the slow-wave sleep state, in contrast, low levels of acetylcholine decrease the cholinergic presynaptic suppression of recurrent association fiber excitatory synapses on pyramidal cells.
To examine whether the recurrent association fiber excitatory synapses undergo state-dependent modulation, we recorded association fiber-induced local field potentials in layer III of the posterior part of the APC after stimulation of layer III of the anterior part of the APC during waking states and slow-wave sleep state in freely behaving rats (Fig. 6B–D). The amplitude of the association fiber-induced local field potential changed in association with the change in brain state (Fig. 6B,C) and was an average of 1.3 times larger during the slow-wave sleep state than waking states (Fig. 6D,E). This brain state-dependent change in the association fiber-induced local field potential was observed in all nine rats examined (Fig. 6E), suggesting that the recurrent association fiber excitatory synapses were partially suppressed during waking but not during the slow-wave sleep state.
OC-SPWs cause synchronized top-down inputs to granule cells in the olfactory bulb
The numerous centrifugal fibers from APC pyramidal cells to the olfactory bulb form excitatory synaptic terminals on proximal and basal dendrites of granule cells in the granule cell layer (Luskin and Price, 1983), suggesting that synchronous top-down inputs associated with OC-SPWs cause synchronous synaptic depolarization of granule cell dendrites in this layer (Fig. 7A1). To examine this possibility, we conducted a current source density analysis of the olfactory bulb SPWs. Figure 7A2 shows the depth profile and current source density analysis of an olfactory bulb SPW recorded by 16-channel electrodes arranged in a ventral part of the olfactory bulb of a urethane-anesthetized rat. The depth profile and current source density analysis of averaged olfactory bulb SPWs (n = 518 SPWs) recorded by these electrodes in a rat are shown in Figure 7A3. Olfactory bulb SPWs generated a large current sink in the granule cell layer and a current source in the external plexiform layer, and this spatial arrangement was observed in all the olfactory bulb SPWs (n = 1408 olfactory bulb SPWs recorded from a dorsal part of the olfactory bulb in one rat and from a ventral part in two rats), suggesting that olfactory bulb SPWs are generated by synchronous depolarization of proximal and basal dendrites of granule cells (Rall and Shepherd, 1968).
To examine whether the top-down centrifugal fiber excitatory synapses on granule cells undergo state-dependent modulation in freely behaving animals, we recorded centrifugal fiber-induced local field potentials in the granule cell layer of the olfactory bulb after stimulation of layer III of the APC. In 9 of the 11 rats examined, centrifugal fiber-induced potentials in the granule cell layer were partially suppressed during waking states compared with those during the slow-wave sleep state (Fig. 7B–E). To examine whether the synchronized top-down inputs cause plastic changes in the centrifugal fiber excitatory synapses to granule cells, we recorded the effect of burst stimulation of layer III of the APC on the centrifugal fiber-induced local field potential response in granule cell layer of the olfactory bulb in urethane-anesthetized rats. A train of 10 burst stimulations of the centrifugal fibers (at 1 Hz) caused long-term potentiation of centrifugal fiber-induced response (Fig. 8), indicating the plastic nature of the centrifugal fiber excitatory synapses to granule cells as shown in slice preparations (Gao and Strowbridge, 2009; Nissant et al., 2009).
Figure 8.

Burst stimulation of centrifugal fibers induces long-term potentiation of top-down synapses to granule cells in urethane-anesthetized rats. A, Protocol for burst stimulation. Each burst stimulation consisted of five volleys at a 20 ms interval. Burst stimulation was applied to layer III of the APC at a rate once per second for 10 s. B, The top graph shows a chronological plot of the amplitude of centrifugal fiber-evoked field potentials in the granule cell layer of the olfactory bulb before and after burst stimulation (arrow with a vertical dashed line). The horizontal dashed lines indicate the mean amplitude of centrifugal fiber-evoked field potentials before burst stimulation during the fast-wave (red line) and slow-wave (blue line) states. Burst stimulation was delivered at time 0. The bottom graph shows the same plot at a prolonged time scale. C, Averaged traces of centrifugal fiber-evoked field potentials during the fast-wave state before (dashed line) and after (solid line) burst stimulation (red trace, 15–18 min after the stimulation; pink trace, 90–93 min after the stimulation; orange trace, 160–163 min after the stimulation). Peak amplitude of centrifugal fiber-evoked field potential after burst stimulation was significantly higher than that before burst stimulation. D, Averaged traces of centrifugal fiber-evoked field potentials during the slow-wave state before (dashed line) and after (solid line) burst stimulation (dark blue trace, 30–33 min after the stimulation; light blue trace, 110–113 min after the stimulation; blue-green trace, 180–183 min after the stimulation). Peak amplitude of centrifugal fiber-evoked field potentials after burst stimulation was significantly higher than that before burst stimulation. ***p < 0.0001 (all groups compared two by two using the unpaired t test). Long-lasting potentiation of at least 50 min duration was observed in all rats examined (n = 5).
Discussion
Olfactory cortex generates SPWs independently of hippocampal SPWs
The present results indicate that during slow-wave sleep in freely behaving rats, the APC shows irregular slow-wave activity and generates SPWs. The OC-SPWs occurred relatively independently of hippocampal SPWs under our experimental conditions. Hippocampal SPWs are self-organized endogenous events generated during the sleep and rest periods by synchronous synaptic depolarization of CA1 pyramidal cell dendrites caused by the synchronous burst discharges of CA3 pyramidal cells (Csicsvari et al., 2000). The initial generator of these hippocampal SPW events is thought to be massive recurrent collateral excitatory synaptic connections among CA3 pyramidal cells (Buzsaki, 1989).
The present results also suggest that OC-SPWs are self-organized events that occur during slow-wave sleep, a period during which the olfactory cortex is functionally isolated from the external odor world (Murakami et al., 2005). Synchronous spike discharges of olfactory cortex neurons occur spontaneously in isolated slice preparations of piriform cortex (Sanchez-Vives et al., 2008), indicating that isolated piriform cortex can self-organize synchronized spike activity. Current source density analysis suggested that OC-SPWs were generated by synchronous synaptic depolarization of pyramidal cell dendrites in layers II and III of the APC caused by the synchronized discharges of APC neurons (Fig. 6).
The location of the initial generator of OC-SPWs is not precisely known, but strong candidates are pyramidal cells in the ventrorostral subdivision of the APC (APCvr) and neurons in the pre-endopiriform nucleus immediately deep to the APCvr (Piredda and Gale, 1985; Ekstrand et al., 2001). These neurons have specific features that suggest heightened excitability, including a near-absence of GABAergic cartridge endings on axon initial segments (Ekstrand et al., 2001). These areas correspond in location to the “area tempestas,” in which very low doses of convulsants can initiate tonic–clonic seizures (Piredda and Gale, 1985), indicating that an abnormal excess of the heightened excitability of these neurons may lead to epileptic activity. Because neurons in the APC and pre-endopiriform nucleus have heavy, spatially distributed projections within and outside the APC (Luskin and Price, 1983; Behan and Haberly, 1999; Neville and Haberly, 2004), we speculate that self-organized activity might initially occur in the APCvr and pre-endopiriform nucleus and then spread throughout the APC and other areas during slow-wave sleep. Additional experiments are necessary to precisely locate the initiator of OC-SPWs.
Information processing mode in the piriform cortex during slow-wave sleep
During waking periods (Fig. 9A), the recurrent association fiber synaptic inputs to pyramidal cells are partially reduced (Fig. 6), presumably by cholinergic presynaptic inhibition attributable to high cholinergic tone (Fig. 9A, filled bars) (Hasselmo and Bower, 1992). The reduced recurrent association inputs may by themselves be ineffective in activating pyramidal cells. During behavioral arousal, APC shows large gamma frequency oscillations that are induced by mitral cell afferent fiber inputs and recurrent association fiber inputs (Freeman, 1960; Neville and Haberly, 2004). This suggests that the simultaneous occurrence of mitral cell afferent synaptic inputs and recurrent association fiber synaptic inputs to individual pyramidal cells is essential to the generation of their spike outputs during waking states.
Figure 9.

Schematic diagrams illustrating the direction of information flows during waking states and the slow-wave sleep state. A, During waking states, information about the external odor world is effectively transmitted via afferent fibers (aff. f) of mitral cells (MC) in the olfactory bulb (OB) to pyramidal cells (Py) in the olfactory cortex (OC) and then to high-order areas. A characteristic field potential in the OC during behavioral arousal is afferent fiber-induced gamma frequency oscillation (50–100 Hz) (Freeman, 1960; Neville and Haberly, 2004). Synaptic inputs of recurrent association fibers (assoc.f) to pyramidal cells are reduced by cholinergic presynaptic inhibition (black bars on association fiber terminals). B, During the slow-wave sleep state, afferent fiber inputs to the olfactory cortex are blocked by behavioral state-dependent sensory gating, and OC shows large irregular slow waves and SPWs. Cholinergic presynaptic inhibition of recurrent collateral synaptic inputs is diminished, and internally generated synchronized spike discharges of OC neurons associated with OC-SPWs (thick blue arrows) travel to granule cells in the olfactory bulb and to high-order areas such as the orbitofrontal cortex and amygdala. aff. f, Afferent fibers; MC, mitral cells; OB, olfactory bulb; Py, pyramidal cells.
During slow-wave sleep periods (Fig. 9B), however, the mitral cell afferent inputs are essentially shut off from pyramidal cells by behavioral state-dependent sensory gating (Murakami et al., 2005). In contrast, the recurrent association fiber synaptic inputs to pyramidal cells are enhanced (Fig. 6), presumably because of the relaxation of cholinergic presynaptic inhibition. Because the enhanced recurrent association fiber synaptic inputs to pyramidal cells participate in the generation of OC-SPWs (Fig. 6), initiation of the synchronized spike activity of a small subset of APC neurons may lead to the synchronized synaptic depolarization of a much larger number of neurons across whole regions of the APC. In this way, the APC may centrally generate the OC-SPWs and synchronized spike discharges of specific subsets of APC neurons during slow-wave sleep (Fig. 9B).
What is the functional role of OC-SPWs that occur selectively during slow-wave sleep? The APC has been implicated in olfactory association learning (Staubli et al., 1986; Barkai et al., 1994; Thanos and Slotnick, 1997; Wilson and Stevenson, 2003). It has been suggested that olfactory learning during waking deposits olfactory memory traces by strengthening activated recurrent association fiber excitatory synapses to pyramidal cells (Fig. 9A, blue synapses in the olfactory cortex) and that the matching of mitral cell afferent input pattern with the previously changed recurrent association fiber connectivity pattern underlies the recall of olfactory memory (Neville and Haberly, 2004). In addition, it has been shown recently in anesthetized rats that the piriform cortical activity during slow-wave state is shaped by recent odor experience (Wilson, 2010). Because the recurrent association fiber synapses participate in the generation of OC-SPWs during slow-wave sleep (Fig. 6), one fascinating hypothesis is that OC-SPWs represent the replay of memory traces that are stored in the recurrent association fiber synapses during preceding waking periods. Consistent with this hypothesis, the frequency of OC-SPWs during postprandial sleep was about two times higher than that during sleep without preceding eating (I. Kusumoto-Yoshida, H. Manabe, and K. Mori, unpublished observation). We are currently examining the possibility of replay by comparing the activity pattern of individual neurons in the APC during slow-wave sleep with the response pattern of the same neurons to olfactory sensory inputs during preceding waking periods.
It has been suggested that labile memory traces are formed in the hippocampus among recurrent collateral synapses during awake exploratory behavior, whereas SPW-associated packaged replays of the memory during postbehavioral sleep facilitate memory consolidation and synaptic reorganization (Buzsaki, 1989; Lee and Wilson, 2002). By analogy, we speculate that the repetition of heightened synchronized activity of specific subsets of olfactory cortex neurons during slow-wave sleep facilitates the conversion of short-term synaptic plasticity that occurred in the recurrent association fiber synapses during preceding waking periods into long-lasting plasticity, and thereby contributes to the memory consolidation process in the olfactory cortex. Because the olfactory cortex is only two synapses away from the olfactory sensory neurons and has a relatively simple cortical structure, it represents an excellent model system with which to understand the cellular and molecular bases of memory trace formation during olfaction-related learning and the consolidation of olfactory memory traces during subsequent sleep.
Synchronized top-down inputs to granule cells during slow-wave sleep might trigger neuronal mechanisms for reorganization of neuronal circuits in the olfactory bulb
A number of olfactory cortex areas project centrifugal fibers to granule cells in the olfactory bulb (Luskin and Price, 1983). Although top-down projection from the olfactory cortex to the olfactory bulb is reported to be much heavier than bulbo-cortical afferent projection (Neville and Haberly, 2004), the functional role of the top-down projection is not known.
In this study, we showed that burst stimulation of the centrifugal fibers induced long-lasting potentiation of the top-down synapses on granule cells (Fig. 8). This result raises the possibility that synchronous top-down input from many olfactory cortex neurons may cause strong depolarization of granule cell dendrites and thus trigger plastic changes in the top-down synapses.
Granule cells in the olfactory bulb are continually generated in the subventricular zone of the lateral ventricle even in adulthood and migrate through the rostral migratory stream to the olfactory bulb (Nissant et al., 2009). The newly generated granule cells are either incorporated into the neuronal circuit of the olfactory bulb or eliminated by apoptosis in a sensory experience-dependent manner (Lledo et al., 2006).
The present results suggest that OC-SPWs repeatedly drive synchronized synaptic inputs to granule cells via top-down projection during the slow-wave sleep state. The top-down centrifugal fiber synaptic inputs to granule cells are enhanced during slow-wave sleep (Fig. 7). In addition, OC-SPWs occur at a twofold higher frequency during slow-wave sleep with preceding eating behavior than during sleep without preceding eating (Kusumoto-Yoshida, Manabe, and Mori, unpublished observation). These results raise the possibility that the synchronized top-down inputs during slow-wave sleep might provide signals for reorganization of the neuronal circuits of the olfactory bulb. We recently found that postprandial sleep promotes sensory experience-dependent elimination of a specific subset of adult-born granule cells in the olfactory bulb (Yokoyama, Mochimaru, Murata, Manabe, Kobayakawa, Sakano, Mori, and Yamaguchi, unpublished observation). Granule-to-mitral dendrodendritic inhibitory synaptic transmission (Shepherd et al., 2004) is also enhanced during slow-wave sleep (Tsuno et al., 2008) and after the potentiation of the top-down synapses (Gao and Strowbridge, 2009). Based on these observations, we speculate that the synchronized top-down synaptic input to adult-born granule cells might influence reorganization of the granule-to-mitral synapses.
Although the question of whether OC-SPWs represent a replay of memory traces is not well understood, we speculate that one functional role of top-down projection is to repeatedly provide the packaged signal of cortical representations of olfactory memory during slow-wave sleep. The synchronized top-down inputs during the slow-wave sleep period might collate the memory traces stored in the olfactory cortex with those stored in the olfactory bulb to reorganize the bulbar neuronal circuits during post-task slow-wave sleep.
Footnotes
This work was supported by a Grant-in-Aid for Scientific Research on Priority Areas from the Ministry of Education, Culture, Sports, Science, and Technology (MEXT), Japan; a Grant-in-Aid for Scientific Research (S) from Japan Society for the Promotion of Science (K.M.); and a Grant-in-Aid for Young Scientists (B) from MEXT (H.M.). We thank Drs Y. Yoshihara and M. Yamaguchi for critical comments on this manuscript, the members of the Department of Physiology at the University of Tokyo for valuable discussions and comments, and Drs M. Murakami and Y. Sakurai for technical advice.
The authors declare no competing financial interests.
References
- Amaral DG, Witter MP. The three-dimensional organization of the hippocampal formation: a review of anatomical data. Neuroscience. 1989;31:571–591. doi: 10.1016/0306-4522(89)90424-7. [DOI] [PubMed] [Google Scholar]
- Balatoni B, Detari L. EEG related neuronal activity in the pedunculopontine tegmental nucleus of urethane anaesthetized rats. Brain Res. 2003;959:304–311. doi: 10.1016/s0006-8993(02)03768-x. [DOI] [PubMed] [Google Scholar]
- Barkai E, Bergman RE, Horwitz G, Hasselmo ME. Modulation of associative memory function in a biophysical simulation of rat piriform cortex. J Neurophysiol. 1994;72:659–677. doi: 10.1152/jn.1994.72.2.659. [DOI] [PubMed] [Google Scholar]
- Behan M, Haberly LB. Intrinsic and efferent connections of the endopiriform nucleus in rat. J Comp Neurol. 1999;408:532–548. [PubMed] [Google Scholar]
- Buzsaki G. Hippocampal sharp waves: their origin and significance. Brain Res. 1986;398:242–252. doi: 10.1016/0006-8993(86)91483-6. [DOI] [PubMed] [Google Scholar]
- Buzsaki G. Two-stage model of memory trace formation: a role for “noisy” brain states. Neuroscience. 1989;31:551–570. doi: 10.1016/0306-4522(89)90423-5. [DOI] [PubMed] [Google Scholar]
- Chen S, Murakami K, Oda S, Kishi K. Quantitative analysis of axon collaterals of single cells in layer III of the piriform cortex of the guinea pig. J Comp Neurol. 2003;465:455–465. doi: 10.1002/cne.10844. [DOI] [PubMed] [Google Scholar]
- Csicsvari J, Hirase H, Mamiya A, Buzsaki G. Ensemble patterns of hippocampal CA3-CA1 neurons during sharp wave-associated population events. Neuron. 2000;28:585–594. doi: 10.1016/s0896-6273(00)00135-5. [DOI] [PubMed] [Google Scholar]
- Destexhe A, Contreras D, Steriade M. Spatiotemporal analysis of local field potentials and unit discharges in cat cerebral cortex during natural wake and sleep states. J Neurosci. 1999;19:4595–4608. doi: 10.1523/JNEUROSCI.19-11-04595.1999. [DOI] [PMC free article] [PubMed] [Google Scholar]
- Detari L, Semba K, Rasmusson DD. Responses of cortical EEG-related basal forebrain neurons to brainstem and sensory stimulation in urethane-anaesthetized rats. Eur J Neurosci. 1997;9:1153–1161. doi: 10.1111/j.1460-9568.1997.tb01469.x. [DOI] [PubMed] [Google Scholar]
- Ekstrand JJ, Domroese ME, Johnson DM, Feig SL, Knodel SM, Behan M, Haberly LB. A new subdivision of anterior piriform cortex and associated deep nucleus with novel features of interest for olfaction and epilepsy. J Comp Neurol. 2001;434:289–307. doi: 10.1002/cne.1178. [DOI] [PubMed] [Google Scholar]
- Foster DJ, Wilson MA. Reverse replay of behavioural sequences in hippocampal place cells during the awake state. Nature. 2006;440:680–683. doi: 10.1038/nature04587. [DOI] [PubMed] [Google Scholar]
- Freeman JA, Nicholson C. Experimental optimization of current source-density technique for anuran cerebellum. J Neurophysiol. 1975;38:369–382. doi: 10.1152/jn.1975.38.2.369. [DOI] [PubMed] [Google Scholar]
- Freeman WJ. Correlation of electrical activity of prepyriform cortex and behavior in cat. J Neurophysiol. 1960;23:111–131. doi: 10.1152/jn.1960.23.2.111. [DOI] [PubMed] [Google Scholar]
- Friedberg MH, Lee SM, Ebner FF. Modulation of receptive field properties of thalamic somatosensory neurons by the depth of anesthesia. J Neurophysiol. 1999;81:2243–2252. doi: 10.1152/jn.1999.81.5.2243. [DOI] [PubMed] [Google Scholar]
- Gao Y, Strowbridge BW. Long-term plasticity of excitatory inputs to granule cells in the rat olfactory bulb. Nat Neurosci. 2009;12:731–733. doi: 10.1038/nn.2319. [DOI] [PMC free article] [PubMed] [Google Scholar]
- Gervasoni D, Lin SC, Ribeiro S, Soares ES, Pantoja J, Nicolelis MA. Global forebrain dynamics predict rat behavioral states and their transitions. J Neurosci. 2004;24:11137–11147. doi: 10.1523/JNEUROSCI.3524-04.2004. [DOI] [PMC free article] [PubMed] [Google Scholar]
- Haberly LB, Presto S. Ultrastructural analysis of synaptic relationships of intracellularly stained pyramidal cell axons in piriform cortex. J Comp Neurol. 1986;248:464–474. doi: 10.1002/cne.902480403. [DOI] [PubMed] [Google Scholar]
- Hasselmo ME. Neuromodulation: acetylcholine and memory consolidation. Trends Cogn Sci. 1999;3:351–359. doi: 10.1016/s1364-6613(99)01365-0. [DOI] [PubMed] [Google Scholar]
- Hasselmo ME, Bower JM. Cholinergic suppression specific to intrinsic not afferent fiber synapses in rat piriform (olfactory) cortex. J Neurophysiol. 1992;67:1222–1229. doi: 10.1152/jn.1992.67.5.1222. [DOI] [PubMed] [Google Scholar]
- Johnson DM, Illig KR, Behan M, Haberly LB. New features of connectivity in piriform cortex visualized by intracellular injection of pyramidal cells suggest that “primary” olfactory cortex functions like “association” cortex in other sensory systems. J Neurosci. 2000;20:6974–6982. doi: 10.1523/JNEUROSCI.20-18-06974.2000. [DOI] [PMC free article] [PubMed] [Google Scholar]
- Lee AK, Wilson MA. Memory of sequential experience in the hippocampus during slow wave sleep. Neuron. 2002;36:1183–1194. doi: 10.1016/s0896-6273(02)01096-6. [DOI] [PubMed] [Google Scholar]
- Li CY, Poo MM, Dan Y. Burst spiking of a single cortical neuron modifies global brain state. Science. 2009;324:643–646. doi: 10.1126/science.1169957. [DOI] [PMC free article] [PubMed] [Google Scholar]
- Lledo PM, Alonso M, Grubb MS. Adult neurogenesis and functional plasticity in neuronal circuits. Nat Rev Neurosci. 2006;7:179–193. doi: 10.1038/nrn1867. [DOI] [PubMed] [Google Scholar]
- Luskin MB, Price JL. The topographic organization of associational fibers of the olfactory system in the rat, including centrifugal fibers to the olfactory bulb. J Comp Neurol. 1983;216:264–291. doi: 10.1002/cne.902160305. [DOI] [PubMed] [Google Scholar]
- Murakami M, Kashiwadani H, Kirino Y, Mori K. State-dependent sensory gating in olfactory cortex. Neuron. 2005;46:285–296. doi: 10.1016/j.neuron.2005.02.025. [DOI] [PubMed] [Google Scholar]
- Nadasdy Z, Hirase H, Czurko A, Csicsvari J, Buzsaki G. Replay and time compression of recurring spike sequences in the hippocampus. J Neurosci. 1999;19:9497–9507. doi: 10.1523/JNEUROSCI.19-21-09497.1999. [DOI] [PMC free article] [PubMed] [Google Scholar]
- Nagayama S, Takahashi YK, Yoshihara Y, Mori K. Mitral and tufted cells differ in the decoding manner of odor maps in the rat olfactory bulb. J Neurophysiol. 2004;91:2532–2540. doi: 10.1152/jn.01266.2003. [DOI] [PubMed] [Google Scholar]
- Neville KR, Haberly LB. Olfactory cortex. In: Shepherd G, editor. The synaptic organization of the brain. Ed 5. New York: Oxford UP; 2004. pp. 415–454. [Google Scholar]
- Nissant A, Bardy C, Katagiri H, Murray K, Lledo PM. Adult neurogenesis promotes synaptic plasticity in the olfactory bulb. Nat Neurosci. 2009;12:728–730. doi: 10.1038/nn.2298. [DOI] [PubMed] [Google Scholar]
- Paxinos G, Watson C. The rat brains in stereotaxic coordinations. Ed 4. San Diego: Academic; 1998. [Google Scholar]
- Piredda S, Gale K. A crucial epileptogenic site in the deep prepiriform cortex. Nature. 1985;317:623–625. doi: 10.1038/317623a0. [DOI] [PubMed] [Google Scholar]
- Rall W, Shepherd GM. Theoretical reconstruction of field potentials and dendrodendritic synaptic interactions in olfactory bulb. J Neurophysiol. 1968;31:884–915. doi: 10.1152/jn.1968.31.6.884. [DOI] [PubMed] [Google Scholar]
- Sanchez-Vives MV, Descalzo VF, Reig R, Figueroa NA, Compte A, Gallego R. Rhythmic spontaneous activity in the piriform cortex. Cereb Cortex. 2008;18:1179–1192. doi: 10.1093/cercor/bhm152. [DOI] [PubMed] [Google Scholar]
- Shepherd GM, Chen WR, Greer CA. Olfactory bulb. In: Shepherd G, editor. The synaptic organization of the brain. New York: Oxford UP; 2004. pp. 165–216. [Google Scholar]
- Staubli U, Fraser D, Kessler M, Lynch G. Studies on retrograde and anterograde amnesia of olfactory memory after denervation of the hippocampus by entorhinal cortex lesions. Behav Neural Biol. 1986;46:432–444. doi: 10.1016/s0163-1047(86)90464-4. [DOI] [PubMed] [Google Scholar]
- Steriade M. Impact of network activities on neuronal properties in corticothalamic systems. J Neurophysiol. 2001;86:1–39. doi: 10.1152/jn.2001.86.1.1. [DOI] [PubMed] [Google Scholar]
- Thanos PK, Slotnick BM. Short-term odor memory: effects of posterior transection of the lateral olfactory tract in the rat. Physiol Behav. 1997;61:903–906. doi: 10.1016/s0031-9384(97)00003-6. [DOI] [PubMed] [Google Scholar]
- Timofeev I, Grenier F, Steriade M. Disfacilitation and active inhibition in the neocortex during the natural sleep-wake cycle: an intracellular study. Proc Natl Acad Sci U S A. 2001;98:1924–1929. doi: 10.1073/pnas.041430398. [DOI] [PMC free article] [PubMed] [Google Scholar]
- Tsuno Y, Kashiwadani H, Mori K. Behavioral state regulation of dendrodendritic synaptic inhibition in the olfactory bulb. J Neurosci. 2008;28:9227–9238. doi: 10.1523/JNEUROSCI.1576-08.2008. [DOI] [PMC free article] [PubMed] [Google Scholar]
- Wilson DA. Single-unit activity in piriform cortex during slow-wave state is shaped by recent odor experience. J Neurosci. 2010;30:1760–1765. doi: 10.1523/JNEUROSCI.5636-09.2010. [DOI] [PMC free article] [PubMed] [Google Scholar]
- Wilson DA, Stevenson RJ. Olfactory perceptual learning: the critical role of memory in odor discrimination. Neurosci Biobehav Rev. 2003;27:307–328. doi: 10.1016/s0149-7634(03)00050-2. [DOI] [PubMed] [Google Scholar]
- Wilson DA, Yan X. Sleep-like states modulate functional connectivity in the rat olfactory system. J Neurophysiol. 2010;104:3231–3239. doi: 10.1152/jn.00711.2010. [DOI] [PMC free article] [PubMed] [Google Scholar]
- Wilson MA, McNaughton BL. Reactivation of hippocampal ensemble memories during sleep. Science. 1994;265:676–679. doi: 10.1126/science.8036517. [DOI] [PubMed] [Google Scholar]
- Yoshida I, Mori K. Odorant category profile selectivity of olfactory cortex neurons. J Neurosci. 2007;27:9105–9114. doi: 10.1523/JNEUROSCI.2720-07.2007. [DOI] [PMC free article] [PubMed] [Google Scholar]